
Wood Waste Management from the Furniture Industry: The Environmental Performances of Recycling, Energy Recovery, and Landfill Treatments

 ,
,
Abstract
:1. Introduction
2. Theoretical Background
3. Materials and Methods
3.1. Defining the Scope
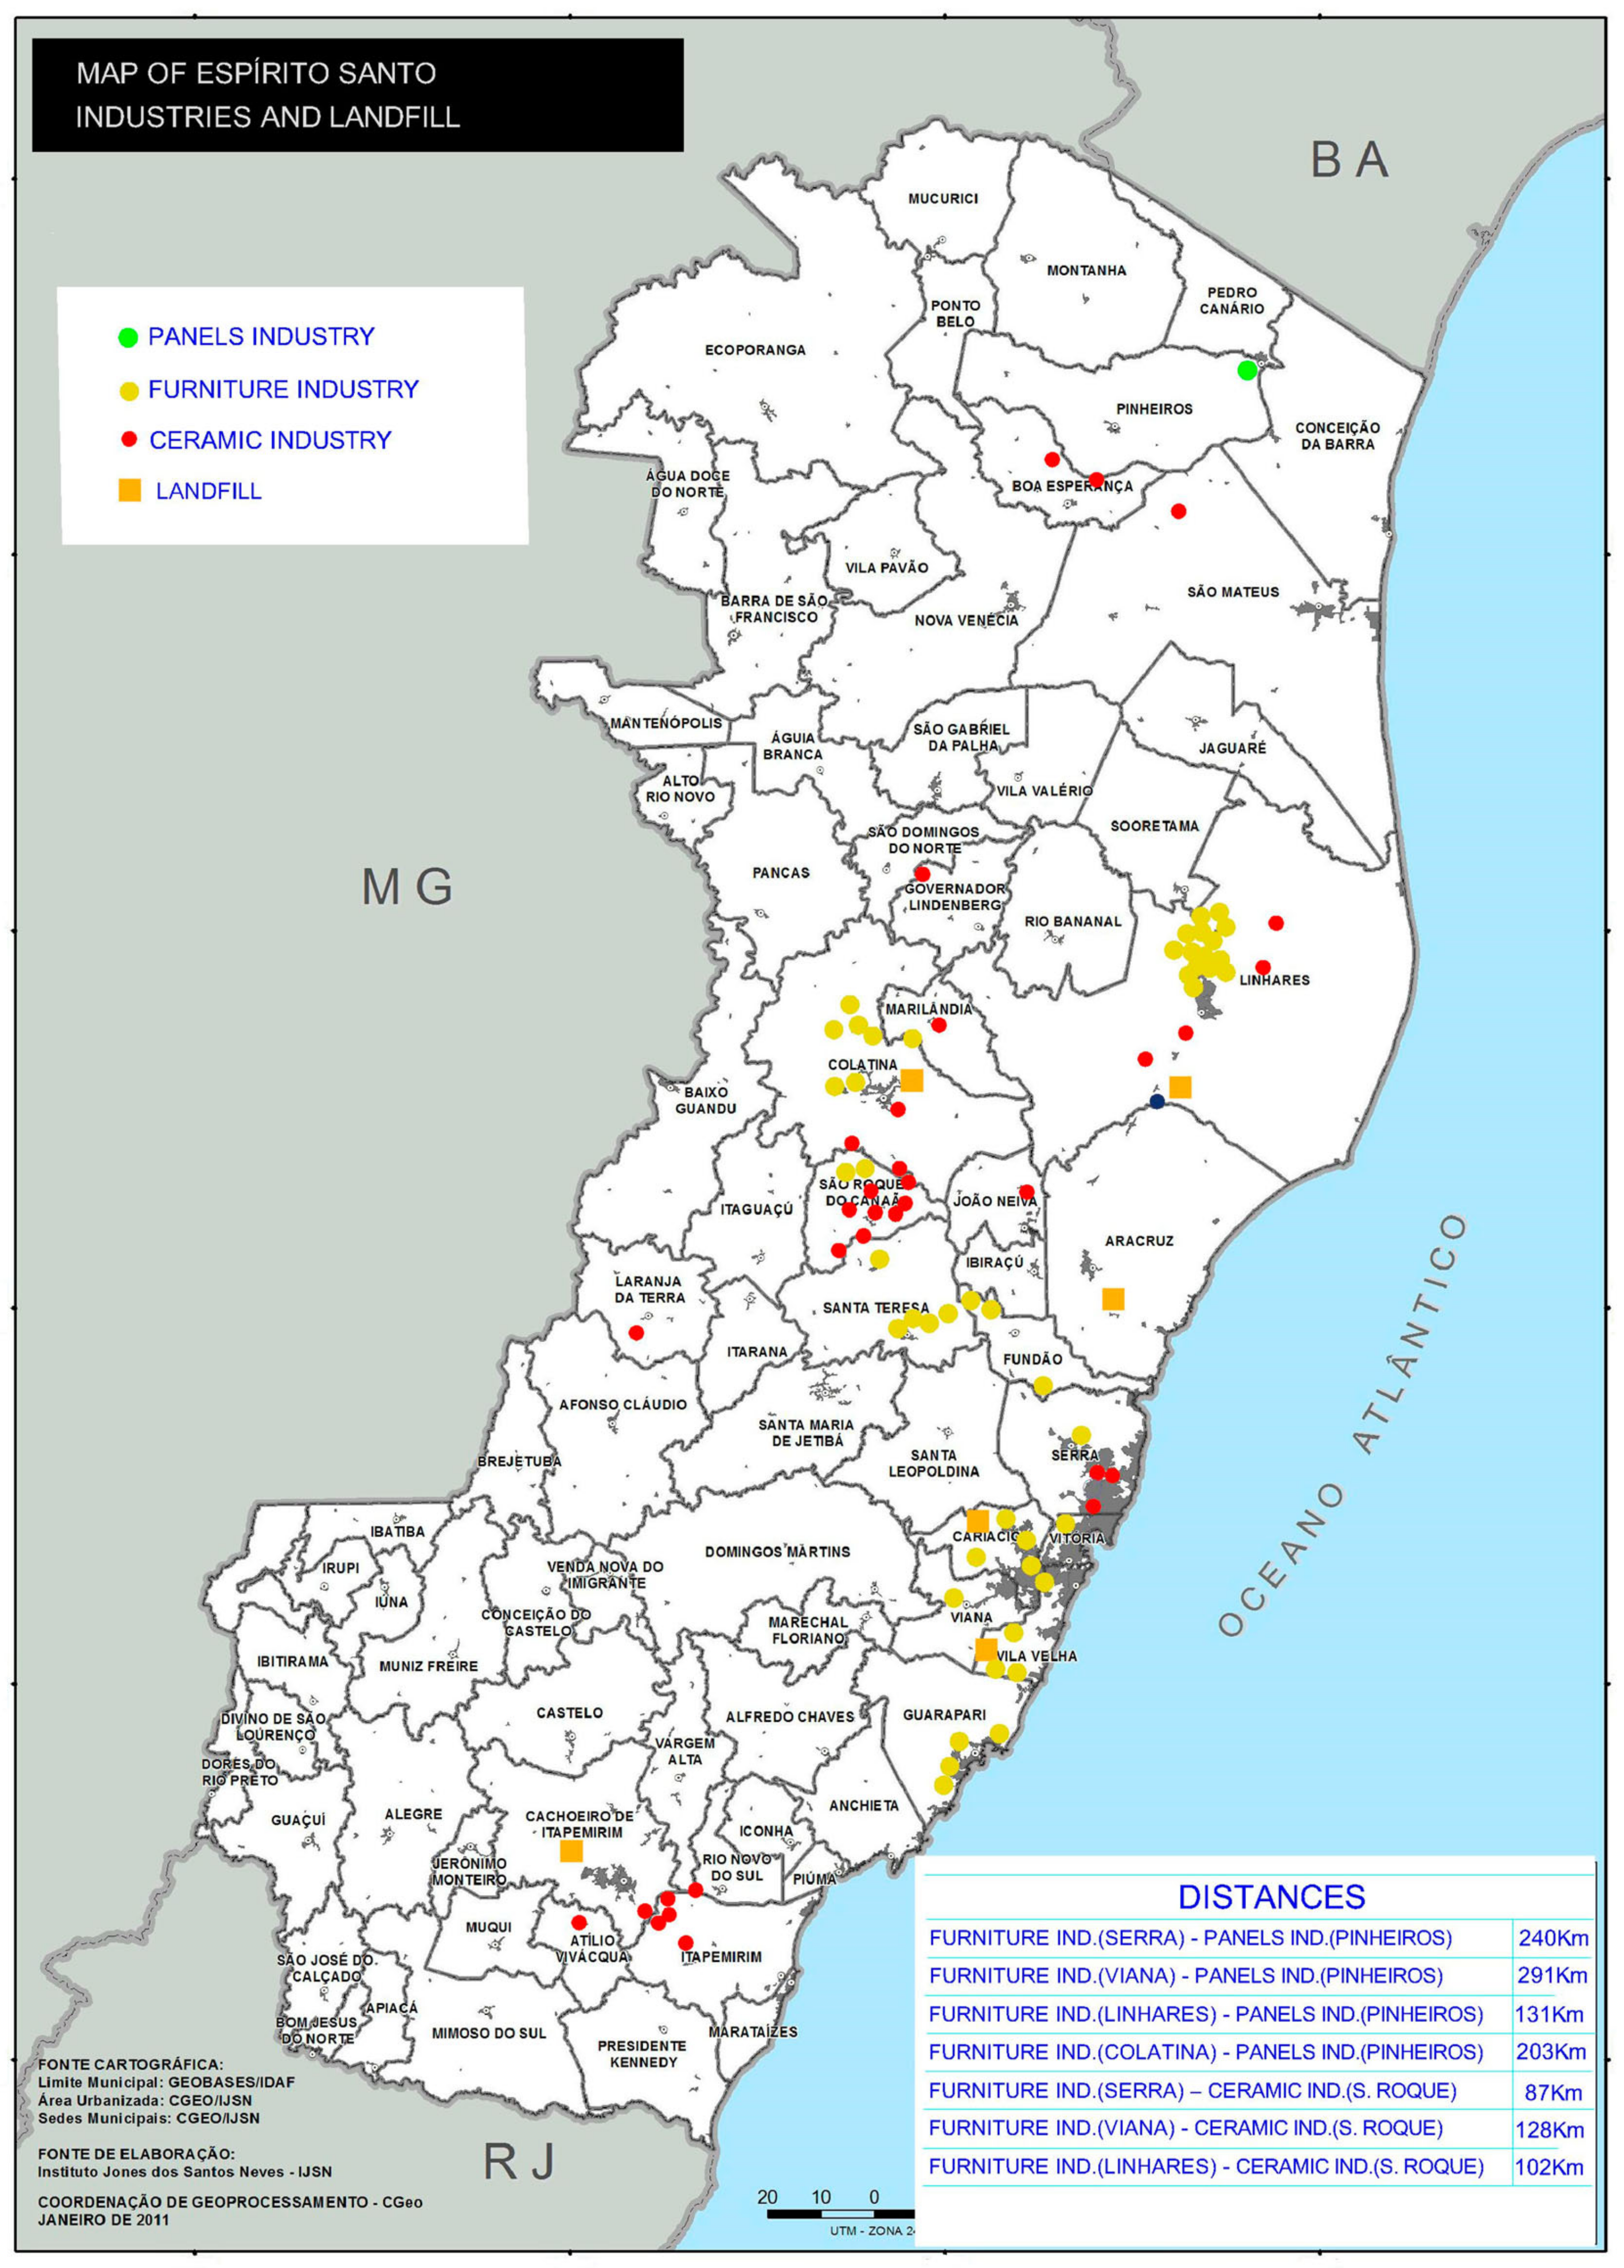
3.1.1. Wood Waste from the Furniture Industry
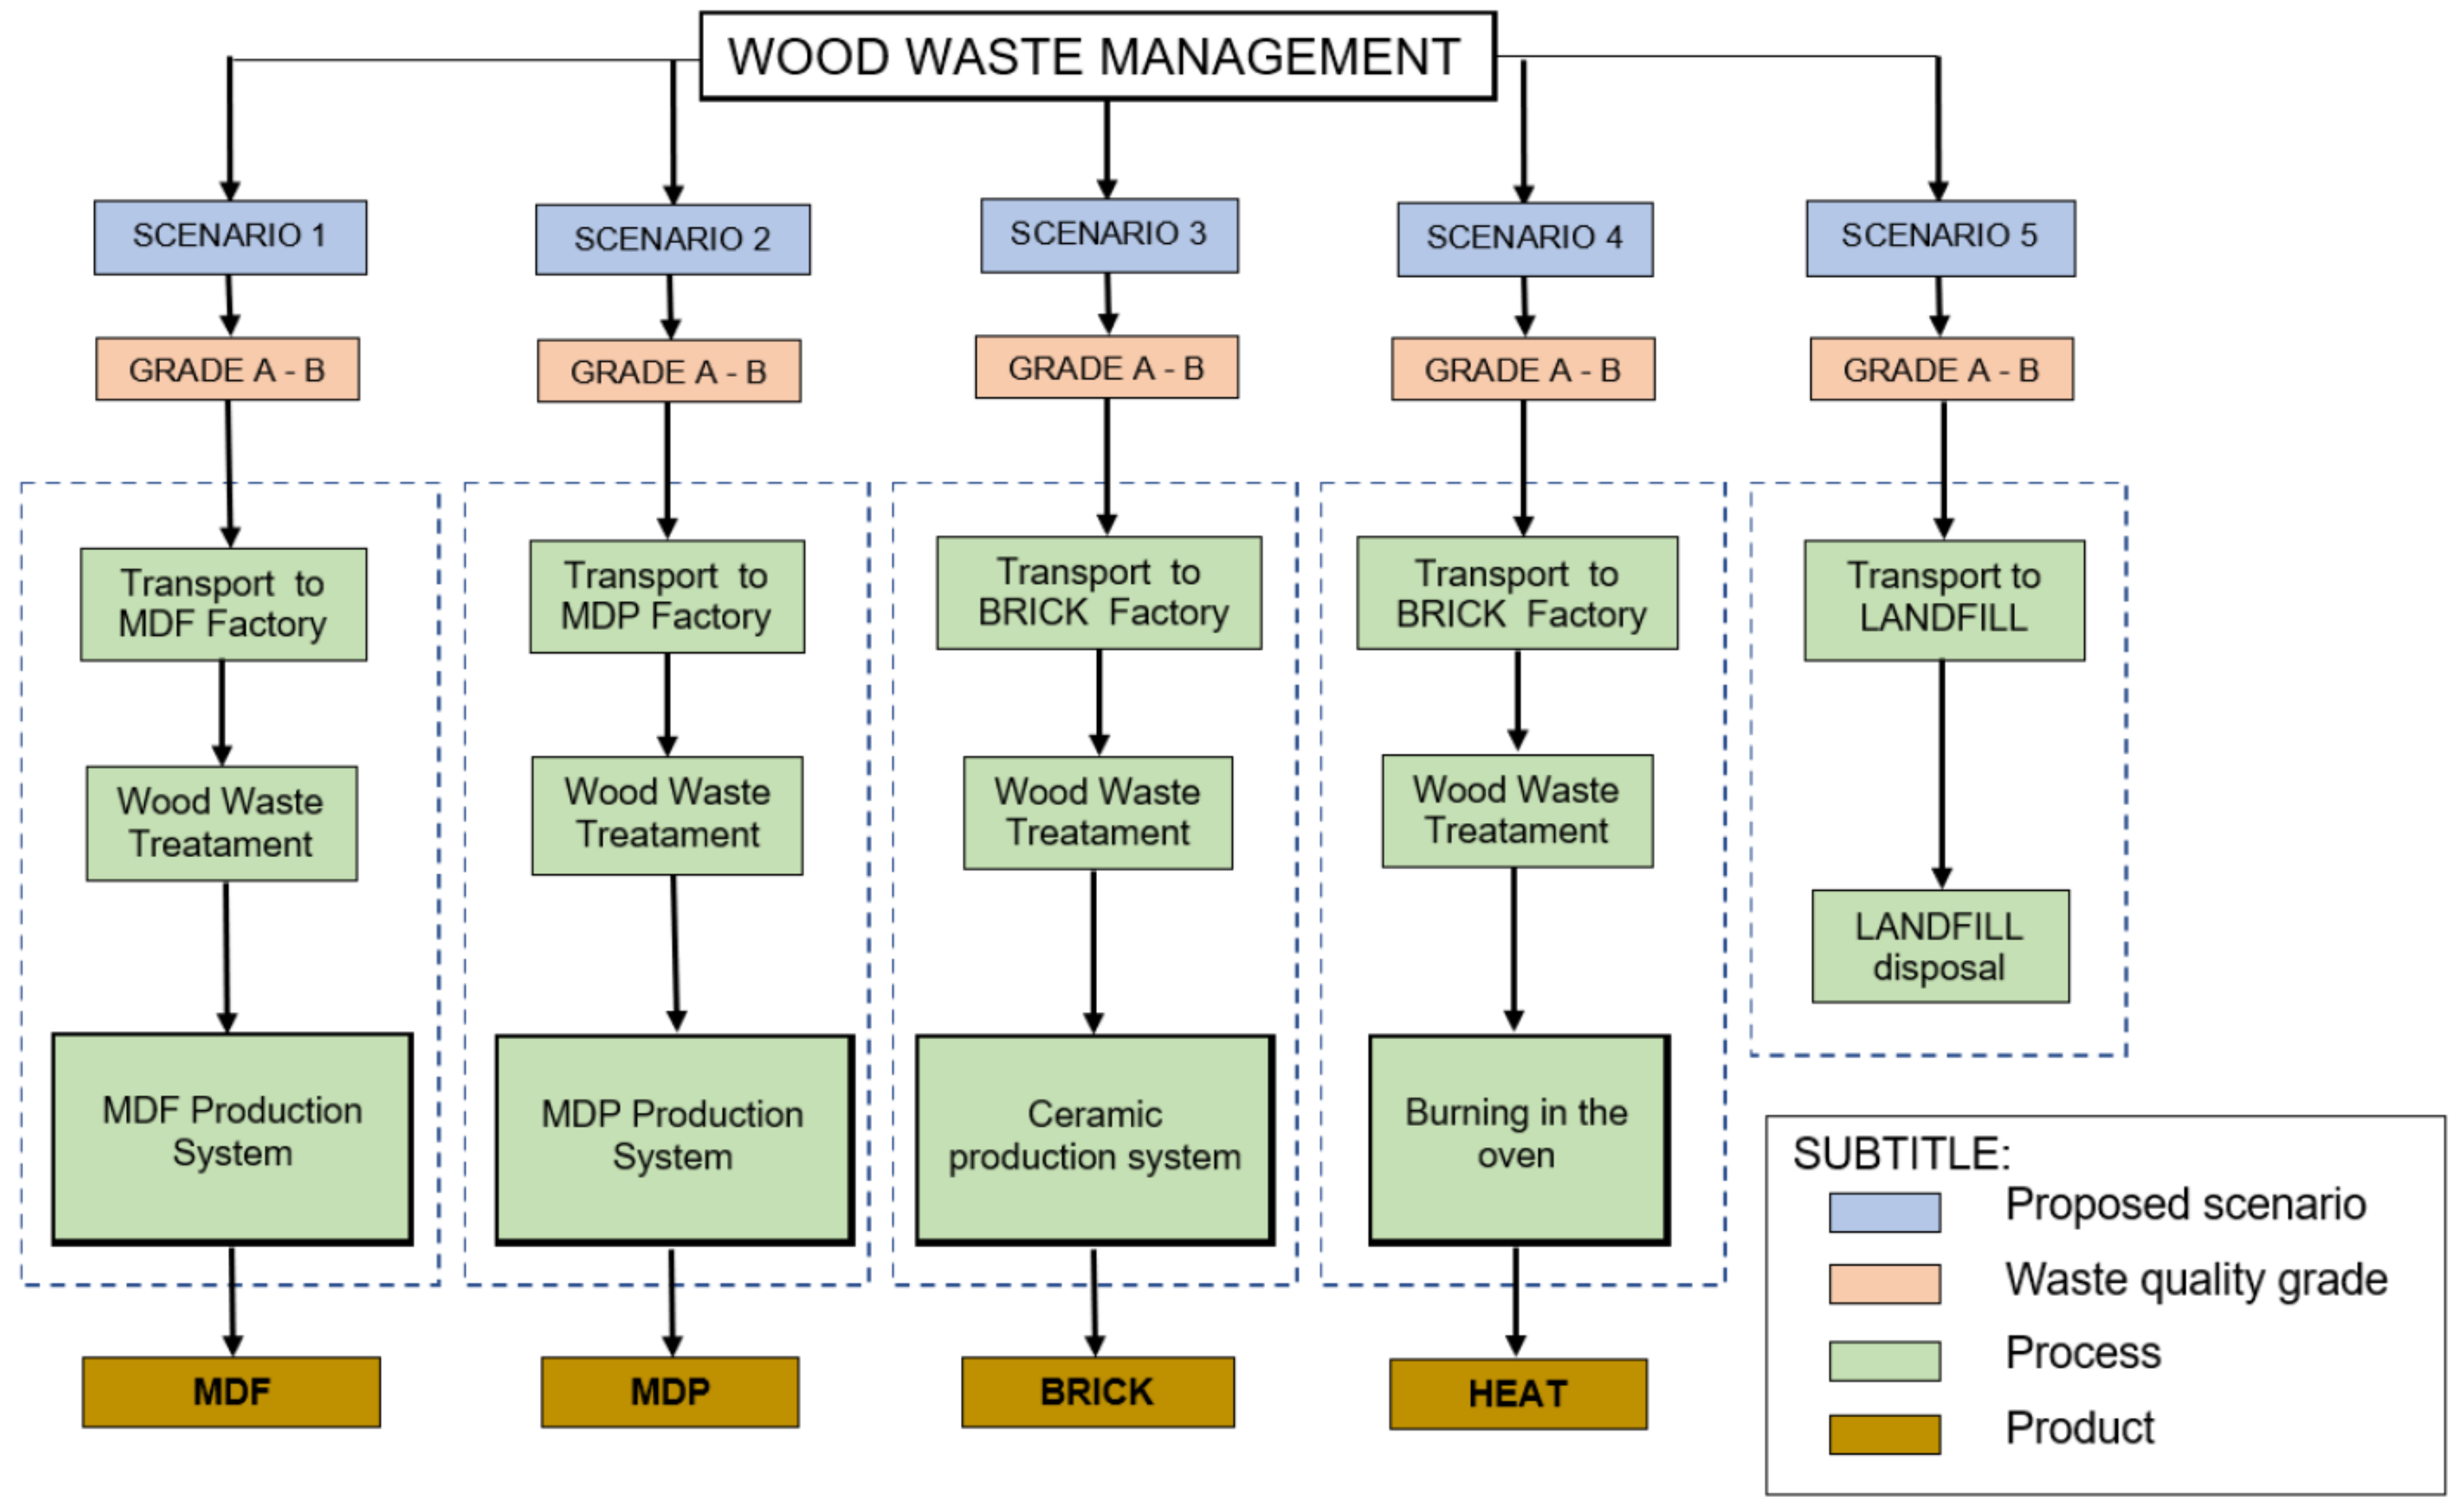
3.1.2. Scenarios Evaluated
3.1.3. Scenario 1
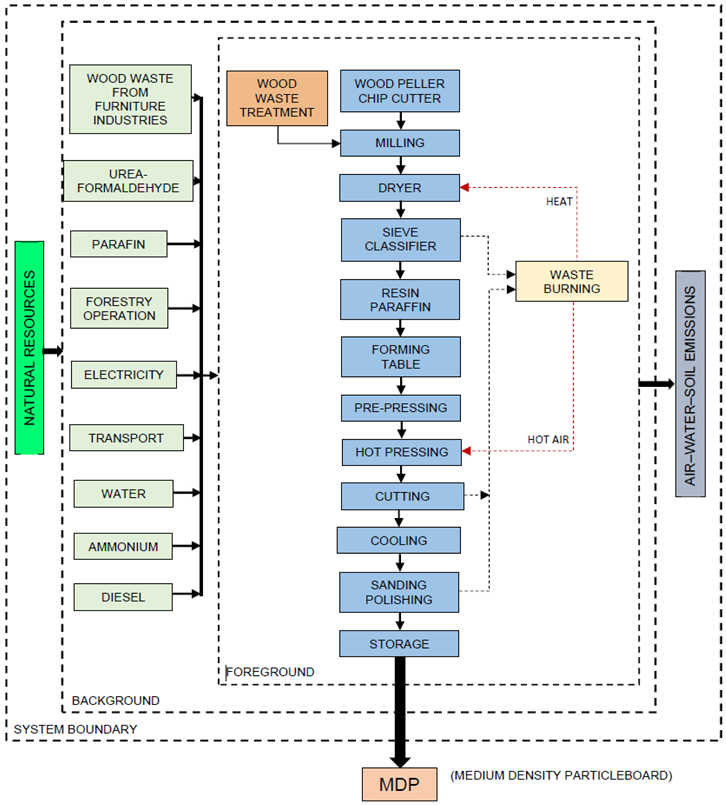
3.1.4. Scenario 2
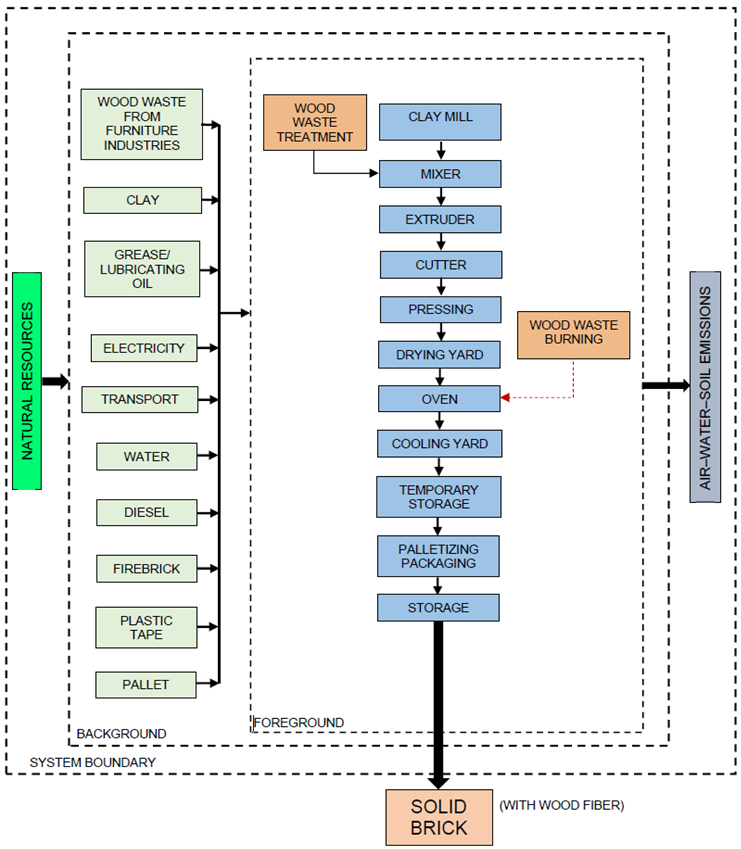
3.1.5. Scenarios 3 and 4
3.1.6. Scenario 5
3.1.7. Research Limitations
- -
- The use and final destination phases were not adopted as the limits of this study, due to the difficulties of tracking product use and final destination. With regard to panels, Wilson [43] justified the exclusion of these phases due to the use of these materials in furniture and interior architecture, along with the various possibilities for final disposal.
- -
- Water and sewage treatment systems in the panel industry were disregarded.
- -
- Office supplies, transportation, and food for employees were not considered in this study.
- -
- The production of ammonia was considered to take place at the same site as the manufacture of urea; thus, the transportation of ammonia was disregarded.
- -
- This study used data from the manufacturing of MDF and MDP without coatings.
- -
- The same amount of energy was considered for the process that used only virgin sources and for the process that used WW for the three products studied.
- -
- To calculate the emissions from burning WW to produce heat, the maximum emissions determined in CONSEMA resolution 370/2017 on the use of uncontaminated MDF and MDP as a fuel source were accounted for. The results therefore refer to controlled burning.
- -
- Scenario 5 (sanitary landfill) used the inventory “treatment of waste wood, untreated, sanitary landfill/waste wood, untreated/cutoff, U” from the Ecoinvent database version 3.6. This considers only WW from natural wood, so emissions from other components of MDF and MDP waste were not considered.
3.2. Life-Cycle Impact Assessment and Interpretation
4. Results
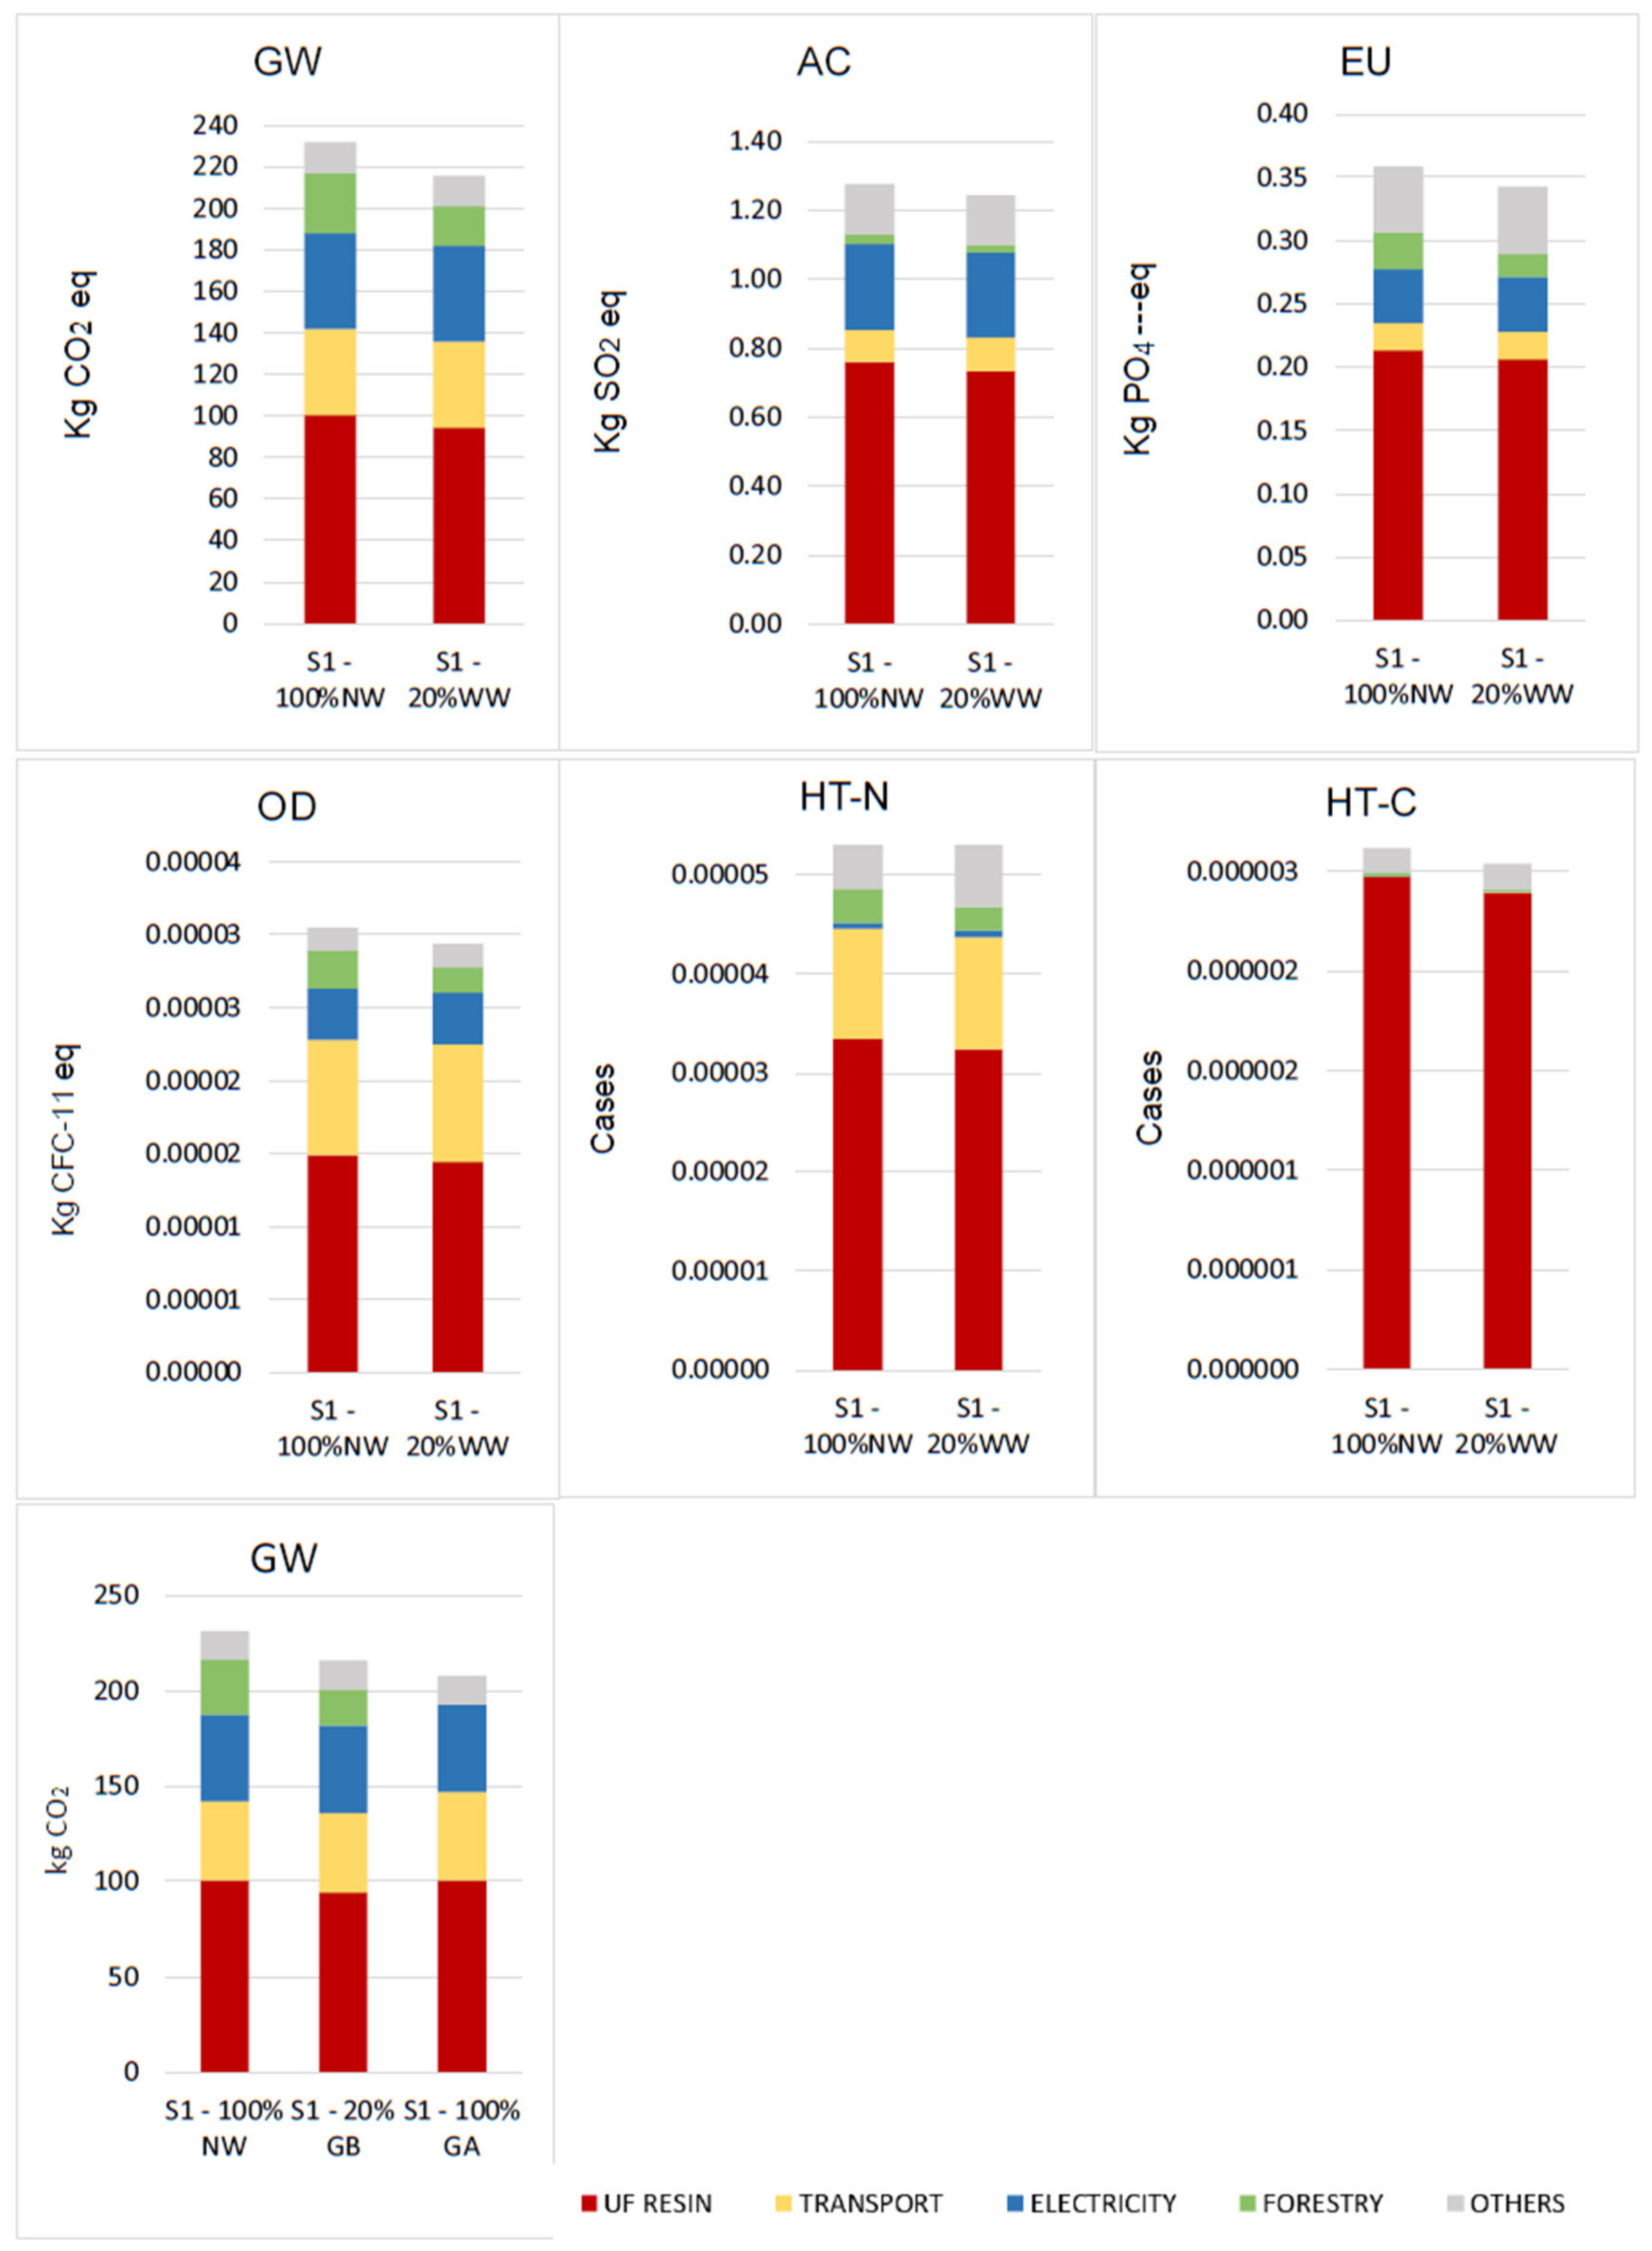
4.1. Scenario 1: MDF
4.2. Scenario 2: MDP
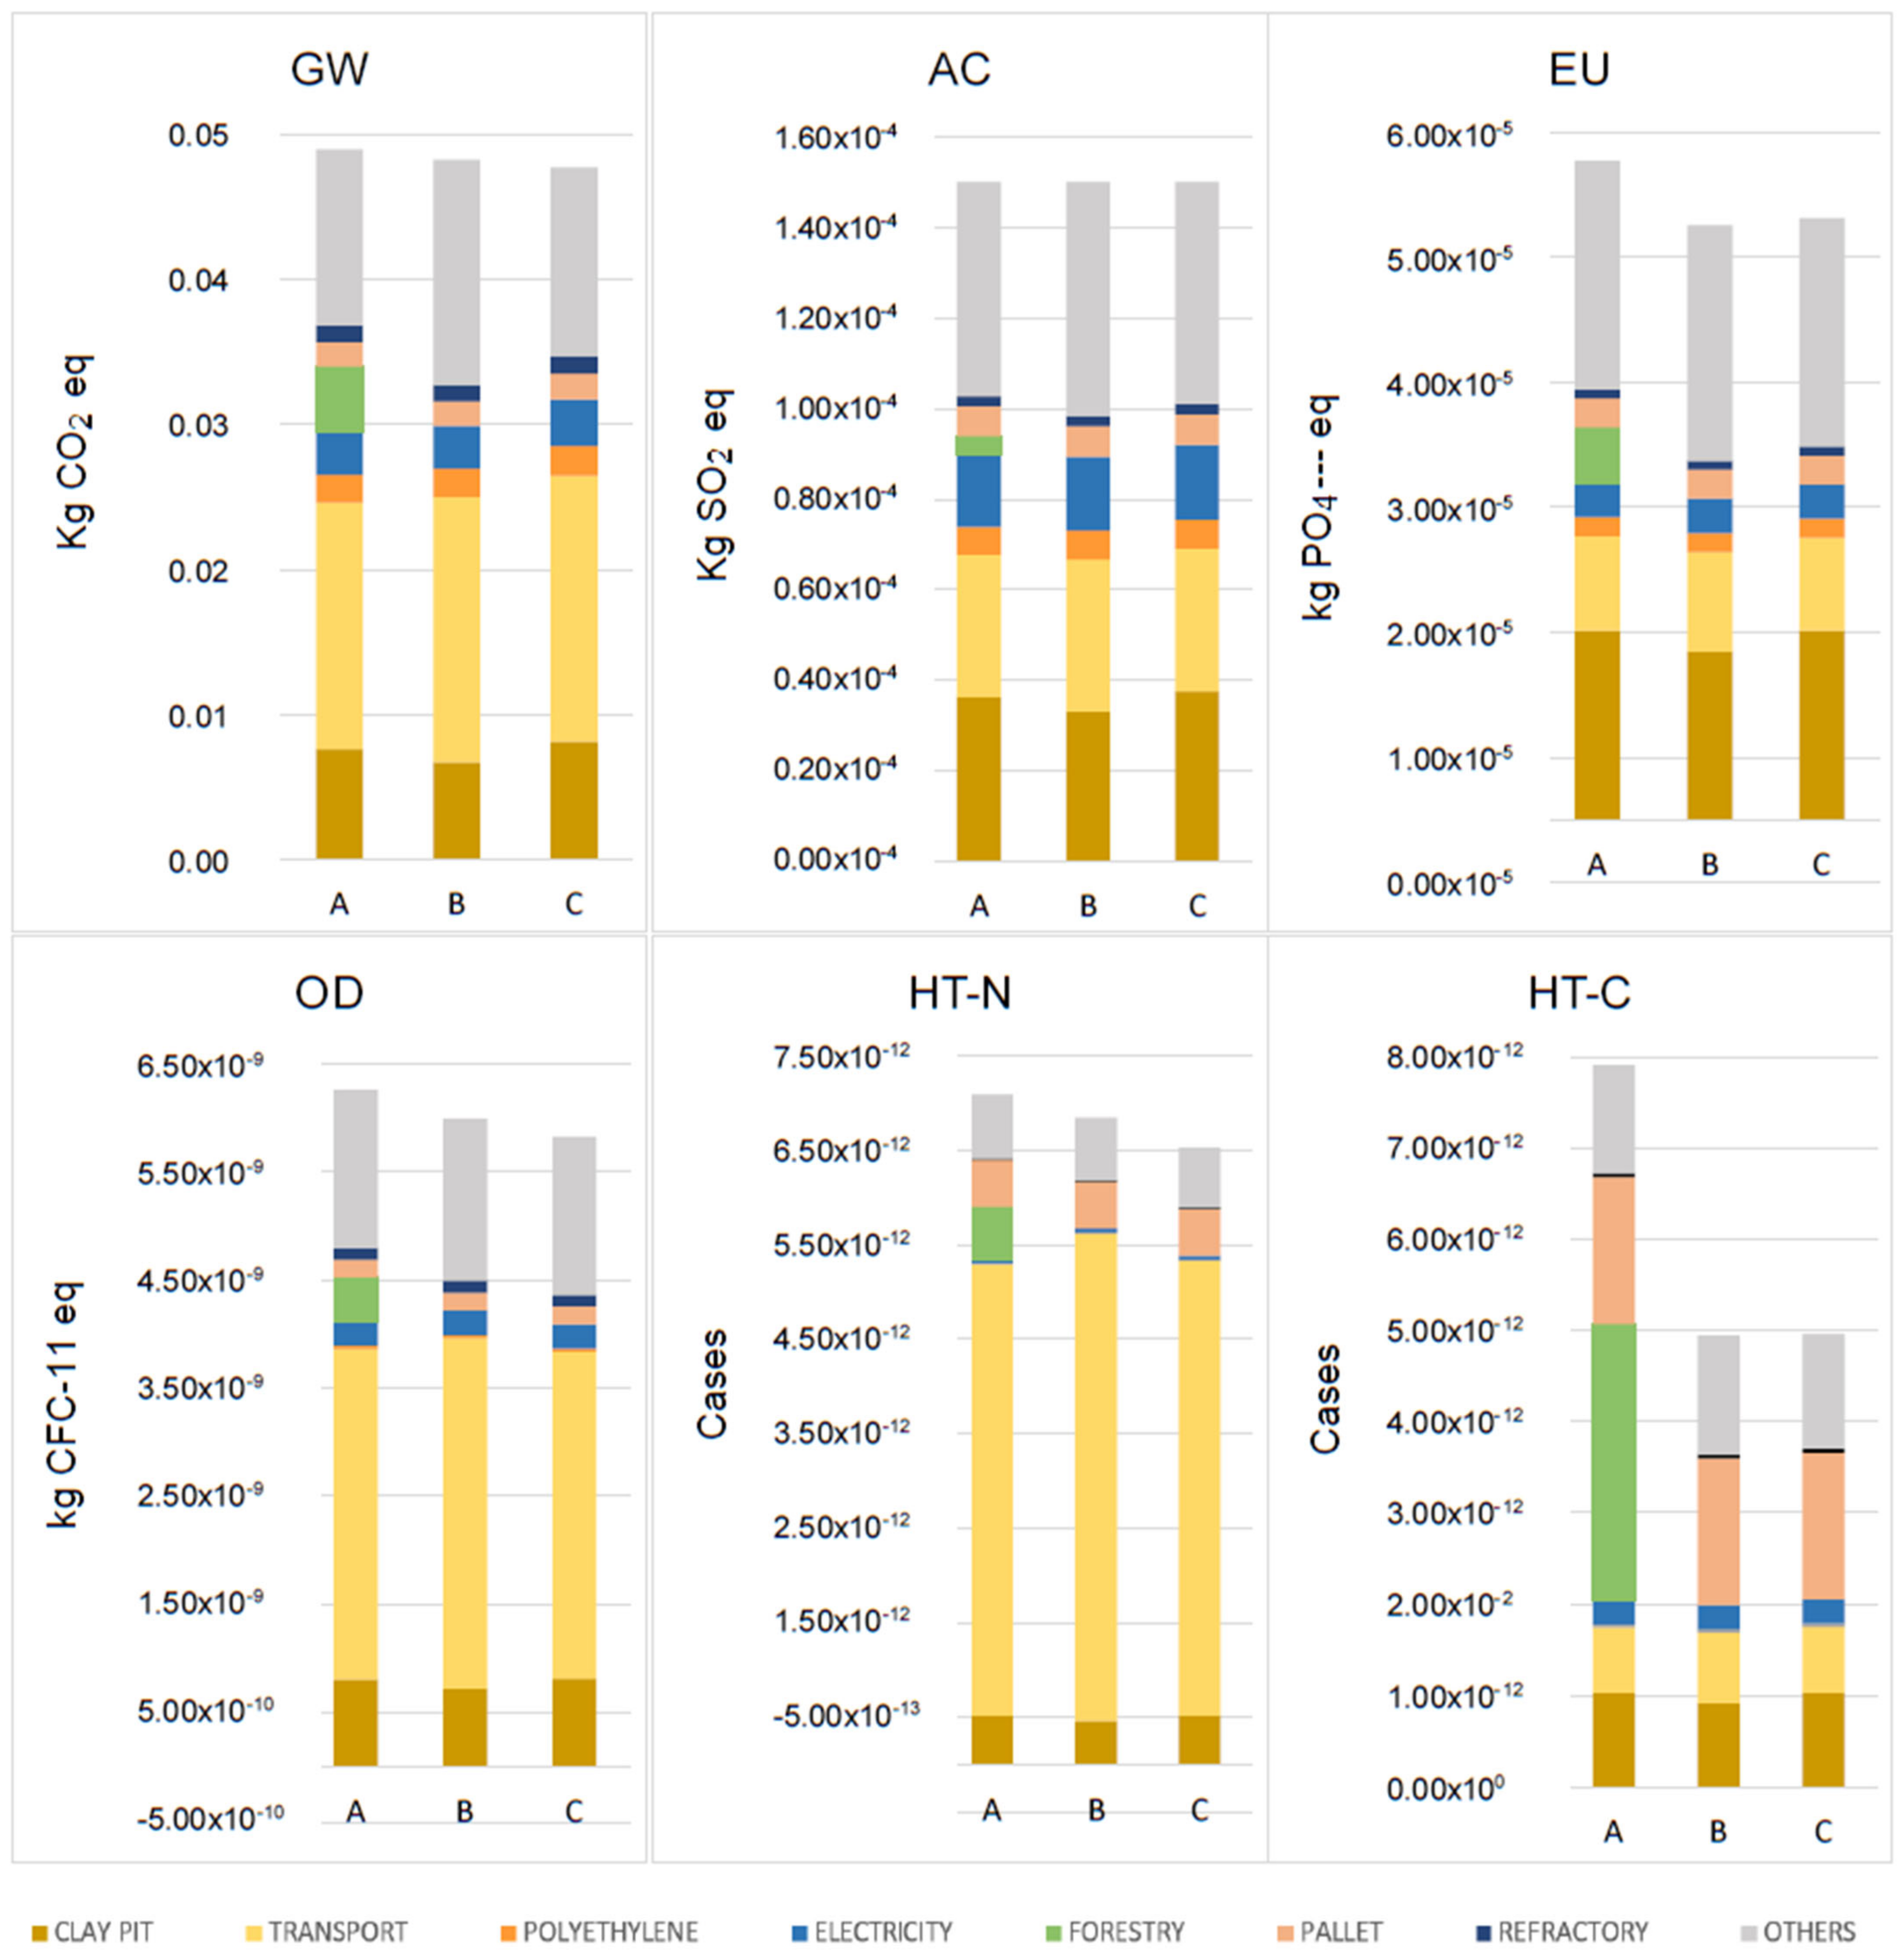
4.3. Scenarios 3 and 4: Ceramic Bricks and Heat
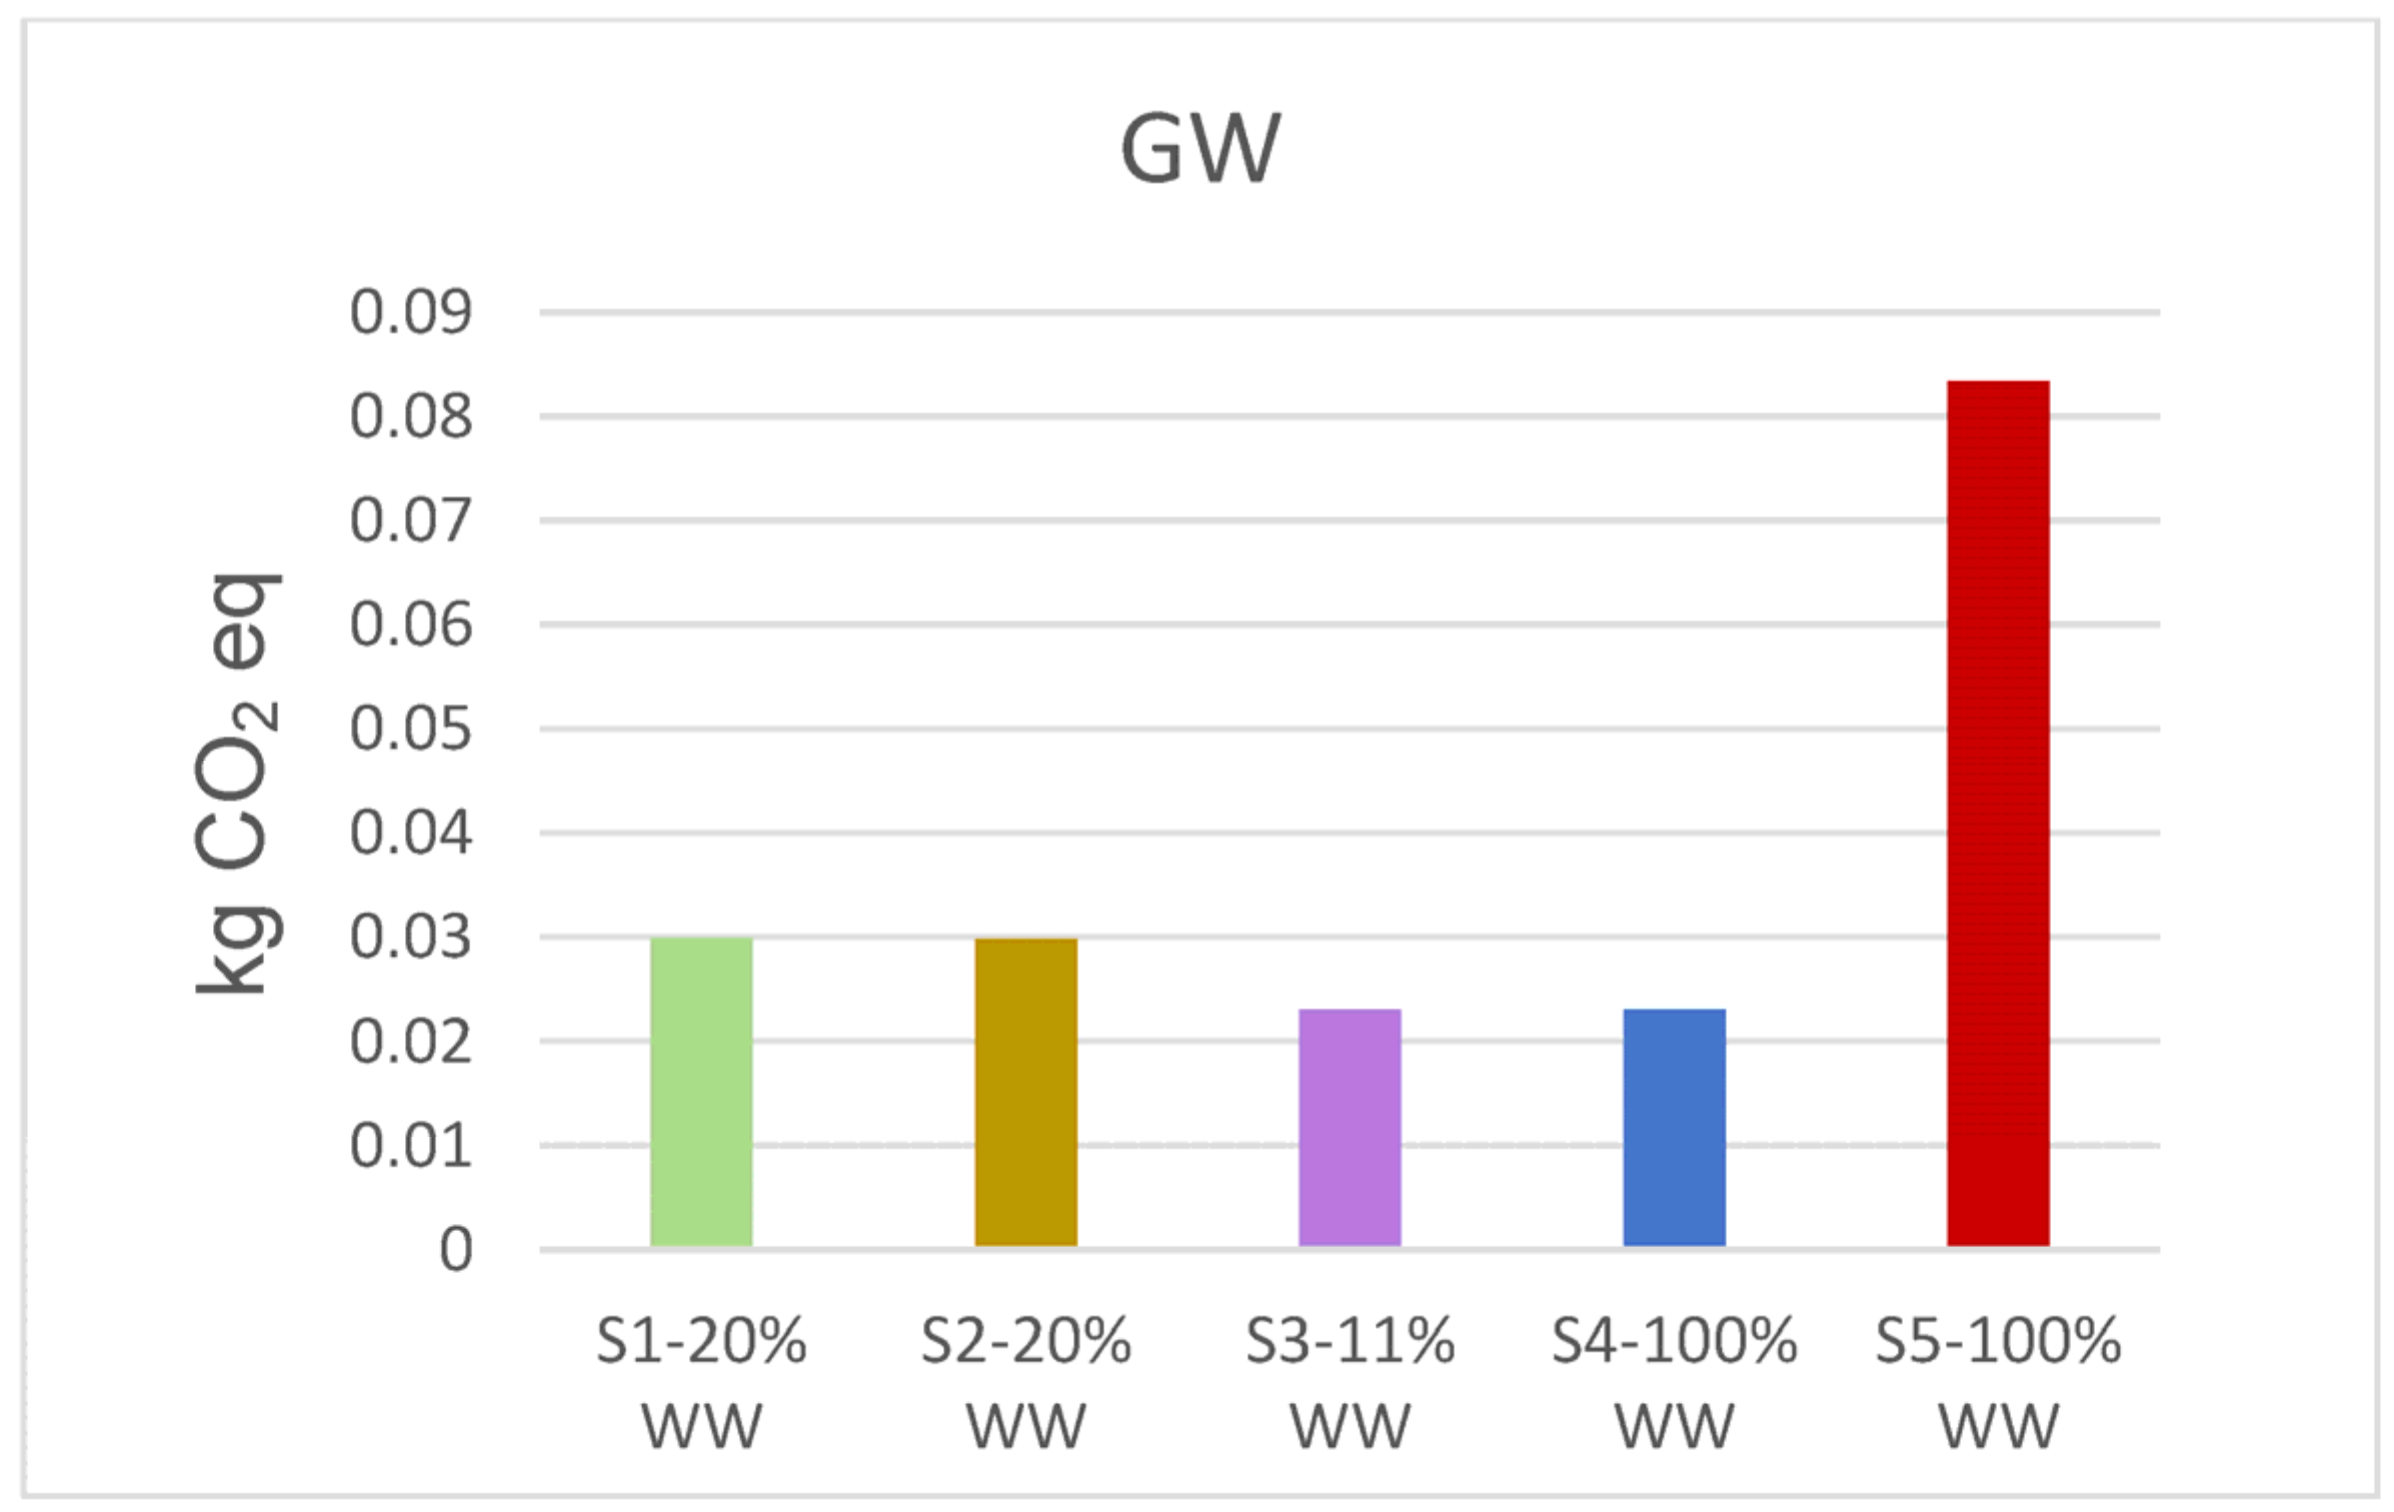
4.4. Scenario 5
5. Discussion
5.1. Comparison of the Results with the Literature Consulted
5.2. Comparative Analysis
5.3. Sensitivity Analysis
6. Conclusions
Supplementary Materials
Author Contributions
Funding
Informed Consent Statement
Data Availability Statement
Acknowledgments
Conflicts of Interest
Acronyms
| Adopted Acronyms | |
| LCA | Life Cycle Assessment |
| WW | Wood Waste |
| MDF | Mediun Density Fibreboard |
| MDP | Medium density Particle Board |
| CE | Circular Economy |
| GA | Solid Wood Waste |
| GB | Panel Waste |
| w/w | Weight per Weight |
| NW | Natural Wood |
| NC | Natural Clay |
| UF | Urea Formaldehyde |
| GW | Global Warming |
| AC | Acidification |
| EU | Eutrophication |
| OD | Ozone Layer Depletion |
| HT-N | Human Toxicity-non cancer |
| HT-C | Human Toxicity-cancer |
| GV | Grand Vitoria Region |
Appendix A. MDF Panel System Boundary (Cradle to Gate)

Appendix B. MDP Panel System Boundary (Cradle to Gate)
Appendix C. Ceramic Brick System Boundary (Cradle to Gate)
Appendix D. Method of Calculating the Data in Table 7
| Calculation Method for Environmental Benefits in Time | |
| MDF | Environmental benefit/m3: MDF with 20% wood waste − natural wood MDF (BA = PR − PV) |
| Exemple GW: 126 kg wood waste has benefit 11.96 kg CO2 eq | |
| (1 t wood waste × 11.96)/126 = 94.9 kg CO2 eq | |
| 1200 m3 MDF/day uses 1000 × 0.126 t = 151.2 t/day | |
| Benefit/day: Benefit 1 t × 151.0 t | |
| Month = 25 days of production | |
| MDP | Enviromental benefit/m3: MDP with 20% wood waste − natural wood MDP (BA = PR − PV) |
| 1200 m3 MDP/day uses 1200 × 0.137 t = 164.94 t/day | |
| Benefit/day: Benefit 1 t × 164.94 | |
| Month = 25 days of production | |
| BRICK | Environmental benefit/1 kg: clay with 11.11% wood waste − 100% natural clay (BA = PR − PV) |
| Production/Day = 13,330 kg bricks × 0.1221 kg waste = 1627 kg/day − Benefit 1 t × 1627/1000 = 1.627 | |
| Month = 30 days of production | |
| ENERGY for Bricks | Environmental benefit/1 kg: 100% natural brick − wood waste for heat |
| Production/Day = 800,040 kg ceramics × 0.12 kg waste = 96,005 kg/day − Benefit 1 t × 96,005/1000 = 96 | |
| Month = 30 days of production | |
References
- Tahim, E.F.; Filho, J.A.; Neto, L.A.S.C.; Magalhães, M.R.V.; Braga, F.L.P.; Costa, P.I.B.R. Diagnóstico do Arranjo Produtivo Local de Móveis de Marco Ceará. Available online: https://www.sedet.ce.gov.br/wp-content/uploads/sites/15/2022/11/Projeto-APL-Diagnostico-APL-de-Moveis-Marco-Versao-Final.Digital.pdf (accessed on 4 January 2023).
- Abimóvel. Relatório Setorial da Indústria de Móveis no Brasil; Brasil Móvel: São Paulo, Brazil, 2023. [Google Scholar]
- Alves, M.I.S.; Martins, J.N.M.; Santos, M.S.; Pinto, T.L.Q.R.; Souza, V.G. Panorama Setorial da Indústria de Móveis; IEMI: São Paulo, Brasil, 2017. [Google Scholar]
- Brainer, M.S.D.C.P. Setor Moveleiro: Aspectos Gerais e Tendências no Brasil e na Área de Atuação do BNB; Caderno Setorial ETENE: Fortaleza, Brasil, 2018.
- Tuoto, M. Levantamento Sobre a Geração de Resíduos Provenientes Da Atividade Madeireira e Proposição de Diretrizes Para Políticas, Normas e Condutas Técnicas Para Promover o Seu Uso Adequado; Ministério do Meio Ambiente: Curitiba, Brazil, 2009.
- Faraca, G.; Tonini, D.; Astrup, T.F. Dynamic accounting of greenhouse gas emissions from cascading utilisation of wood waste. Sci. Total Environ. 2019, 651, 2689–2700. [Google Scholar] [CrossRef] [PubMed]
- Pinho, G.C.D.S.; Calmon, J.L. LCA of wood waste management systems: Guiding proposal for the standardization of studies based on a critical review. Sustainability 2023, 15, 1854. [Google Scholar] [CrossRef]
- Kim, M.H.; Song, H.B. Analysis of the global warming potential for wood waste recycling systems. J. Clean. Prod. 2014, 69, 199–207. [Google Scholar] [CrossRef]
- Ellen Macarthur Foundation. Towards the Circular Economy; Ellen MacArthur Foundation: Cowes, UK, 2012. [Google Scholar]
- Li, X. Industrial ecology and industrial symbiosis-definitions and development histories. In Industrial Ecology and Industry Symbiosis for Environmental Sustainability: Definitions, Frameworks and Applications; Springer International Publishing: Cham, Switzerland, 2018; pp. 9–38. [Google Scholar] [CrossRef]
- Cárcamo, E.A.B.; Peñabaena-Niebles, R. Opportunities and challenges for the waste management in emerging and frontier countries through industrial symbiosis. J. Clean. Prod. 2022, 363, 132607. [Google Scholar] [CrossRef]
- Augustsson, A.; Sörme, L.; Karlsson, A.; Amneklev, J. Persistent hazardous waste and the quest toward a circular economy: The example of arsenic in chromated copper arsenate-treated wood. J. Ind. Ecol. 2017, 21, 689–699. [Google Scholar] [CrossRef]
- Hossain, M.U.; Poon, C.S. Comparative LCA of wood waste management strategies generated from building construction activities. J. Clean. Prod. 2018, 177, 387–397. [Google Scholar] [CrossRef]
- Taskhiri, M.S.; Garbs, M.; Geldermann, J. Sustainable logistics network for wood flow considering cascade utilisation. J. Clean. Prod. 2016, 110, 25–39. [Google Scholar] [CrossRef]
- UNEP. Global Guidance Principles for Life Cycle Assessment Databases—A Basis for Greener Processes and Products. In Shonan Guidance Principles; UNEP: Paris, France, 2011. [Google Scholar]
- Espirito Santo. Crédito Para Diferenciação na Indústria Moveleira. Vitória. Available online: https://www.es.gov.br/Noticia/credito-para-diferenciacao-na-industria-moveleira (accessed on 3 January 2021).
- SINDIMOL. Sindicato das Indústrias da Madeira e do Mobiliário de Linhares. Setor Moveleiro. Informações Gerais; SINDIMOL: Linhares, Brasil, 2022. [Google Scholar]
- Oliveira, L.A.A.G. Plano de Gestão Integrada de Resíduos Sólidos Para o APL Moveleiro de Linhares-ES; Sebrae: Vitória, Brasil, 2010. [Google Scholar]
- DEFRA. Waste Wood as a Biomass Fuel Defra; DEFRA: London, UK, 2008.
- Gordić, D.; Babić, M.; Jelić, D.; Konćalović, D.; Vukašinović, V. Integrating energy and environmental management in wood furniture industry. Sci. World J. 2014, 2014, 596958. [Google Scholar] [CrossRef]
- Uusijärvi, R. From Forest Log to Products; McGraw-Hill Education: New York, NY, USA, 2012. [Google Scholar]
- Caetano, M.D.D.E.; Depizzol, D.B.; Reis, A.D.O.P.D. Análise do gerenciamento de resíduos sólidos e proposição de melhorias: Estudo de caso em uma marcenaria de Cariacica, ES. Gest. Prod. 2017, 24, 382–394. [Google Scholar] [CrossRef]
- Buschalsky, F.Y.B.; Mai, C. Repeated thermo-hydrolytic disintegration of medium density fibreboards (MDF) for the production of new MDF. Eur. J. Wood Wood Prod. 2021, 79, 1451–1459. [Google Scholar] [CrossRef]
- Teixeira, M.F. Substituição de Matéria-Prima Virgem por Matéria-Prima Alternativa na Indústria de Madeira Reconstituída. Master’s Thesis, PPGAD; Ambiente e Desenvolvimento. UNIVATES, Lageado, Brazil, 2012. [Google Scholar]
- Iritani, D.R.; Silva, D.A.L.; Saavedra, Y.M.B.; Grael, P.F.F.; Ometto, A.R. Sustainable strategies analysis through life cycle assessment: A case study in a furniture industry. J. Clean. Prod. 2015, 96, 308–318. [Google Scholar] [CrossRef]
- Mori, F.A.; Covezzi, M.M.; de Oliveira Mori, C.L.S. Utilização da Serragem de Eucalyptus Spp. para a produção de tijolo maciço cerâmico. Floresta 2011, 41, 641–654. [Google Scholar] [CrossRef]
- Sormunen, P.; Deviatkin, I.; Horttanainen, M.; Kärki, T. An evaluation of thermoplastic composite fillers derived from construction and demolition waste based on their economic and environmental characteristics. J. Clean. Prod. 2021, 280, 125198. [Google Scholar] [CrossRef]
- Röder, M.; Thornley, P. Waste wood as bioenergy feedstock. Climate change impacts and related emission uncertainties from waste wood based energy systems in the UK. Waste Manag. 2018, 74, 241–252. [Google Scholar] [CrossRef] [PubMed]
- ISO 14.040; Environmental Management e Life Cycle Assessment e Principles and Frameworks. International Organization for Standardization (ISO): Geneva, Switzerland, 2006.
- ISO 14.044; Environmental Management e Life Cycle Assessment e Requirements and Guidelines. International Organization for Standardization (ISO): Geneva, Switzerland, 2006.
- Fundação Ceciliano Abel de Almeida. Competitividade Sistêmica das Micro e Pequenas Empresas do Estado do Espírito Santo em Regime de Aglomeração Vitória, ES. 2006. Available online: http://biblioteca.ijsn.es.gov.br/Record/12024 (accessed on 2 January 2023).
- Espírito Santo. Plano Estadual de Resíduos Sólidos do Espírito Santo. Espírito Santo. Vitória, ES. 2019. Available online: https://seama.es.gov.br/plano-estadual-de-residuos-solidos (accessed on 1 February 2023).
- Instituto Jones dos Santos Neves. Espírito Santo em Mapas. 3.ed. Vitória, 97 p. 2011. Available online: https://ijsn.es.gov.br/Media/IJSN/PublicacoesAnexos/livros/Es_em_Mapas_3_edicao.pdf (accessed on 1 February 2023).
- NBR 10.004; Resíduos Sólidos—Classificação. Associação Brasileira de Normas Técnicas (ABNT): Rio de Janeiro, Brasil, 2004; 71p.
- Cassilha, A.C.; Podlasek, C.L.; Junior, E.F.C.; da Silva, M.C.; Mengatto, S.N.F. Indústria moveleira e resíduos sólidos: Considerações para o equilíbrio ambiental. Rev. Educ. Tecnol. 2004, 8, 209–228. [Google Scholar]
- Altholz, V. Verordnung Über Anforderungen an die Verwertung und Beseitigung von Altholz (Altholzverordnung-AltholzV); The German Waste Wood Ordinance: 2012. Available online: https://www.gesetze-im-internet.de/altholzv/BJNR330210002.html (accessed on 1 February 2023).
- PAS 111:2012; WRAP. Specification for the Requirements and Test Methods for Processing Waste Wood. BSI: London, UK, 2012.
- SINDICER. Sindicato das Indústrias de Cerâmica do Estado do Espírito Santo; SINDICER: Colatina, Brasil, 2023. [Google Scholar]
- Pavan, F.L.F.R. Análise da Aglomeração Produtiva do Setor Cerâmico no Estado do Espírito Santo. Master’s Thesis, Universidade Tecnológica Federal do Paraná, Paraná, Brasil, 2009. [Google Scholar]
- Posses, I.P. Caracterização Tecnológica de Blocos Cerâmicos de Alvenaria de Vedação Produzidos Por Empresas Cerâmicas do Estado do Espírito Santo. Master’s Thesis, Universidade Federal do Espírito Santo, Espírito Santo, Brasil, 2013. [Google Scholar]
- Silva, D.A.L.; Lahr, F.A.R.; Garcia, R.P.; Freire, F.M.C.S.; Ometto, A.R. Life cycle assessment of medium density particleboard (MDP) produced in Brazil. Int. J. Life Cycle Assess. 2013, 18, 1404–1411. [Google Scholar] [CrossRef]
- CONAMA. Resolução nº 490: Estabelece a Fase PROCONVE P8 de Exigências do Programa de Controle da Poluição do ar por Veículos Automotores. Available online: http://conama.mma.gov.br/?option=com_sisconama&task=arquivo.download&id=767 (accessed on 3 January 2021).
- Wilson, J.B. Life-cycle inventory of particleboard in terms of resources, emissions, energy and carbon. Wood Fiber Sci. 2010, 90–106. [Google Scholar]
- Rivela, B.; Hospido, A.; Moreira, T.; Feijoo, G. Life cycle inventory of particleboard: A case study in the wood sector (8 pp). Int. J. Life Cycle Assess. 2006, 11, 106–113. [Google Scholar] [CrossRef]
- IBAMA. Relatório de Emissões de Poluentes Atmosféricos. Available online: https://dadosabertos.ibama.gov.br/dataset/emissoes-de-poluentes-atmosfericos (accessed on 4 January 2021).
- Ministry of Cities; Secretaria Nacional de Mobilidade Urbana. Indicadores Para Monitoramento e Avaliação da Efetividade da Política Nacional de Mobilidade Urbana. 2016. Available online: https://antigo.mdr.gov.br/images/stories/ArquivosSEMOB/ArquivosPDF/indicadores/fichas-analises/6.2.pdf (accessed on 2 January 2023).
- Ministry of Cities; Secretaria Nacional de Mobilidade Urbana. Indicadores para Monitoramento e Avaliação da Efetividade da Política Nacional de Mobilidade Urbana. 2018. Available online: https://antigo.mdr.gov.br/images/stories/ArquivosSEMOB/publicacoes/relatorioindicadores2018.pdf (accessed on 16 January 2023).
- Piekarski, C.M.; de Francisco, A.C.; da Luz, L.M.; Kovaleski, J.L.; Silva, D.A.L. Life cycle assessment of medium-density fiberboard (MDF) manufacturing process in Brazil. Sci. Total Environ. 2017, 575, 103–111. [Google Scholar] [CrossRef]
- Silva, D.A.L. Avaliação do Ciclo de Vida da Produção do Painel de Madeira MDP no Brasil. Ph.D. Thesis, Universidade de São Paulo, São Paulo, Brasil, 2012. [Google Scholar]
- Vinhal, L.D. Estudo de Indicadores Ambientais de Blocos Cerâmicos com Base em Avaliação do Ciclo de Vida, Considerando o Contexto Brasileiro. Ph.D. Thesis, Universidade Federal de São Carlos, São Carlos, Brasil, 2016. [Google Scholar]
- CONSEMA. Resolução n° 370: Dispõe Sobre o Regramento Para o Uso de Derivados de Madeira, Em Especial MDF e MDP (Medium Density Fiberboard e Médium Density Particleboard), Não Contaminados, Como Combustível Alternativo/Principal. Available online: https://www.sema.rs.gov.br/upload/arquivos/201712/21112355-370-2017-regramento-uso-mdf-mdp-como-combustivel.pdf (accessed on 18 September 2021).
- Höglmeier, K.; Weber-Blaschke, G.; Richter, K. Utilization of recovered wood in cascades versus utilization of primary wood—A comparison with life cycle assessment using system expansion. Int. J. Life Cycle Assess. 2014, 19, 1755–1766. [Google Scholar] [CrossRef]
- Silva, D.A.L.; Lahr, F.A.R.; Varanda, L.D.; Christoforo, A.L.; Ometto, A.R. Environmental performance assessment of the melamine-urea-formaldehyde (MUF) resin manufacture: A case study in Brazil. J. Clean. Prod. 2015, 96, 299–307. [Google Scholar] [CrossRef]
- Puettmann, M.E.; Milota, M. Life-cycle assessment for wood-fired boilers used in the wood products industry. For. Prod. J. 2017, 67, 381–389. [Google Scholar] [CrossRef]
- AWC. Environmental product declaration-particleboard. In North American Structural and Architectural Wood Products; American Wood Council (AWC): Leesburg, VA, USA, 2013. [Google Scholar]
- QUANTIS Sustainability Counts. Análise Comparativa do Ciclo de Vida de Paredes Construídas Com Blocos Cerâmicos, Blocos de Concreto e Concreto Armado Moldado in loco. Relatório Final Preparado Para Anicer. Available online: http://anicer.com.br/acv/ACV%20Blocos%20Cer%C3%A2micos.pdf (accessed on 2 January 2023).


| INPUTS | Unit | Amount | Source | OUTPUTS | Unit | Amount | Source |
|---|---|---|---|---|---|---|---|
| Wood | Emissions to air | ||||||
| Wood waste GA | kg | 63 | (3) | Carbon Dioxide, CO2 (fossil) | kg | 5.93 | (6) |
| Wood waste GB (MDF) | kg | 63 | (3) | Carbon Monoxide, CO | kg | 0.11 | (5) (6) |
| Eucalyptus logs | m3 | 1.15 | (3) | Nitrogen oxides, NOX | kg | 0.12 | (6) |
| Chemicals | Total VOCS | kg | 1.06 | (1) (6) | |||
| Urea-formaldehyde resin | kg | 93.48 | (4) | Particulate | kg | 0.37 | (5) (6) |
| Paraffin | kg | 6.5 | (4) | Formaldehyde, H2CO | kg | 0.10 | (3) |
| Electricity | Water | L | 539 | (3) | |||
| Electricity | kWh | 768 | (4) | Sulfur Acid, H2SO4 | kg | 0.12 | (1) |
| Fuels | Sulfur Oxides, Sox | kg | 0.04 | (5) | |||
| Lubricating oil | kg | 0.018 | (2) | Emissions to land | |||
| Natural Gas | kg | 0.1 | (3) | Boiler Fly Ash | kg | 2.2 | (4) |
| Diesel | kg | 1.89 | (3) | Wood Waste | kg | 4.2 | (3) |
| Wood waste | kg | 131.25 | (4) | Emissions to water | |||
| Transportation | Wastewater from MDF | L | 86.3 | (3) | |||
| Lorry > 32 ton | kg·km | 477,757 | (3) | Water | L | 40 | (3) |
| Water Use | Product (with wood waste) | ||||||
| Water from Rio Itaúnas | L | 666 | (4) | Medium Density Fiberboard (MDF) | kg | 690 | |
| Water reuse (*) | L | 200 | (4) |
| INPUTS | Unit | Amount | Source | OUTPUTS | Unit | Amount | Source |
|---|---|---|---|---|---|---|---|
| Wood | Emissions to air | ||||||
| Wood waste GA | kg | 103.08 | (4) | Carbon Dioxide, CO2 (fossil) | kg | 5.38 | (1) |
| Wood waste GB | kg | 34.36 | (4) | Carbon Monoxide, CO (fossil) | kg | 0.21 | (1) |
| Eucalyptus logs | m3 | 1.16 | (4) | Nitrogen oxides, NOX | kg | 0.25 | (2) |
| Chemicals | Water | L | 30.00 | (1) | |||
| Ammonium sulfate | kg | 1.38 | (2) | Total VOCS | kg | 0.36 | (2) |
| Urea-formaldehyde resin | kg | 71.7 | (2) | Particulate < 2.5 μm | kg | 0.02 | (2) |
| Paraffin | kg | 5.47 | (2) | Particulate > 10 μm | kg | 0.08 | (2) |
| Electricity | Particulate > 2.5 μm and <10 μm | kg | 0.08 | (2) | |||
| Electricity | kWh | 140.83 | (2) | Sulfur Dioxide, SO2 | kg | 0.00 | (2) |
| Fuels | Formaldehyde, H2CO | kg | 0.15 | (2) | |||
| Lubricating oil | kg | 0.018 | (2) | Emissions to land | |||
| Diesel | kg | 1.72 | (2) | Boiler Fly Ash | kg | 0.78 | (2) |
| Wood waste | kg | 75.00 | (2) | Oils unspecified | kg | 0.10 | (2) |
| Transportation | Wood Waste untreated | kg | 97.2 | (2) | |||
| Lorry > 32 ton | kg·km | 414,759 | (3) | Emissions to water | |||
| Water Use | Water | L | 40.00 | (1) | |||
| Water | L | 90.40 | (2) | Formaldehyde | kg | 0.0001 | (2) |
| Suspended solids | kg | 0.0244 | (2) | ||||
| Wastewater from particleboard | L | 6.00 | (2) | ||||
| Product (with wood waste) | |||||||
| Medium Density Particleboard (MDP) | kg | 630 | |||||
| INPUTS | Unit | Amount | Source | OUTPUTS | Unit | Amount | Source |
|---|---|---|---|---|---|---|---|
| Feedstock | Emissions to air | ||||||
| Steel | kg | 0.00001 | (3) | Total VOCs | kg | 2.74 × 10⁻⁸ | (4) |
| Pallet | kg | 0.00023 | (1) | Particulate | kg | 1.34 × 10⁻⁷ | (5) |
| Refractory | kg | 0.01520 | (1) | Formaldehyde, H2CO | kg | 5.49 × 10⁻⁹ | (4) |
| Polyethylene | kg | 0.00096 | (1) | Product | |||
| Mine Clay | kg | 0.97779 | (1) | Bricks with wood waste | kg | 1.00 | |
| Wood fiber | |||||||
| Wood waste | kg | 0.12 | |||||
| Electricity | |||||||
| Electricity | kWh | 0.05 | (1) | ||||
| Diesel | Mj | 0.07 | (1) | ||||
| Wood chipping | kWh | 0.02 | (2) | ||||
| Fuels | |||||||
| Lubricating oil | kg | 0.00002 | (1) | ||||
| Wood waste | kg | 0.1200 | (1) | ||||
| Transportation | |||||||
| Lorry > 32 TON | kg·km | 112.65 | (2) | ||||
| Water Use | |||||||
| Water from artesian well | L | 0.00018 | (1) |
| Transportation Distances For Input Materials | ||||
|---|---|---|---|---|
| INPUT | Adress (City-State) | Distance (km) | ||
| MDF | MDP | BRICK | ||
| Wood Waste | Linhares/Colatina-ES | 168 | 1687 | 71 |
| Eucalyptus logs | Pinheiros/Pedro Canário/São Mateus-ES | 130 | 130 | 130 |
| Clay | São Roque do Canaã-ES | - | - | 40 |
| Plastic tape | Colatina-ES | - | - | 28 |
| Pallet | Santa Teresa-ES | - | - | 33 |
| Urea-formaldehyde | Curitiba-PR/Guarulhos-SP | 1334.5 | 1334.5 | - |
| Paraffin | Candeias/São Francisco do Conde-BA | 829.5 | 829.5 | - |
| Ammonium Sulfate | Pedro Canário-ES | - | 5 | - |
| Landfill | |||
|---|---|---|---|
| Impact Category | Simbol | Impact Result | Unit |
| Global Warning | GW | 8.37 × 10⁻² | kg CO2 eq |
| Acidification | AC | 5.35 × 10⁻⁵ | kg SO2 eq |
| Eutrophication | EU | 2.61 × 10⁻³ | kg PO4 eq |
| Ozone Layer Depletion | OD | 4.27 × 10⁻⁹ | kg CFC-11 eq |
| Human Toxicity NC | HT-N | 2.10 × 10⁻⁹ | Cases |
| Human Toxicity C | HT-C | 5.95 × 10⁻⁹ | Cases |
| ID | Study | Location | System Boundary | Sources of Wood Material | Global Warming Potential (kg CO2 eq) |
|---|---|---|---|---|---|
| Scenario 1 MDF (1 kg) | Puettmann et al. [54] | USA | CTOG | 100% GA | 0.760 |
| Piekarski et al. [48] | BRASIL (SP) | CTOG | VIRGIN | 0.290 | |
| This Study | BRASIL (ES) | CTOG | VIRGIN | 0.330 | |
| This Study | BRASIL (ES) | CTOG | 20% GA + GB | 0.310 | |
| Scenario 2 MDP (1 kg) | AWC [55] | CANADA | CTOG | VIRGIN | 0.440 |
| Silva et al. [41] | BRASIL (SP) | CTOG | VIRGIN | 0.560 | |
| This Study | BRASIL (ES) | CTOG | VIRGIN | 0.320 | |
| This Study | BRASIL (ES) | CTOG | 20% GA + GB | 0.300 | |
| Scenario 3 BRICK (1 kg) | Vinhal [50] | BRASIL (SP) | CTOG | VIRGIN | 0.026 |
| Vinhal [50] | BRASIL (SP) | CTOG | VIRGIN | 0.026 | |
| This Study | BRASIL (ES) | CTOG | VIRGIN | 0.049 | |
| This Study | BRASIL (ES) | CTOG | 11% GA + GB | 0.045 |
| Impact Category | Benefit/ 1 t Wood Waste | Benefit/ Day | Benefit/ Month | Benefit/ Year | Unity | |
|---|---|---|---|---|---|---|
| MDF Scenario 1 | GW | 94.90 | 14,348.88 | 3.59 × 10⁵ | 4.3 × 10⁶ | kg CO2 eq |
| AC | 0.25633 | 38.757 | 968.927 | 11,627.13 | kg SO2 eq | |
| EU | 0.12600 | 19.05 | 476.28 | 5,715.36 | kg PO4 eq | |
| OD | 0.00001 | 0.00139 | 0.03474 | 0.41686 | kg CFC-11 eq | |
| HT-N | 1.56 × 10⁻⁸ | 2.36 × 10⁻⁶ | 5.90 × 10⁻⁵ | 7.08 × 10⁻⁴ | Cases | |
| HT-C | 6.83 × 10⁻⁷ | 1.03 × 10⁻⁴ | 2.58 × 10⁻³ | 3.10 × 10⁻² | Cases | |
| MDP Scenario 2 | GW | 37.408 | 6,170.08 | 1.54 × 10⁵ | 1.82 × 10⁶ | kg CO2 eq |
| AC | 0.056 | 9.237 | 230.916 | 2.77 × 10³ | kg SO2 eq | |
| EU | 0.044 | 7.200 | 179.991 | 2.16 × 10³ | kg PO4 eq | |
| OD | 2.76 × 10⁻⁶ | 4.55 × 10⁻⁴ | 0.01138 | 0.13656 | kg CFC-11 eq | |
| HT-N | 3.26 × 10⁻⁹ | 5.38 × 10⁻⁷ | 1.34 × 10⁻⁵ | 1.61 × 10⁻⁴ | Cases | |
| HT-C | 2.52 × 10⁻⁸ | 4.16 × 10⁻⁶ | 1.04 × 10⁻⁴ | 1.25 × 10⁻³ | Cases | |
| BRICK Scenario 3 | GW | 28.990 | 47.167 | 1415.00 | 1.698 × 10⁴ | kg CO2 eq |
| EU | 0.04217 | 0.02745 | 0.82350 | 9.88202 | kg PO4 eq | |
| OD | 2.19 × 10⁻⁶ | 1.43 × 10⁻⁶ | 4.29 × 10⁻⁵ | 5.14 × 10⁻⁴ | kg CFC-11 eq | |
| HT-N | 1.74 × 10⁻⁹ | 1.13 × 10⁻⁹ | 3.39 × 10⁻⁸ | 4.07 × 10⁻⁷ | Cases | |
| HT-C | 2.43 × 10⁻⁸ | 21.58 × 10⁻⁸ | 4.47 × 10⁻⁷ | 5.70 × 10⁻⁶ | Cases | |
| Energy for Bricks Scenario 4 | GW | 37.499 | 3599.86 | 107,995.68 | 1.30 × 10⁶ | kg CO2 eq |
| EU | 0.03800 | 3.648 | 109.440 | 1.313 × 10³ | kg PO4 eq | |
| OD | 3.61 × 10⁻⁶ | 3.467 × 10⁻⁴ | 1.04 × 10⁻² | 0.12480 | kg CFC-11 eq | |
| HT-N | 4.29 × 10⁻⁹ | 4.114 × 10⁻⁷ | 1.234 × 10⁻⁵ | 1.48 × 10⁻⁴ | Cases | |
| HT-C | 2.46 × 10⁻⁸ | 2.365 × 10⁻⁶ | 7.09 × 10⁻⁵ | 8.51 × 10⁻⁴ | Cases |
Disclaimer/Publisher’s Note: The statements, opinions and data contained in all publications are solely those of the individual author(s) and contributor(s) and not of MDPI and/or the editor(s). MDPI and/or the editor(s) disclaim responsibility for any injury to people or property resulting from any ideas, methods, instructions or products referred to in the content. |
© 2023 by the authors. Licensee MDPI, Basel, Switzerland. This article is an open access article distributed under the terms and conditions of the Creative Commons Attribution (CC BY) license (https://creativecommons.org/licenses/by/4.0/).
Share and Cite
de Souza Pinho, G.C.; Calmon, J.L.; Medeiros, D.L.; Vieira, D.; Bravo, A. Wood Waste Management from the Furniture Industry: The Environmental Performances of Recycling, Energy Recovery, and Landfill Treatments. Sustainability 2023, 15, 14944. https://doi.org/10.3390/su152014944
de Souza Pinho GC, Calmon JL, Medeiros DL, Vieira D, Bravo A. Wood Waste Management from the Furniture Industry: The Environmental Performances of Recycling, Energy Recovery, and Landfill Treatments. Sustainability. 2023; 15(20):14944. https://doi.org/10.3390/su152014944
Chicago/Turabian Stylede Souza Pinho, Giusilene Costa, João Luiz Calmon, Diego Lima Medeiros, Darli Vieira, and Alencar Bravo. 2023. "Wood Waste Management from the Furniture Industry: The Environmental Performances of Recycling, Energy Recovery, and Landfill Treatments" Sustainability 15, no. 20: 14944. https://doi.org/10.3390/su152014944
APA Stylede Souza Pinho, G. C., Calmon, J. L., Medeiros, D. L., Vieira, D., & Bravo, A. (2023). Wood Waste Management from the Furniture Industry: The Environmental Performances of Recycling, Energy Recovery, and Landfill Treatments. Sustainability, 15(20), 14944. https://doi.org/10.3390/su152014944