Article

How Does Flooding Influence Intra-Urban Mobility? The Case of Accra

by
Lasse Moller-Jensen
1,*,
Albert N. M. Allotey
2,
Richard Y. Kofie
2 and
Gerald A. B. Yiran
3
1
Department of Geosciences and Natural Resource Management, University of Copenhagen, 1350 Copenhagen, Denmark
2
Institute for Scientific & Technological Information, Council for Scientific & Industrial Research, Accra CT 2211, Ghana
3
Department of Geography and Resource Development, University of Ghana, Accra P. O. Box LG 59, Ghana
*
Author to whom correspondence should be addressed.
Sustainability 2023, 15(20), 14997; https://doi.org/10.3390/su152014997
Submission received: 22 August 2023 / Revised: 29 September 2023 / Accepted: 16 October 2023 / Published: 18 October 2023
(This article belongs to the Special Issue Towards Resilient Infrastructure)

Abstract

:
This study analyzes how daily mobility may be disrupted or constrained due to the flooding of road infrastructure. The empirical focus is Accra, Ghana, a rapidly growing African city with frequent flood events due to heavy rainfall. In the context of very scarce mobility data availability from official sources, this study proposes a novel way to utilize data from a large survey of mobility patterns conducted through in-person interviews in four peri-urban neighbourhoods. The survey targeted economically active adults and provided spatially explicit data on frequent destinations within the city when travelling in relation to income-generating activities. Using survey data on mobility patterns and detailed population data, we present a transport model with estimates of daily traffic volumes. At the city-wide scale, we propose a method for combining this transport model with maps of flood-prone locations derived from digital terrain models. At the local scale, we propose a method for analyzing the impact of flood events that restrict access to and from urban neighbourhoods. The presented results include maps of flood locations with a high impact on overall mobility, as well as maps that illustrate the spatial extent of this impact within the Accra region. At the local scale, the results illustrate the degree of potential isolation of smaller urban areas during flooding and identify the flood locations with the most significant impact on this issue. It is argued that the presented methods for identifying hotspots of flood-induced mobility disruptions may assist planners and policymakers in providing more resilient infrastructure and mitigate the adverse effects of flooding on urban transport.

1. Introduction

1.1. Flooding and Urban Mobility

Several recent studies document that flooding influences the everyday mobility and daily activities of urban residents in many cities of the world [1,2,3,4,5,6]. In Accra, the capital of Ghana with 5.4 mill. inhabitants [7], the frequently flooded or muddy roads and gutters affect the transport system and disrupt residents’ mobility severely [1]. Accra is an example of a sprawling African city characterized by extensive spatial expansion during the last three decades. There are discernible challenges in its transport system, including insufficient road infrastructure, severe congestion, and frequent flood situations during the rainy seasons [8,9]. Recent research indicates that the increasingly common flooding episodes within the city of Accra are a consequence of multiple factors, including unplanned development caused by ineffective land ownership and administration regulations. The largely unplanned expansion and densification of the city have led to a significant increase in the extension of impervious surfaces, leading to greater surface runoff during rainfall [10,11,12,13]. The higher vulnerability to flooding is, to some extent, associated with informal urbanization, poverty, and marginalization, which have led many people to settle in flood-prone areas [13,14]. There is a process towards the filling up of vacant open spaces and many new buildings are constructed very near waterways or directly encroaching on riverbeds, resulting in narrowed flood plains. This development exacerbates both the extent of, and exposure to, flooding in urban areas [11,12,15]. Additionally, inadequate drainage systems and garbage disposal practices further contribute to increased levels of flooding [11,13].
During episodes of flooding, the floodwater tends to follow the path of roads, particularly peri-urban roads that lack proper drainage systems. As a consequence, the roads become inundated, causing delays and, in some instances, temporary halts in vehicular movement, depending on the depth and areal extension of the water. Additionally, this flooding often leads to erosion, resulting in significant gullies, potholes, and bridge damage that also affect vehicle movements. Combined, these effects directly hinder mobility, leading to reduced accessibility to workplaces, markets, schools, and other essential livelihood opportunities and services [16]. In numerous neighbourhoods, particularly those located in peripheral areas, the accumulation of water obstructs access to main roads and impedes movement within the neighbourhoods, as well as transportation in and out of the areas. A study of four neighbourhoods in Accra conducted in 2021 indicated that 87% of the residents had experienced mobility disruptions, either due to prolonged travel times or an inability to travel to pursue livelihood-related activities, within the past year [17]. Access to traffic and travel data is vital for assessing the impact of flooding on daily mobility, but systematic data on travel behaviour in African cities remain surprisingly scarce. In the past 20 years, only a handful of large travel surveys have been conducted in African cities [17,18,19].

1.2. Vulnerability of Road Infrastructure

Identifying flood-prone areas and their potential impact on urban mobility allows planners and policymakers to obtain a better understanding of the vulnerability of the transport infrastructure. This understanding is vital for prioritizing resources and investments to strengthen transportation routes and assets in vulnerable areas of the city. By pinpointing locations with high vulnerability, authorities can strategically focus on upgrading or reinforcing transportation infrastructure in the areas that are most likely to be affected by floods. This may involve road improvements of various kinds, the construction of flood-resistant bridges, improving drainage systems and flood barriers, as well as the construction of new roads that provide a wider choice of alternative routes in case of flooding. Knowing where flood-induced mobility disruptions are likely to occur enables better emergency response planning, which may lead to faster response times and better coordination during flood emergencies. The identification of flood-prone locations with a high impact on mobility will also influence land use planning. In this context, planners can discourage the construction of critical facilities like hospitals or emergency centres in vulnerable areas, reducing the risk of these services becoming inaccessible during flooding.
Over the past twenty years, a number of studies have examined how abrupt flooding-related disturbances within a road network affect its ability to facilitate urban transportation. A main focus has been the identification and quantification of different types of network vulnerabilities. Frequently, this involves assessing the significance of specific network links in relation to the general operational capabilities of the network, particularly when a link fails due to flood-induced issues. Several studies have focused on conceptualizing network vulnerability. Jenelius and Mattsson [20] present a definition of vulnerability measures and propose a framework for evaluating disruption scenarios. Similarly, Balijepalli and Oppong [21] define a vulnerability index based on the identification of critical links. Further analysis of network performance can be found in the studies by Sohn [22] and Wiśniewski et al. [23] focusing on the creation of accessibility indices to measure flood impacts. Other studies apply the concepts of network resilience and efficiency for facilitating urban mobility [4,24,25]. Kermanshah and Derrible [3] analyze road system robustness to extreme flooding events and identify locations in need of further investments.
Another important element is the level of network redundancy, i.e., the availability of alternative routes or transportation options in case one route becomes impassable due to factors such as flooding. A lack of network redundancy can lead to a range of significant problems and challenges, including the limitation of accessibility to work places and services, isolation, traffic congestion, and increased travel times and costs. Morelli and Cunha [26] assess the efficiency of a system in providing alternatives to roads disrupted by flooding, proposing a measure for the efficiency of alternative routes based on the average increase in route lengths and the proportion of isolated nodes after an impact. A specific aspect within studies of flooding and mobility is how rainfall patterns and flood depths influence accessibility and speed levels for different types of vehicles and travel modes. This has been examined by several studies including Singh et al. [27], Maze et al. [28]; Pregnolato et al. [29]; Shah et al. [30]; Stamos et al. [31]; and Zhang, Xu, Wang, and Lai [6]. While most studies rely on model data for flood predictions, a few studies analyze the consequences of real flood events, including Mitsakis et al. [32] and Diakakis et al. [33] who analyzed infrastructure collapse and road inundations and compared this with observed vehicle circulation and speed levels using GPS data from a truck company. Several studies rely on available origin–destination datasets to evaluate network vulnerability and resilience, including that of Martins, Rodrigues da Silva, and Pinto [4], which analyzes potential mode changes due to network disruptions, and of and Chen et al. [34] and Papilloud and Keiler [5], which apply travel zone analysis based on gravity modelling to provide accessibility-based assessments of road vulnerability.

1.3. Objectives

This paper contributes to the existing literature on the effects of flooding on transportation networks and accessibility by presenting a comprehensive multi-scale spatial account of the potential impacts of flooding on the daily mobility within the city of Accra, taking into account the very limited availability of official data concerning traffic volumes, mobility patterns, and flood extents. The primary aim is to provide information that can aid in identifying the most critical locations in terms of their impact on mobility. By understanding these impacts, planners and policymakers can work towards mitigating the adverse effects of flooding on urban transport infrastructure. This study adopts a two-scale approach by analyzing and mapping mobility constraints on both the overall city level and the local, neighbourhood level. In both cases, the aim is to pinpoint the flood locations with the highest impact on mobility levels, as well as map out the affected areas and population. Table 1 provides an overview of the analysis scales, objectives, and methods employed. For this study, the term “hotspot” refers to locations that are both highly susceptible to flooding and significant for facilitating urban mobility. Similarly, “areas affected by mobility loss” delineate the urban areas and corresponding population that will be impacted by flood events at specific locations.
At the citywide scale, the objective is to establish an urban transport network model for Accra to provide information about traffic loads on each road segment. The transport model incorporates OpenStreetMap network data, population data, and a survey of mobility patterns in four peripheral neighbourhoods of Accra. These neighbourhoods are selected so that they differ in degree of consolidation, level of accessibility, geo-physical characteristics, and socio-economic composition, with the aim of providing evidence from different types of urban development. We combine this model with maps of flood-prone locations, allowing us to identify and map high-impact flood locations and assess the extent of their impact on the population. Peripheral areas are in focus since these are most challenged in terms of accessibility to the city centre by insufficient road infrastructure, limited connectivity, and severe congestion [8].
At the local scale, we analyze the consequences of rainfall events that hinder access to the main road network from urban neighbourhoods. Using GIS-based network analysis and employing the betweenness centrality measure for flood-prone road segments leading to the main roads, we map the potential degree of isolation and identify flood locations with the highest impact on accessibility.
In Section 2, we first describe the methods and data for the city-scale analysis, including the applied survey of mobility patterns (Section 2.1.1), the creation of the transport model (Section 2.1.2), the referenced flood screening model (Section 2.1.3), and the applied GIS-based overlay and network analysis for mapping hotspots (Section 2.1.4). Subsequently, we present the methodology for performing local-scale analysis (Section 2.2.1 and Section 2.2.2). The results section (Section 3) describes relevant results obtained from the survey of mobility patterns, including the identified distance decay functions (Section 3.1). This is followed by a presentation of the resulting traffic model (Section 3.2.1), examples of identified hotspot locations on the city-scale level (Section 3.2.2), and maps of the corresponding mobility loss (Section 3.3). Finally, we present the results of the analysis on the local scale in terms of maps showing the degree of isolation (Section 3.4) and examples of hotspot locations that are responsible for local mobility loss (Section 3.5). The methods and results are discussed in Section 4, followed by a conclusion in Section 5.

2. Materials and Methods

2.1. City-Scale Analysis (A1 + A2)

This section describes the methodological approach and data requirements for analyzing the potential mobility impacts of heavy rainfall at flood-prone locations within the main watershed of Accra. Intra-urban trips in general and trips towards the central parts of the city are in focus. This study adapts an approach based on modelling the risk of impacts on mobility as a function of the probability of flooding at a specific location and the damage such flooding would incur in terms of reducing mobility levels in the area. A high-risk value is seen as an indication of a high-priority location for investments towards mitigating the negative effects of flooding on urban transport infrastructure.
As previously mentioned, there are no official zone-based or other general traffic volume data available for Accra. For this study, therefore, we model traffic loads on each road segment based on the estimated number of least-cost routes that it is assumed to facilitate. These routes represent trips from homes (origin points) to destinations located both in central Accra, which is a main target for daily commuting, and in other parts of the city, assuming a trip frequency that decays with distance, as discussed further below.
As origin points, we define a set of 884 points, located at network intersections and evenly distributed across the urban area with an average inter-point distance of 1000 m. We aggregate population data to each origin point using enumeration area data from the latest available census (2010). As destinations, we define a set of 68 target points evenly distributed across the city, as well as a separate target point within the central area near Makola Market. The estimation of trip frequency between origin–destination pairs is informed by a mobility survey conducted in four neighbourhoods of Accra, as described further in the next section.

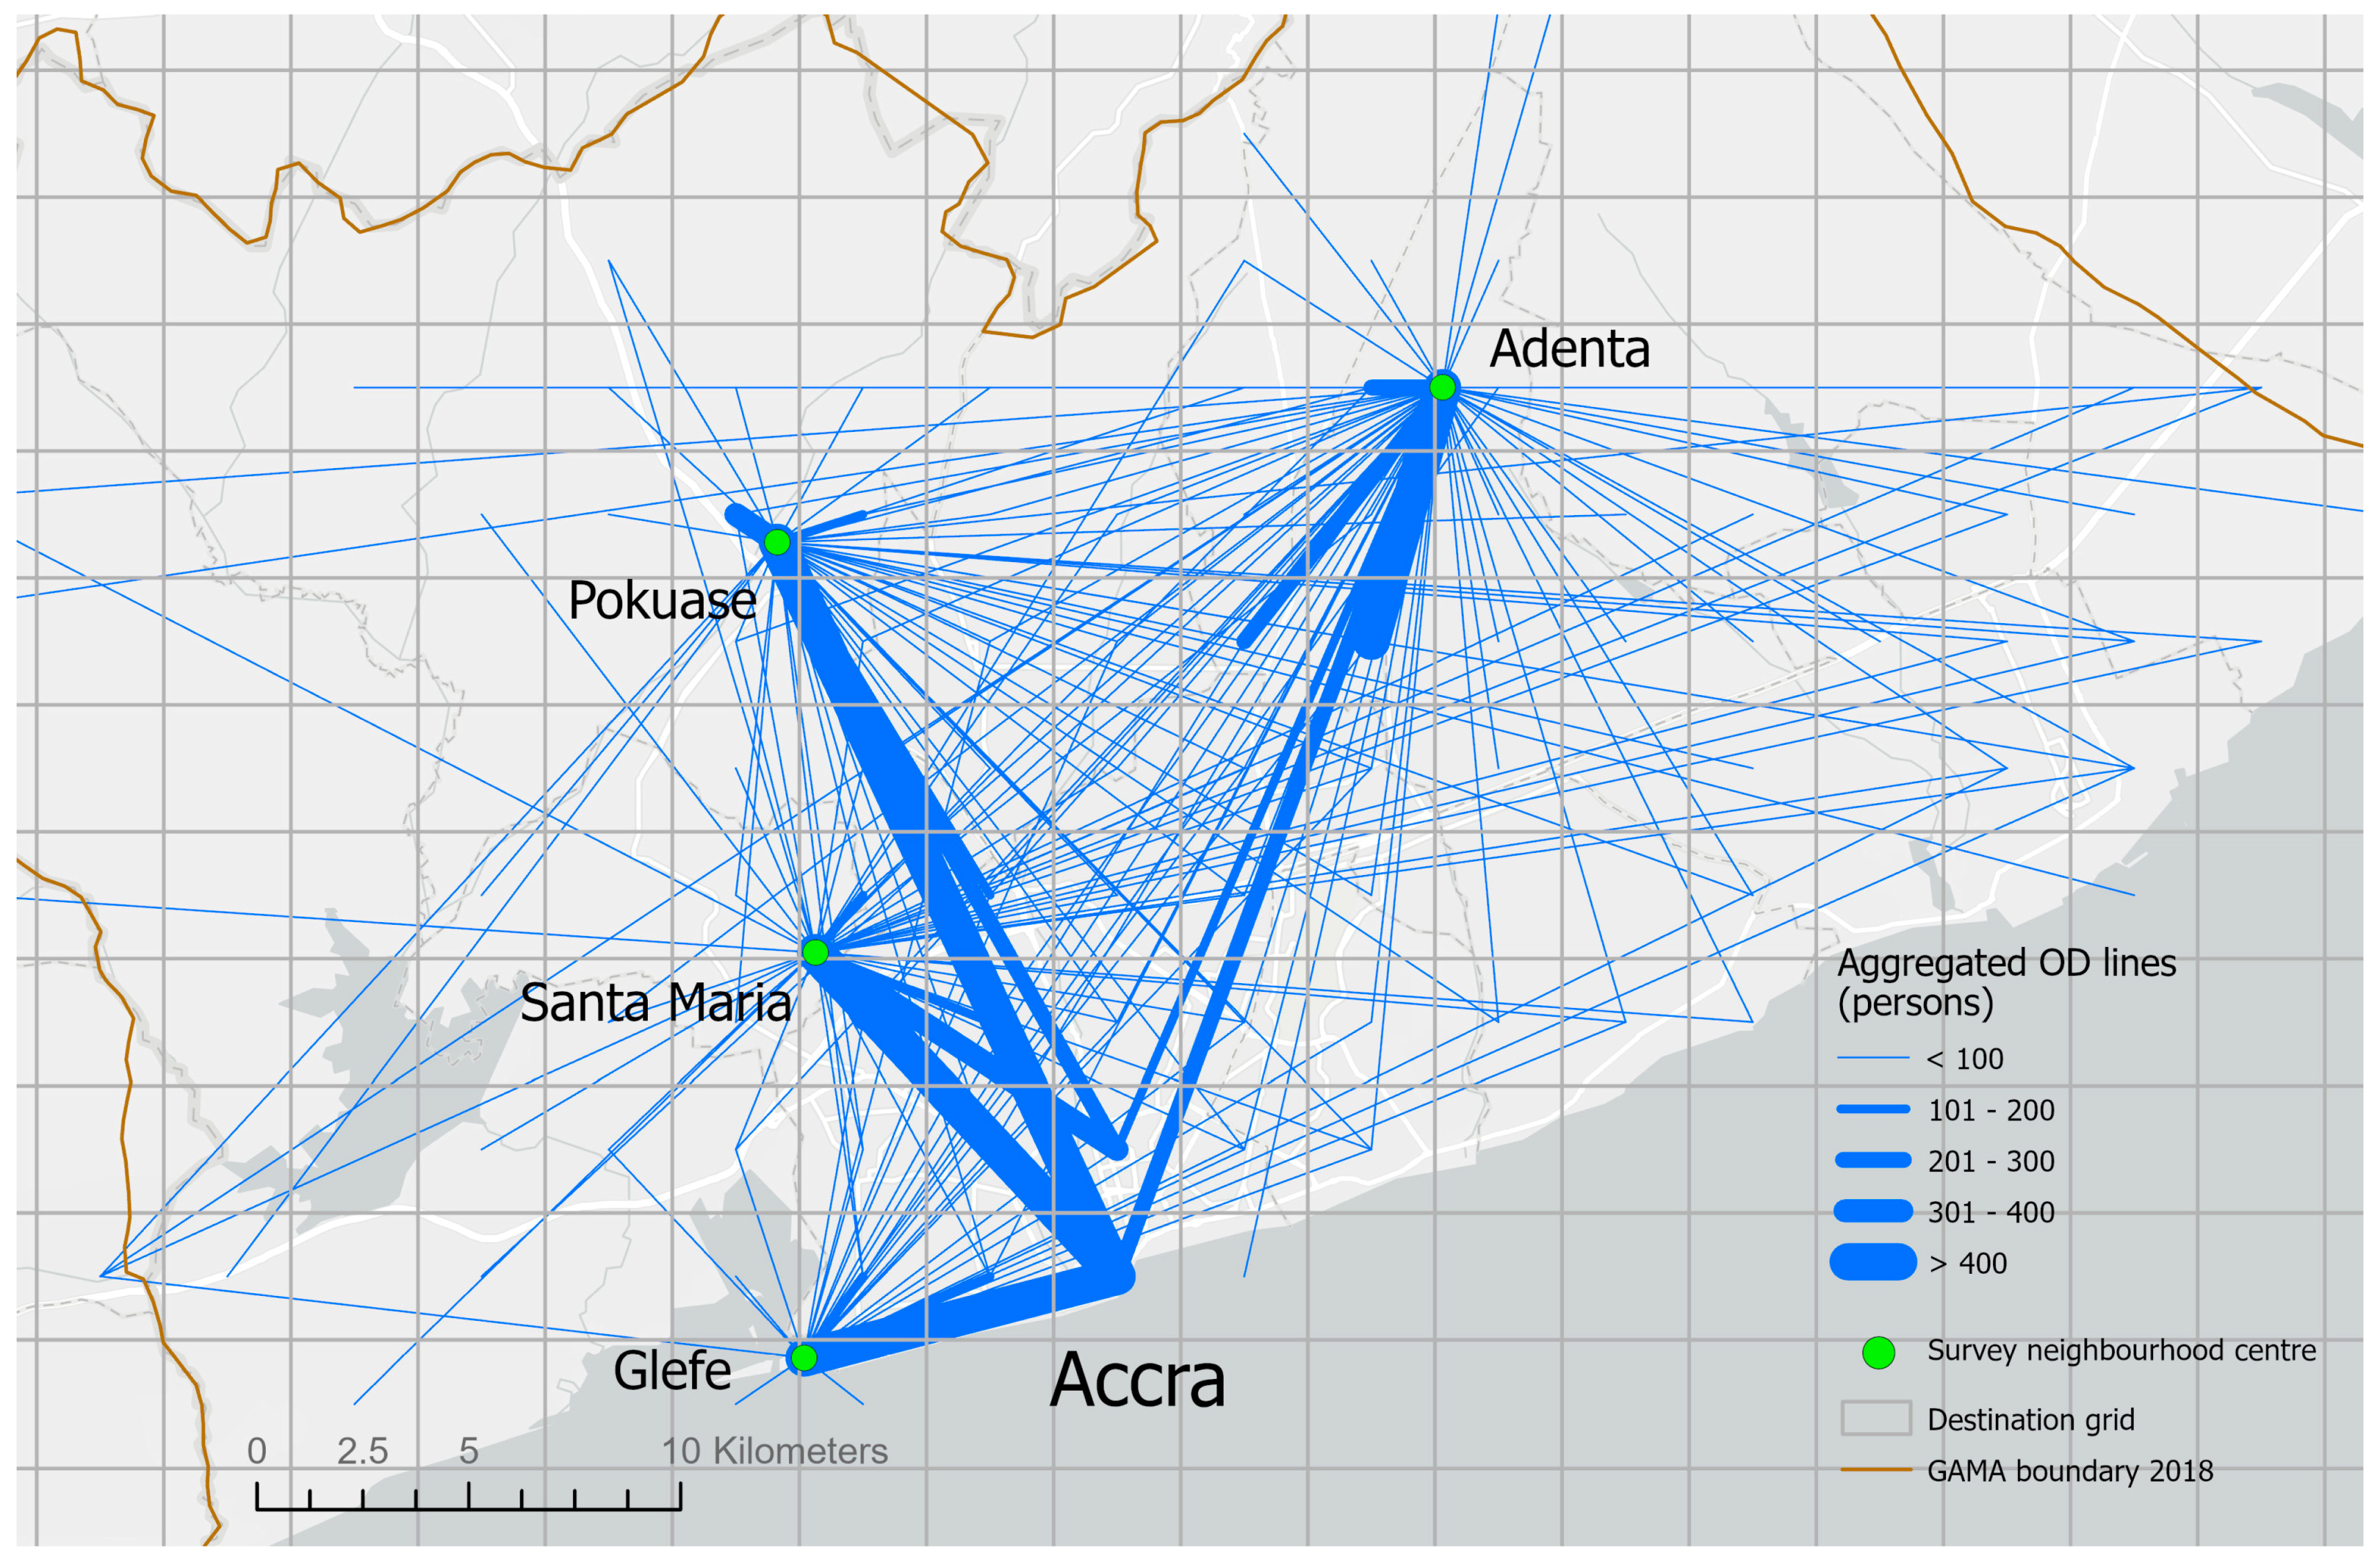
2.1.1. Survey: Mobility and Travel Behaviour

Existing studies and data offer limited evidence of the mobility profile and travel behaviour of Accra’s residents. This implies that there is a lack of spatially explicit information on travel destinations and travel times for everyday commuter trips, despite such information being crucial in the context of transport planning. To obtain data about travel and mobility patterns, a household survey was conducted in July–August 2021 in four neighbourhoods located in Accra’s periphery. Two of these constitute consolidated semi-peripheral neighbourhoods, which were included in the built-up area of Accra between 1990 and 2000, while two constitute newer areas developed after 2000 and located at greater distance from central Accra. Figure 1 depicts the location of neighbourhoods covered by the survey, which deployed random spatial sampling, based on GPS points. Across neighbourhoods, valid responses were obtained from 1053 main respondents and additional information recorded for 1054 other adult household members. We collected spatially explicit information on frequently visited destinations within Accra by recording the place name, nearest landmark, and relevant grid cell number from a 3 km × 3 km grid map of Accra (see also Figure 2). Travel distances and routes were computed as the fastest route between the locations of respondents’ homes and the centroids of the relevant destination cells. Road network data for this purpose were obtained from OpenStreetMap through the OSMnx library [35]. The applied speed data were obtained from a previous study of accessibility levels in Accra [8].

2.1.2. Road-Specific Traffic Volumes

The data obtained from the survey provide some insights into the travel patterns of residents in peripheral areas of Accra. These include the proportion of people traveling for income-generating activities and the ways in which distance influences the propensity of going to specific destinations on a daily or weekly basis. Based on this information, we model two types of distance decay functions. One reflects the proportion of the population that commutes to the central area of Accra, relative to the distance from home (DD1), and the other more generally reflects the proportion of the population of each origin point that will visit a destination point within the whole city area, depending on the distance (DD2). Based on the population data, trip frequency data, and distance decay functions, we can estimate the number of trips taken between all origin and destination points. Further, we apply the network analysis functions of ArcGIS-Pro software version 3.0.3 to calculate the number of least-cost routes between all origin and destination points that will pass through a given segment of the road network. This number will be referred to as the road load.

2.1.3. Flood Model and Precipitation Levels

The probability of flooding of a given road segment to an extent that will influence mobility levels is estimated using a 1d flood screening method that provides flood boundary polygons (hereinafter referred to as bluespots) with depth information following simulated rain events of a specified magnitude. This method uses a 10 m resolution digital terrain model to predict how water will accumulate in sinks as well, as the amount of flow that will occur between the sinks, depending on the magnitude of the simulated rain event. Details of this method are described in Balstrøm and Crawford [36] and Trepekli et al. [37], and the reader is referred to these articles for further information.
The flood model assumes full surface run-off during rain events, and, therefore, considers events of a high intensity and magnitude. Data on daily precipitation levels were examined from weather stations located within the Accra area. The data comprise the period of 2000–2020, but only one station provided data continuously. Generally, due to its location, Accra experiences two rainy seasons: a major one from April to July and a minor one from September to November with higher precipitation levels and more frequent extreme events. It is not possible from the measured rainfall data to identify any clear trends towards higher or lower magnitudes of rain during this period. Moreover, the data report daily precipitation levels and do not provide information about intensity. Kwaku and Duke [38] estimate that a two-year event of single-day rainfall will entail about 80 mm of rain, while a 100-year event entails about 230 mm of rain. For this study, we assume that a rain event providing 60 mm of rain will occur quite frequently and, depending on the extension, produce surface run-off and flooding. Based on Shu et al. [39], a flood depth of 30 cm is applied as the threshold for unimpeded passage for a standard car.

2.1.4. Network Hotspots Causing Mobility Loss

Our aim is to identify road segments with high modelled traffic volumes that are located in flood-prone areas. By combing the road load data with the bluespot depth data, we can identify the network location hotspots that potentially influence mobility most when flooded. This identification of hotspot locations is achieved by converting the road network dataset into a raster dataset with a 10 m cell resolution, similar to the output resolution of the flood-screening model. Bluespot cells with projected depth values above 30 cm are then intersected with road cells, and the locations of maximum road loads are identified and mapped.

2.1.5. Impact on Population

Flooding of the road network locations identified in the previous paragraph will affect the population of Accra differently depending on the location of their residences and trip destinations. In order to map the city areas most affected by flooding at these locations, we analyze trip routes passing by the affected locations and compute for all origin points the fraction of population using this route. This makes it possible to identify the spatial impact of the flooding, as well as the size of the impacted population, in different areas.

2.2. Local-Scale Analysis

This section describes the methodological approach and data requirements for analyzing the potential mobility impacts of heavy rainfall on the accessibility from local, residential areas to main roads with minibus services, with the purpose of identifying the areas that are most affected in terms of reduced access during episodes of flooding.

2.2.1. Access to Main Roads—Impacted Areas

As a first step, we apply network analysis tools to map the shortest routes in no-flood situations from all road network nodes to the nearest network node that represents a main road. The length of this route is stored for each input node. This process is repeated for flood situations using bluespot polygons derived from the flood screening as absolute barriers for routes. By comparing the difference in route length in flood and no-flood situations, we provide an estimation of the relative and absolute mobility loss for each network node. High-impact nodes are subsequently spatially aggregated into polygons that represent areas with a high degree of potential mobility loss.

2.2.2. Hotspots Causing Local Mobility Loss

To identify the local bluespots that are most prominent in reducing local mobility levels during flooding, we compute the betweenness centrality of road network nodes considering only routes between points in a regular grid within the high-impact areas and going to the nearest main road. We select an inter-point distance of 100 m between origin points in the grid, reflecting the average shortest distance between node points in the local road network. We can then calculate the number of local routes from the grid points to the nearest road that would pass through each bluespot in no-flood situations. This will provide an estimation of the size of the area served by routes through the bluespot and, thereby, an indication of the criticality of the bluespot for reducing local accessibility when flooded.

3. Results

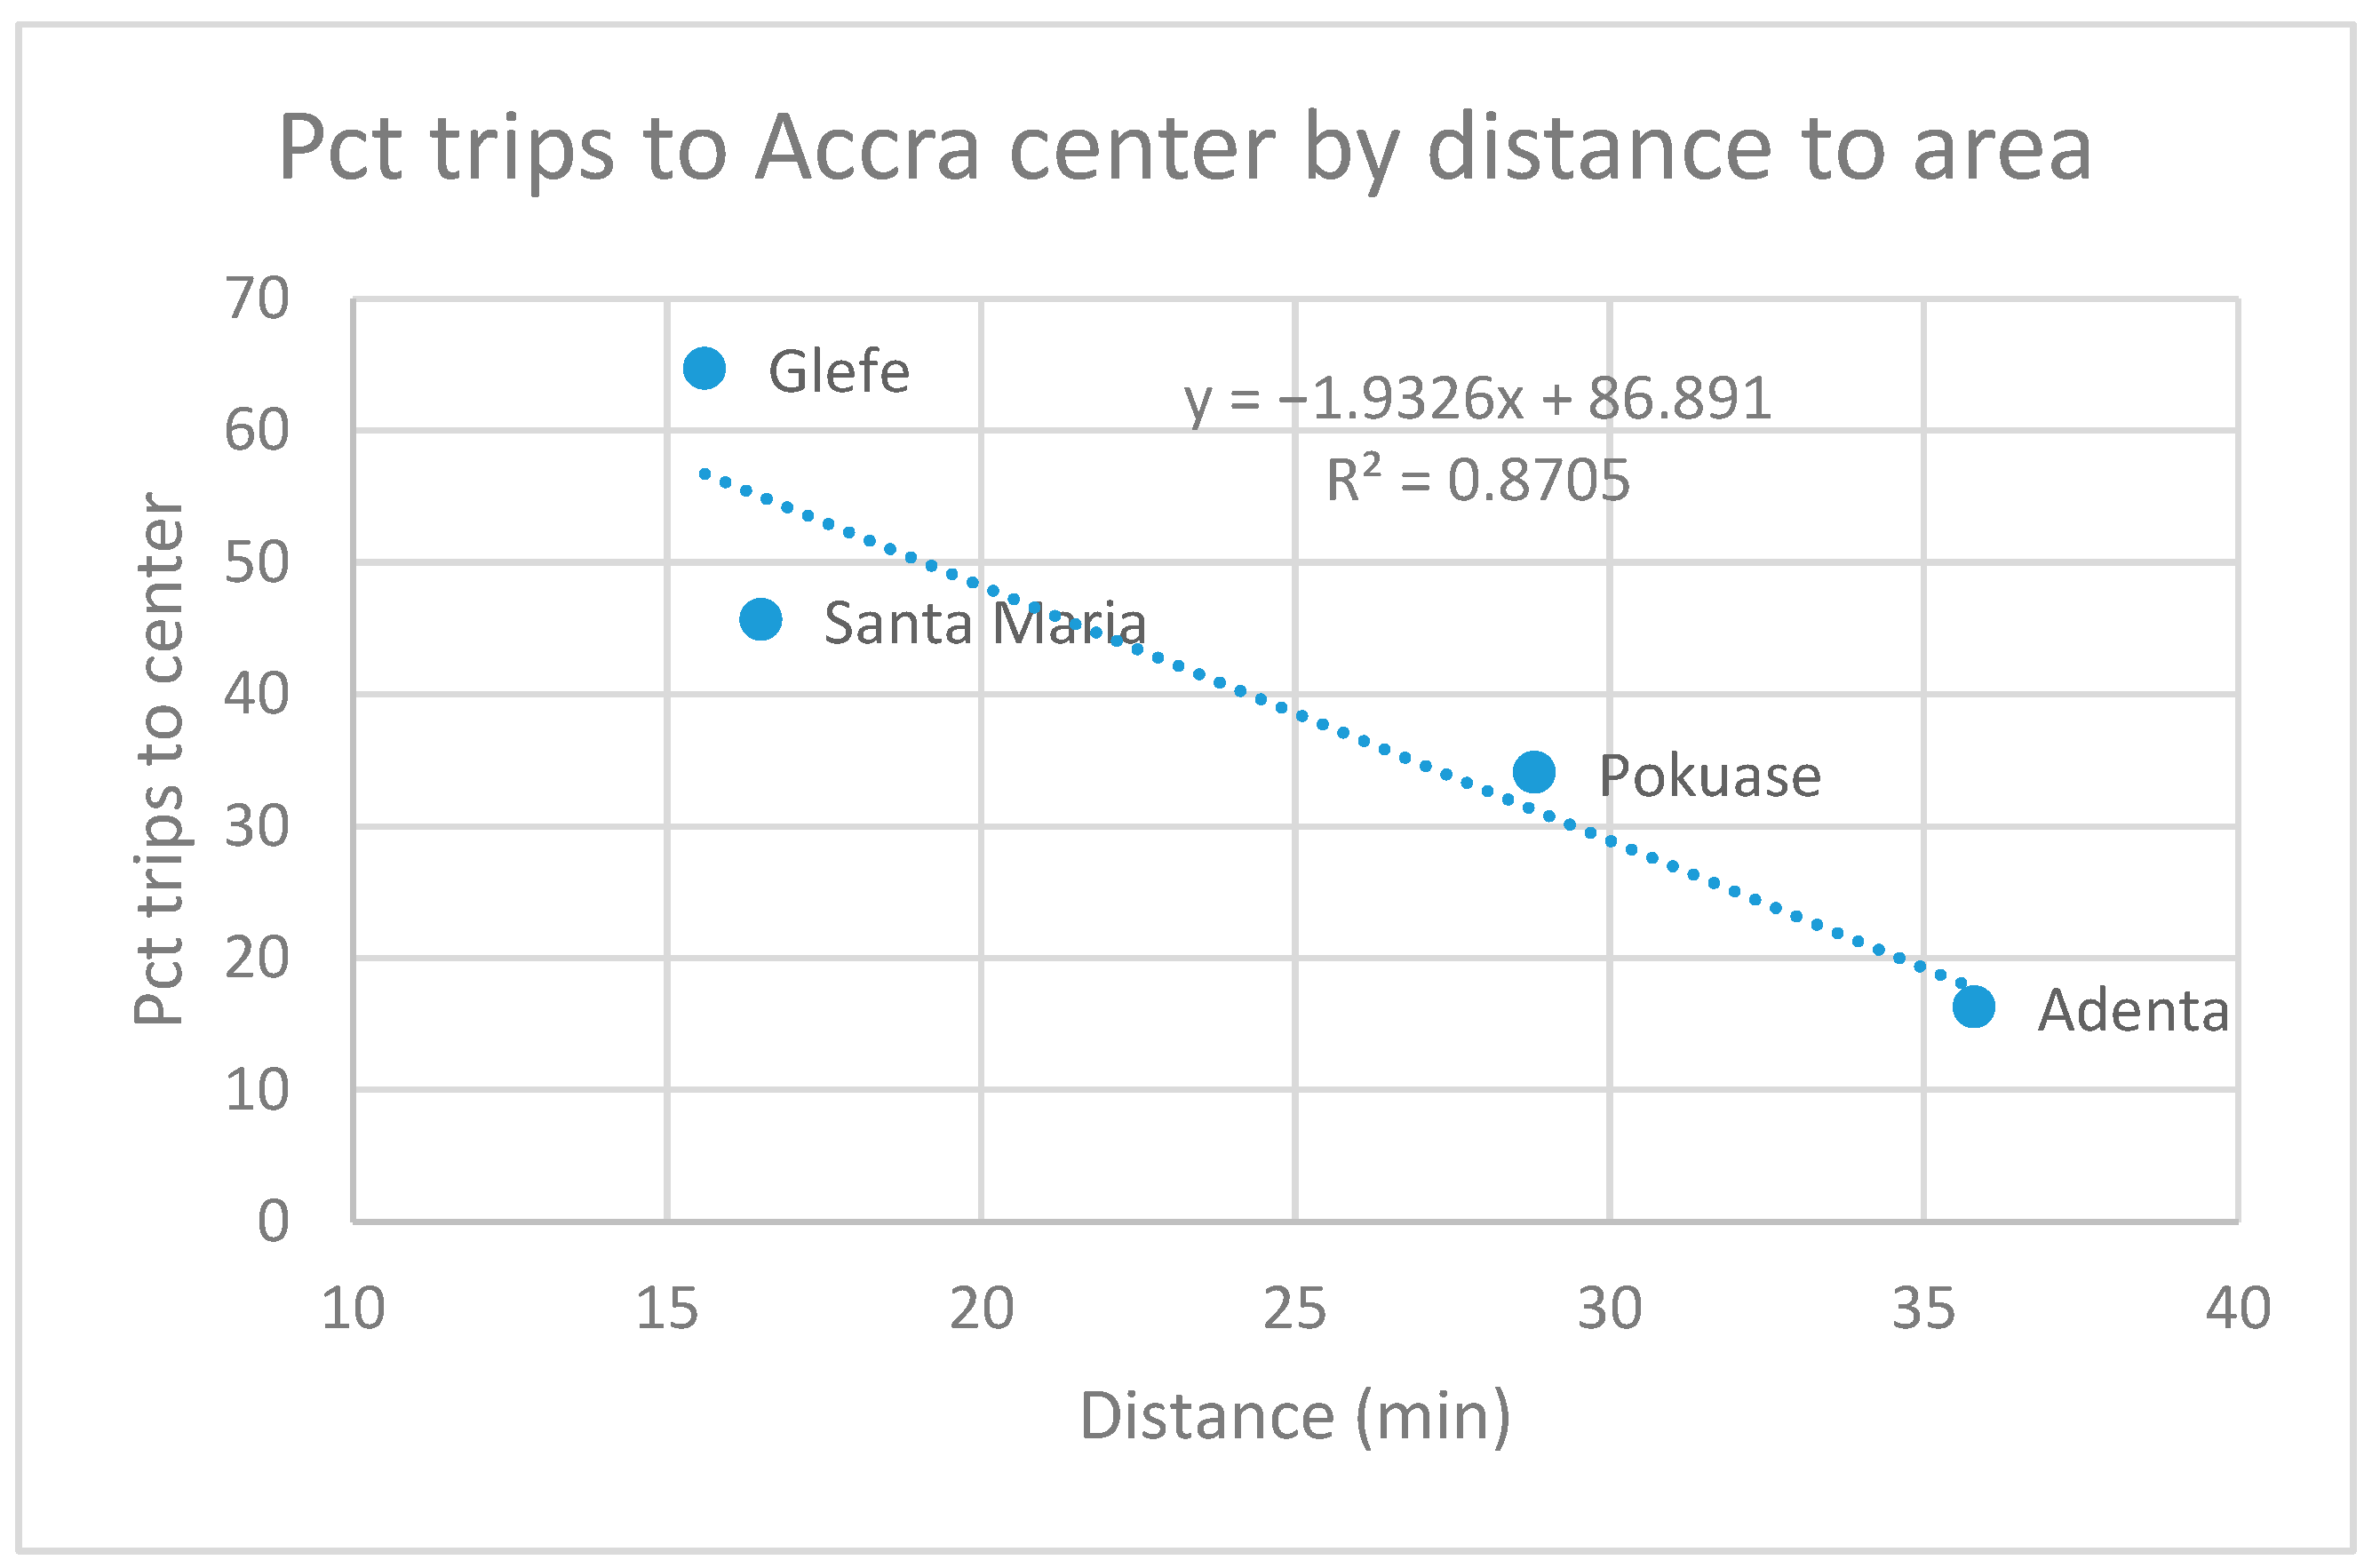
3.1. Mobility Survey Results

The survey provided data about the frequency of trips within the Accra area related to income-generating activities. A total of 1844 persons were characterized as “mobile” in the sense that they were travelling more than once per week for this purpose. Based on data on average household size (see Table 2), we calculated the overall percentage of persons who were mobile as 36.78% of the total population.
Out of the 1844 mobile persons, 1531 persons reported the location cell of a specific destination that was visited frequently. Figure 2 shows the home neighbourhood location, as well as the location of the most frequently visited destination cell, when travelling for income-generating activities. For the analysis, the origin–destination relation reported for a responding person is weighted by the number of times per week the trip is undertaken.
As depicted in Figure 3, the proportion of trips originating from the nearest neighbourhood, Glefe, and heading towards the city centre is approximately 65%. This neighbourhood is situated around 16 min away from the centre by car via the road network during non-rush hours. On the other hand, in the farthest neighbourhood, Adenta, situated approximately 36 min away, the percentage of trips to the centre drops to around 16%. The relationship between the distance to the centre and the percentage of trips is modelled as a linear distance decay function (DD1), which is employed in the city-wide transport model (see Figure 3).
Furthermore, an analysis was conducted on the overall relationship between trip distance to destination points and the number of trips heading towards those locations, when excluding trips bound for central areas (refer to Figure 4). Among all trips of this nature that exceed a 5 min duration, it is observed that only 11% extend beyond 20 min. The connection between the time distance from the origin to the destination and the percentage of trips can be represented by an exponential distance decay curve (DD2), as illustrated in Figure 4.

3.2. Hotspots Causing Mobility Loss (City Scale)

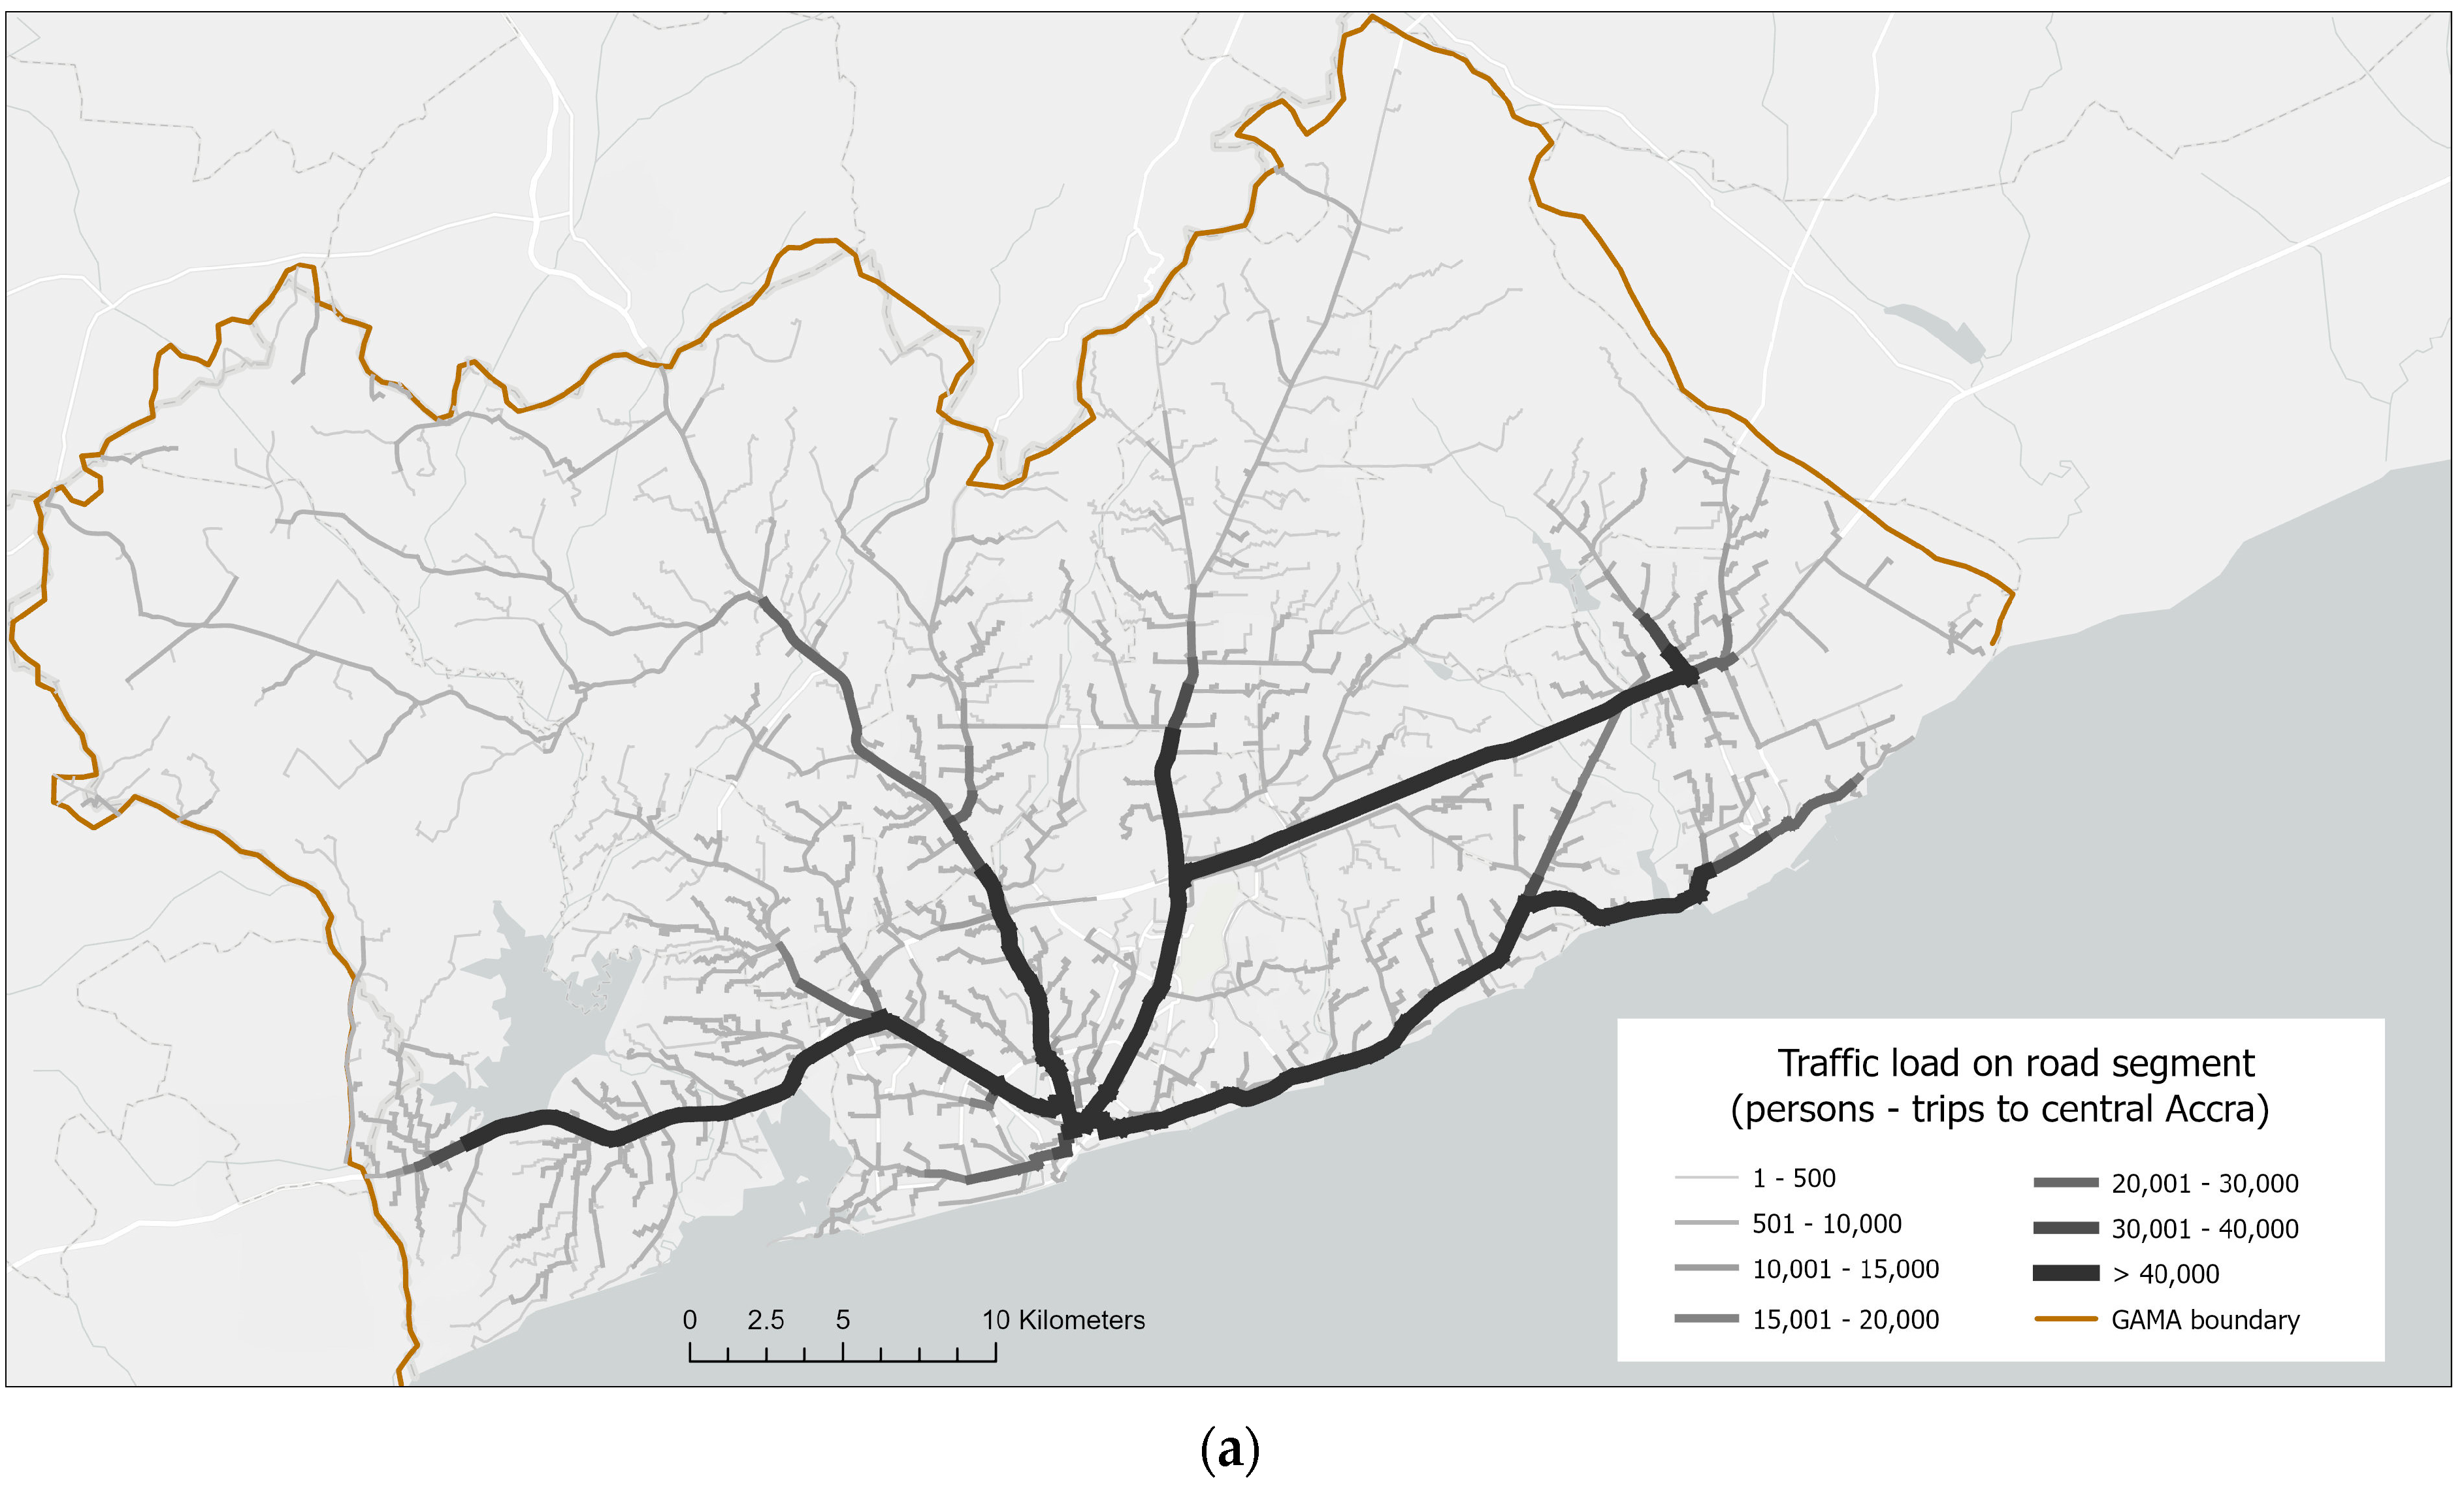
3.2.1. Transport Model

Following the methodology described in the previous section, we modelled the importance of a road segment as the number of least-cost routes passing through this segment. Using the DD1 function, the percentage of mobile persons, and the population dataset, we first established the road load created by trips to the city centre. This is visualized in Figure 5a.
We subsequently modelled road load from non-centre trips using the DD2 function (Figure 5b), and merged the two datasets to provide the final, citywide road load model (Figure 5c).

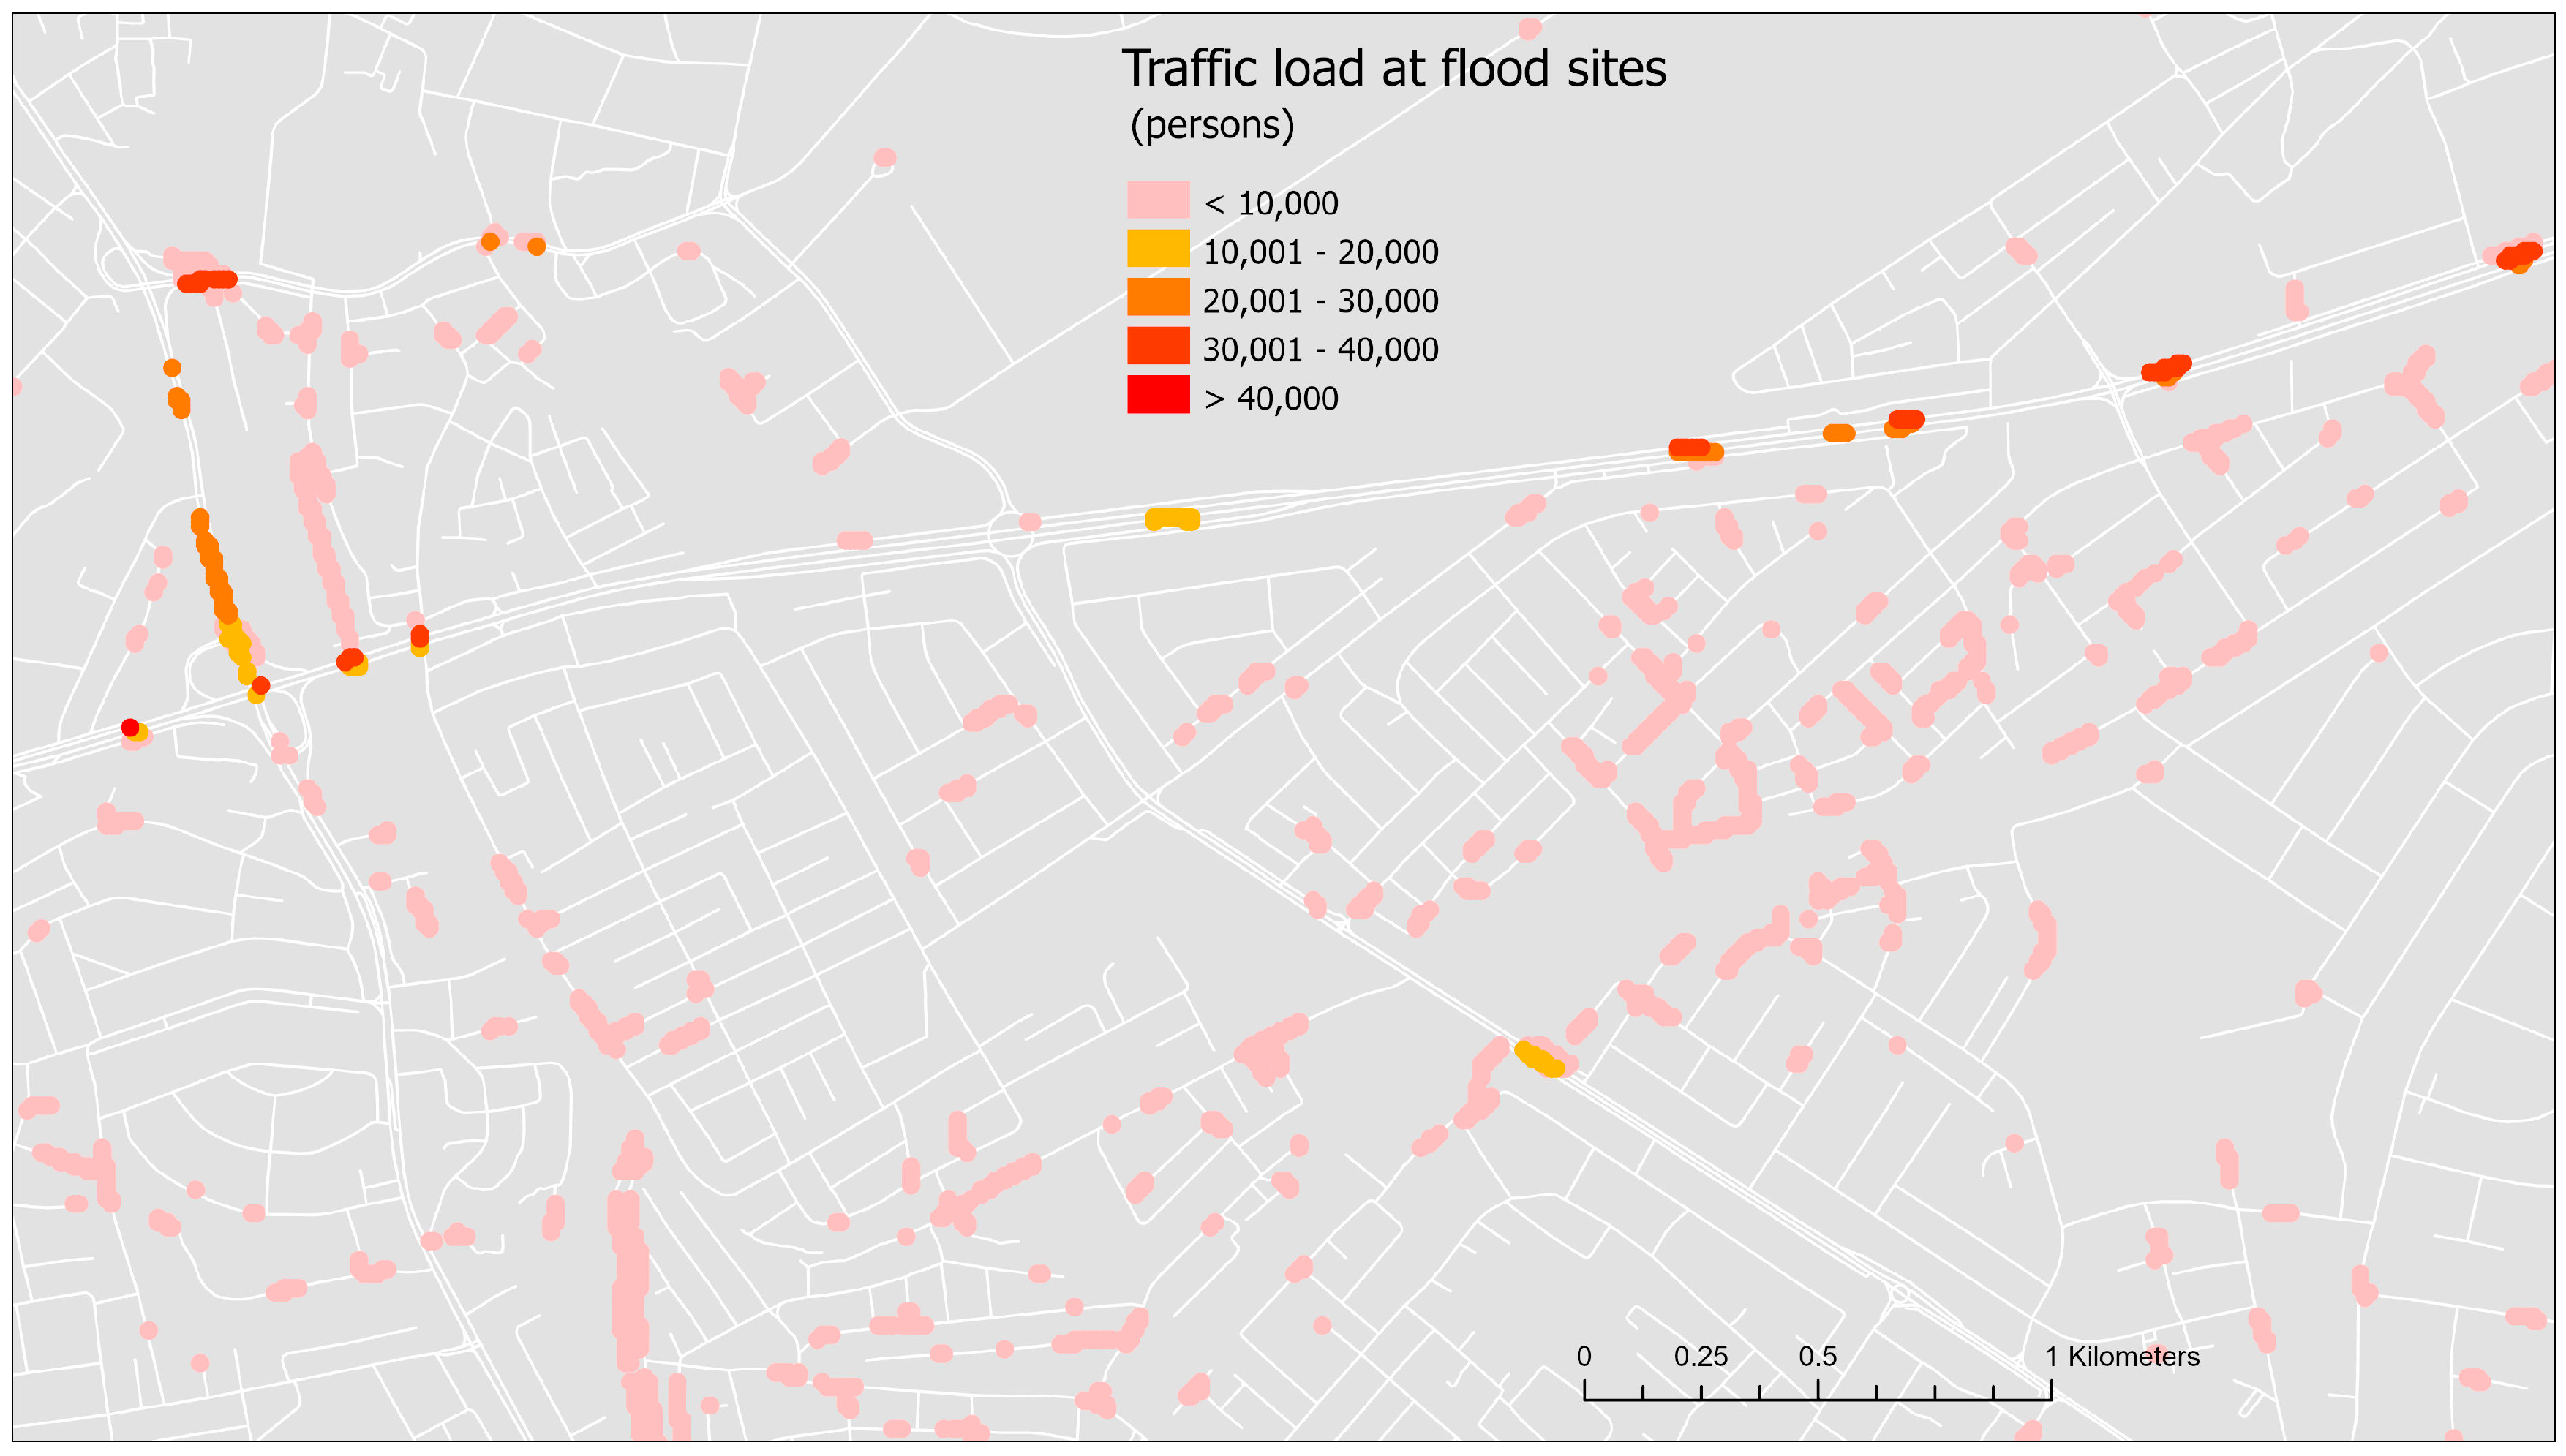
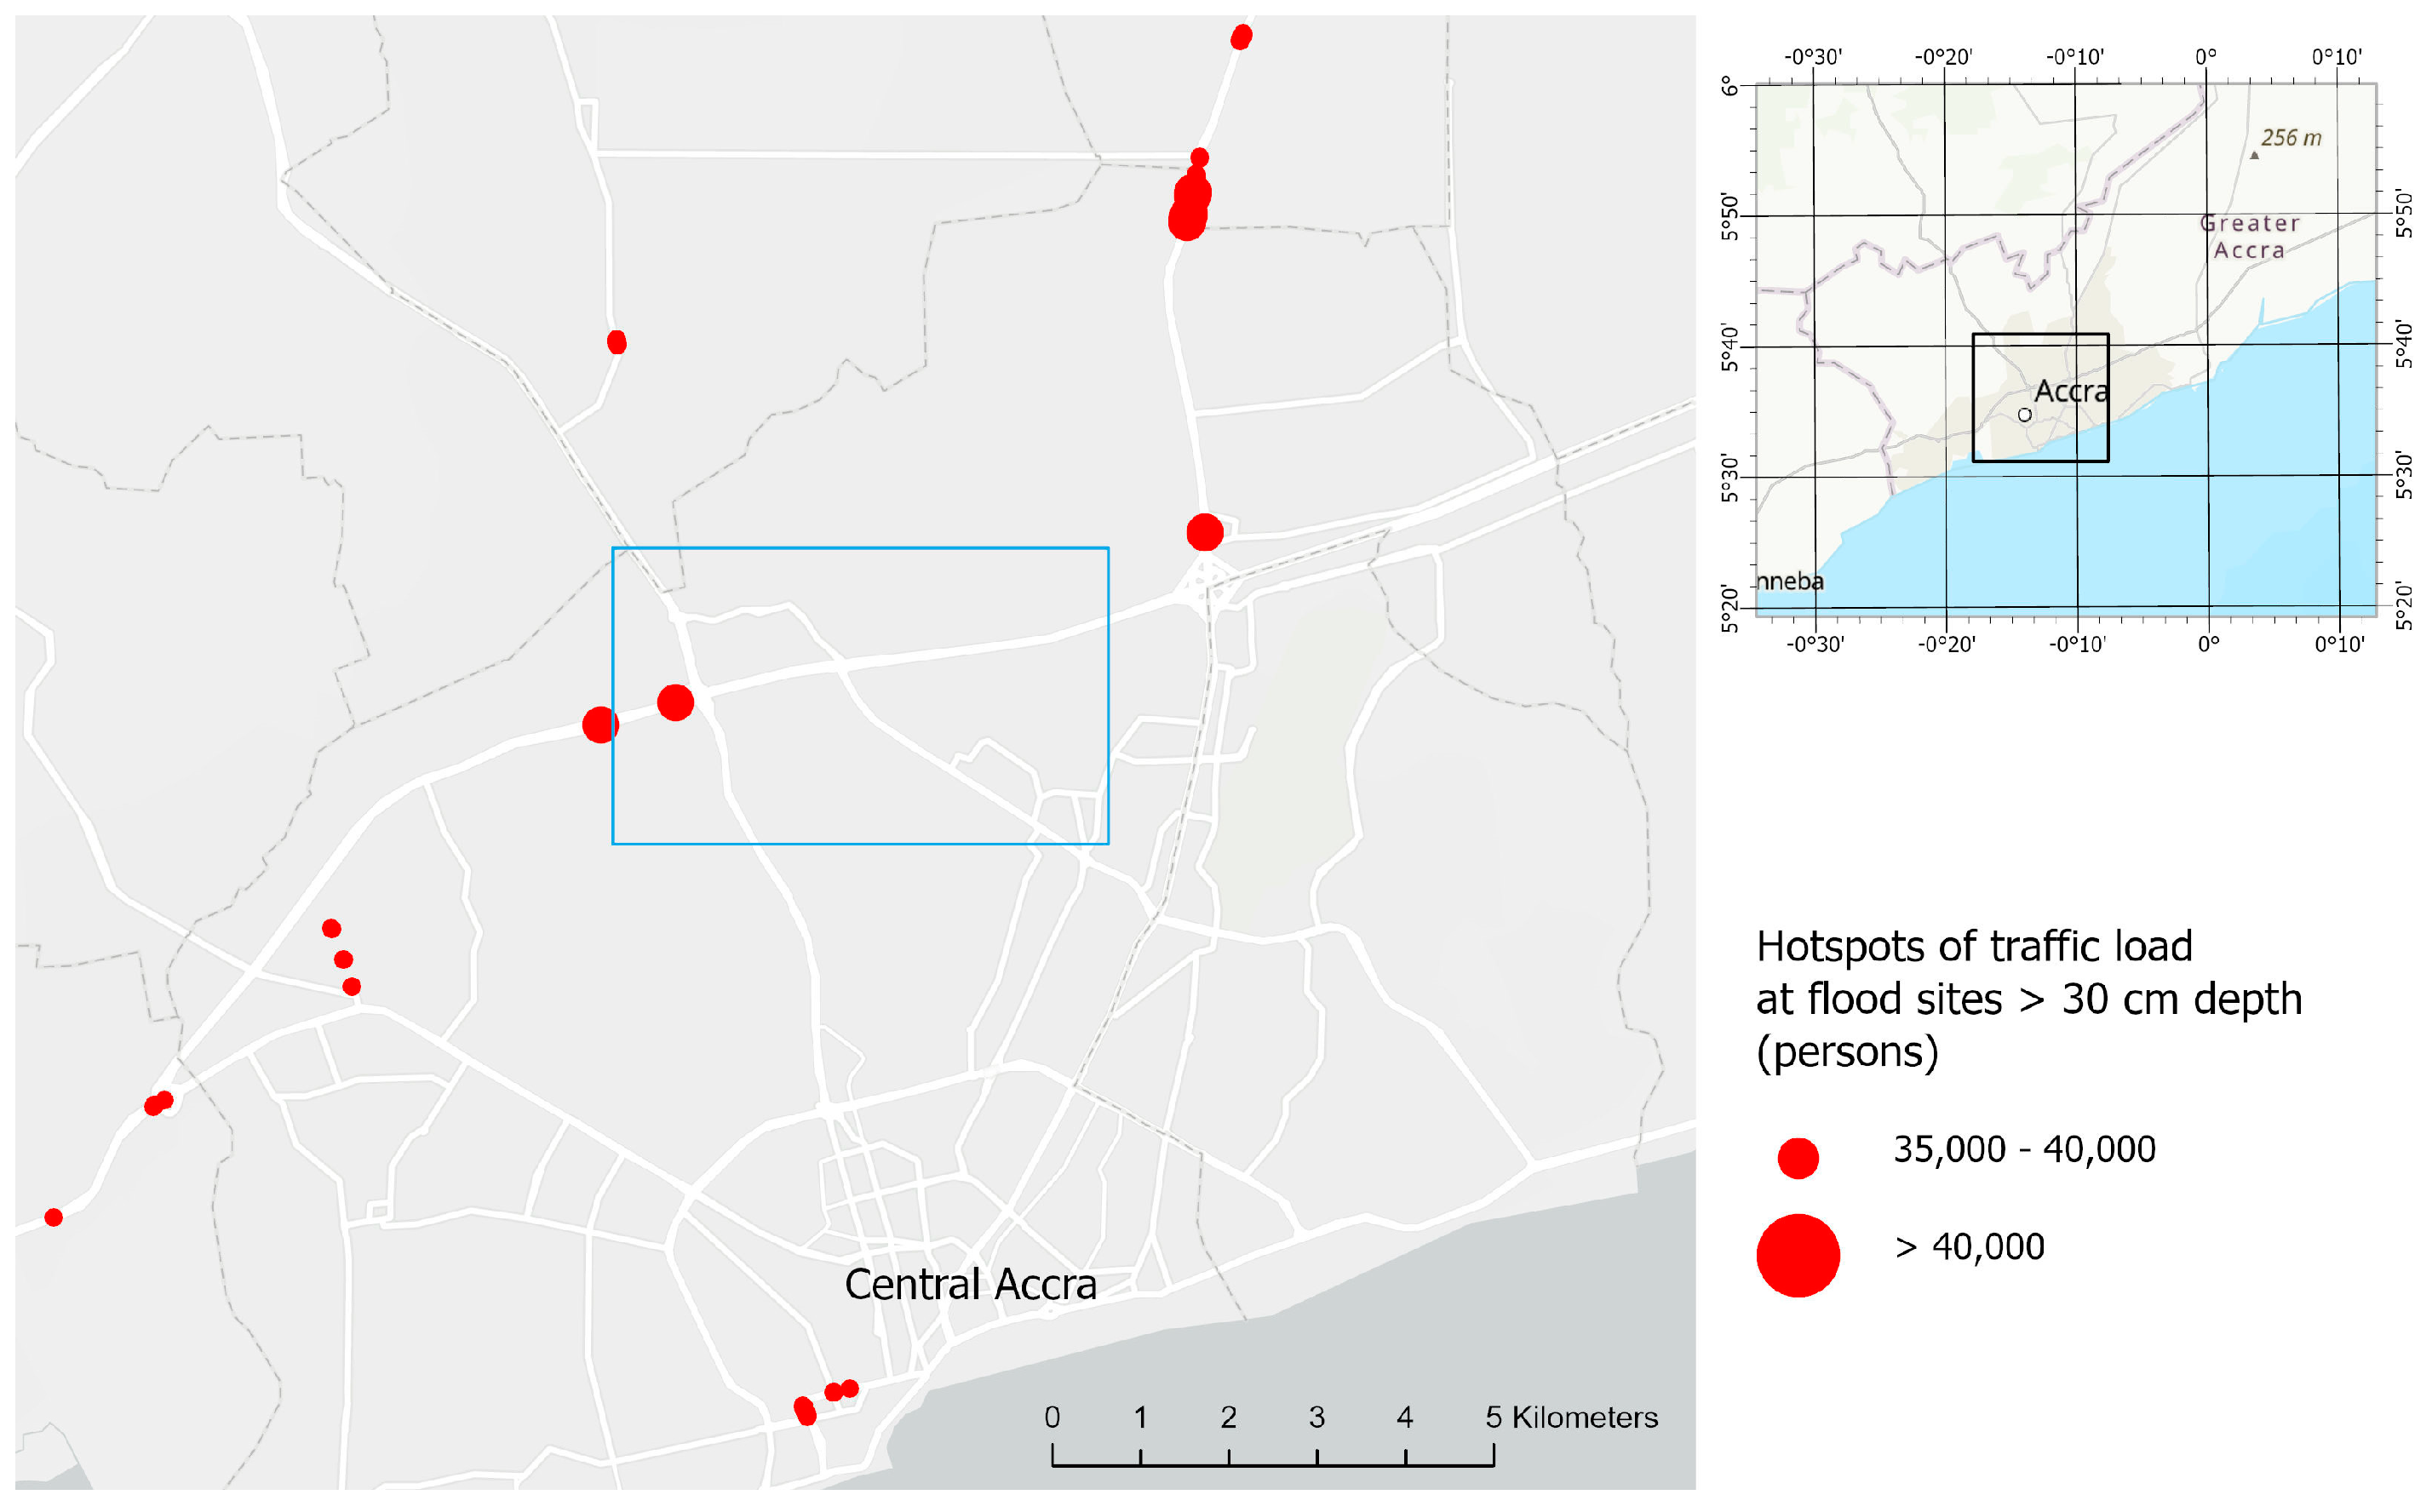
3.2.2. Intersections of High-Volume Roads and Bluespot Locations

The traffic load model was intersected with the previously described bluespot data using as raster-based approach (10 m cells). The purpose was to identify hotspot location that will have a strong negative impact on overall mobility if flooded. Figure 6 illustrates the traffic load of all roads that cross bluespot polygons for an area north of the centre, while Figure 7 illustrates hotspot locations with expected flood depths exceeding 30 cm and high traffic volumes.

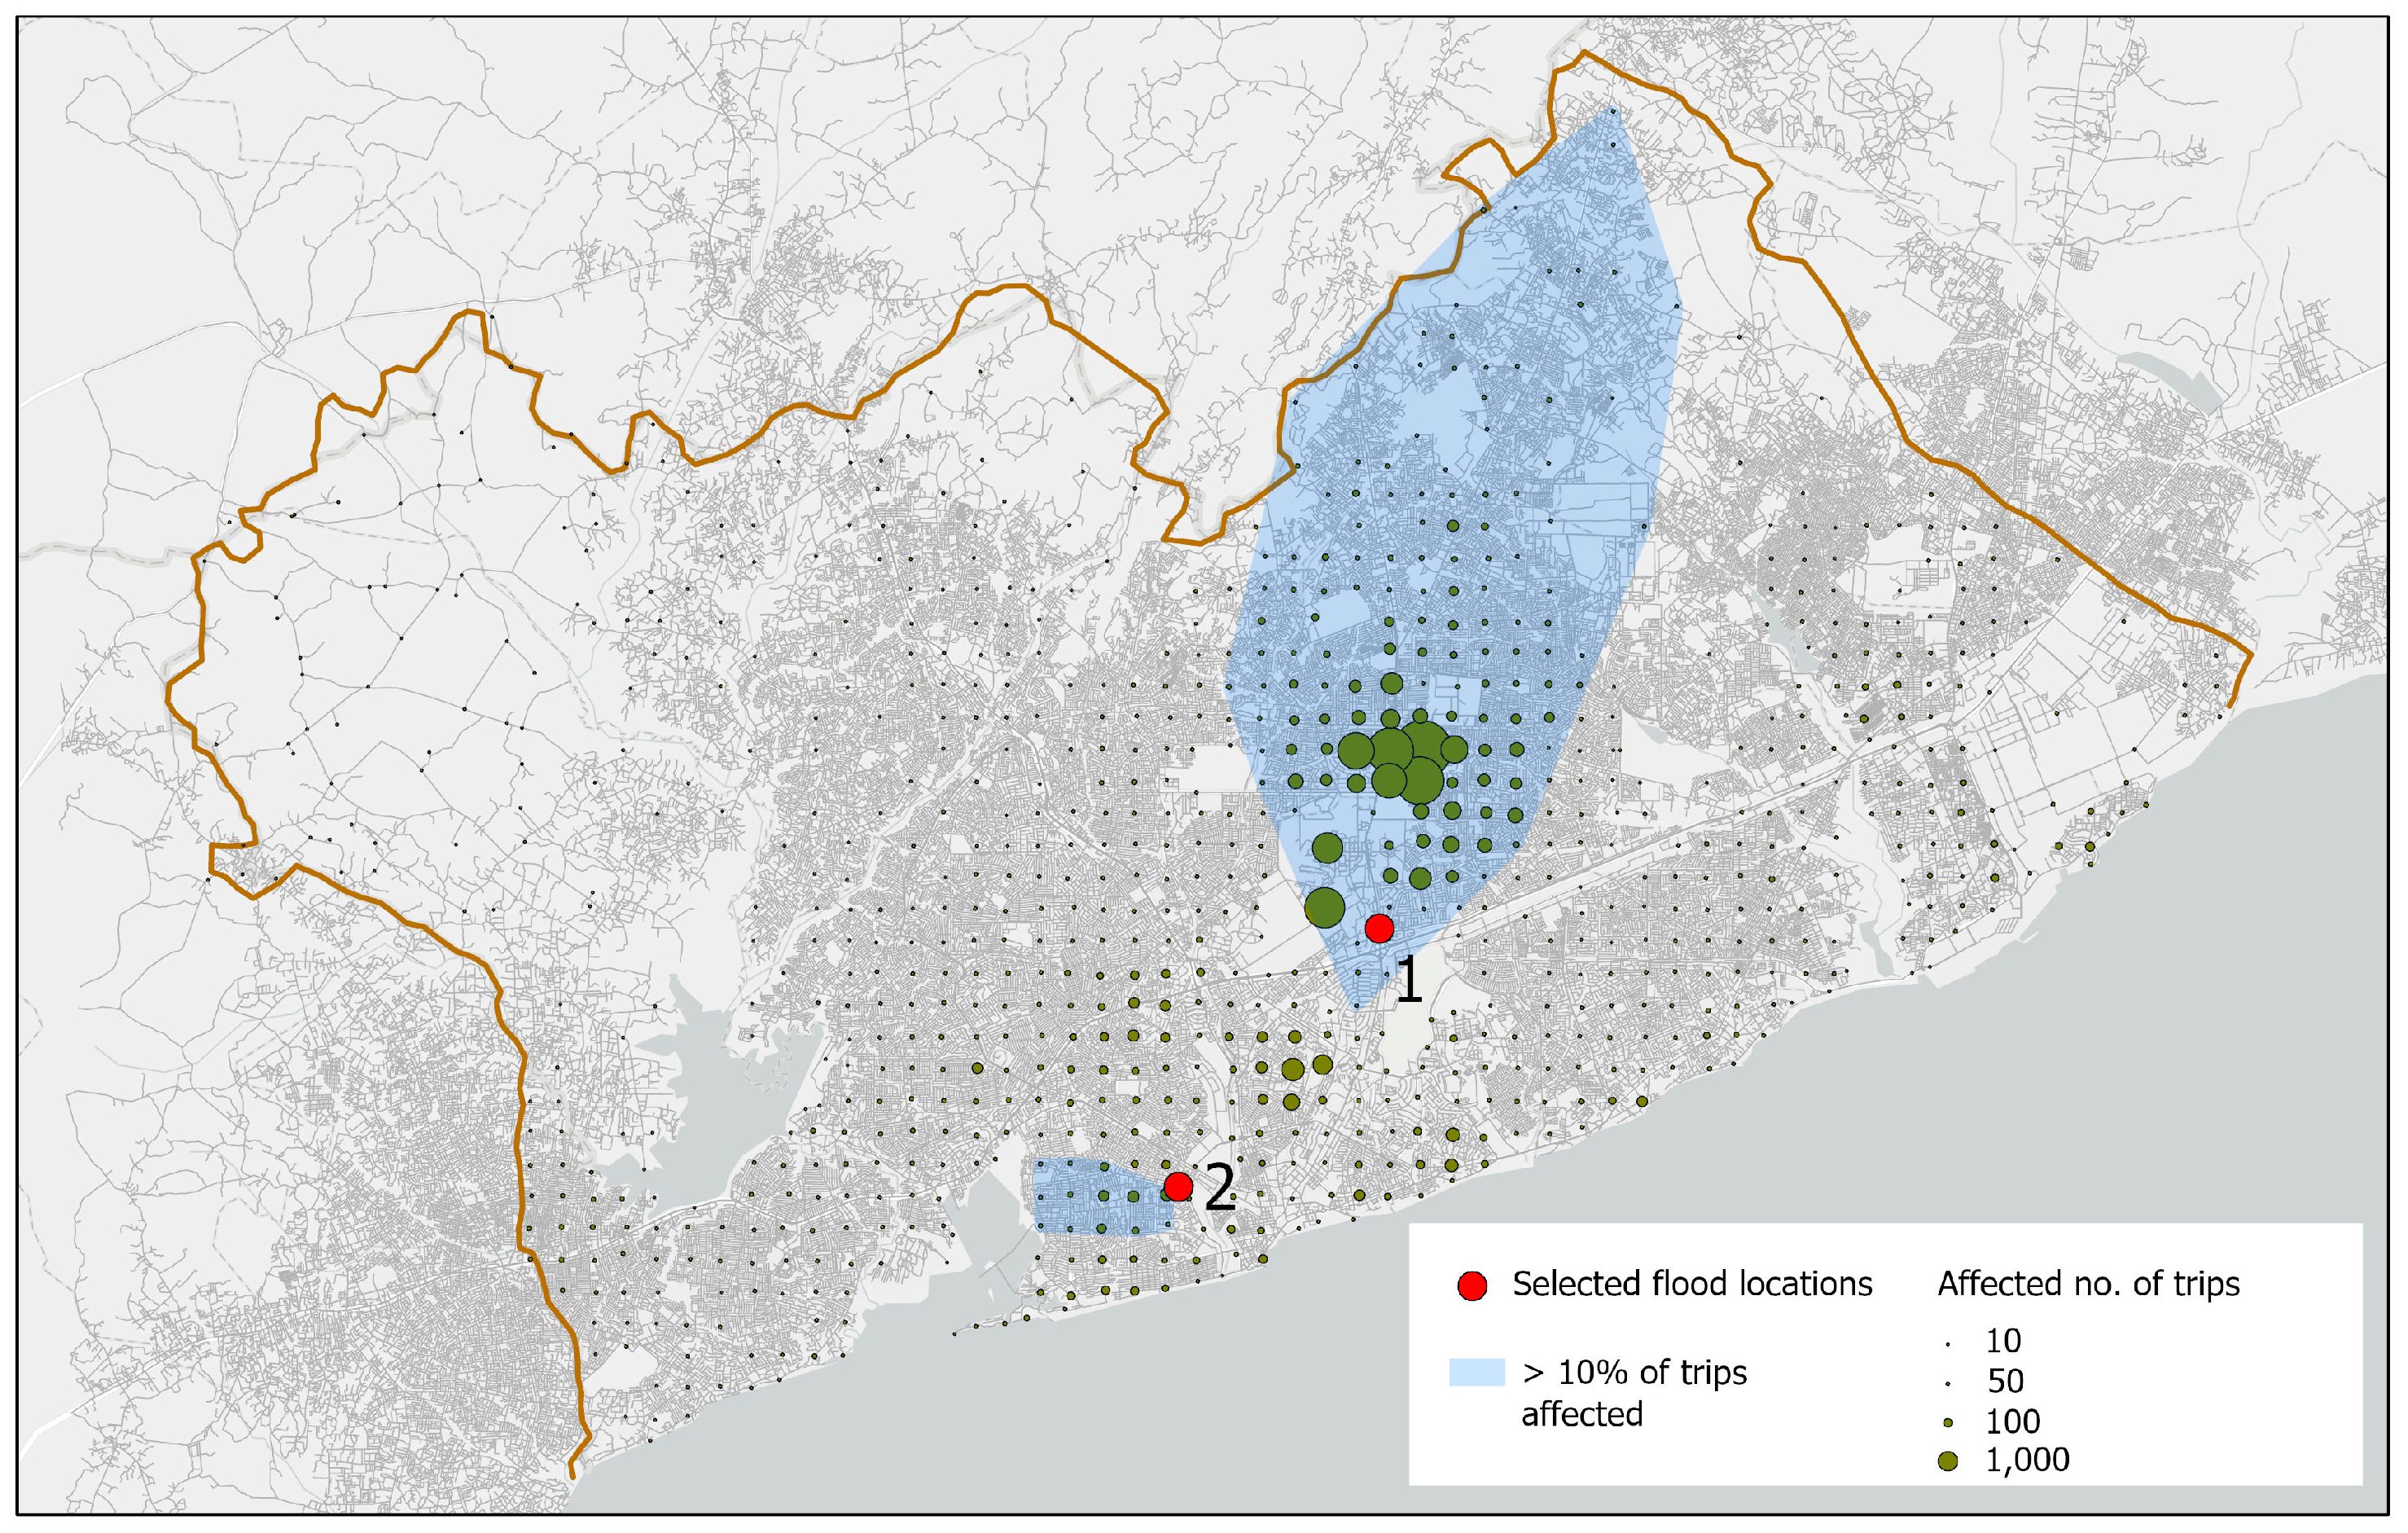
3.3. Spatial Distribution of Mobility Loss (City Scale)

The spatial distribution of the potential mobility loss generated by two hotspots identified in the previous section is shown in Figure 8 to exemplify the information provided by the analysis. Due to the characteristics of the transport model, all population points will be affected to some extent, but the magnitude of this impact will depend on their location relative to the hotspot. We analyzed the OD-trips that pass through the selected hotspot individually, by breaking down the total traffic load value to determine the contribution from each origin point. This analysis enables us to identify both the spatial extent of the flooding’s impact and the affected population size in various areas. Figure 8 shows the areas of maximum impact where more than 10% of the trips from a population point are potentially affected and illustrates the absolute number of trips from each origin point that will be affected by flooding at this location.

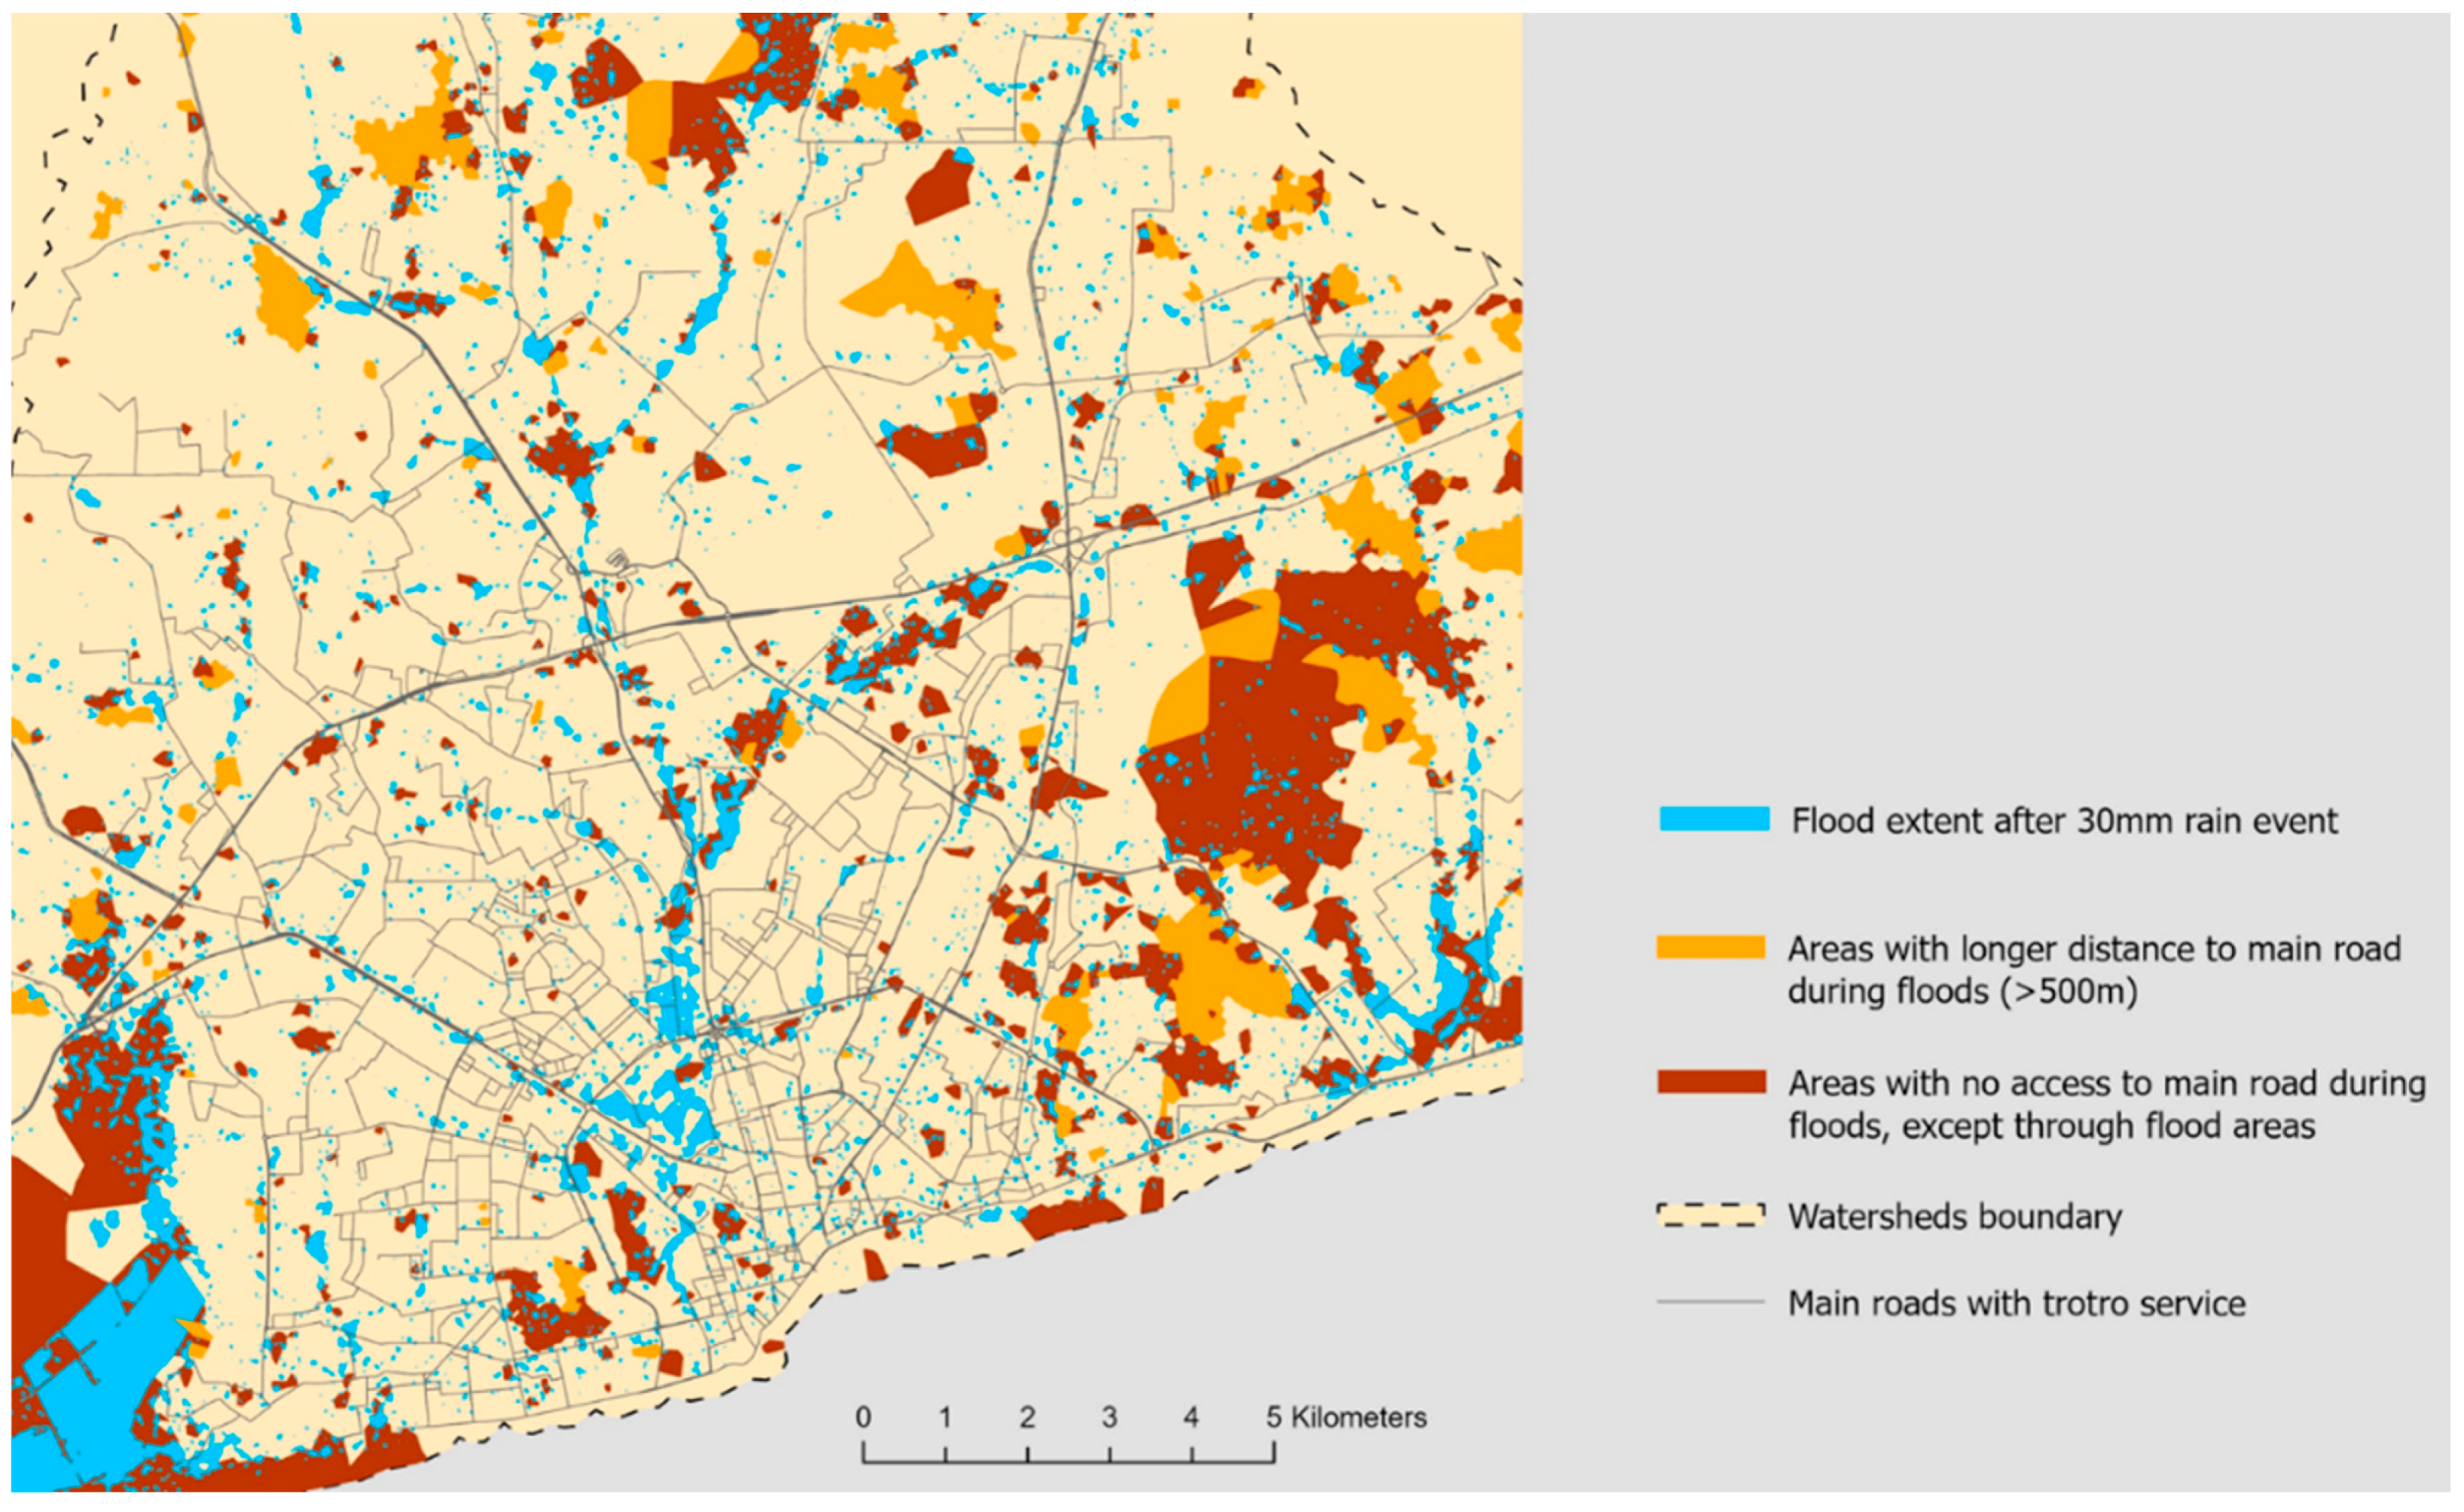
3.4. Spatial Distribution of Mobility Loss (Local Scale)

In contrast to the previous discussion on city-wide mobility regarding daily trips for income-generating activities, the subsequent paragraphs focus on local mobility and address the issue of neighbourhoods being cut off from the main road network due to floods. Utilizing the methodology outlined in Section 2.2.1 and Section 2.2.2, we mapped the areas that experience complete isolation from the primary roads or face reduced accessibility due to longer travel distances. It is important to clarify that within this context, the concept of isolation does not necessarily imply complete inaccessibility, but rather, suggests that residents would need to navigate through flooded areas to reach the main road. The flood scenario considered in the analysis corresponds to a rainfall event of 30 mm. Figure 9 depicts the outcomes of the network-based accessibility analysis, using main roads with minibus services as destinations and considering all nodes of the road network as the origin points.

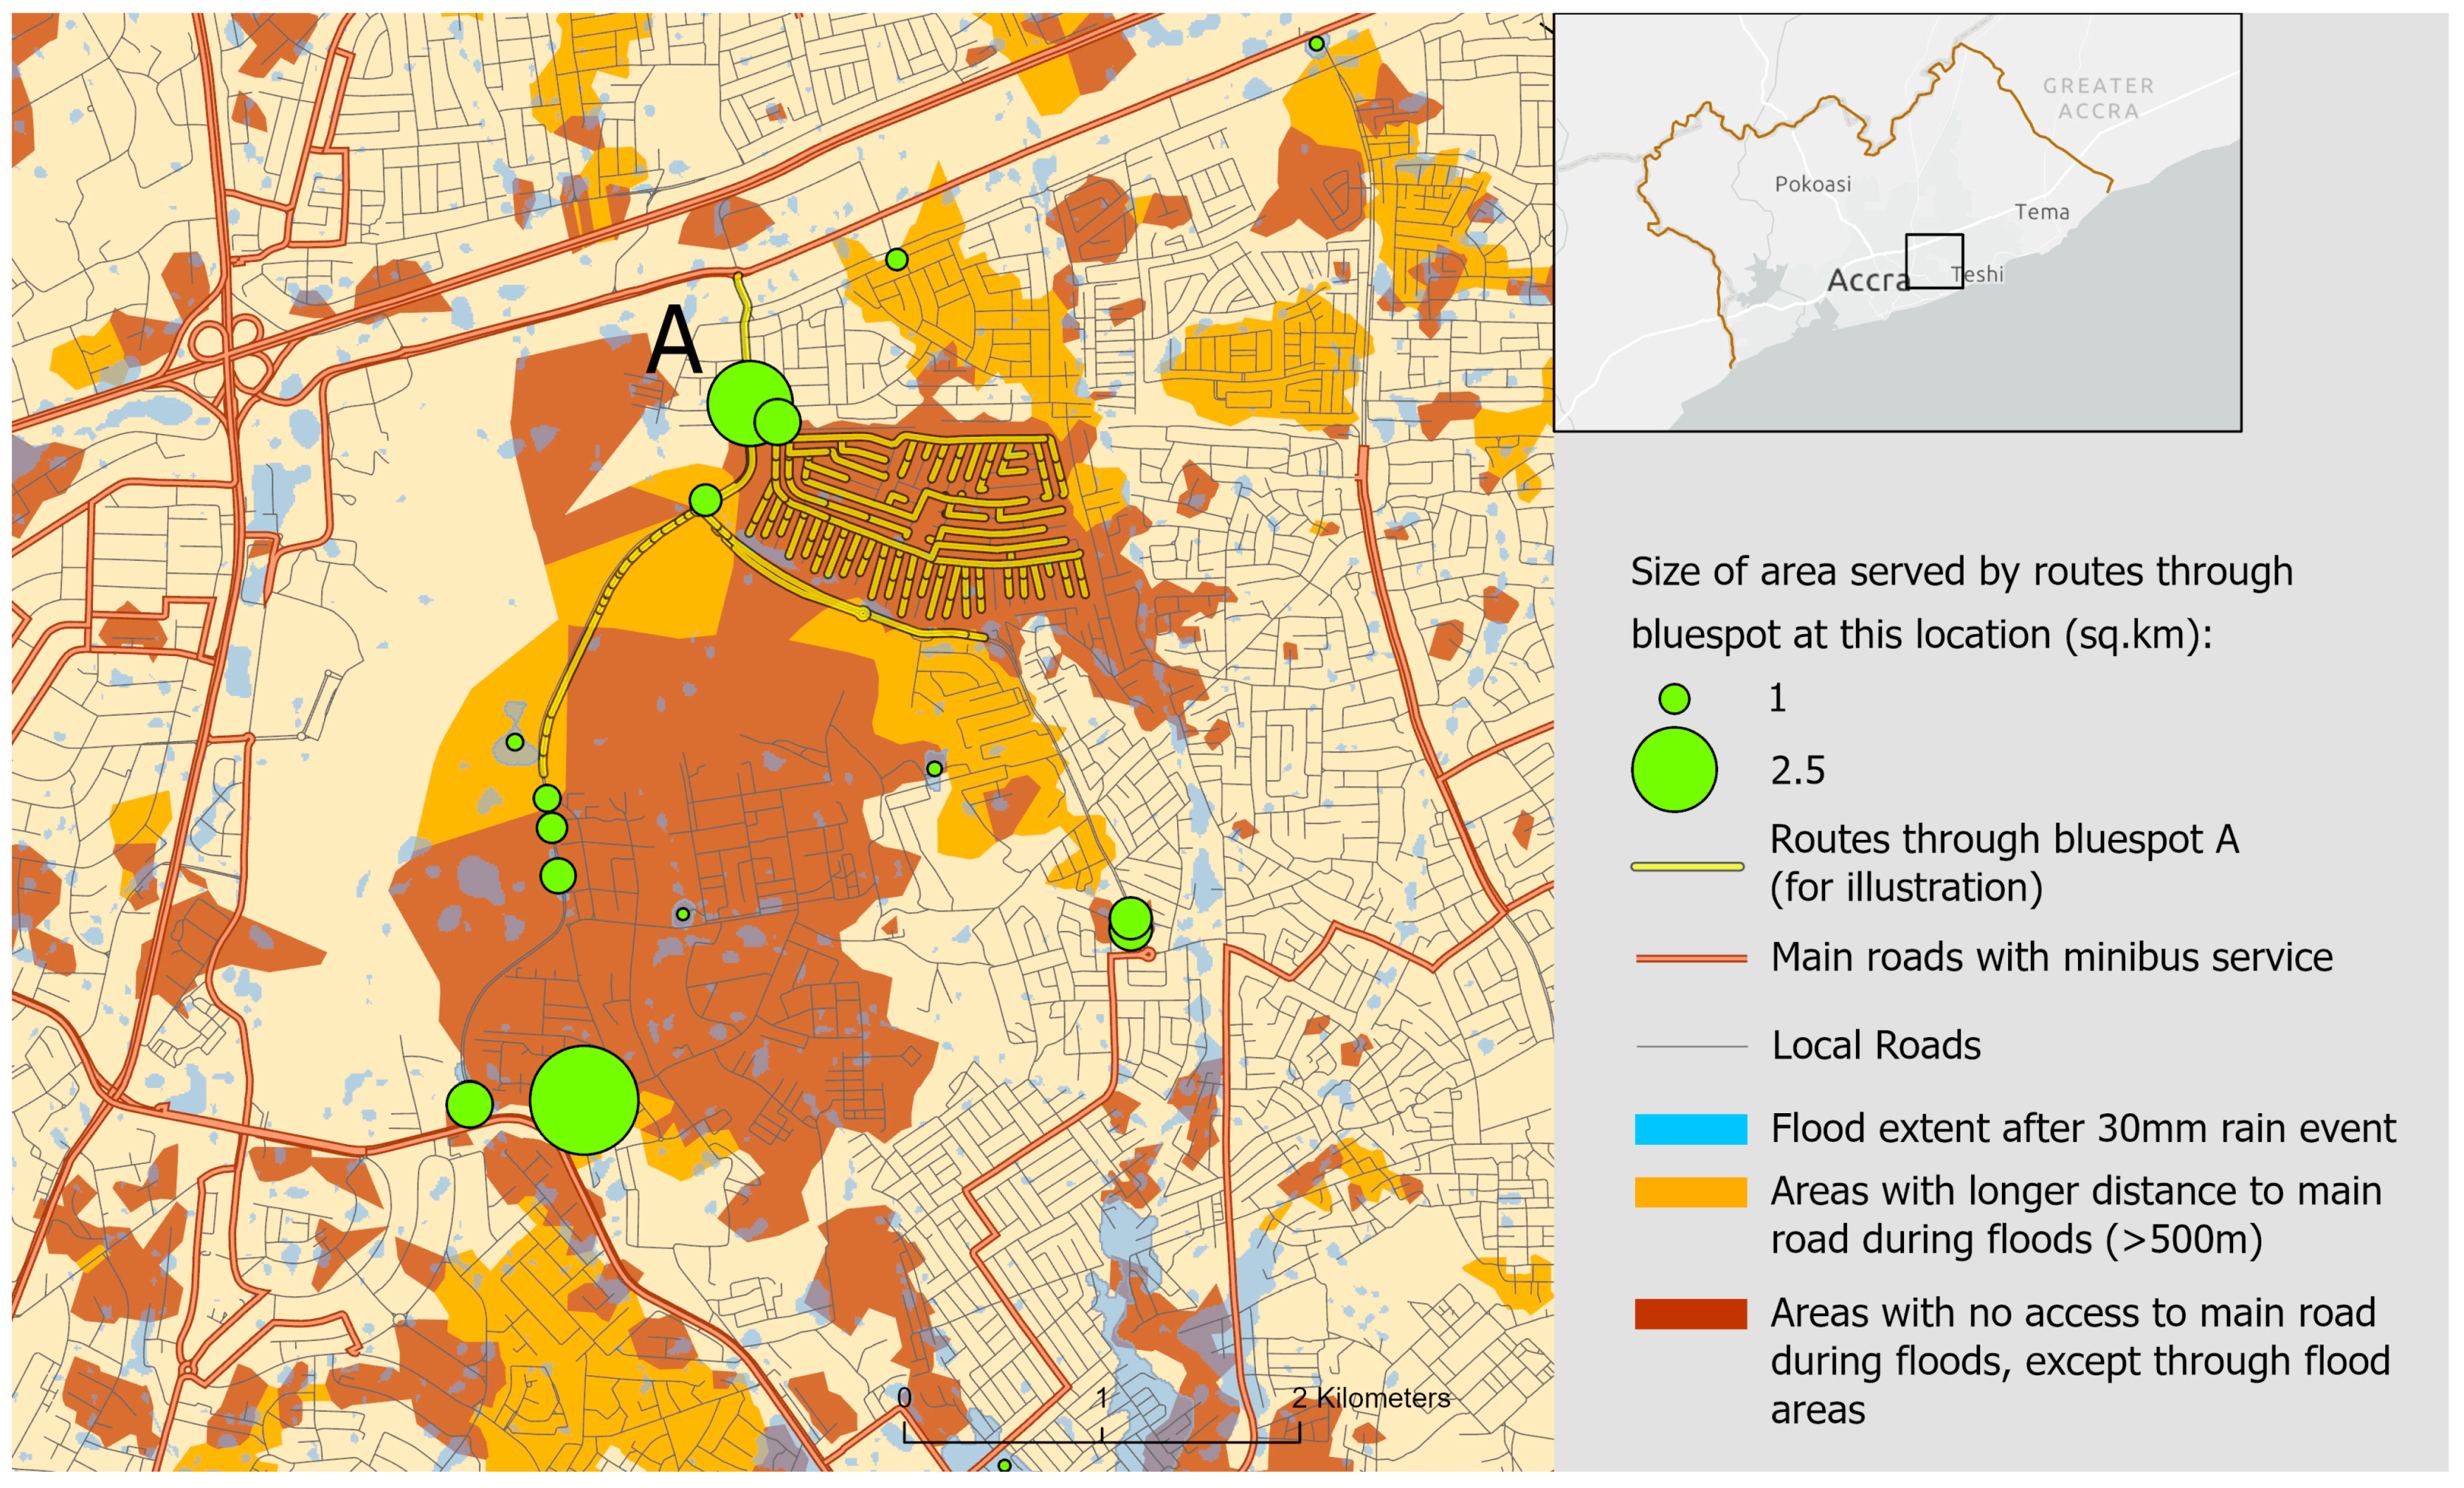
3.5. Hotspots Causing Mobility Loss (Local Scale)

The examination of local areas that encounter a loss of mobility raises the question of which specific bluespots bear the main responsibility. To estimate the significance of each bluespot in terms of reducing local accessibility during floods, we calculated the number of local routes that pass through each bluespot location in non-flood situations. Figure 10 illustrates an example of bluespots with a high impact on the accessibility to and from a specific area (Burma Camp).

4. Discussion

The results obtained in this study are founded on a number of assumptions and choices, which will be discussed below.

4.1. Application of the Mobility Survey

The survey targeted all members of the interviewed households aged 18 and above and travelling more than once a week within the Greater Accra Metropolitan Area for income-generating activities. The vast majority of mobile respondents (94%) reported that they travel to destinations within the Accra area for income-generating activities. It was, therefore, decided to focus attention on the intra-urban trips related to livelihood requirements rather than trips in and out of Accra. The survey results further indicated that the majority of adults in the four surveyed neighbourhoods undertake frequent trips outside their neighbourhoods and travel over relatively long distances. It is evident from the survey that daily mobility is essential for access to locations and activities that are crucial for people’s livelihoods, health, and social networks, as also noted by Esson et al. [40]. Generally, the origin–destination matrix of the mobile persons underpinned the established notion that Accra is a mono-centric city with strong functional links between the centre and the periphery, since a relatively large proportion of the surveyed mobile persons reported travelling towards the central areas. However, when looking at the four surveyed neighbourhoods individually, it can be seen that the distances to the central part of Accra influence the percentage of work-related trips going to this destination, with values ranging from 65% in the nearest neighbourhood, Glefe, to 18% in the most distant neighbourhood, Adenta. The surveyed neighbourhoods were selected so that they differed in degree of consolidation, distance to city centre, geo-physical characteristics, and socio-economic composition, with the aim of providing evidence from different types of peripheral urban development. Nevertheless, it is difficult to assess to which degree they are representative of other similar areas of Accra in terms of mobility patterns, since no other similar datasets exist for comparisons.

4.2. Validity of Transport Model

Tests run on the network dataset from OpenStreetMap indicated a good ability to identify routes that adhere to traffic regulations correctly. It is clear that the road network is dynamic and under expansion and densification in many areas of Accra, which implies that frequent updates must take place in order to capture all routing options. For this study, all calculations of least-cost network routes on the city-scale produced the fastest routes, not necessarily the shortest. However, due to a lack of valid speed data for rush-hour periods, the applied speed data reflect conditions during non-peak hours, and it should be noted that there is high variability in speed values depending on time of day and direction [8,41]. The application of non-peak-hour data will, therefore, provide a general underestimation of travel times.
The computation of traffic volumes for each road section in the network is based on a number of assumptions and generalizations. It is assumed that traffic is generated by the population and, therefore, results from the spatial distribution of this. While this study applied the most spatially detailed population dataset available (enumeration areas), it should be considered that this constitutes aggregated data, not the addresses of individuals. In general, enumerations areas with sparser populations in the peripheral areas are larger than the more densely populated areas, which will influence the precision of the model to some extent. Additionally, the modelled trip destinations represent aggregated points, evenly distributed across the city. This means that modelled traffic levels on smaller, local roads may be inaccurate. The transport model is, however, only applied for the city-wide calculations, at which scale these inaccuracies are considered acceptable. With no specific data on individual route choices available, the method assumes that all people follow the calculated least-cost (fastest) route between their origin and destination. This will, however, not be the case in all situations, due to personal preferences and other reasons. The distance decay functions applied for assigning trips to central areas versus other urban destinations are derived from the survey data, and the validity concerns for the functions are similar to what was previously discussed for the survey.

4.3. Validity of Flood Screening Data

The bluespot map indicates areas of flooding if rain events of a specified magnitude occur. The validity of the bluespot mapping method is discussed in a separate paper, Trepekli et al. [37], as previously mentioned. Based on comparisons with observed flood locations in Accra, it is assumed that the applied 10 m resolution digital terrain model is suitable for mapping urban flood conditions in the context of this study. The applied method calculates how water will accumulate in low-lying areas, as well as the amount of flow that will occur on the surface, depending on the magnitude of the simulated rain event. It is required that the terrain model is modified somewhat to allow for situations where water is able to pass below the modelled surface. This method is intended for high-intensity rain events, which provide full surface run-off due to the negligible effects of gutters. Similar conditions are, consequently, also assumed for this study.

4.4. City-Scale Analysis

This study applied different analysis methods for the city-wide assessments and the local area assessments. This reflects a perceived difference in the manifestation of the mobility disruption issue on the two scales. For the city-scale analysis, it should be noted that only the traffic load was used to estimate the importance of a given road segment, while the availability of alternative routes that avoid the segment in the case of flooding was not taken directly into account. Given the lack of efficient intermediate-level roads within the road system of Accra, it is fair to assume that real alternatives to the main roads do not often exist; flood-induced detours using smaller residential roads would be costly in terms of time, as they would quickly clog due to congestion.
The transport model was spatially intersected with the bluespot map to identify hotspots of mobility impacts and affected areas. This intersection was determined by converting both the road network and bluespots to grid-based layers. For producing the final maps of hotspot intersections, it was assumed that cells indicating hotspots that were located in close proximity represented the same hotspot location, and all cells in a cluster were, therefore, displayed as one location on the hotspot maps.

4.5. Local-Scale Analysis

For the local-scale analysis, this paper presented a two-step method for identifying high-impact gateway locations and mapping the areas that these locations impact in terms of accessibility to the main roads. The affected areas were identified using network analysis (closest facility) in flood and no-flood situations to calculate the relative and absolute mobility loss for each network node. In the depicted scenario, flood-prone areas (bluespots) acted as absolute barriers. It would be relevant to apply time-delay barriers instead of absolute barriers to reflect that passage could still be possible for some modes of transport, although with a delay.

4.6. Policy and Planning Implications

When assessing the general situation in Accra, it is apparent that there is a lack of network redundancy both at the city scale and at the local scale. At the city scale, the system of main roads reflects the mono-centric origin of Accra with the main roads predominantly radiating from the core areas. The distance to the nearest main road is steadily increasing in Accra’s peripheral areas as the boundaries of the urban agglomeration continue to expand beyond 25 km from the old core. There is a general lack of intermediate roads to facilitate transport from interior areas within Accra’s periphery, and to provide more redundancy within the road network. Two ring roads exist that connect the radial roads, the “motorway extension” (about 8–10 km from the central parts), and the ring road at about 3 km from the centre. The results clearly show, however, that flooding at key points within the main road system would affect the population of large areas. The limited availability of alternative routes exerts an impact on the criticality of flood situations. Particularly, given the rapid growth of Accra, there is a need to develop additional intermediate and high-capacity roads. Such development will support sustainable mobility by enhancing redundancy in the road network.
Our results also show that urban development practices create many “islands areas” that are not well connected to the main roads, nor to the adjacent neighbourhoods. A considerable number of urban neighbourhoods are restricted in their access to the main roads by a few gateway links, which, if flooded, will influence local mobility heavily. Depending on the barrier effect of the flooding, as well as the mode of transportation, residents in some areas may encounter complete isolation while the flooding occurs, and others may encounter much longer distances to reach a main road.
In general, the implication of these results for policy and planning is that significant investments are needed for the improvement and flood-proofing of both main roads and local roads, especially at the identified hotspot sites, but also for creating increased redundancy within the network in order to make the transport system more resilient to extreme weather events.

5. Conclusions

The increasingly frequent disruptions of daily mobility due to the flooding of road infrastructure in Accra impact the sustainability of livelihoods as well as safety. This study presents a spatial account of potential flood impacts on daily mobility within the city. The described methods, which are rooted in GIS-based network analysis, are able to identify the most critical locations in terms of their impact on mobility and map out the affected areas and population. The presented study is novel in two aspects: (1) in a context where very little mobility data are available from official sources, this study proposes a novel way to utilize and integrate data from a large spatially explicit mobility survey conducted through in-person interviews in peri-urban neighbourhoods, and (2) this study adopts a two-scale approach by analyzing and mapping overall mobility constraints on the city level, as well as the degrees of potential flood-induced isolation of smaller urban neighbourhoods.
The identification of hotspots for flood-induced mobility disruptions and neighbourhood isolation is a fundamental step in creating more resilient urban transport systems. This study provides evidence that the mapping of critical flood locations using GIS-based modelling and analysis techniques is able to provide data that can guide informed decision making concerning measures to reduce the frequency of disruptions. Data-driven insights can help planners prioritize areas for intervention, allocate resources effectively, and evaluate the potential impact of different mitigation strategies. The empirical focus of this study is Accra. The proposed methods, however, are likely to be suitable for assisting cities with similar flood-induced challenges in urban mobility to reach the goal of creating more resilient and sustainable infrastructure and, thereby, mitigate the adverse effects of flooding on urban mobility.

Author Contributions

Conceptualization, L.M.-J., R.Y.K., A.N.M.A. and G.A.B.Y.; Methodology, L.M.-J.; Software, L.M.-J.; Validation, L.M.-J., R.Y.K., A.N.M.A. and G.A.B.Y.; Formal Analysis, L.M.-J.; Investigation, L.M.-J., R.Y.K., A.N.M.A. and G.A.B.Y.; Resources, R.Y.K. and A.N.M.A.; Data Curation, A.N.M.A.; Writing—Original Draft Preparation, L.M.-J.; Writing—Review and Editing, L.M.-J., R.Y.K., A.N.M.A. and G.A.B.Y.; Visualization, L.M.-J.; Project Administration and Funding Acquisition, L.M.-J. and R.Y.K. All authors have read and agreed to the published version of the manuscript.

Funding

This research was funded by a grant awarded by the Danish Ministry of Foreign Affairs (Danida/DFC/FFU).

Institutional Review Board Statement

The study was conducted in accordance with the Declaration of Helsinki, and approved by the Institutional Review Board of the Faculty of Science, University of Copenhagen (protocol code 514-0294/21-5000, approval date 27 October 2021).

Informed Consent Statement

Informed consent was obtained from all subjects involved in the study.

Data Availability Statement

Full maps are available at ign.ku.dk/CLIMACCESS.

Conflicts of Interest

The authors declare no conflict of interest.

References

  1. Amankwaa, E.F.; Gough, K.V. ‘We are at the mercy of the floods!’: Extreme weather events, disrupted mobilities, and everyday navigation in urban Ghana. Singap. J. Trop. Geogr. 2023, 44, 235–254. [Google Scholar] [CrossRef]
  2. Dong, S.; Esmalian, A.; Farahmand, H.; Mostafavi, A. An integrated physical-social analysis of disrupted access to critical facilities and community service-loss tolerance in urban flooding. Comput. Environ. Urban Syst. 2020, 80, 101443. [Google Scholar] [CrossRef]
  3. Kermanshah, A.; Derrible, S. Robustness of road systems to extreme flooding: Using elements of GIS, travel demand, and network science. Nat. Hazards 2016, 86, 151–164. [Google Scholar] [CrossRef]
  4. Martins, M.C.d.M.; Rodrigues da Silva, A.N.; Pinto, N. An indicator-based methodology for assessing resilience in urban mobility. Transp. Res. Part D Transp. Environ. 2019, 77, 352–363. [Google Scholar] [CrossRef]
  5. Papilloud, T.; Keiler, M. Vulnerability patterns of road network to extreme floods based on accessibility measures. Transp. Res. Part D Transp. Environ. 2021, 100, 103045. [Google Scholar] [CrossRef]
  6. Zhang, M.; Xu, M.; Wang, Z.; Lai, C. Assessment of the vulnerability of road networks to urban waterlogging based on a coupled hydrodynamic model. J. Hydrol. 2021, 603, 127105. [Google Scholar] [CrossRef]
  7. Ghana Statistical Service. Ghana 2021 Population and Housing Census. Volume 1, Preliminary Report. 2021. Available online: https://census2021.statsghana.gov.gh/gssmain/fileUpload/reportthemelist/PRINT_COPY_VERSION_FOUR%2022ND_SEPT_AT_8_30AM.pdf (accessed on 15 January 2023).
  8. Møller-Jensen, L.; Kofie, R.Y.; Allotey, A.N.M. Measuring accessibility and congestion in Accra. Nor. Geogr. Tidsskr. Nor. J. Geogr. 2012, 66, 52–60. [Google Scholar] [CrossRef]
  9. Gaisie, E.; Kim, H.M.; Han, S.S. Accra towards a city-region: Devolution, spatial development and urban challenges. Cities 2019, 95, 102398. [Google Scholar] [CrossRef]
  10. Douglas, I.; Alam, K.; Maghenda, M.; McDonnell, Y.; McLean, L.; Campbell, J. Unjust waters: Climate change, flooding and the urban poor in Africa. Environ. Urban. 2008, 20, 187–205. [Google Scholar] [CrossRef]
  11. Douglas, I. Flooding in African cities, scales of causes, teleconnections, risks, vulnerability and impacts. Int. J. Disaster Risk Reduct. 2017, 26, 34–42. [Google Scholar] [CrossRef]
  12. Møller-Jensen, M.; Agergaard, J.; Andreasen, M.H.; Oteng-Ababio, M.; Yankson, P.W.K. Urban expansion and consolidation in Accra’s peripheries An examination of the entwinement of development and flood risk in four settlements. Dep. Geosci. Nat. Resour. Manag. Univ. Copenhagen 2020, 109, 109. [Google Scholar]
  13. Andreasen, M.H.; Agergaard, J.; Allotey, A.N.M.; Møller-Jensen, L.; Oteng-Ababio, M. Built-in Flood Risk: The Intertwinement of Flood Risk and Unregulated Urban Expansion in African Cities. Urban Forum 2022, 34, 385–411. [Google Scholar] [CrossRef]
  14. Amoako, C.; Inkoom, D.K.B. The production of flood vulnerability in Accra, Ghana: Re-thinking flooding and informal urbanisation. Urban Stud. 2017, 55, 2903–2922. [Google Scholar] [CrossRef]
  15. Tramblay, Y.; Villarini, G.; Khalki, E.M.; Gründemann, G.; Hughes, D. Evaluation of the Drivers Responsible for Flooding in Africa. Water Resour. Res. 2021, 57, e2021WR029595. [Google Scholar] [CrossRef]
  16. Gough, K.; Yankson, P.; Wilby, R.L.; Amankwaa, E.F.; Abarike, M.A.; Codjoe, S.; Griffiths, P.; Kasei, R.; Kayaga, S.; Nabilse, C. Vulnerability to extreme weather events in cities: Implications for infrastructure and livelihoods. J. Br. Acad. 2019, 7, 155–181. [Google Scholar] [CrossRef]
  17. Andreasen, M.H.; Agergaard, J.; Møller-Jensen, L.; Oteng-Ababio, M.; Yiran, G.A.B. Mobility Disruptions in Accra: Recurrent Flooding, Fragile Infrastructure and Climate Change. Sustainability 2022, 14, 3790. [Google Scholar] [CrossRef]
  18. Tatah, L.; Foley, L.; Oni, T.; Pearce, M.; Lwanga, C.; Were, V.; Assah, F.; Wasnyo, Y.; Mogo, E.; Okello, G.; et al. Comparing travel behaviour characteristics and correlates between large and small Kenyan cities (Nairobi versus Kisumu). J. Transp. Geogr. 2023, 110, 103625. [Google Scholar] [CrossRef]
  19. Andreasen, M.H.; Møller-Jensen, L. Access to the city: Mobility patterns, transport and accessibility in peripheral settlements of Dar es Salaam. J. Transp. Geogr. 2017, 62, 20–29. [Google Scholar] [CrossRef]
  20. Jenelius, E.; Mattsson, L.-G. Road network vulnerability analysis: Conceptualization, implementation and application. Comput. Environ. Urban Syst. 2015, 49, 136–147. [Google Scholar] [CrossRef]
  21. Balijepalli, C.; Oppong, O. Measuring vulnerability of road network considering the extent of serviceability of critical road links in urban areas. J. Transp. Geogr. 2014, 39, 145–155. [Google Scholar] [CrossRef]
  22. Sohn, J. Evaluating the significance of highway network links under the flood damage: An accessibility approach. Transp. Res. Part A Policy Pract. 2006, 40, 491–506. [Google Scholar] [CrossRef]
  23. Wiśniewski, S.; Borowska-Stefańska, M.; Kowalski, M.; Sapińska, P. Vulnerability of the accessibility to grocery shopping in the event of flooding. Transp. Res. Part D Transp. Environ. 2020, 87, 102510. [Google Scholar] [CrossRef]
  24. Ganin, A.; Kitsak, M.; Marchese, D.; Keisler, J.M.; Seager, T.; Linkov, I. Resilience and efficiency in transportation networks. Sci. Adv. 2017, 3, e1701079. [Google Scholar] [CrossRef] [PubMed]
  25. Kasmalkar, I.G.; Serafin, K.A.; Miao, Y.; Bick, I.A.; Ortolano, L.; Ouyang, D.; Suckale, J. When floods hit the road: Resilience to flood-related traffic disruption in the San Francisco Bay Area and beyond. Sci. Adv. 2020, 6, eaba2423. [Google Scholar] [CrossRef]
  26. Morelli, A.B.; Cunha, A.L. Measuring urban road network vulnerability to extreme events: An application for urban floods. Transp. Res. Part D Transp. Environ. 2021, 93, 102770. [Google Scholar] [CrossRef]
  27. Singh, P.; Sinha, V.S.P.; Vijhani, A.; Pahuja, N. Vulnerability assessment of urban road network from urban flood. Int. J. Disaster Risk Reduct. 2018, 28, 237–250. [Google Scholar] [CrossRef]
  28. Maze, T.H.; Agarwal, M.; Burchett, G. Whether Weather Matters to Traffic Demand, Traffic Safety, and Traffic Operations and Flow. J. Transp. Res. Board 2006, 1948, 170–176. [Google Scholar] [CrossRef]
  29. Pregnolato, M.; Ford, A.; Wilkinson, S.M.; Dawson, R.J. The impact of flooding on road transport: A depth-disruption function. Transp. Res. Part D Transp. Environ. 2017, 55, 67–81. [Google Scholar] [CrossRef]
  30. Shah, S.M.H.; Mustaffa, Z.; Martinez-Gomariz, E.; Kim, D.K.; Yusof, K.W. Criterion of vehicle instability in floodwaters: Past, present and future. Int. J. River Basin Manag. 2019, 19, 1–23. [Google Scholar] [CrossRef]
  31. Stamos, I.; Salanova Grau, J.M.; Mitsakis, E.; Aifadopoulou, G. Modeling Effects of Precipitation on Vehicle Speed: Floating Car Data Approach. Transp. Res. Rec. J. Transp. Res. Board 2016, 2551, 100–110. [Google Scholar] [CrossRef]
  32. Mitsakis, E.; Stamos, I.; Diakakis, M.; Salanova Grau, J.M. Impacts of high-intensity storms on urban transportation: Applying traffic flow control methodologies for quantifying the effects. Int. J. Environ. Sci. Technol. 2014, 11, 2145–2154. [Google Scholar] [CrossRef]
  33. Diakakis, M.; Boufidis, N.; Salanova Grau, J.M.; Andreadakis, E.; Stamos, I. A systematic assessment of the effects of extreme flash floods on transportation infrastructure and circulation: The example of the 2017 Mandra flood. Int. J. Disaster Risk Reduct. 2020, 47, 101542. [Google Scholar] [CrossRef]
  34. Chen, X.-Z.; Lu, Q.-C.; Peng, Z.-R.; Ash, J.E. Analysis of Transportation Network Vulnerability under Flooding Disasters. Transp. Res. Rec. J. Transp. Res. Board 2015, 2532, 37–44. [Google Scholar] [CrossRef]
  35. Boeing, G. OSMnx: New methods for acquiring, constructing, analyzing, and visualizing complex street networks. Comput. Environ. Urban Syst. 2017, 65, 126–139. [Google Scholar] [CrossRef]
  36. Balstrøm, T.; Crawford, D. Arc-Malstrøm: A 1D hydrologic screening method for stormwater assessments based on geometric networks. Comput. Geosci. 2018, 116, 64–73. [Google Scholar] [CrossRef]
  37. Trepekli, K.; Balstrøm, T.; Friborg, T.; Fog, B.; Allotey, A.N.; Kofie, R.Y.; Møller-Jensen, L. UAV-borne, LiDAR-based elevation modelling: A method for improving local-scale urban flood risk assessment. Nat. Hazards 2022, 113, 423–451. [Google Scholar] [CrossRef]
  38. Kwaku, X.K.; Duke, O. Characterization and frequency analysis of one day annual maximum and two to five consecutive days’ maximum rainfall of Accra, Ghana. RPN J. Eng. Appl. Sci. 2007, 2, 27–31. [Google Scholar]
  39. Shu, C.; Xia, J.; Falconer, R.A.; Lin, B. Incipient velocity for partially submerged vehicles in floodwaters. J. Hydraul. Res. 2011, 49, 709–717. [Google Scholar] [CrossRef]
  40. Esson, J.; Gough, K.V.; Simon, D.; Amankwaa, E.F.; Ninot, O.; Yankson, P.W.K. Livelihoods in motion: Linking transport, mobility and income-generating activities. J. Transp. Geogr. 2016, 54, 34–40. [Google Scholar] [CrossRef]
  41. Melbye, D.C.; Møller-Jensen, L.; Andreasen, M.H.; Kiduanga, J.; Busck, A.G. Accessibility, congestion and travel delays in Dar es Salaam—A time–distance perspective. Habitat Int. 2015, 46, 178–186. [Google Scholar] [CrossRef]
Figure 1. Location of the four neighbourhoods covered by the mobility survey. Adapted from [12].
Sustainability 15 14997 g001
Figure 2. Location of home neighbourhoods and most frequently visited destination cells when travelling for income-generating activities.
Sustainability 15 14997 g002
Figure 3. Distance decay function for trips going to the central parts of Accra. Distance (in minutes) is measured through the road network assuming non-rush-hour conditions.
Sustainability 15 14997 g003
Figure 4. Distance decay function for trips not going to the central parts of Accra and Medina. Distance (in minutes) is measured through the road network assuming non-rush-hour conditions.
Sustainability 15 14997 g004
Figure 5. (ac) Traffic load on road segments. Top: trips to central Accra (a), middle: other trips (b), bottom: all trips (c).
Sustainability 15 14997 g005aSustainability 15 14997 g005b
Figure 6. Traffic load on road segments at bluespot sites (see Figure 7 for the depicted area’s location within the city region).
Sustainability 15 14997 g006
Figure 7. Hotspots of high traffic load at bluespot sites with pot. depths > 30 cm. Blue polygon indicates the extent of the area depicted in Figure 6.
Sustainability 15 14997 g007
Figure 8. The spatial distribution of mobility loss generated by flooding at two selected hotspot locations.
Sustainability 15 14997 g008
Figure 9. Areas that may experience limitations in accessibility to the main road network during flooding.
Sustainability 15 14997 g009
Figure 10. Location of bluespots that create loss of accessibility from interior areas to main roads.
Sustainability 15 14997 g010
Table 1. Overview of scales of analysis, objectives, and applied methods. (*) Polygons resulting from flood model with depth levels that will cause strong interference with transportation (30 cm); (**) a main road is defined in this context as a road with a minibus (trotro) service.
City Scale (A)Local Scale (B)
Hotspots causing mobility lossA1. Flood-prone locations (*) overlapping roads with high modelled traffic volumesB1. Flood-prone locations (*) overlapping interior roads that support a high number of routes towards main roads (**)
Method: A transport model is established based on mobility survey data and inter-sected with a map of flood-prone areasMethod: Computation of betweenness centrality of flood-prone network nodes, restricted to routes between B2 hotspots and nearest main road
Areas affected by mobility lossA2. City areas most affected by flooding at A1 hotspotsB2. City areas most affected in terms of reduced access to main roads during flood events
Method: Commuter routes are analyzed
to provide the potential spatial impact of floods at specific locations as well as the
size of the impacted population
Method: Network analysis (closest facility) in flood and no-flood situations is applied to calculate the relative and absolute mobility loss for each network node. Flood areas act as absolute barriers
Table 2. Summary data for responding households (HHs).
Santa MariaGlefeAdentaPokuase
1234All
Number of HHs interviewed3111123163141053
HH mean size (adults)2.662.62.842.32.6
HH mean size (adults + children < 18) 4.164.684.593.944.3
Mobile persons inside GAMA *5422075865091844
Mobile persons in all households (%) ** 36.78
* All members of HHs aged 18 and above and travelling more than once a week within the Greater Accra Metropolitan Area (GAMA) area for income-generating activities. ** Including fully non-mobile HHs (not interviewed).
Disclaimer/Publisher’s Note: The statements, opinions and data contained in all publications are solely those of the individual author(s) and contributor(s) and not of MDPI and/or the editor(s). MDPI and/or the editor(s) disclaim responsibility for any injury to people or property resulting from any ideas, methods, instructions or products referred to in the content.

