Article

Forecasting Worldwide Temperature from Amazon Rainforest Deforestation Using a Long-Short Term Memory Model

by
David Dominguez
1,
Javier Barriuso Pastor
1,
Odette Pantoja-Díaz
2 and
Mario González-Rodríguez
3,*
1
Grupo de Neurocomputación Biólogica, Departamento de Ingeniería Informática, Escuela Politécnica Superior, Universidad Autónoma de Madrid, 28049 Madrid, Spain
2
Business School, Universidad Internacional del Ecuador (UIDE), Quito 170411, Ecuador
3
SI2Lab, Facultad de Ingeniería y Ciencias Aplicadas, Universidad de las Américas, Quito 170124, Ecuador
*
Author to whom correspondence should be addressed.
Sustainability 2023, 15(20), 15152; https://doi.org/10.3390/su152015152
Submission received: 18 September 2023 / Revised: 12 October 2023 / Accepted: 19 October 2023 / Published: 23 October 2023
(This article belongs to the Special Issue Socioeconomic Modelling and Prediction with Machine Learning)

Abstract

:
Biosphere–atmosphere interactions are a critical component of the Earth’s climate system. Many of these interactions are currently contributing to temperature increases and accelerating global warming. One of the main factors responsible for this is land use and land cover changes; in particular, this work models the interaction between Amazon rainforest deforestation and global temperatures. A Long Short-Term Memory (LSTM) neural network is proposed to forecast temperature trends, including mean, average minimum, and average maximum temperatures, in 20 major cities worldwide. The Amazon rainforest, often referred to as the Earth’s “lungs”, plays a pivotal role in regulating global climate patterns. Over the past two decades, this region has experienced significant deforestation, largely due to human activities. We hypothesize that the extent of deforestation in the Amazon can serve as a valuable proxy for understanding and predicting temperature changes in distant urban centers. Using a dataset that tracks cumulative deforestation from 2001 to 2021 across 297 municipalities in the Amazon rainforest, a multivariate time series model was developed to forecast temperature trends worldwide up to 2030. The input data reveal a variety of behaviors, including complex deforestation patterns. Similarly, the forecasted temperature data showcases diverse trends. While some cities are expected to exhibit a steady temperature increase, others may experience gradual changes, while some cities may undergo drastic and rapid temperature shifts. Our findings contribute to a deeper understanding of the far-reaching impacts of deforestation on global climate patterns and underscore the importance of preserving vital ecosystems like the Amazon rainforest.

1. Introduction

The Amazon rainforest, widely recognized as one of Earth’s most crucial ecosystems, has become emblematic of the ongoing global environmental crisis [1]. Serving as a vital component in maintaining the Earth’s climate equilibrium, the Amazon functions both as a substantial carbon sink and a source of life-sustaining biodiversity [2]. However, recent decades have witnessed a disturbing escalation in deforestation rates within this pristine wilderness, prompting an urgent examination of the intricate relationship between Amazon deforestation and the pervasive issue of climate change [3].
Deforestation refers to the removal of forests and trees from a specific area, typically for industrial or agricultural purposes. This process can have a detrimental impact on the ecosystem, leading to increased greenhouse gas emissions, soil erosion, and the loss of wildlife habitat [2]. Over the past few decades, the Amazon rainforest has gradually diminished in size, primarily to create space for new pastures and soybean plantations. Notably, the size of the most recent deforestation patches in 2019 and 2020 has expanded significantly and surpasses the extent observed in the preceding decade. This observation is based on an analysis of data from the Deforestation Monitoring Program of the Brazilian Amazon Forest by Satellite (PRODES) [4]. Deforestation is not a random process; it is influenced by numerous socioeconomic and institutional factors. Furthermore, it can have far-reaching consequences for the ecosystem, including limitations on rainfall and the acceleration of climate change, among other effects [1].
As mentioned by the authors of reference [2], the rate of deforestation in the Brazilian Amazon has experienced recent increases for several reasons. These factors encompass contentious amendments to the Brazilian Forest Code in 2012, reduced enforcement of deforestation measures by the Ministry of the Environment, non-compliance with associated climate change policies, and potential legislation that could legitimize seized public properties. Various elements, including alterations in governance and programs and market participation, contribute to these shifts [4].
Deforestation in the Amazon has reached alarming proportions, with extensive swaths of ancient forest succumbing to logging, agriculture, and infrastructure development [3]. The consequences of this rampant deforestation are far-reaching. The release of vast amounts of carbon dioxide (CO 2 ) into the atmosphere through deforestation has garnered increasing attention [5]. As reported by the Intergovernmental Panel on Climate Change (IPCC), deforestation contributes significantly to global greenhouse gas emissions [6]. This link between deforestation and CO 2 emissions directly impacts the exacerbation of climate change.
The Amazon’s role as a significant carbon sink has long been recognized, as it absorbs atmospheric CO 2 through photosynthesis and stores it within its lush vegetation and soils [7]. However, deforestation disrupts this delicate balance by both releasing stored carbon and diminishing the forest’s capacity to sequester CO 2 [8]. Furthermore, the consequences of Amazon deforestation extend beyond regional boundaries. Changes to the forest’s transpiration and evapotranspiration processes have been associated with shifts in precipitation patterns and an increased vulnerability to extreme weather events, affecting not only South America but also the global climate system [9]. These cascading effects underscore the interdependence of the Amazon’s ecosystem with the broader climate system.
There are numerous wide-ranging effects of climate change on society, the environment, and the global economy [10]. One of the primary effects of climate change is the rise in temperatures, which leads to health issues, reduced agricultural productivity, and strains on energy systems [11]. Similarly, some of the key consequences of climate change include melting ice and rising sea levels, extreme weather events, ocean acidification, biodiversity loss, health risks, food and water security challenges, economic impacts, migration, and displacement [12,13,14,15]. To reduce greenhouse gas emissions, transition to renewable energy sources, and develop adaptation plans to mitigate the effects of climate change on both people and ecosystems, international collaboration is essential [15]. It is also crucial to conduct studies and analyses to predict the future of the planet in the face of evolving climate change.
The work by the authors of reference [16] highlights a critical international concern: deforestation in the Amazon rainforest. This process has several environmental effects, with the increase in CO 2 emissions and global temperatures being among the most significant issues. For instance, studies like that in reference [17] anticipated substantial changes in temperature and precipitation patterns in the Northern Hemisphere climate as a consequence of Amazon deforestation, utilizing the Ocean-Land-Atmosphere Model. Similarly, both references [18] and [19] emphasize that Amazon deforestation, degradation, and wildfires impact not only the local region but also the entire world. This results in the release of 110 to 275 tons of CO 2 equivalent and an increase in the global average temperature by 0.1 to 0.2 °C.
Changes in the deforestation rates of the Amazon can have intricate and interconnected consequences on both global and regional climatic systems. These effects can influence temperatures and weather patterns in distant urban areas through various mechanisms, including alterations in albedo (the amount of sunlight or solar radiation that is reflected back into space), carbon emissions, atmospheric circulation, and feedback loops. For instance, changes in albedo occur when the Amazon’s tree cover is replaced by farming or urban development, making the surface more reflective. This increased albedo, while locally leading to cooling, can have warming effects on nearby urban areas. Furthermore, the reduced solar absorption by the Amazon’s surface can result in a global temperature increase, as more sunlight is reflected back into space rather than being absorbed by the Earth’s surface [2].
As mentioned previously, numerous studies have explored the close relationship between human activities (such as deforestation and the burning of fossil fuels) and the looming threat of climate change to future human existence. Building upon this premise, the present research endeavors to empirically establish the direct connection between human actions and climate change. To achieve this, advanced analytical techniques will be employed to quantify the level of correlation between key deforestation indicators in the Amazon region (representing human actions) and the recorded temperatures in various cities around the world, consequently influencing the planet’s overall climate. In a similar vein, multiple algorithms will be utilized to project the potential impact of these actions on future global temperatures. This analysis aims to predict temperature increases in major cities worldwide in the coming years, under the assumption that deforestation will persist in these regions.
The objective of this work is to forecast temperatures up until 2030 using a Long Short-Term Memory (LSTM) model [20,21]. The choice of 2030 as the time limit for this analysis is based on the IPCC’s assessment [22], which suggests that the central estimate for crossing the 1.5 °C temperature increase threshold will be in the early 2030s. Numerous studies have employed machine learning models to assess deforestation [23,24,25] and climate change [26,27,28]. The current research utilizes a dataset containing information on 297 municipalities [29], including annual cumulative deforestation data for the past two decades. Temperature data for 20 cities across the world, spanning all continents, is both modeled and forecasted. Temperature data for 20 cities across the world, spanning all continents, are both modeled and forecasted. An LSTM network serves as the machine learning model, mapping temporal data input using cumulative deforestation data from 297 municipalities in the Amazon region of Brazil. The intended output of the model is the temperature data for 20 cities worldwide. A separate model is constructed for each of the 20 cities, encompassing mean, average minimum, and average maximum temperatures. In essence, for each city, three distinct models are created to predict these temperature parameters.
The paper sections are structured as follows. Section 2: Materials and Methods describes the data used to build the model and formalizes the general LSTM general model employed for forecasting temperature increments. Section 3: LSTM Network Architecture outlines the network architecture used in this work, including the results of the hyperparameter optimization process. Section 4: Data Exploration presents an analysis of the cumulative deforestation data for the 297 Amazon municipalities. Understanding the complex behavior of these input data is crucial for modeling global warming and climate change in the 20 selected cities around the world. Section 5: Results provides the forecasted temperature data for the 20 selected cities around the world. The experimental results obtained from the LSTM model are discussed in the context of the current climate change scenario. Finally, Section 6, Discussion and Conclusions, examines the main findings and implications of this research, as well as the directions for future work.

2. Materials and Method

2.1. Data Description

The input data, denoted as X t m , consist of data from 297 municipalities in the Brazilian Amazon. The dataset covers the years between 2000 and 2021, recording cumulative deforestation data for these 297 municipalities. In Table 1, you can find the dataset variables along with their corresponding data types (measurement scale) and descriptions for each variable. The output data Y t c comprise mean ( T m e a n ), average minimum ( T m i n ), and average maximum ( T m a x ) temperatures of 20 cities around the world. The cities are: Buenos Aires, Canton, London, Mexico City, Delhi, Cairo, Istanbul, Kinshasa, Kuala Lumpur, Lima, Los Angeles, Madrid, Manila, Moscow, New York, Sao Paulo, Shanghai, Sidney, Tokyo, and Jakarta; as described in Table 2. The selection of these 20 locations is significant due to their global geographical distribution and the diversity of environmental conditions they represent. Each city was chosen to exemplify a distinct region and climate zone. This diversity enables us to conduct a comprehensive analysis of global temperature trends and patterns, contributing to a more comprehensive understanding of urban temperature dynamics. These cities span North and South America, Europe, Asia, Africa, and Oceania. The temperature data are sourced from WeatherSpark, a platform that provides detailed weather reports for around a hundred and fifty thousand locations worldwide [30]. As a remark, a temporal index is used, denoted as t, which corresponds to the year of registration for both deforestation and temperature data. In addition, two spatial indexes are employed, corresponding to the municipality m where the cumulative deforestation data were recorded and the city c where temperature measurements (mean, average minimum, and average maximum) were registered. The input data X t m have a total size of t × m × c . The number of rows is determined by the combination of temporal (t) and city indexes (c), resulting in t × c rows. The number of columns is determined by the number of municipalities, which is m = 297 , along with additional columns for city names, mean temperatures ( T m e a n c i t y ), minimum temperatures ( T m i n c i t y ), and maximum temperatures ( T m a x c i t y ). The deforestation data are sourced from TerraBrasilis [29], a platform designed for the organization, access, and utilization of geographical data for environmental monitoring. TerraBasilis was developed by the National Institute for Space Research (INPE), a research unit of the Brazilian Ministry of Science and Technology. For each of the 20 cities, three models are constructed, one for each temperature parameter, as described in Equation (1). These models utilize the network architecture presented in Section 3 LSTM Network architecture.

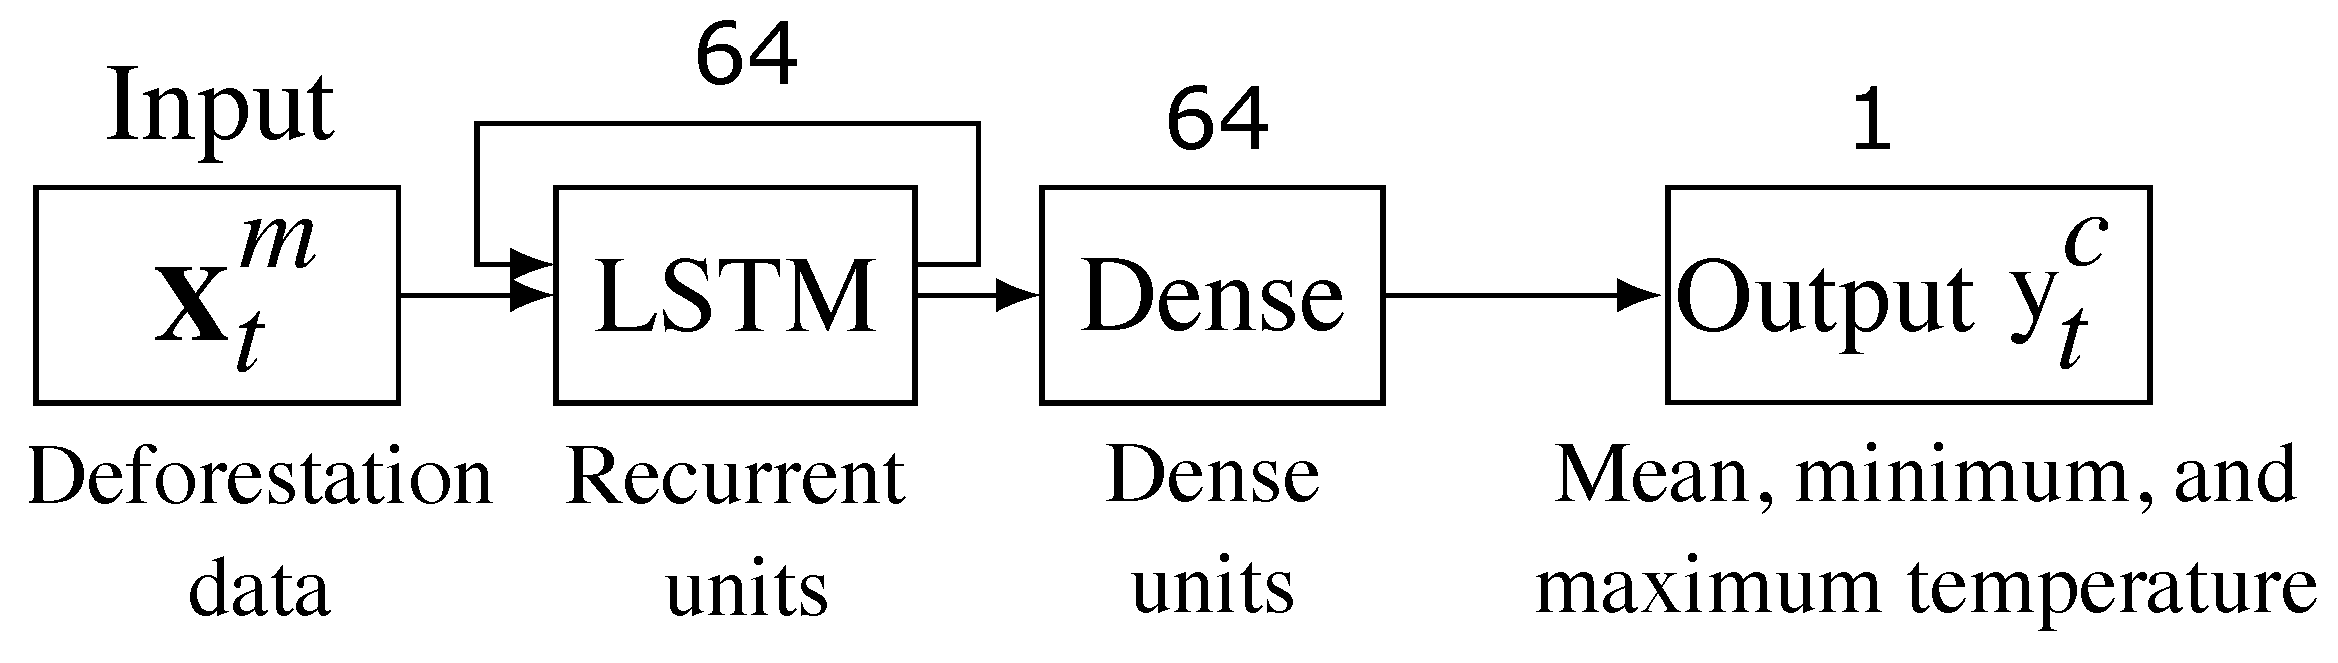
2.2. Forecasting Model: Long-Short Term Memory (LSTM)

A Long Short-Term Memory (LSTM) network is employed to model the temperature data of cities around the world, denoted as Y t c , using the deforestation data of municipalities, X t m , as presented in Table 1. The objective of the LSTM is to forecast the temperature for the upcoming ten years based on the cumulative deforestation of the Amazon rainforest. The general forecasting model can be formalized as follows:
Y ^ t c = f ( X t m ) ,
where X t m represents the temporal input (cumulative deforestation) for the last 20 years, t { 2001 , , 2021 } , for the 297 Amazon municipalities, m { 1 , , 297 } . Y ^ t c represents the temporal output of the model, with c { B u e n o s A i r e s , , J a k a r t a } , according to Table 2. Three models are built for the three different outputs: T m e a n , T m i n , T m a x for each of the 20 cities.
The LSTM model for the temporal data, as presented in Table 1, can be expressed as follows:
y ^ t c = f ( X t m ) = f ( X 2001 m , , X 2021 m ) ,
where X t m represents the temporal input, yearly cumulative deforestation, and y ^ t c the model’s output, i.e., the temperature. It is important to note that the temporal model is a multivariate one, as described in previous studies [31,32]. This means that the temperature forecasting for each city involves the utilization of multiple time-dependent variables, specifically the deforestation data of the 297 municipalities. Each of these variables not only relies on its own historical data but also exhibits interdependencies with other variables. These interdependencies, which are captured by the LSTM model, play a crucial role in forecasting future temperature values. This is represented in Equation (3) as matrices, illustrating the multidimensional nature of the temporal input, where X t m with m 1 , , 297 corresponds to the cumulative deforestation of municipalities. Considering the temporal nature of the data used in the LSTM and Equation (2), we can express it as follows:
y ^ t + 1 c = f X t , X t 1 , , X t k ,
where t { 1 , , N k } , X t , X t 1 , , X t k are the actual and past values of the 297 municipalities, the m super index was dropped for simplicity. The value y ^ t + 1 c represents the forecasted temperature for each of the 20 cities worldwide. In this context, the function f denotes the LSTM model. Here, k corresponds to the window size used for forecasting, and in this paper, it is set to k = 1 . The variable N stands for the number of observations (years) in the database.

Long-Short Term Memory Model

A Recurrent Neural Network (RNN) is a type of artificial neural network designed to process and predict data sequences. Unlike traditional feedforward neural networks, where information flows in one direction, RNNs have connections that loop back on themselves, enabling them to maintain a hidden state or memory of previous inputs [33]. The RNN is schematically represented in Figure 1. The RNN processes a sequence of temporal inputs, denoted as X t where t < k N , and k represents the window size for making predictions. In the initial step, it receives the input x 0 and generates the output h 0 . In the subsequent steps, the inputs are h 0 and x 1 , resulting in the output h 1 , which, in turn, serves as an input in the following step. This process continues successively until the final step, which receives the input x n and the output of the previous step, denoted as h k 1 , to predict h k , which serves as the model’s output ( Y t ).
The training process of an RNN can be summarized as follows: a forward pass, loss (error) calculation, and a backward pass. During the forward pass, the network processes data sequentially. For each time step in a sequence, it calculates the predicted output using the current model parameters, and the hidden state is updated at each time step. The loss (error) is then computed between the predicted output and the actual target for each time step in the sequence. The choice of the loss function depends on the specific task. For regression tasks, mean squared error is often used, while for classification tasks, cross-entropy loss is common. The gradients are propagated backward through time to update the model’s parameters. This process is similar to backpropagation in feedforward neural networks but takes into account the sequential nature of the data. Use an optimization algorithm to update the model’s weights and biases based on the computed gradients. The goal is to minimize the loss function.
RNNs have a disadvantage related to gradients either blowing up or diminishing when learning long-term dependencies. To mitigate this problem, the LSTM network model was introduced. An LSTM network is essentially an enhanced version of an RNN, featuring a specialized cell structure equipped with input, output, and forget gates [34]. These gates enable an LSTM layer to effectively grasp and model long-range dependencies, making it particularly valuable for tasks such as time series prediction. The LSTM cell is presented in Figure 2. The equations that describe the LSTM Unit, as depicted in the schematic representation in Figure 2, are as follows:
Input Gate ( i t ):
i t = σ ( W i · [ h t 1 , x t ] + b i )
Candidate Cell State ( C ˜ t ):
C ˜ t = tanh ( W C · [ h t 1 , x t ] + b C )
Forget Gate ( f t ):
f t = σ ( W f · [ h t 1 , x t ] + b f )
Cell State Update ( C t ):
C t = f t · C t 1 + i t · C ˜ t
Output Gate ( o t ):
o t = σ ( W o · [ h t 1 , x t ] + b o )
Hidden State ( h t ):
h t = o t · tanh ( C t )
where:
  • i t Input Gate s output ;
  • C ˜ t Candidate Cell State ;
  • f t Forget Gate s output ;
  • C t Cell State ;
  • o t Output Gate s output ;
  • h t Hidden State ;
  • x t Input at time step ; t
  • h t 1 Previous hidden state ;
  • W i , W C , W f , W o Weight matrices for respective gates ;
  • b i , b C , b f , b o Bias terms for respective gates ;
  • σ ( · ) Sigmoid activation function ;
  • tanh ( · ) Hyperbolic tan gent activation function .
For this work, the LSTM network is configured with an LSTM layer consisting of 64 neurons, followed by two dense layers with 64 and 1 neurons in the first and second dense layers, respectively. The network was trained for 200 epochs. LSTM networks are ideal for sequence and time-series tasks, given their capacity to capture long-term dependencies in the data. This model leverages these properties to learn complex patterns in the input data. The aforementioned LSTM network architecture is detailed in the next section.

3. LSTM Network Architecture

While Section 2 describes the general aspects of the LSTM model, this section delves into the specifics of the machine learning model designed to predict global temperatures based on Amazon rainforest deforestation data. Additionally, it covers the hyperparameter optimization of the model.
The network architecture consists of a unidirectional LSTM model, comprising a single LSTM layer followed by a dense layer, as illustrated schematically in Figure 3. The LSTM layer processes the temporal input X t m , which corresponds to the deforestation data from the 297 Amazon rainforest municipalities. The input data are scaled using z-score normalization, that is the data are scaled to be a zero mean and a standard deviation of one. Scaling data are important for neural networks, providing faster convergence in learning, and ensuring that each feature contributes equally to the learning process [35]. The task of this layer is to capture the temporal behavior of the data. The LSTM layer is followed by a dense layer, the task of which is to capture the input data complexity, once the temporal dimension has been processed by the LSTM layer. Finally, an output dense layer with a single unit is used to predict the temperature y t c for a city c in a given year t. A dense layer, also known as a fully connected layer, is a fundamental building block in artificial neural networks, especially in deep learning models like feedforward neural networks and multilayer perceptrons [36]. Combining LSTM layers with dense layers is a common approach to learn high-level features, particularly for data with complex dimensionality. This technique finds applications in various fields, including vehicle trajectory analysis in traffic scenarios [37,38]. To model the average global temperature the number of recurrent neurons in the LSTM layer and the number of units in the dense layer were both set to 64, as specified in Figure 3. Three models are built using the network architecture described above, one model for the mean, average maximum, and average minimum temperature for each of the 20 cities selected around the world.

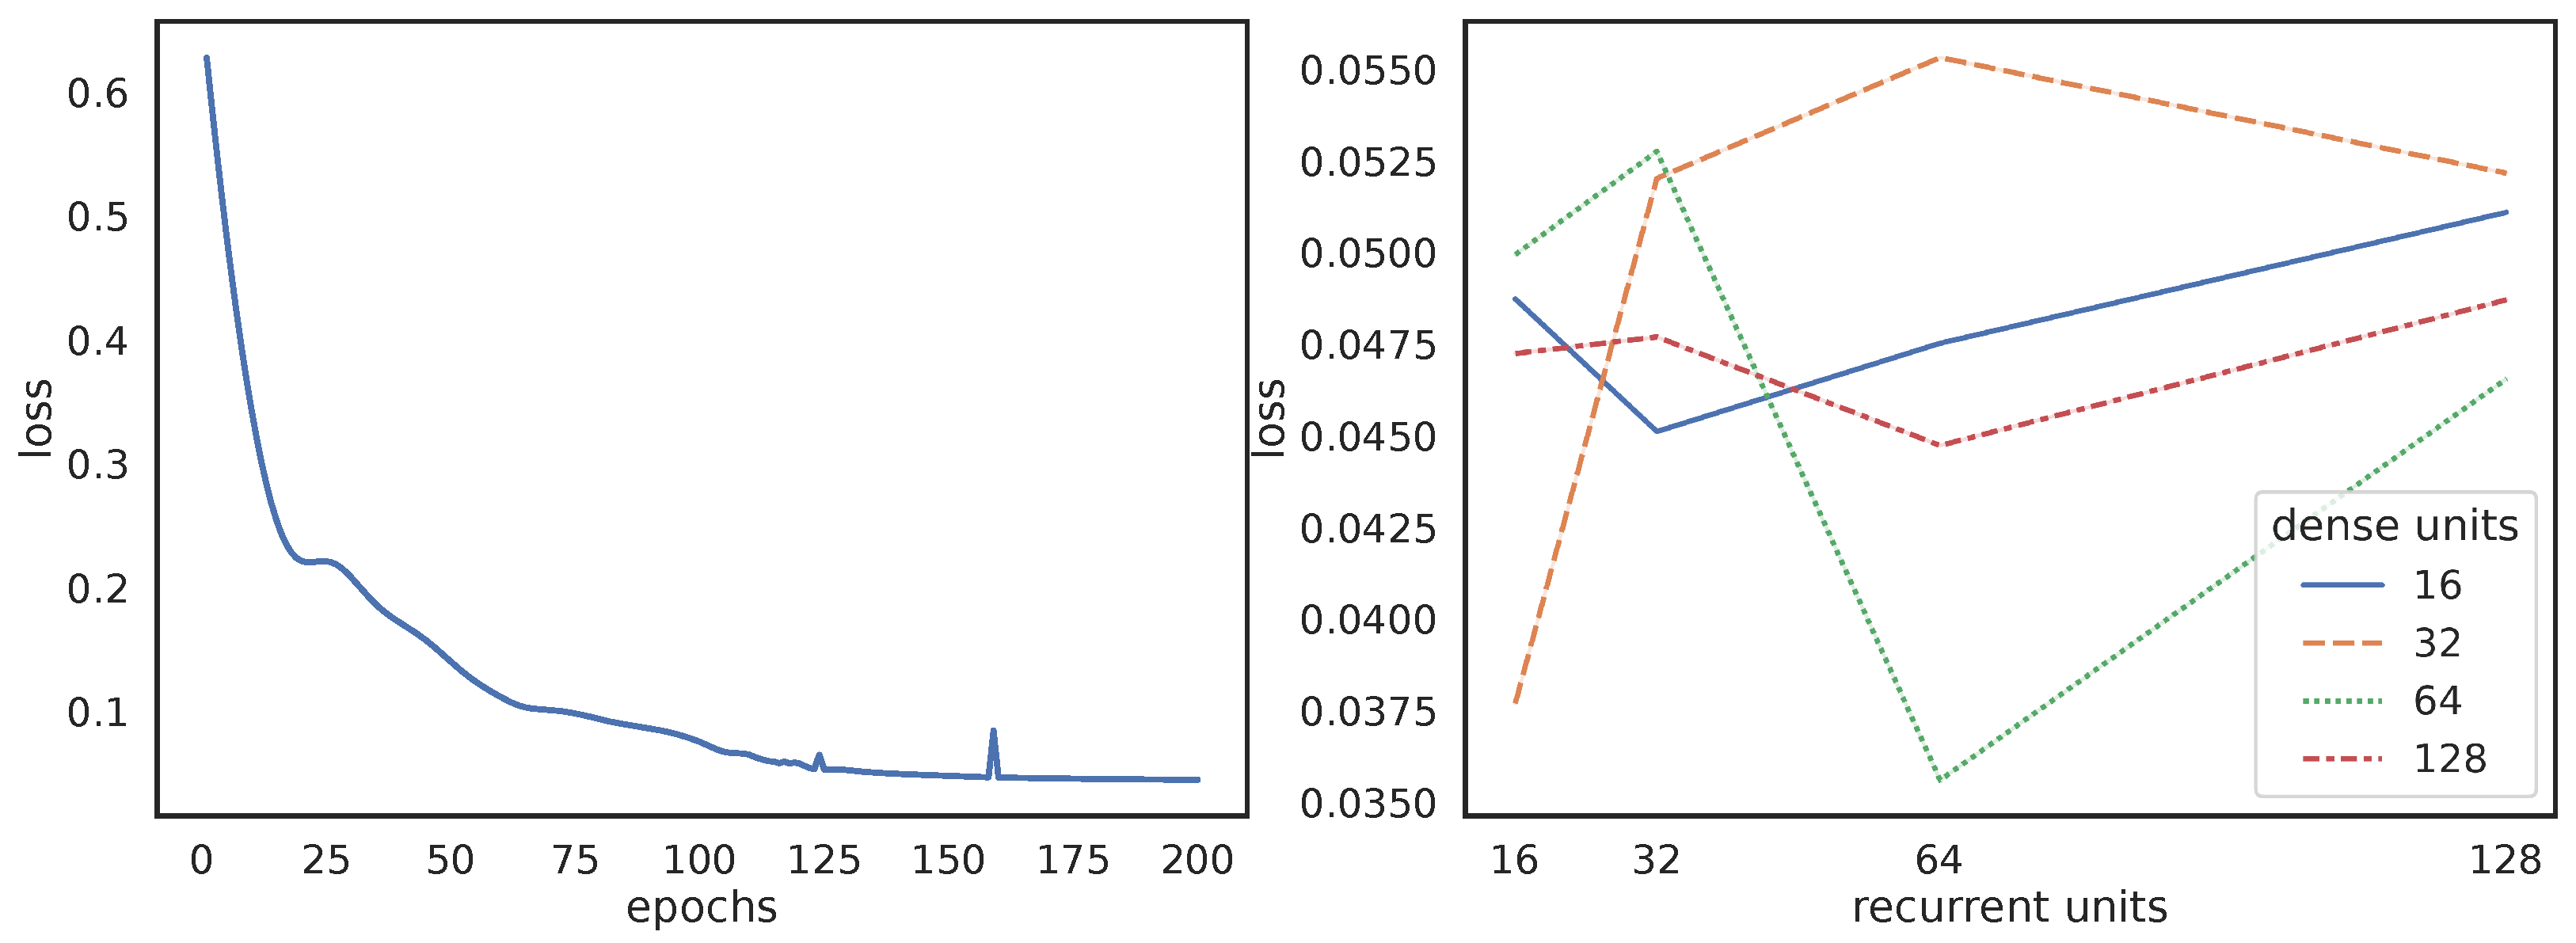
LSTM Hyperparameter Optimization
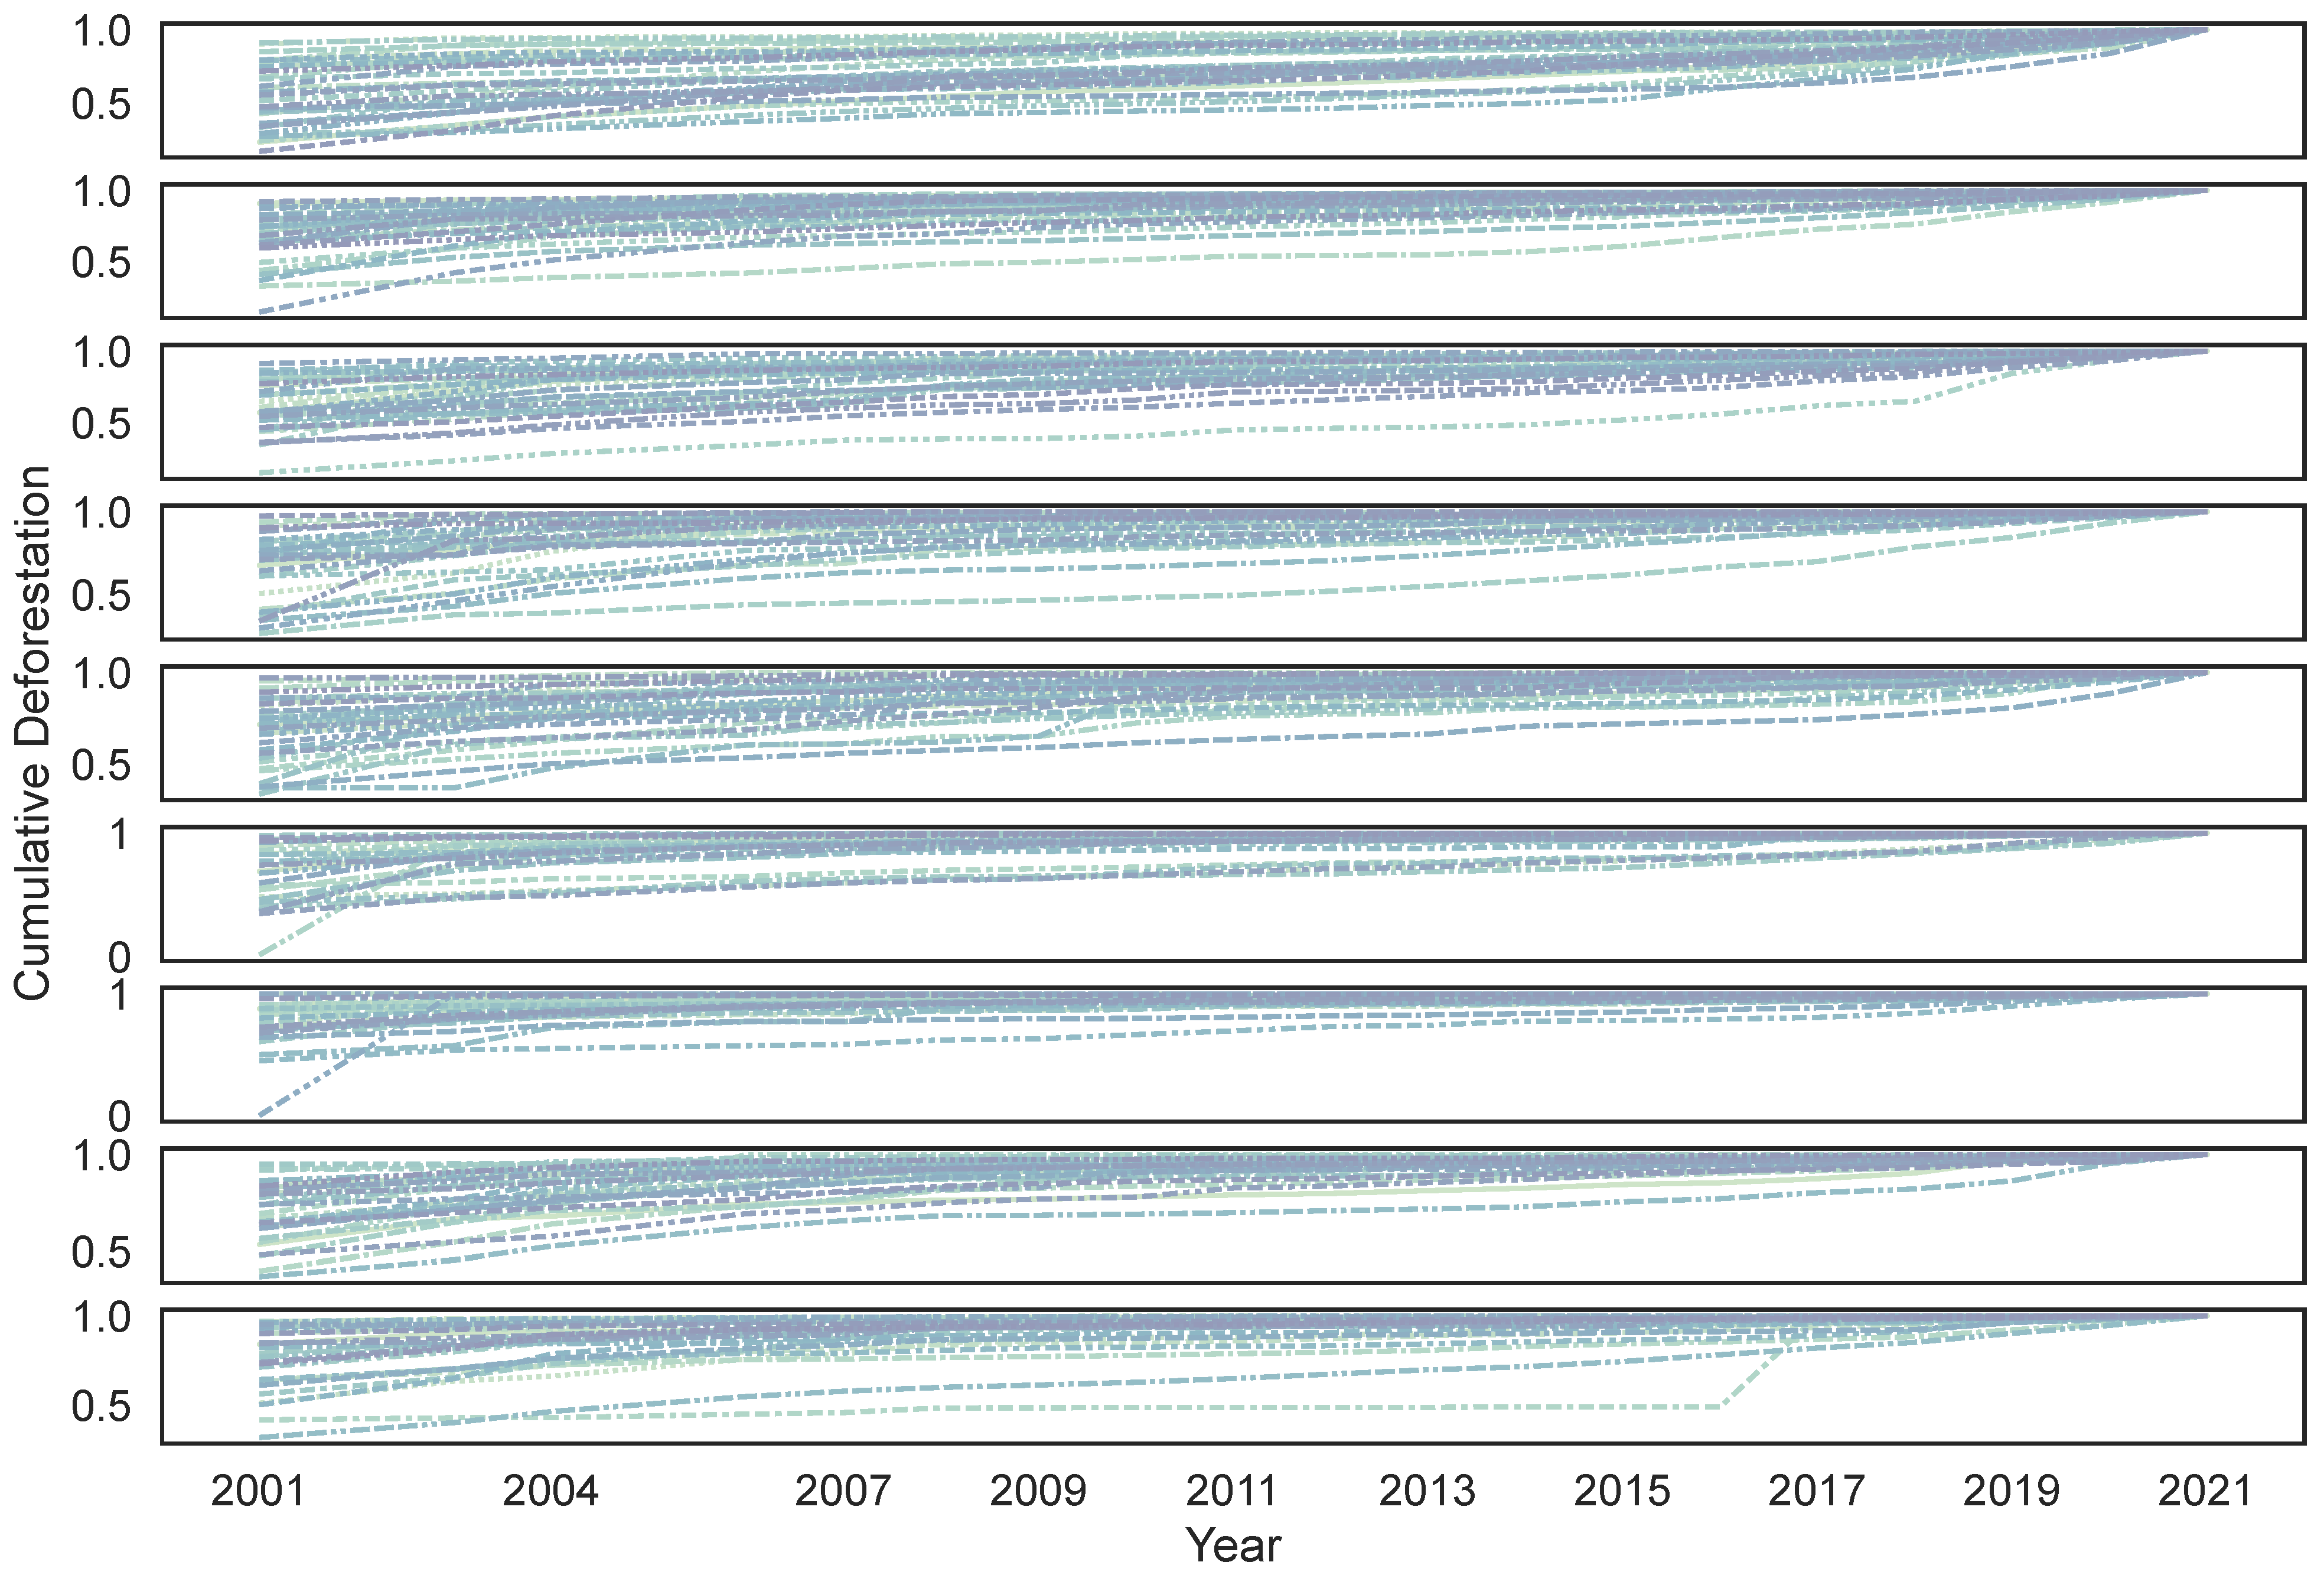
The left panel of Figure 4 left panel depicts an example of the learning convergence of the network model presented in Figure 3. It can be appreciated that, after 170 learning epochs, the learning stage achieved a steady state, with the loss converging to a value near 0.035, which corresponds to the Mean Square Error, which is used as the loss metric of the model. The behavior of the loss metric indicates that the model has effectively learned the temperature from the input deforestation data. The right panel of Figure 4 depicts the hyperparameter optimization of the model in Figure 3. The number of recurrent units (in the LSTM layer), and the number of units in the dense layers, were optimized using grid search. Grid search involves selecting a set of hyperparameters to tune, specifying a range of values for each hyperparameter, and then systematically searching through all possible combinations of these values. It was experimentally found that a single LSTM layer followed by a single dense layer (as depicted in Figure 3) was sufficient to achieve a good performance. Therefore, only the number of units was optimized through the grid search process. For the global mean temperature forecast, the optimization process can be appreciated in the right panel of Figure 4. The minimum loss (mean square error) occurs for a number of 64 recurrent and 64 dense units. A similar hyperparameters (grid search) optimization process is carried out for each of the 20 cities, with forecasted temperatures for the mean, average maximum, and average minimum temperatures.
The selected model must be capable of multivariate time series modeling, given the multivariate input X t m ( m = 297 municipalities deforestation) and temperature output. A classic statistical multivariate time series model, Vector Autoregression (VAR), was tested. However, as the number of component series (m dimension) is increased, the VAR model becomes over-parameterized [39]. In particular, the VAR model was over-forecasting the temperature, showing an exponential increment. Building classical models for this problem becomes more challenging due to the high number of time series inputs ( X t m , where m = 297 ) and a relatively short temporal sequence size (only t = 20 years) [39]. Thus, a machine learning model, LSTM, was selected to capture the data complexity in terms of the input dimiensionality (deforestation) to model the world-wide temperature.
It is worth mentioning that the allusion to data complexity refers to the high dimensionality involving 297 columns of deforestation data and temperature, despite the limited number of temporal records spanning just 20 years. This is discussed in next Section 4 Data Exploration. The LSTM model, with optimized hyperparameters, effectively captures the intricate relationship between the input deforestation data and temperature, making it the chosen model.

4. Data Exploration

The left panel of Figure 5, depicts the deforestation up to 2021 as a heat-map for the 297 Amazon municipalities. The heat-map represents deforestation in colors red (higher), yellow (medium), and green (low). The map and the deforestation data have been taken from TerraBrasilis [29]. The heat-map shows higher deforestation in the southern and eastern parts of the Amazon rainforest, aligning with the greater number of municipalities in that region. Figure 5 (right panel) displays a list of 20 cities for which temperature is modeled and forecasted. These cities represent a diverse global selection, including various continents, geographical regions (Northern and Southern Hemispheres, equatorial regions), climate zones (tropical, subtropical, and temperate), and urban settings, encompassing both coastal cities (e.g., Sydney) and inner cities (e.g., Madrid).
Figure 6 displays the normalized cumulative deforestation data for a sample of 8 Amazon municipalities out of a total of 297. The normalization is based on the maximum deforestation value in 2021, bringing all municipalities to a common scale with a maximum value of 1. In Figure 6, the cumulative deforestation data is normalized such that the value for the last registered year, 2021, is set to 1 for all municipalities. The values for the initial year, 2001, represent the percentage of the total deforestation observed in 2021. These data illustrate the change in deforestation over the 20-year period for each municipality. For instance, Altamira (depicted by the red solid line) began in 2001, with approximately 20% of its current cumulative deforestation and has shown a roughly linear increase over time. Various patterns of behavior are evident in the data. For instance, consider Campinápolis (indicated by the solid blue line), where the cumulative deforestation has exhibited remarkable stability over the past two decades. This municipality has experienced minimal changes in deforested areas from 2001 to 2021. Consider Tapauá as an example, represented by the dotted-dashed magenta line. Between 2001 and 2016, there was a gradual increase in cumulative deforestation in Tapauá, with deforested areas accounting for 60% to 70% of the total registered in 2021. However, the most rapid deforestation occurred in the last five years, bringing Tapauá to its current state.
Figure 7 displays the cumulative deforestation data for all 297 municipalities. Various patterns emerge across the 297 municipalities, with some exhibiting minimal changes over the 20-year period (lines close to or equal to 1 for all years), while others display significant variations (lines starting near 0 in the year 2001). Additionally, various change rate velocity behaviors are noticeable, encompassing linear, sublinear, and superlinear changes. This intricate and diverse behavior could potentially be captured by the LSTM network to establish a relationship between temperature and the cumulative deforestation of the Amazon rainforest.

5. Results

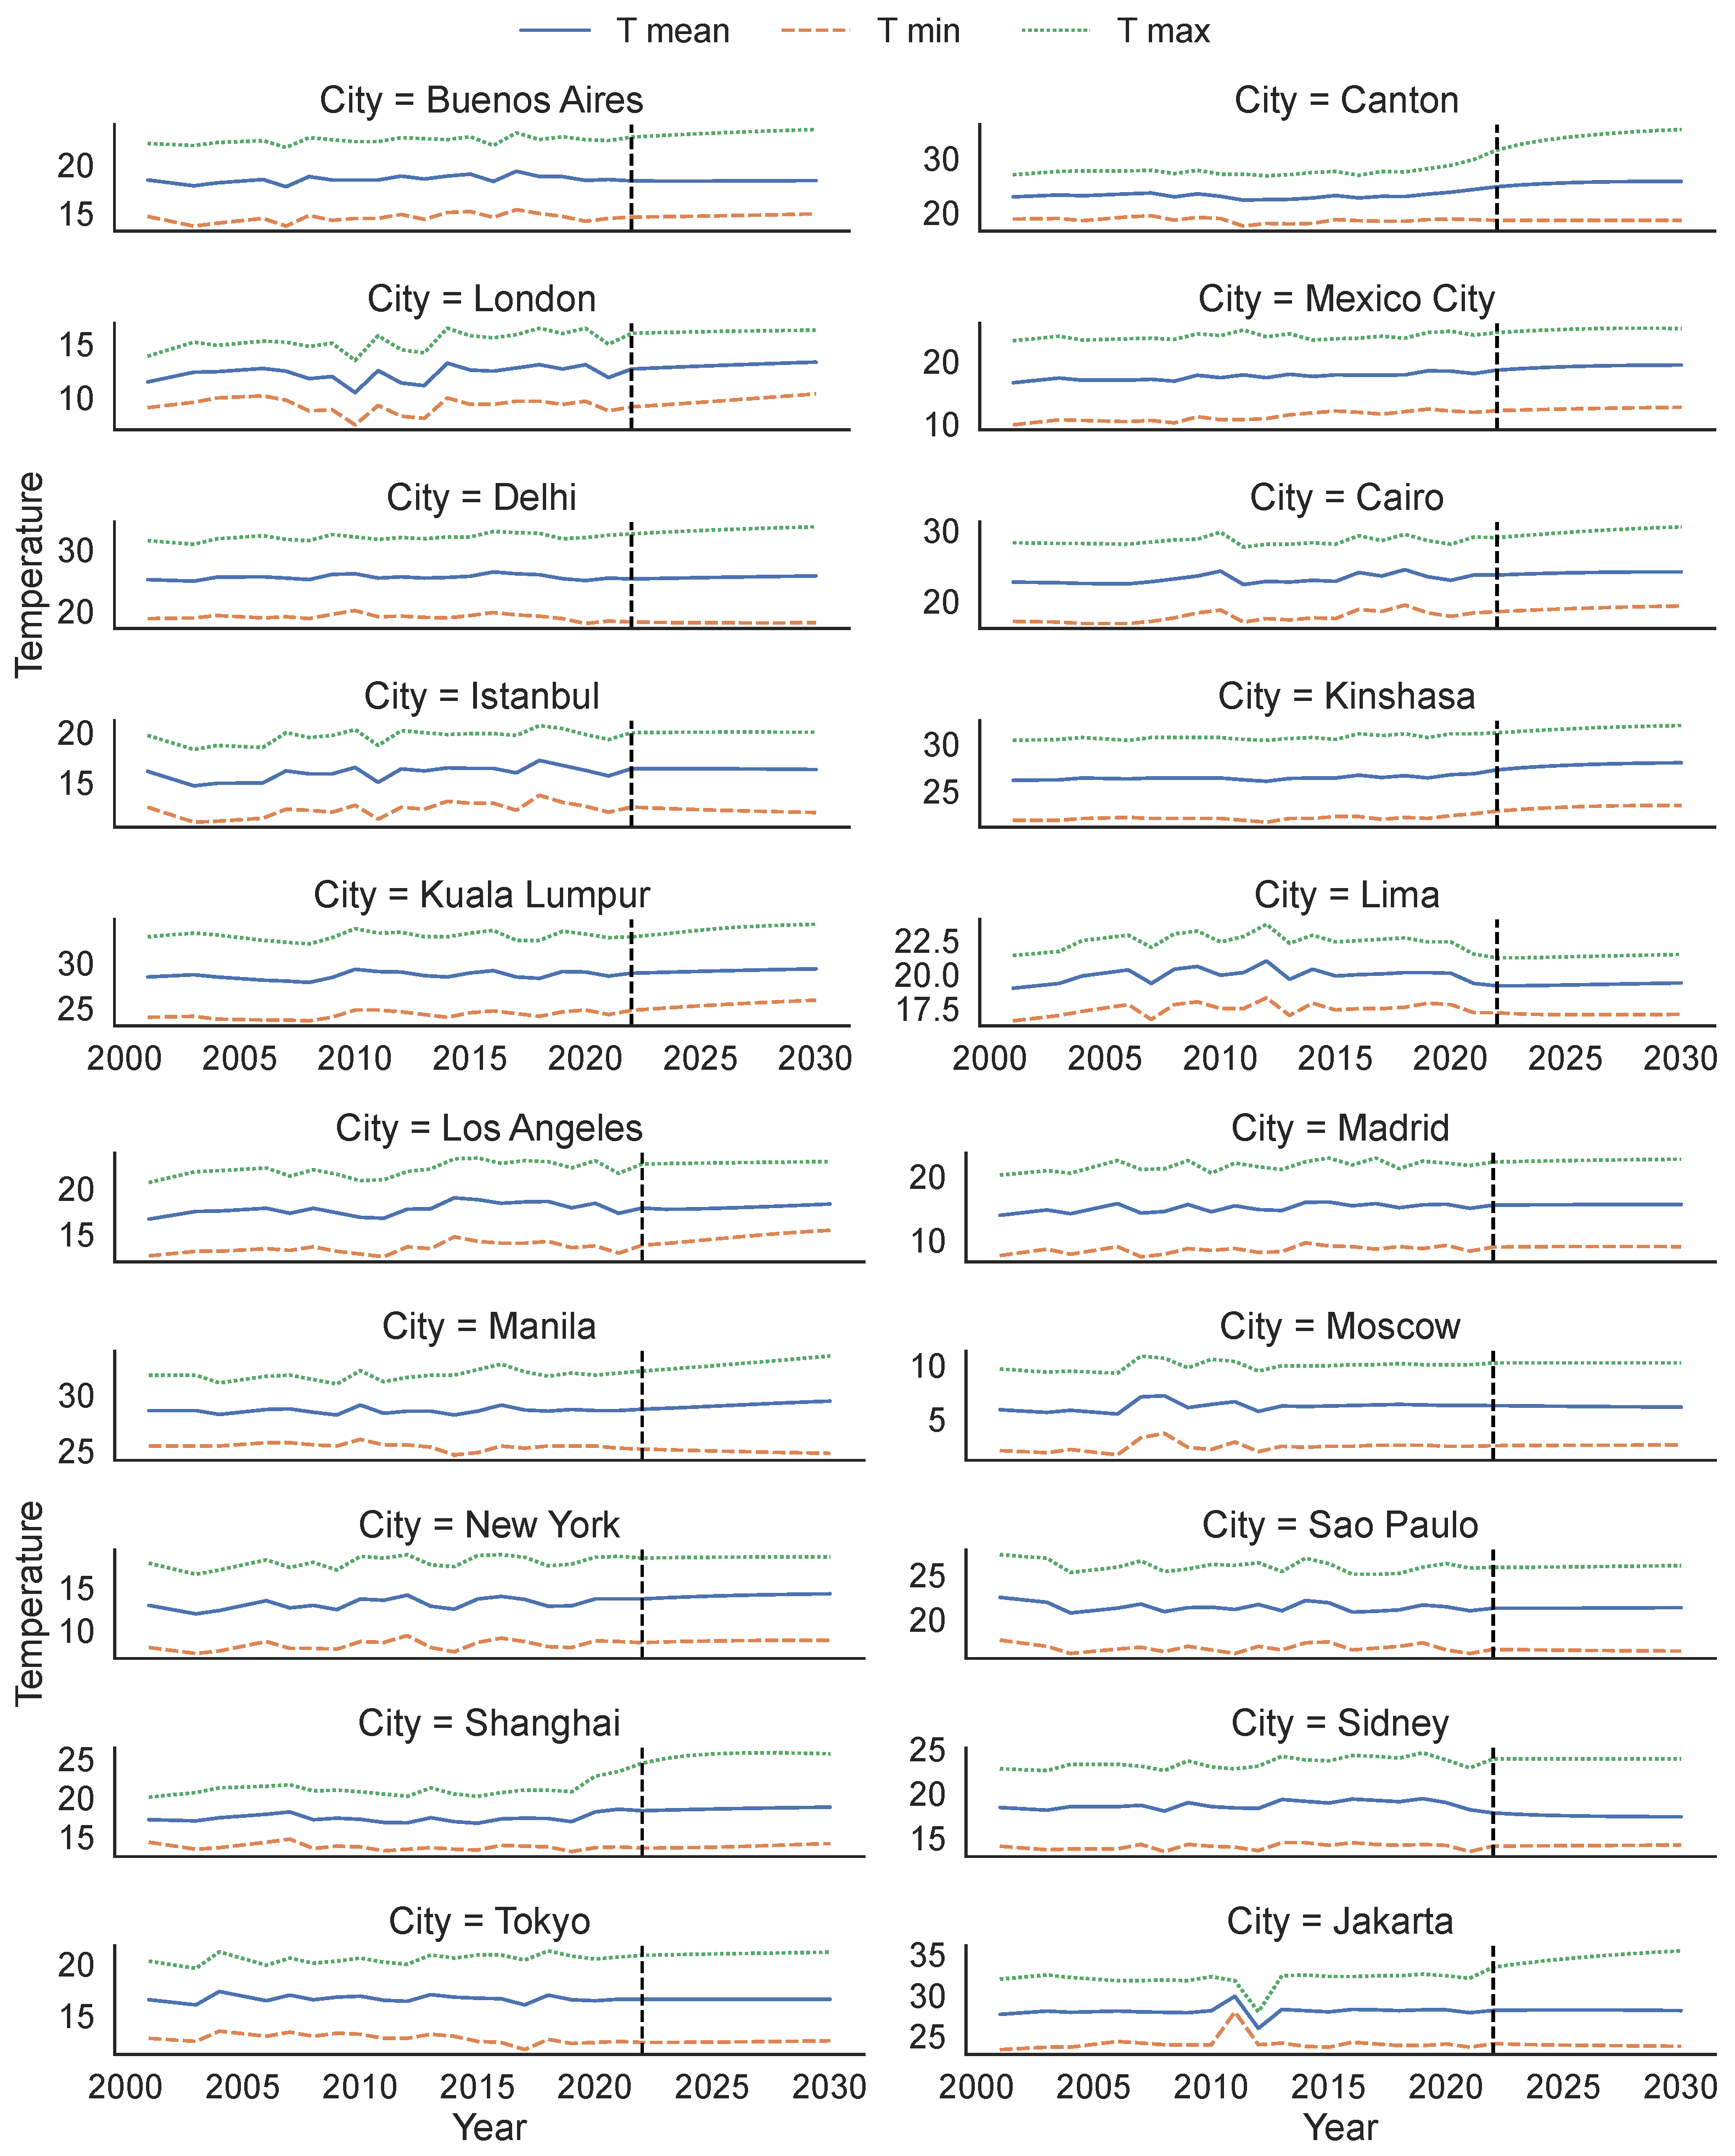
Temperature Forecasting

Figure 8 depicts the recorded temperature from 2001 to 2021 in a solid blue line. The temperature output was modeled by the LSTM network using the cumulative deforestation data from the 297 municipalities of the Amazon rainforest, as described in the previous section. The forecasted temperature is represented in orange, covering the years 2022 to 2030. The vertical dashed line marks the forecasting boundary, where the model’s input assumes a cumulative deforestation annual increase of 4% for each of the 297 municipalities. The forecasting boundary corresponds to the year 2022. From this year up to 2030, the temperature data are forecasted by the model. The global temperature exhibits a pattern of peaks and valleys, with both showing an upward trend (indicating a higher mean temperature) and a longer duration over time. This extended duration is particularly evident in the case of the peaks, which form a plateau between 2015 and 2020. In the subsequent year (2021), which marks the end of the recorded data, a valley in temperature is observed. The LSTM model predicts an even longer-lasting valley extending until 2030, likely to be succeeded by an even lengthier plateau with higher temperatures beyond 2030. This is an expected behavior in line with climate change, as we anticipate long-term alterations in the Earth’s climate patterns, which encompass shifts in temperature, as suggested by the forecast.
As described in Section 2, the LSTM network is used to model the mean, average minimum, and maximum temperatures for 20 cities around the world, see Equation (1). As with the global temperature forecast, the model used as input shows a cumulative deforestation annual increase of 4% for all the 297 municipalities of the Amazon rainforest of Brasil. The 20 cities’ (alphabetically ordered) forecasted temperatures are depicted in Figure 9 and the forecasted values are presented in Table 3. We can observe that Buenos Aires has a very stable temperature, however, an increase of 1.14 °C, from 22.50 to 23.64 °C, is forecasted in the average maximum temperature of the city. The scenario for Canton is worse for the forecasted average maximum temperature, going from 29.80 to 35.26 °C, which is an increase of 5.46 °C. This increase in average maximum temperature will also affect the temperature variability T v a r = T m a x T m i n of the city in a similar value, from a variability of 29.80 18.80 = 11 °C to 35.26 16.9 °C. This is a clear sign of the city being affected by climate change, where the temperature variability increases drastically. Canton, like many urban areas, such as the ones studied in this work, experiences the urban heat island effect, because the largest cities tend to have more concrete and asphalt, which absorb and retain heat. Deforestation, urban land use changes, and greenhouse gas emissions, among other factors, can influence such behavior. The LSTM network has successfully predicted temperature increases based on the cumulative deforestation data from the Amazon rainforest. London is forecasted to experience a steady and steep increase of around 1.5 °C in mean, average minimum, and average maximum temperatures. Mexico City is also expected to experience a steady increase in mean, average minimum, and average maximum temperatures, similar to London. Delhi’s mean temperature is predicted to increase from 25.40 to 25.75 °C, indicating a change of 1.35 °C. The average temperature variation for Delhi is influenced by a slight decrease in the average minimum temperature and a slight increase in the average maximum temperature. This effect is more pronounced in cities such as Manila and Jakarta, as shown in Figure 9. Cairo, similar to London and Mexico City, shows a consistent increase in all three temperatures, with the mean temperature increasing by 0.97 °C. Istanbul is expected to have a stable temperature up until 2030, with average maximum temperature changes of 0.73 °C. Kinshasa is predicted to experience a steady increase in all three temperatures, with a mean temperature increase of 1.17 °C. Kuala Lumpur is also projected to undergo a steady increase in all three temperatures, and the increase is notably steep, with a 0.8 °C rise in mean temperature and a 1.48 °C increase in average maximum temperature. Lima is anticipated to maintain relatively stable temperatures until 2030, with all temperatures showing minimal changes for the city. Los Angeles is expected to have steady mean and average maximum temperatures, with the average minimum temperature forecasted to increase from 12.90 to 15.42°, which is a rise of 2.52°. Madrid is projected to undergo a similar change in all temperatures, with the average maximum temperature expected to increase by approximately 1.01 °C. Manila is anticipated to experience a substantial variation in temperature, with a temperature variation ( T v a r ) increase from approximately 6.8 °C to 8.79 °C. This variation is driven by a decrease in the average minimum temperature and an increase in the average maximum temperature. Moscow’s temperature is expected to remain quite stable, with a minimal increase of 0.11 °C in mean temperature. New York’s temperatures are projected to remain relatively stable, with a minimal increase of 0.14 °C in mean temperature. Sao Paulo’s temperatures are also anticipated to remain quite stable, with a mean temperature increase of 0.35 °C. Shanghai is expected to experience a significant increase in its average maximum temperature, with an increase of 1.28 °C. Sydney is forecasted to have stable temperatures, with a slight decrease in the mean temperature of 0.79 °C. Tokyo is expected to have very stable temperatures for all three: mean, average minimum, and average maximum temperatures. Jakarta will undergo a significant change in temperature variability, as its average maximum temperature is expected to increase substantially. This will result in a change in temperature variability ( T v a r ) from 8.4 °C to 11.62 °C. This is in line with the anticipated increase in the average maximum temperature from 32.10 to 35.43 °C in 2030.

6. Discussion and Conclusions

In essence, the intricate interactions between the biosphere, such as the Amazon rainforest, and the atmosphere, particularly temperature, play a crucial role within the Earth’s climate system. These interactions have the potential to either exacerbate or alleviate climate change. Currently, many of these interactions are contributing to rising temperatures and accelerating global warming. Therefore, understanding and efficiently managing these dynamics are essential for developing resilient strategies to combat and adapt to climate change.
A temporal learning model has been introduced for predicting the temperatures of 20 cities worldwide. This model utilizes the temporal data of cumulative deforestation increments across 297 municipalities in the Amazon rainforest as its input. An LSTM network is employed to capture the temporal relationship between rainforest deforestation and temperature changes in cities across the globe. The mean, average minimum, and average maximum temperatures were modeled for cities worldwide. The data exploration of Amazon rainforest deforestation revealed its complex behavior, with the cumulative deforestation change rate exhibiting linearity, sublinearity, and superlinearity. These changes occurred at various points during the last two decades (2001 to 2021). This work has demonstrated how the LSTM network effectively mapped such complex behavior to forecast the temperature of 20 cities worldwide.
The LSTM network forecasted a variety of behaviors. For some cities, their temperatures are expected to remain stable, while others will likely experience temperature increases, with varying rates of change, including both gradual and more rapid trends. In certain cities, the temperature variation, which represents the difference between the average maximum and minimum temperatures, is forecasted to increase significantly, indicating that the temperature range between day and night or across seasons will become more pronounced. This is one of the indicators of climate change. The temperature changes forecasted for the analyzed cities, like many places worldwide, primarily stems from global climate change. The key factors driving this increase include global warming, driven by greenhouse gas accumulation in the atmosphere, leading to overall planetary warming. Metropolises also experience the urban heat island effect common in cities, with concrete and infrastructure absorbing and retaining heat. Local climate variability, and changes in land use, further influence temperature trends. Rising energy use for cooling in growing urban areas contributes, while natural climate variations, such as El Niño events, can cause short-term fluctuations. Overall, ongoing greenhouse gas emissions from human activities, like fossil fuel burning and deforestation, play a significant role in long-term temperature rise.
Given the significant influence of deforestation on global temperature change, it is crucial to reiterate the need for consolidated policies aimed at reducing deforestation in this region. As indicated in reference [40], it is essential to enact and rigorously enforce policies regulating deforestation in the Amazon. These policies should prioritize the creation of new protected areas, the preservation of indigenous lands, satellite-assisted law enforcement, and the imposition of financing limits for farmers in regions with high deforestation rates.
In future work, in order to assess climate change, one may consider a range of climate indicators, including changes in average temperatures, precipitation patterns, extreme weather events, and sea level rise, among others, to provide a more comprehensive picture of how climate change is affecting a particular city worldwide. Furthermore, additional machine learning models can be optimized to address the complexity of the input data, including techniques such as Random Forest and Light Gradient-Boosting Machines, which are adaptable for handling time series data. Temporal feature selection and engineering analysis can also be performed as part of upcoming research.

Author Contributions

Conceptualization, D.D. and J.B.P.; methodology, D.D. and M.G.-R.; software, J.B.P.; validation, D.D., M.G.-R. and J.B.P.; formal analysis, D.D., M.G.-R. and O.P.-D.; investigation, D.D. and O.P.-D.; data curation, J.B.P.; writing—original draft preparation, D.D. and J.B.P.; writing—review and editing, D.D., M.G.-R. and O.P.-D.; visualization, M.G.-R. and O.P.-D.; supervision, D.D. All authors have read and agreed to the published version of the manuscript.

Funding

This research was funded by DGIV-UDLA, grant number SIS.MGR.23.13.01, and by the MEFP-Spain, grant number PID2020-114867RB-I00.

Institutional Review Board Statement

Not applicable.

Informed Consent Statement

Not applicable.

Data Availability Statement

The data are available in the TerraBrasilis web portal, which is a platform developed by INPE to provide access to, and the query, analysis, and dissemination of the spatial data generated by government environment monitoring programs. The data are licensed under a Creative Commons Attribution-ShareAlike 4.0 International License at the following web link, accessed on 19 October 2023, http://terrabrasilis.dpi.inpe.br/en/home-page/.

Conflicts of Interest

The authors declare no conflict of interest. The funders had no role in the design of the study; in the collection, analyses, or interpretation of data; in the writing of the manuscript, or in the decision to publish the results.

References

  1. Staal, A.; Flores, B.M.; Aguiar, A.P.D.; Bosmans, J.H.; Fetzer, I.; Tuinenburg, O.A. Feedback between drought and deforestation in the Amazon. Environ. Res. Lett. 2020, 15, 044024. [Google Scholar] [CrossRef]
  2. Sierra, J.P.; Junquas, C.; Espinoza, J.C.; Segura, H.; Condom, T.; Andrade, M.; Molina-Carpio, J.; Ticona, L.; Mardoñez, V.; Blacutt, L.; et al. Deforestation impacts on Amazon-Andes hydroclimatic connectivity. Clim. Dyn. 2021, 58, 2609–2636. [Google Scholar]
  3. Ellwanger, J.H.; Kulmann-Leal, B.; Kaminski, V.L.; Valverde-Villegas, J.; VEIGA, A.B.G.; Spilki, F.R.; Fearnside, P.M.; Caesar, L.; Giatti, L.L.; Wallau, G.L.; et al. Beyond diversity loss and climate change: Impacts of Amazon deforestation on infectious diseases and public health. Anais Acad. Bras. Ciênc. 2020, 92, e20191375. [Google Scholar]
  4. Trancoso, R. Changing Amazon deforestation patterns: Urgent need to restore command and control policies and market interventions. Environ. Res. Lett. 2021, 16, 041004. [Google Scholar]
  5. Silva-Junior, C.H.; Silva, F.B.; Arisi, B.M.; Mataveli, G.; Pessôa, A.C.; Carvalho, N.S.; Reis, J.B.; Silva Júnior, A.R.; Motta, N.A.; e Silva, P.V.M.; et al. Brazilian Amazon indigenous territories under deforestation pressure. Sci. Rep. 2023, 13, 5851. [Google Scholar] [PubMed]
  6. Driga, A.M.; Drigas, A.S. Climate Change 101: How Everyday Activities Contribute to the Ever-Growing Issue. Int. J. Recent Contrib. Eng. Sci. IT 2019, 7, 22–31. [Google Scholar] [CrossRef]
  7. Yang, Y.; Saatchi, S.; Xu, L.; Keller, M.; Corsini, C.R.; Aragão, L.E.; Aguiar, A.P.; Knyazikhin, Y.; Myneni, R.B. Interannual variability of carbon uptake of secondary forests in the Brazilian Amazon (2004–2014). Glob. Biogeochem. Cycles 2020, 34, e2019GB006396. [Google Scholar] [CrossRef]
  8. Kruid, S.; Macedo, M.N.; Gorelik, S.R.; Walker, W.; Moutinho, P.; Brando, P.M.; Castanho, A.; Alencar, A.; Baccini, A.; Coe, M.T. Beyond deforestation: Carbon emissions from land grabbing and forest degradation in the Brazilian Amazon. Front. For. Glob. Chang. 2021, 4, 645282. [Google Scholar]
  9. Ruv Lemes, M.; Sampaio, G.; Fisch, G.; Alves, L.M.; Maksic, J.; Guatura, M.; Shimizu, M. Impacts of atmospheric CO2 increase and Amazon deforestation on the regional climate: A water budget modelling study. Int. J. Climatol. 2023, 43, 1497–1513. [Google Scholar] [CrossRef]
  10. Weiskopf, S.R.; Rubenstein, M.A.; Crozier, L.G.; Gaichas, S.; Griffis, R.; Halofsky, J.E.; Hyde, K.J.; Morelli, T.L.; Morisette, J.T.; Muñoz, R.C.; et al. Climate change effects on biodiversity, ecosystems, ecosystem services, and natural resource management in the United States. Sci. Total Environ. 2020, 733, 137782. [Google Scholar]
  11. Rocque, R.J.; Beaudoin, C.; Ndjaboue, R.; Cameron, L.; Poirier-Bergeron, L.; Poulin-Rheault, R.A.; Fallon, C.; Tricco, A.C.; Witteman, H.O. Health effects of climate change: An overview of systematic reviews. BMJ Open 2021, 11, e046333. [Google Scholar] [PubMed]
  12. Miyamoto, M. Poverty reduction saves forests sustainably: Lessons for deforestation policies. World Dev. 2020, 127, 104746. [Google Scholar]
  13. Fricke, E.C.; Ordonez, A.; Rogers, H.S.; Svenning, J.C. The effects of defaunation on plants’ capacity to track climate change. Science 2022, 375, 210–214. [Google Scholar] [PubMed]
  14. Dasgupta, S.; van Maanen, N.; Gosling, S.N.; Piontek, F.; Otto, C.; Schleussner, C.F. Effects of climate change on combined labour productivity and supply: An empirical, multi-model study. Lancet Planet. Health 2021, 5, e455–e465. [Google Scholar]
  15. Parmesan, C.; Morecroft, M.D.; Trisurat, Y. Climate Change 2022: Impacts, Adaptation and Vulnerability; Research Report; Intergovernmental Panel on Climate Change (IPCC-GIEC), United Nations: New York, NY, USA, 2022. [Google Scholar]
  16. Tovar, P.; Adarme, M.; Feitosa, R. Deforestation detection in the amazon rainforest with spatial and channel attention mechanisms. Int. Arch. Photogramm. Remote Sens. Spat. Inf. Sci. 2021, 43, 851–858. [Google Scholar] [CrossRef]
  17. Medvigy, D.; Walko, R.L.; Otte, M.J.; Avissar, R. Simulated changes in northwest US climate in response to Amazon deforestation. J. Clim. 2013, 26, 9115–9136. [Google Scholar]
  18. Hirota, M.; Nobre, C.A.; Alencar, A.; Arieira, J.; Costa, F.d.A.; Flores, B.; Gandour, C.; Josse, C.; Levis, C.; Póveda, G.; et al. A Call for Global Action to Move the Amazon Forest System Away from Tipping Points; Science Panel for the Amazon: Rio de Janeiro, Brazil, 2022. [Google Scholar]
  19. Pachauri, R.K.; Allen, M.R.; Barros, V.R.; Broome, J.; Cramer, W.; Christ, R.; Church, J.A.; Clarke, L.; Dahe, Q.; Dasgupta, P.; et al. Climate Change 2014: Synthesis Report. Contribution of Working Groups I, II and III to the Fifth Assessment Report of the Intergovernmental Panel on Climate Change; IPCC: Geneva, Switzerland, 2014. [Google Scholar]
  20. Yu, Y.; Si, X.; Hu, C.; Zhang, J. A review of recurrent neural networks: LSTM cells and network architectures. Neural Comput. 2019, 31, 1235–1270. [Google Scholar]
  21. Sherstinsky, A. Fundamentals of recurrent neural network (RNN) and long short-term memory (LSTM) network. Phys. Nonlinear Phenom. 2020, 404, 132306. [Google Scholar]
  22. Stocker, T.; Qin, D.; Plattner, G.K.; Tignor, M.; Allen, S.; Boschung, J.; Nauels, A.; Xia, Y.; Bex, V.; Midgley, P. Summary for policymakers. In Climate Change 2013: The Physical Science Basis. Contribution of Working Group I to the Fifth Assessment Report of the Intergovernmental Panel on Climate Change; Cambridge University Press: Cambridge, UK; New York, NY, USA, 2014. [Google Scholar]
  23. Gao, S. Deforestation prediction using time series and lstm. In Proceedings of the 2019 International Conference on Information Technology and Computer Application (ITCA), Guangzhou, China, 20–22 December 2019; pp. 95–99. [Google Scholar]
  24. Zhang, J.; Wang, Z.; Bai, L.; Song, G.; Tao, J.; Chen, L. Deforestation Detection Based on U-Net and LSTM in Optical Satellite Remote Sensing Images. In Proceedings of the 2021 IEEE International Geoscience and Remote Sensing Symposium IGARSS, Brussels, Belgium, 11–16 July 2021; pp. 3753–3756. [Google Scholar]
  25. Dominguez, D.; del Villar, L.d.J.; Pantoja, O.; González-Rodríguez, M. Forecasting amazon rain-forest deforestation using a hybrid machine learning model. Sustainability 2022, 14, 691. [Google Scholar]
  26. Liu, J.; Zhang, T.; Han, G.; Gou, Y. TD-LSTM: Temporal dependence-based LSTM networks for marine temperature prediction. Sensors 2018, 18, 3797. [Google Scholar]
  27. Liu, Y.; Li, D.; Wan, S.; Wang, F.; Dou, W.; Xu, X.; Li, S.; Ma, R.; Qi, L. A long short-term memory-based model for greenhouse climate prediction. Int. J. Intell. Syst. 2022, 37, 135–151. [Google Scholar]
  28. Hamidi, M.; Roshani, A. Investigation of climate change effects on Iraq dust activity using LSTM. Atmos. Pollut. Res. 2023, 14, 101874. [Google Scholar]
  29. Assis, L.F.F.G.; Ferreira, K.R.; Vinhas, L.; Maurano, L.; Almeida, C.; Carvalho, A.; Rodrigues, J.; Maciel, A.; Camargo, C. TerraBrasilis: A spatial data analytics infrastructure for large-scale thematic mapping. ISPRS Int. J. Geo-Inf. 2019, 8, 513. [Google Scholar]
  30. Cedar Lake Ventures. Weatherspark. Available online: https://weatherspark.com (accessed on 10 October 2023).
  31. Che, Z.; Purushotham, S.; Cho, K.; Sontag, D.; Liu, Y. Recurrent neural networks for multivariate time series with missing values. Sci. Rep. 2018, 8, 1–12. [Google Scholar]
  32. Liu, Y.; Gong, C.; Yang, L.; Chen, Y. DSTP-RNN: A dual-stage two-phase attention-based recurrent neural network for long-term and multivariate time series prediction. Expert Syst. Appl. 2020, 143, 113082. [Google Scholar]
  33. LeCun, Y.; Bengio, Y.; Hinton, G. Deep learning. Nature 2015, 521, 436–444. [Google Scholar] [PubMed]
  34. Hochreiter, S.; Schmidhuber, J. Long Short-Term Memory. Neural Comput. 1997, 9, 1735–1780. [Google Scholar]
  35. Ahsan, M.M.; Mahmud, M.P.; Saha, P.K.; Gupta, K.D.; Siddique, Z. Effect of data scaling methods on machine learning algorithms and model performance. Technologies 2021, 9, 52. [Google Scholar] [CrossRef]
  36. Javid, A.M.; Das, S.; Skoglund, M.; Chatterjee, S. A relu dense layer to improve the performance of neural networks. In Proceedings of the ICASSP 2021–2021 IEEE International Conference on Acoustics, Speech and Signal Processing (ICASSP), Toronto, ON, Canada, 6–11 June 2021; pp. 2810–2814. [Google Scholar]
  37. Phillips, D.J.; Wheeler, T.A.; Kochenderfer, M.J. Generalizable intention prediction of human drivers at intersections. In Proceedings of the 2017 IEEE Intelligent Vehicles Symposium (IV), Los Angeles, CA, USA, 11–14 June 2017; pp. 1665–1670. [Google Scholar]
  38. Altché, F.; de La Fortelle, A. An LSTM network for highway trajectory prediction. In Proceedings of the 2017 IEEE 20th International Conference on Intelligent Transportation Systems (ITSC), Yokohama, Japan, 16–19 October 2017; pp. 353–359. [Google Scholar]
  39. Nicholson, W.B.; Wilms, I.; Bien, J.; Matteson, D.S. High dimensional forecasting via interpretable vector autoregression. J. Mach. Learn. Res. 2020, 21, 6690–6741. [Google Scholar]
  40. Busch, J.; Engelmann, J. Cost-effectiveness of reducing emissions from tropical deforestation, 2016–2050. Environ. Res. Lett. 2017, 13, 015001. [Google Scholar]
Figure 1. Schematic representation of a Recurrent Neural Network.
Sustainability 15 15152 g001
Figure 2. Schematic representation of an LSTM unit.
Sustainability 15 15152 g002
Figure 3. Network architecture. X t m corresponds to the deforestation input. y t c corresponds to the temperature of the city to be modeled. The number of units of the LSTM (64) and Dense layers (64), are hyperparameters to be optimized.
Sustainability 15 15152 g003
Figure 4. Left panel: Loss convergence of the model after 200 learning epochs. Right panel: Grid search optimization of the model hyperparameters.
Sustainability 15 15152 g004
Figure 5. Left Panel: A heatmap illustrating Amazon rainforest deforestation data up to 2021, with colors ranging from red (high deforestation) to yellow and light green (low deforestation). Right Panel: A list of cities for which temperature forecasts have been generated.
Sustainability 15 15152 g005
Figure 6. Cumulative deforestation rates for selected municipalities, shown using min–max normalization for comparative purposes.
Sustainability 15 15152 g006
Figure 7. Min–max scaling of cumulative deforestation data for the 297 municipalities is displayed. Each panel, from top to bottom, showcases 33 municipalities, presented in alphabetical order.
Sustainability 15 15152 g007
Figure 8. Forecasted global (Earth) mean temperature up until 2030. The forecasting boundary corresponds to the year 2022. From this year up to 2030, the data are forecasted by the model.
Sustainability 15 15152 g008
Figure 9. Forecasted mean, average minimum, and maximum temperature for cities worldwide. Vertical dashed lines correspond to the forecasting boundary.
Sustainability 15 15152 g009
Table 1. Data description.
Data Variables and Dimension
NotationVariableType of DataData DimensionValues/Description
tYearNumerical20 years ( 2001 , , 2021 )Temporal index of the data (deforestation and temperature)
mMunicipalityText297 municipalities (Altamira, Barcelos, ⋯)Name of the Amazon Municipality (spatial index of the deforestation data)
cCityText20 cities (Buenos Aires, ⋯, Yakarta)Name of the city (spatial index of the temperature data)
Y t c , T m e a n Mean TemperatureNumerical (°C)20 years (mean) temperature ( T m e a n , c i t y 2001 , , T m e a n , c i t y 2021 )The mean temperature recorded in that year for a specific city
Y t c , T m i n Minimum TemperatureNumerical (°C)20 years ((avg. minimum)) temperature ( T m i n , c i t y 2001 , , T m i n , c i t y 2021 )The average minimum temperature recorded in that year for a specific city.
Y t c , T m a x Maximum TemperatureNumerical (°C)20 years (avg. maximum) temperature ( T m a x , c i t y 2001 , , T m a x , c i t y 2021 )The average maximum temperature recorded in that year for a specific city.
X t m Cumulative deforestationNumerical (km 2 ) X t m , with t years and m municipalities, t { 2001 , , 2021 } , m { 1 , , 297 } municipalitiesTotal accumulated deforestation area up to that year for a given municipality
Table 2. List of cities for which temperature is modeled.
CityCountryContinent
Buenos AiresArgentinaSouth America
CantonChinaAsia
LondonUnited KingdomEurope
Mexico CityMexicoSouth America
DelhiIndiaAsia
CairoEgyptAfrica
IstanbulTurkeyEurasia
KinshasaDemocratic Republic of the CongoAfrica
Kuala LumpurMalaysiaAsia
LimaPeruSouth America
Los AngelesUnited States of AmericaNorth America
MadridSpainEurope
ManilaPhilippinesAsia
MoscowRussiaEurope
New YorkUnited States of AmericaNorth America
Sao PauloBrazilSouth America
ShanghaiChinaAsia
SidneyAustraliaAustralia
TokyoJapanAsia
JakartaIndonesiaAsia
Table 3. Forecasted temperature for cities around the world. Bold rows correspond to the last observed temperature in the year 2021 (forecasting boundary) and the last forecasted year, 2030.
Buenos AiresCantonLondonMexico CityDelhi
YearT meanT minT maxT meanT minT maxT meanT minT maxT meanT minT maxT meanT minT max
202118.5014.5022.5024.3018.8029.8011.908.8015.0018.0511.9024.2025.4018.4032.40
202218.3514.6222.8624.8018.6631.5012.709.1816.0318.6112.1624.5925.2518.2332.60
202318.3414.6622.9925.1218.6532.5512.799.3116.0818.8412.2624.8025.3318.1832.80
202418.3414.6923.1125.3518.6433.2712.889.4516.1319.0212.3424.9725.4018.1432.98
202518.3414.7323.2125.5118.6433.8112.979.6016.1719.1512.4225.1025.4718.1233.15
202618.3514.7723.3125.6318.6334.2413.059.7516.2119.2512.4925.2025.5318.1133.30
202718.3514.8123.4125.7118.6334.5813.139.9116.2419.3212.5525.2625.5918.1033.43
202818.3714.8623.4925.7618.6334.8613.2010.0716.2719.3712.6025.2825.6418.1033.55
202918.3814.9123.5725.7718.6335.0813.2710.2216.3019.4012.6525.2725.7018.1033.65
203018.3914.9623.6425.7518.6335.2613.3410.3816.3219.4112.6925.2425.7518.1133.74
CairoIstanbulKinshasaKuala LumpurLima
202123.7518.4029.1015.6512.0019.3026.8522.6031.1028.5524.3032.8019.3517.2021.50
202223.7418.5629.0316.3812.5219.9827.2622.8831.2028.8724.7632.8919.1717.2021.23
202323.8718.7229.2816.3912.4120.0127.4723.0631.3528.9424.9433.1219.1817.1121.24
202423.9618.8629.5316.3812.3320.0327.6323.2031.4929.0125.1133.3619.2017.0721.27
202524.0418.9829.7516.3712.2520.0427.7523.3031.6129.0725.2733.6419.2317.0521.30
202624.1019.0829.9616.3612.1920.0527.8423.3831.7129.1425.4133.8619.2717.0521.34
202724.1419.1730.1416.3512.1320.0527.9123.4331.8029.2025.5434.0119.3017.0521.38
202824.1719.2530.3016.3312.0720.0427.9623.4731.8729.2525.6734.1319.3317.0621.42
202924.1919.3230.4316.3112.0220.0427.9923.4831.9329.3025.7834.2119.3617.0721.45
203024.1919.3730.5416.2911.9720.0328.0223.4831.9729.3525.8834.2819.3917.0821.48
Los AngelesMadridManilaMoscowNew York
202117.3012.9021.7015.058.3021.8028.6025.2032.006.302.5010.1013.708.7018.70
202217.8713.7722.7415.558.9322.3528.7225.1232.176.292.5510.2513.718.5818.51
202317.7413.9622.7815.588.9722.4428.8025.0632.326.262.5710.2713.848.6618.55
202417.7714.1922.8215.609.0022.5228.8925.0132.486.242.5810.2813.958.7218.58
202517.8314.4322.8515.629.0222.5828.9924.9532.656.222.5910.2814.048.7718.60
202617.9114.6722.8915.639.0322.6429.0924.9032.816.202.6010.2714.128.8118.62
202718.0014.8922.9215.649.0322.6929.1924.8632.996.192.6010.2714.188.8318.63
202818.1015.0922.9415.659.0222.7329.2924.8133.176.172.6110.2614.238.8418.64
202918.2115.2722.9715.669.0122.7729.3724.7733.356.162.6110.2614.278.8518.64
203018.3215.4223.0015.679.0022.8129.4524.7333.526.152.6110.2614.308.8418.65
Sao PauloShanghaiSidneyTokyoJakarta
202121.0016.2025.8018.5513.7023.4018.2013.5022.9016.6012.5020.7027.9023.7032.10
202221.2816.6625.8818.3513.5424.4717.8414.1123.9216.6012.4020.8728.1824.1433.44
202321.2816.6225.8918.4313.5725.0917.6914.1323.9216.6012.4120.9228.2124.0533.83
202421.2816.5925.9018.5113.6125.4617.6014.1423.9216.5912.4220.9628.2324.0034.16
202521.2916.5725.9318.5713.6625.6717.5314.1623.9216.5912.4321.0028.2423.9634.45
202621.3016.5525.9518.6313.7425.7717.4914.1723.9216.5912.4521.0428.2423.9234.70
202721.3116.5325.9818.6813.8325.8117.4514.1923.9216.5912.4821.0728.2323.8934.92
202821.3216.5126.0118.7313.9425.8017.4314.2023.9216.6012.5021.1128.2123.8635.11
202921.3416.4926.0418.7814.0425.7517.4114.2223.9216.6012.5321.1428.1823.8435.28
203021.3516.4826.0718.8114.1325.6817.4114.2423.9216.6012.5621.1728.1523.8135.43
Disclaimer/Publisher’s Note: The statements, opinions and data contained in all publications are solely those of the individual author(s) and contributor(s) and not of MDPI and/or the editor(s). MDPI and/or the editor(s) disclaim responsibility for any injury to people or property resulting from any ideas, methods, instructions or products referred to in the content.

