Article

Machine-Learning-Based Comprehensive Properties Prediction and Mixture Design Optimization of Ultra-High-Performance Concrete

1
School of Environment and Architecture, University of Shanghai for Science and Technology, Shanghai 200093, China
2
School of Civil Engineering, Tongji University, Shanghai 200092, China
3
Shanghai Construction Industry Fifth Construction Group Co., Ltd., Shanghai 200063, China
*
Author to whom correspondence should be addressed.
Sustainability 2023, 15(21), 15338; https://doi.org/10.3390/su152115338
Submission received: 31 August 2023 / Revised: 7 October 2023 / Accepted: 17 October 2023 / Published: 26 October 2023
(This article belongs to the Special Issue Decarbonization in the Cement and Concrete Industry)

Abstract

:
Ultra-high-performance concrete (UHPC) is widely used in the field of large-span and ultra-high-rise buildings due to its advantages such as ultra-high strength and durability. However, the large amount of cementitious materials used results in the cost and carbon emission of UHPC being much higher than that of ordinary concrete, limiting the wide application of UHPC. Therefore, optimizing the design of the UHPC mix proportion to meet the basic properties of UHPC with low carbon and low cost at the same time will help to realize the wide application of UHPC in various application scenarios. In this study, the basic properties of UHPC, including the compressive strength, flexural strength, fluidity, and shrinkage properties, were predicted by machine-learning algorithms. It is found that the XGBoost algorithm outperforms others in predicting basic properties, with MAPE lower than 5% and R2 higher than 0.9 in four output properties. To evaluate the comprehensive performance of UHPC, a further analysis was conducted to calculate the cost- and carbon-emissions-per-unit volume for 50,000 UHPC random mixes. Combined with the analytical hierarchy process (AHP) model, the comprehensive performance of UHPC, including basic properties, cost-per-unit volume, and carbon-emissions-per-unit volume, was evaluated. This study proposes an optimized UHPC mix proportion, based on low-cost or low-carbon emission, oriented to comply with the excellent overall performance and obtain its corresponding various properties.

1. Introduction

Ultra-high-performance concrete (UHPC) is a novel cementitious composite material that has a 28-day compressive strength value ≥ 120 MPa, a tensile strength value ≥ 5 MP, a slump value ≥ 160 mm, and a modulus of elasticity ranging from 40 GPa to 60 GPa [1,2,3,4]. When compared to conventional concrete, UHPC exhibits superior workability and durability properties, making it a popular choice in engineering and construction applications [5,6,7]. UHPC is widely regarded as one of the most promising construction materials for future sustainable infrastructure projects [8]. The outstanding properties of UHPC are heavily influenced by the incorporation of mineral admixtures, steel fibers, and superplasticizers. Mineral admixtures typically employed in UHPC formulations include silica fume, fly ash, and slag. Silica fume, for instance, can optimize the internal pore structure of UHPC and significantly enhance the compactness of the system, resulting in improved compressive strength and flexural resistance [9,10,11]. Fly ash contributes to improving the compatibility and the flowability of UHPC, which reduces the consumption of high-priced superplasticizers [12,13,14,15,16]. Moreover, the addition of slag can decelerate the hydration process and refine the microstructure of UHPC, ultimately resulting in the improved mechanical properties of the material [17,18,19]. Incorporating steel fibers into UHPC can inhibit the propagation and expansion of cracks, thereby enhancing the material’s flexural and tensile properties [20,21,22,23]. Furthermore, the use of superplasticizers in UHPC formulations allows for the achievement of high workability without compromising the material’s mechanical properties and durability [24,25].
The synergistic relationship among the various constituents in UHPC creates a typical multivariate nonlinear problem when predicting its properties, resulting in challenges in establishing prediction models and low prediction accuracy. Cheng et al. [26] attempted to apply the compact stacking model to the formulation of UHPC. Chen et al. [27] guided the design of concrete as well as UHPC properties by a multi-scale analysis method. Ghafari et al. [28] used the response surface methodology (RSM) statistical model to predict the properties of the mixed steel fiber self-compacting properties of UHPC. While each of these methods plays an essential role in optimizing the UHPC mix ratio, the closest packing method cannot account for the chemical effects of the structural forming process, the multiscale analysis method involves excessively high-resolution microscopic parameters, and the RSM method has limited accuracy. To address the fluctuation of UHPC properties caused by material properties, data-based machine-learning algorithms offer alternative modeling tools with complex internal structures that can predict concrete properties with greater accuracy [29]. Machine-learning algorithms have been widely used in concrete properties prediction, including neural networks [30,31,32,33], tree-based methods [34,35,36], and boosting-based methods [37,38]. In terms of mix ratio optimization, Lee et al. [39] optimized the cost and compressive strength of high-performance concrete using a neural network and a harmonic search algorithm. Cheng et al. [40] optimized the mix ratio of high-property concrete using support vector regression and a genetic algorithm, which found the minimum cost of the mix ratio at a specified compressive strength.
However, these optimization methods are designed to optimize a single objective, while UHPC requires several properties to be considered simultaneously in practical engineering applications. Therefore, it is necessary to evaluate the comprehensive properties to formulate UHPC that better meet actual engineering requirements. In order to address the multi-objective problem, the analytic hierarchy process (AHP) method is utilized as an algorithm to evaluate the properties of UHPC. This approach offers both qualitative and quantitative decision-making criteria for a limited number of multi-criteria decision problems, resulting in an optimized mix design [41]. El-Mikawi et al. [42] developed an AHP model to choose optimal advanced materials for infrastructure maintenance and assess their properties in comparison with traditional materials. Cuadrado et al. [43] developed an AHP-based approach that allows for the simultaneous consideration of safety, social, environmental, economic, functional, and aesthetic factors in the calculation of sustainability indices for industrial buildings. Gigliarelli et al. [44] proposed an AHP model that takes into account a range of architectural, conservation, energy, environmental, and economic considerations for assessing various energy retrofitting options in historical buildings.
The typical UHPC compositions use large amounts of cement and high-priced raw materials to satisfy the ultra-high performance, resulting in elevated production costs and a large amount of CO2 emissions (0.68–0.85 t) [45,46,47,48,49]. Achieving a balance between the desired material properties, production costs, and carbon emissions is critical in optimizing the design of the UHPC mix proportions. Meanwhile, the conventional method of designing a UHPC mix often involves extensive trial-and-error testing, a process that can be both laborious and costly. In this study, the prediction models established by machine-learning algorithm models were compared to select the suitable model for UHPC compressive strength prediction. The comprehensive performance of UHPC was analyzed using AHP by combining the basic properties predicted by the prediction models with the calculated cost and carbon emissions. Based on the results of the analysis, the optimal UHPC mix proportions and the corresponding properties for low-cost- or low-carbon-emission-oriented UHPC were derived. The optimization design for UHPC mixes with the best comprehensive performance was achieved based on the specific performance oriented.

2. Methodology

2.1. Overview

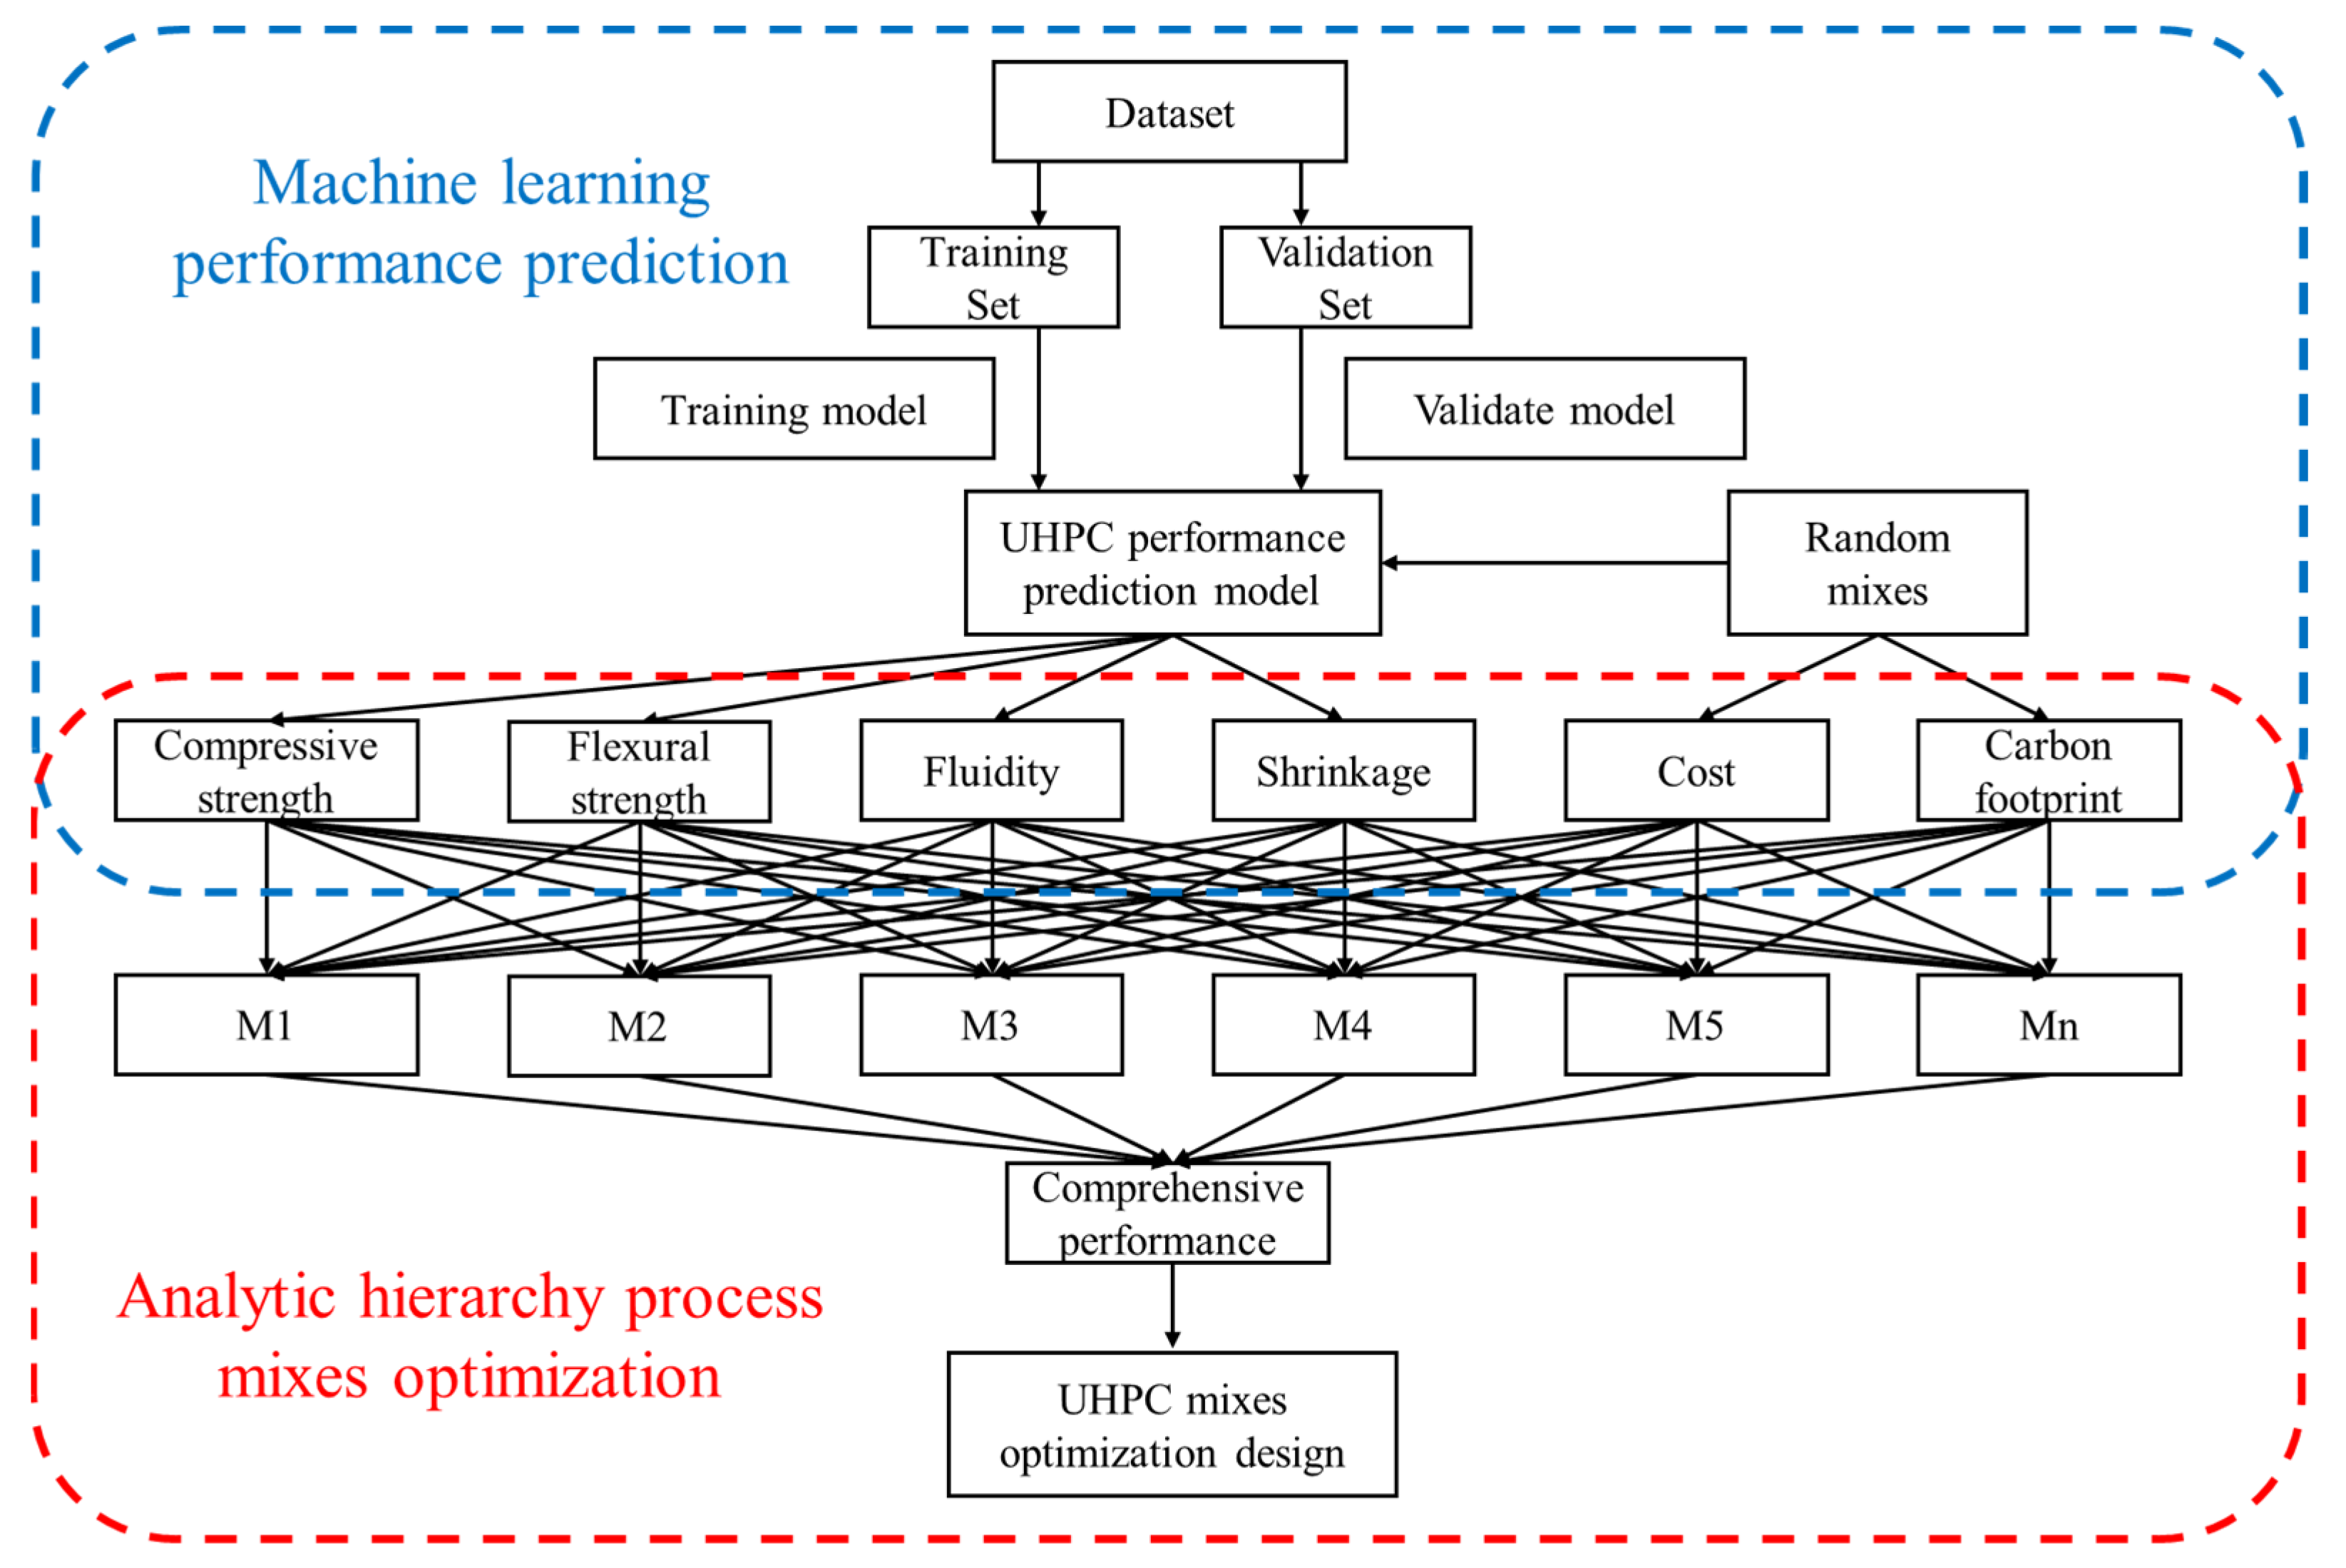
Figure 1 illustrates the process of predicting UHPC properties and optimizing mix design through machine-learning algorithms and the analytic hierarchy process. The process consists of four parts: (1) Collecting test data from the previous literature [50,51,52,53,54,55,56,57,58,59,60,61,62,63,64,65,66,67,68,69,70,71,72,73,74,75,76,77,78,79,80,81,82,83,84,85,86,87,88,89,90,91,92,93,94] and conducting statistical analysis on the collected data, as described in Section 2.2. (2) Using the collected data to establish a UHPC property prediction model through machine-learning algorithms and conducting feature importance analysis on the factors that affect the UHPC properties, as described in Section 2.3. (3) Generating a large number of random mixes, as described in Section 3.1 and Section 3.2. Based on the established UHPC property prediction model, the property prediction of random mixes and calculations of unit volume cost and carbon emissions are completed. (4) Establishing a property weight matrix through the analytic hierarchy process to obtain the comprehensive properties calculation formula under different property orientations, as described in Section 3.3 and Section 3.4. The optimization design of the UHPC mix under different property orientations is then completed based on the comprehensive property indicators of different mixes.

2.2. Data Description

Four datasets comprising a total of 592 experimental data points for UHPC compressive strength, bending strength, fluidity, and shrinkage properties are selected to train the machine-learning prediction models [50,51,52,53,54,55,56,57,58,59,60,61,62,63,64,65,66,67,68,69,70,71,72,73,74,75,76,77,78,79,80,81,82,83,84,85,86,87,88,89,90,91,92,93,94]. The input variables for the machine-learning prediction models include the content ratio of silica fume, fly ash, and slag, as well as the content ratio of fine aggregate and coarse aggregate, the water-to-binder ratio, and the steel fiber and superplasticizer contents. The content ratio represents the mass ratio of the material to the cement. In different mixtures, silica fume, fly ash, and slag are used as supplementary cementitious materials (SCMs) in various combinations of proportions. The statistical distributions in the datasets are shown in Table 1.
Figure 2 illustrates the relationship between UHPC compressive strength and its components. The results demonstrate a positive correlation between compressive strength and silica fume and steel fiber concentration, indicating an increase in strength with increased concentration. Conversely, compressive strength decreases with the increased content of fine aggregate, coarse aggregate, and water-to-binder ratio. However, there is no clear correlation trend between the contents of fly ash, slag, and superplasticizer and UHPC compressive strength.
The Pearson method is adopted to calculate the correlation coefficient as follows:
ρ = X i X ¯ Y i Y ¯ X i X ¯ 2 Y i Y ¯ 2 = E X μ X Y μ Y σ X σ Y
where ρ is the Pearson correlation coefficient, X and Y are features, X ¯ and Y ¯ are the mean value of X and Y . X i and Y i are the i-th observation of X and Y . E and σ represent the expected value and standard deviation, respectively. The value range of ρ is between −1 and 1. When ρ is greater than 0, it means that there is a positive correlation between the two features and vice versa. A larger absolute value indicates a stronger linear correlation between the two features.
The correlation heatmap, as shown in Figure 3, demonstrates correlations between the compressive strength of the content ratio of silica fume and the contents of the steel fiber. Strong negative correlations exist between the compressive strength of UHPC and the content ratio of fine aggregate, coarse aggregate, and the water-to-binder ratio. The content ratio of Fly ash and slag and the contents of superplasticizers have poor correlations to UHPC compressive strength.

2.3. Machine-Learning Algorithms

In this study, the linear regression (LR), backpropagation neural networks (BPNN), decision tree (DT), random forest (RF), gradient boosting regressor (GBR), and eXtreme gradient boosting (XGBoost) algorithms are utilized to predict the compressive strength of UHPC. The optimal algorithm is selected as the prediction algorithm for the compressive strength, flexural strength, fluidity, and shrinkage properties of UHPC. Feature importance analysis is carried out with the optimal algorithm. The software used for machine learning (ML) is Python. Python 3.8, with the packages of Keras, Pandas and Numpy, was applied to train and evaluate the ML models by developing problem-specified codes.
Figure 4 shows the general architecture of the regression-based machine-learning model. The model takes in multiple features as inputs and produces outputs for predicting UHPC’s compressive strength, flexural strength, fluidity, and shrinkage properties. The model is trained using the following input features: silica fume content ratio, fly ash content ratio, slag content ratio, fine aggregate content ratio, coarse aggregate content ratio, water-to-binder ratio, steel fiber content, and superplasticizer content. The output parameters for UHPC include compressive strength, flexural strength, fluidity, and shrinkage value.
To adequately utilize the dataset, a 5-fold cross validation is adopted. In detail, the whole dataset is randomly divided into the training set and the test set in the proportion of 80%/20%. The training set is split into 5 folds for parameter optimization, and each fold is used for training and validation in one iteration. In the i-th iteration, Fold i is the test set, and the rest are utilized to train the factor generators. In each iteration, the evaluation Ei is calculated by the mean value of root mean square error (RMSE), mean absolute error (MAE), mean absolute percentage error (MAPE), and coefficient of determination (R2).

2.3.1. Linear Regression (LR)

Linear regression is a commonly used supervised learning algorithm in machine learning for forecasting. It is used to determine the linear relationship between the dependent variable and the independent variable, and it is expressed as follows [95]:
Y = β 0 + β 1 X 1 + β 2 X 2 + + β n X n
where: Y represents the dependent variable, X n represents the independent variable, and β n represents the regression coefficient.
The linear regression algorithm elucidates a linear association between a dependent variable and one or more independent variables, hence, earning its designation as linear regression. By virtue of its capacity to delineate this linear relationship, linear regression discerns how the value of the dependent variable fluctuates in response to variations in the independent variable. The linear regression model is characterized by a straight line of slope, emblematic of the relationship between the variables.

2.3.2. Backpropagation Neural Networks (BPNN)

Neural networks are mathematical models that simulate the complex network of neurons in the human brain. They are powerful tools for large-scale distributed parallel information processing [96]. The backpropagation neural network (BPNN) is a widely used artificial neural network consisting of an input layer, an output layer, and one or more hidden layers. The topology of the BPNN is depicted in Figure 5. The training process of the BPNN involves finding the optimal threshold and weight to minimize the discrepancy between the predicted value and the actual value, which consists of two stages: the forward propagation stage for the input signal and the backward propagation stage for the error signal. Typically, the thresholds and weights are initially assigned randomly. During training, the output generated by the network is compared with the actual output, and the error is then propagated back from the output layer to the input layer to adjust the thresholds and weights [31,97,98]. This cycle is repeated, and the thresholds and weights are continuously adjusted, resulting in an improvement in the prediction accuracy of the BPNN [99].

2.3.3. Decision Tree (DT)

The decision tree algorithm is a widely used machine-learning method that can achieve satisfactory results in both the classification and regression research. The objective of a decision tree is to create partitions in the predictor in order to predict the target variable based on the partitions between the input variables. It recursively constructs a binary decision tree, which contains three parts: internal nodes, leaf nodes, and directed edges. The selection of branch points for each branch is the key to decision tree construction.
The steps to implement a decision tree are as follows:
(1)
Initialize the root node, define the model input training dataset D and the model output of the fitted decision tree.
(2)
Starting from the root node of the tree, traverse the sample features, scan the segmentation points for a certain feature, and select the segmentation point s and segmentation variable j that minimize the following formula.
m i n j , s m i n c 1 x j R 1 j , s y i c 1 2 + m i n c 2 x j R 2 j , s y i c 2 2
where c m is the average value of the output y i corresponding to all input instances x i in region R m .
(3)
Use the selected value pair (j, s) to divide the area and determine the corresponding output value:
R 1 j , s = x | x j s , R 2 j , s = x | x j s
c m ^ = 1 N m x i R m j , s y i , x R m , m = 1 , 2
(4)
Continue to call steps 2 and 3 until the stop condition is met.
(5)
Divide the input space M into regions R 1 , R 2 , R m to generate a decision tree:
f x = m = 1 M c m ^ I x R m
The advantage of using a decision tree algorithm is that it is capable of handling both numerical and categorical data, which makes it relatively straightforward compared to other models. However, it is important to avoid overfitting the data. One of the drawbacks of decision trees is that they tend to be unstable, and even minor changes to the dataset can lead to entirely different sets of partitions [100,101].

2.3.4. Random Forest (RF)

Random forest (RF) is an efficient machine-learning method proposed in 2001 for classification, regression, and feature selection tasks [102]. The algorithm works by creating multiple decision trees using a technique called bagging, which involves sampling many similar datasets from the same source dataset [103]. The random forest algorithm introduces two random processes to improve the performance: first, it randomly selects samples from the training set and replaces them to form a self-service training set; second, it randomly selects feature attributes as candidate segmentation attributes during the decision tree building process. The introduction of two random processes in the random forest algorithm enhances its robustness to outliers and noisy data, resulting in a more stable model that overcomes the problem of overfitting. Due to its ability to handle multiple features, the random forest algorithm does not require feature selection during the modeling process, making it a suitable method for addressing such problems.

2.3.5. Gradient Boosting Regressor (GBR)

Gradient boosting regression tree (GBR) is an ensemble learning method first proposed by Friedman that employs multiple weak learners to form a powerful model [104], as shown in Figure 6. GBR, which uses a regression tree model as a weak learner, connects multiple regression trees together to form a strong ensemble learner, with the cumulative result of all trees being the final result. The fundamental concept of gradient boosting is to link multiple regression trees where each tree can only predict a small part of the data, and adding more trees can improve the overall performance. Gradient boosting is a sequential process where predictors are added to the ensemble to compensate for the errors of previous predictors. At each iteration, a new predictor is trained to predict the residuals produced by the previous predictor [100,105]. The final strong learner is the combination of all the trees. The prediction function F is an additive model in the form of the addition of several weak learners:
F x ; ω = t = 0 T α t h t x ; ω t = t = 0 T f t x ; ω t
where x is the input sample, h t is the t-th regression tree, ω is the parameter of the regression tree, and α represents the weight of each tree in the prediction function.

2.3.6. eXtreme Gradient Boosting (XGBoost)

The extreme gradient boosting tree (XGBoost) was developed by Chen and Guestrin on the basis of the traditional gradient boosting tree [106]. The XGBoost algorithm is an optimized version of the gradient boosting algorithm that integrates multiple base learners to become a powerful learner. XGBoost incrementally adds decision trees to the ensemble and fits the residual between the previous tree’s prediction and the actual value to form a new model. The newly formed model is then used as the basis for the next iteration of model learning. This iterative process results in the improved prediction accuracy of the model. Its prediction function is
y i ^ = k = 1 K f k x i , f k F
where y i ^ is the i-th prediction value of the model; f k x i is the i-th decision tree model corresponding to the input feature x i ; K is the total number of decision trees; F is the set of all decision tree model elements.
Furthermore, the main parameters in these models are shown in the following Table 2. The choice of optimization technique depends on various factors including the specific problem, the nature of the data, the model architecture, and the available computational resources. It is common practice to experiment with different optimization methods to find the one that works best for a particular machine-learning task. In this research, we used stochastic gradient descent (SGD), which updates the parameters after processing each individual training example. It is computationally more efficient but can be noisy. Momentum optimization introduces a momentum term that helps accelerate the update of parameters, especially in the presence of noisy gradients. Root mean square propagation (RMSprop) addresses the diminishing learning rates of Adagrad by using an exponentially weighted moving average of squared gradients. Adaptive moment estimation (Adam) combines aspects of both momentum optimization and RMSprop. It maintains an exponentially decaying average of past gradients and squared gradients.

3. Model Evaluation

3.1. Model Performance Evaluation Metrics

In order to evaluate the performance of the prediction model of the machine-learning algorithm, this paper considers four indicators, namely: root mean square error (RMSE), mean absolute error (MAE), mean absolute percentage error (MAPE), and coefficient of determination (R2), which are defined as follows:
R M S E = 1 n i = 1 n y i y ^ i 2
M A E = 1 n i = 1 n y i y ^ i
M A P E = 1 n i = 1 n y i y ^ i y i
R 2 = 1 i = 1 n y i y ^ i 2 i = 1 n y i y ¯ i 2
where y i represents the actual value, y ^ i represents the predicted value, y ¯ i represents the average value of the actual value, and n represents the number of test data samples. RMSE reflects the deviation between the predicted value and the tested value, MAE reflects the actual situation of the predicted error, MAPE reflects the ratio of the predicted error to the actual value, and R2 shows the degree of linear correlation between the predicted value and the tested value, RMSE. The smaller the MAE and MAPE and the closer R2 is to 1, the better the performance of the prediction model.

3.2. UHPC Compressive Strength Prediction Results

Table 3 presents the performance results of the UHPC compressive strength prediction models established by LR, BPNN, DT, RF, GBR, and XGBoost. The results show that the compressive strength of UHPC is accurately predicted by DT, RF, GBR, and XGBoost, with XGBoost showing the best performance. In contrast, BPNN has relatively poor performance, and LR exhibits the worst performance among all the models.
Figure 7 shows the relationship between the actual and predicted values of UHPC compressive strength for different machine-learning algorithms. It is evident that DT, RF, GBR, and XGBoost algorithms provide close-to-center-line predictions that are tightly clustered around the center line, indicating a small deviation between the predicted and actual values and accurate prediction of the compressive strength of UHPC. However, LR and BPNN exhibit a large gap with the center line for most of the points in Figure 7, suggesting a relatively large deviation between the predicted and actual values.
Tree-based machine-learning models and boosting techniques have demonstrated a strong performance in predicting UHPC compressive strength, which benefits from their ability to capture the complex nonlinear relationships between mix ratio factors and final performance by forming nodes and leaves that gradually improve with weak learners. In contrast, LR performed poorly due to the nonlinear and complex nature of the relationship, while BPNN was prone to get stuck in local extreme values, leading to reduced model performance.

3.3. Prediction of Flexural Strength, Fluidity, and Shrinkage Properties of UHPC

Comparing the prediction results of different machine-learning algorithms for the compressive strength of UHPC, it was determined that the XGBoost algorithm achieves the best performance in predicting the compressive strength of UHPC. Therefore, the XGBoost algorithm is also utilized to predict the flexural strength, fluidity, and shrinkage of UHPC. Table 4 provides a summary of the performance metrics of the XGBoost algorithm for the prediction of flexural strength, fluidity, and shrinkage properties. The results demonstrate that the algorithm achieved a MAPE lower than 5% and an R2 higher than 0.9, indicating a high level of accuracy and strong prediction performance.
Figure 8 shows the performance of the XGBoost algorithm applied to predict the flexural strength, fluidity, and shrinkage properties of UHPC, displaying the relationship between the actual and predicted values. The results indicate that most of the predicted values are close to the center line, suggesting that the deviation between the predicted and actual values is small, which demonstrates the effectiveness of the XGBoost algorithm in predicting these properties of UHPC.

3.4. Feature Importance Analysis

This study employs the XGBoost algorithm to assess the significance of input features in predicting UHPC compressive strength, flexural strength, fluidity, and shrinkage properties. The feature importance is calculated based on the gain of the structure score, with the feature selected as the segmentation point. The feature importance is calculated as the sum of its occurrences in all trees. This implies that the more frequently an attribute is utilized to construct a decision tree in the model, the higher its importance. As shown in Figure 9, the water-to-binder ratio is found to be the most influential feature affecting the compressive strength of UHPC. Moreover, the content of steel fiber is identified as the most significant factor affecting the flexural strength of UHPC, while the water-to-binder ratio and the contents of superplasticizers are also observed to have a considerable effect on UHPC’s flexural strength. Additionally, it was found that the water-to-binder ratio, contents of superplasticizers, and the content ratio of fly ash had significant effects on the fluidity of UHPC. Furthermore, the contents of superplasticizers were found to have the most significant effect on the shrinkage of UHPC, while the content ratio of coarse aggregate has a relatively more important effect on UHPC shrinkage.

4. Optimization of UHPC Mix

Based on the prediction results, this study conducted further optimization of the UHPC mix. To achieve the optimal design of the UHPC mix, the first step is to set the constraint range of factors for the UHPC mix [107]. The following factors are chosen for the design of UHPC, including silica fume content ratio, fly ash content ratio, slag content ratio, fine aggregate content ratio, coarse aggregate content ratio, water-to-binder ratio, steel fiber content, and superplasticizer content, as shown in Table 5.
The established UHPC property prediction model is then fed with 50,000 randomly generated UHPC mixes, which output the predicted UHPC properties. Next, the material price and carbon dioxide equivalent factor are introduced to calculate the unit volume cost and carbon emissions for each mix. These factors are then combined using the hierarchical analysis method to consider compressive strength, flexural strength, fluidity, shrinkage, unit volume cost, and carbon emissions in the comprehensive evaluation of UHPC properties. The optimized design of UHPC mixes is then achieved under different property orientations according to the comprehensive properties ranking.

4.1. Calculation of Unit Volume Cost and Carbon Emissions

The formula for the volume of concrete is as follows [108]:
V m = m C ρ C + m S F ρ S F + m F A ρ F A + m S G ρ S G + m S ρ S + m A ρ A + m W ρ W + m F ρ F + m S P ρ S P = 1 m 3
where m C , m S F , m F A , m S G , m S , m A , m W , m F , m S P represent the weight of cement, silica fume, fly ash, slag, fine aggregate, coarse aggregate, water, steel fiber and superplasticizer content in 1 m3 of UHPC, respectively; ρ C , ρ S F , ρ F A , ρ S G , ρ S , ρ A , ρ W , ρ F , ρ S P are the densities of cement, silica fume, fly ash, slag, fine aggregate, coarse aggregate, water, steel fiber, and superplasticizer, respectively.
The cost of UHPC is:
C o s t = i = 1 n P i × m i
where i is the number of the ingredient types; m i is the mass of i-th ingredient; P i is the cost of 1 kg of the i-th ingredient.
Equation (15) [109] is used to calculate the carbon emissions of UHPC:
C O 2 = i = 1 n C O 2 e q i × m i
where C O 2 e q i is the carbon dioxide equivalent of the i-th ingredient. The density and unit price and carbon dioxide equivalent of UHPC raw materials are shown in Table 6 [110,111,112,113,114,115,116,117,118,119]. Carbon emissions from raw materials are considered only at the production stage and not from other processes.

4.2. Multi Properties Prediction and Analysis for Random Data

The UHPC properties prediction model is applied to the randomly generated 50,000 UHPC mixes. After screening, 28,871 eligible combinations were obtained, and the resulting predictions are shown in Figure 10, which displays the distribution of the predicted properties. The compressive strength of UHPC ranges from 77.5 MPa to 165.3 MPa with a majority of the values clustering around 135 MPa. The flexural strength varies from 5.92 MPa to 33.76 MPa, with the majority of the values clustering around 29 MPa. The fluidity degree ranges from 466 mm to 830 mm with the majority of the values clustering around 625 mm. The shrinkage ranges from 243 × 10−6 to 1148 × 10−6 with the majority of the values clustering around 450 × 10−6 and 700 × 10−6.
By calculation, the cost-per-unit volume for 28,871 UHPC random mixes ranges from 1048 yuan/m3 to 7586 yuan/m3, with the majority of values clustering in the range of 3000 yuan/m3 to 6500 yuan/m3. The carbon-emissions-per-unit volume ranges from 353 kg/m3 to 2295 kg/m3, with the majority of values clustering in the range of 1000 kg/m3 to 1500 kg/m3. The calculation results for cost and carbon emission for UHPC random mixes are shown in Figure 11.

4.3. Comprehensive Property Analysis by AHP Method

In practical engineering applications, engineers need to consider multiple properties of UHPC simultaneously. However, different properties of UHPC may have varying degrees of influence under different working conditions, and some of them may even conflict with each other. Hence, to evaluate the comprehensive properties of different mixes, it is essential to assign reasonable weights to different properties of UHPC. Among the various multi-criteria evaluation methods, the analytic hierarchy process (AHP) proposed by Saaty [120] is one of the most extensively used methods. Over the years, AHP has demonstrated its potential to resolve intricate decisions and acquire alternative prioritization, thus, making it an equally significant technique to explore for the optimization of UHPC mixes [121].

4.3.1. AHP Model and Parameters

AHP is a method that can help decision-makers evaluate both quantitative and qualitative criteria [41]. It decomposes the original decision problem into a hierarchical structure with a one-way hierarchical relationship. At the top level of the hierarchy is the main objective of the decision problem, while the lower levels contain the criteria and sub-criteria that contribute to achieving that objective, and the alternatives to be evaluated are located at the bottom level [121,122].
In this study, the assessment system for UHPC comprehensive properties was structured into three layers: the objective layer, the criterion layer, and the solution layer. The objective of the assessment was the comprehensive properties of UHPC, which constituted the objective layer. The criterion layer consisted of six UHPC property factors that were considered for assessment, including compressive strength, flexural strength, fluidity, shrinkage, and cost- and carbon-emissions-per-unit volume. The solution layer included 28,871 alternative UHPC mixes. Based on the hierarchical structure, the AHP model for comprehensive UHPC properties assessment was developed, as illustrated in Figure 12.
The relative importance between the six UHPC property factors in the criterion layer was determined using pairwise comparisons, which were converted into numerical values based on Saaty’s AHP model evaluation basic scale table [120], as listed in Table 7. The expert scoring method was employed to perform two-by-two comparisons of the factors, establishing a judgment matrix A, as seen in Equation (16), that indicates the relative importance of factor i to factor j. [120,121,122].
A = a 11 a 12 a 1 n a 21 a 22 a 2 n a n 1 a n 2 a n n
where a i j > 0 ;   a j i = 1 a i j ;   a i i = 1 ;   i ,   j = 1 , 2 , 3 , , n .
In order to optimize the UHPC mix under different working conditions, this study has constructed judgment matrices that are oriented towards specific properties of UHPC, namely, cost- and carbon-emissions-per-unit volume. The corresponding eigenvectors were derived and normalized based on these matrices, and the weights for each property were obtained through the arithmetic averaging method, as listed in Table 8 and Table 9. These weights indicate the relative importance of each property in determining the overall UHPC performance. The consistency of the judgment matrices was verified through the calculation of the consistency ratio (CR), which is less than 0.1, indicating that the matrices meet the consistency requirement [120].

4.3.2. Comprehensive Property Evaluation

The UHPC mixes were compared by quantitatively calculating the relative growth rate of each property in comparison to the benchmark group, which was the group with the lowest compressive strength in the predicted results. The comprehensive properties of each UHPC mix were compared by applying the property weights obtained from AHP. The benchmark group and the corresponding properties are presented in Table 10 and Table 11, respectively.
The calculation of the comprehensive properties of UHPC involves using a formula that takes into account the relative growth rate of each UHPC mix with respect to the benchmark group and the corresponding weights obtained from the AHP method. The positive sign in the formula indicates that a UHPC mix has better properties than the benchmark group, while the negative sign indicates that its properties are inferior. The formulas are as follows:
R σ = σ i σ 0 σ 0 × 100 %
R F l e = F l e i F l e 0 F l e 0 × 100 %
R F l u = F l u i F l u 0 F l u 0 × 100 %
R S h r = S h r i S h r 0 S h r 0 × 100 %
R Cos t = C i C 0 C 0 × 100 %
R C O 2 = C O 2 i C O 2 0 C O 2 0 × 100 %
The cost-per-unit volume oriented comprehensive property calculation formula is
R c o m = 0.188 R σ + 0.188 R F l e + 0.099 R F l u 0.099 R S h r 0.366 R C o s t 0.059 R C O 2
The carbon-emissions-per-unit volume oriented comprehensive property calculation formula is
R c o m = 0.188 R σ + 0.188 R F l e + 0.099 R F l u 0.099 R S h r 0.059 R C o s t 0.366 R C O 2
where R σ is the growth rate of the compressive strength; R F l e is the growth rate of the flexural strength; R F l u is the growth rate of the fluidity; R S h r is the growth rate of the shrinkage; R Cos t is the growth rate of the cost-per-unit volume; R C O 2 is the growth rate of the carbon-emissions-per-unit volume; and R C o m is the growth rate of the comprehensive properties. R C o m presents the weighted average of R σ , R F l e , R F l u , R S h r , R Cos t , R C O 2 ; the larger the value of R C o m , the better the mixture.

4.4. Optimization Design of UHPC Mix

The 28,871 UHPC random mixes were ranked in descending order according to their overall properties, with higher rankings indicating better overall properties. The top 10 mixes and comprehensive properties in terms of cost-per-unit volume and carbon-emission-per-unit volume orientation are presented in Table A1, Table A2, Table A3 and Table A4. AHP was employed to determine the optimal mix of UHPC under various property orientations based on its comprehensive properties. Figure 13 displays the top 10 UHPC mix designs obtained through the analytic hierarchy process for cost and carbon emission orientation, the best mix is marked in the red circle. The final mix design scheme for each orientation is denoted by the red circle. The selected final mix solutions under different property orientations suggest that the comprehensive properties of this mix are superior to all other alternative mix schemes. Under the orientation of cost-per-unit volume, the corresponding compressive strength of the final mix is 138.6 MPa, flexural strength is 29.03 MPa, fluidity is 621 mm, shrinkage value is 357 × 10−6, unit volume cost is 2832 yuan/m3, and carbon-emissions-per-unit volume is 876 kg/m3. Under the orientation of unit volume cost, the compressive strength corresponding to the final mix is 140.4 MPa, flexural strength is 27.18 MPa, fluidity is 603 mm, shrinkage value is 272 × 10−6, unit volume cost is 3360 yuan/m3, and carbon-emissions-per-unit volume is 701 kg/m3.

5. Conclusions

This paper investigates the optimal design method of UHPC mix proportion under different property orientations based on the combination of machine-learning algorithm and AHP. The main conclusions are as follows:
(1) Through comparison, the compressive strength of UHPC can be well-predicted by machine-learning algorithms using DT, RF, GBR, and XGBoost. XGBoost has the best performance, showing the lowest MAE (3.49 MPa) and MAPE (2.81%) and the closest R2 value to 1 (0.981), while LR and BPNN have relatively poor performance.
(2) The results show that the XGBoost algorithm can also be used to predict flexural strength, fluidity, and shrinkage properties. The MAPE of the algorithm applied to the above properties is less than 5% and the R2 is higher than 0.9, indicating that the algorithm has high accuracy and strong prediction performance for many basic properties of UHPC.
(3) For different properties, the influencing factors have different levels of importance. For instance: the most important feature affecting the compressive strength of UHPC is the water-to-binder ratio; the most important feature affecting the flexural strength of UHPC is the steel fiber admixture.
(4) Prediction on the basic performance of 50,000 randomly generated UHPC mixtures was conducted using the XGBoost algorithm, and the carbon-emissions- and cost-per-unit volume were calculated correspondingly. Combined with AHP to evaluate the comprehensive performance of UHPC mix proportions, the optimized design of UHPC mix, oriented to the lowest cost or lowest carbon emission, is completed, and its corresponding properties are obtained.
(5) Targeting different engineering needs in the future, the design method of the UHPC mixture proposed in this paper can be optimized by combining with other machine-learning algorithms to improve the prediction accuracy of the model and, ultimately, formulate UHPC that are environmentally friendly and fulfill the need for functional customization.

Author Contributions

Conceptualization, C.S. and P.W.; methodology, C.S.; software, K.W.; validation, P.W.; formal analysis, C.S.; investigation, K.W., Q.L. and F.P.; resources, C.S.; data curation, K.W.; writing—original draft preparation, K.W.; writing—review and editing, C.S., Q.L. and P.W.; visualization, K.W.; supervision, P.W.; project administration, C.S.; funding acquisition, C.S. All authors have read and agreed to the published version of the manuscript.

Funding

This research was funded by the Shanghai Rising-Star Program, grant number 22QC1400900.

Institutional Review Board Statement

Not applicable.

Informed Consent Statement

Not applicable.

Data Availability Statement

Not applicable.

Acknowledgments

The authors sincerely acknowledge all financial support. The authors also gratefully acknowledge the support of Shanghai Construction Industry Fifth Construction Group Co., Ltd.

Conflicts of Interest

The authors declare no conflict of interest.

Appendix A

Table A1. Cost-per-unit volume oriented comprehensive properties of the top 10 mixture.
MIXCSFFASGSAw/bFSP
M110.20.490.010.21.50.141.50%1.86%
M210.080.440.10.521.370.131.50%1.90%
M310.150.210.041.41.470.161.50%1.72%
M410.230.230.020.421.250.131.50%1.83%
M510.290.260.370.61.440.141.50%1.91%
M6100.4100.371.350.131.50%1.97%
M710.170.230.320.411.480.171.50%1.63%
M810.160.420.450.411.410.21.50%2.21%
M910.330.470.41.421.380.171.50%1.84%
M1010.160.40.31.421.430.131.50%2.40%
Table A2. Cost-per-unit volume oriented comprehensive properties of the top 10 mixture corresponding properties.
MIX σ FleFluShrCostCO2RCom
(MPa)(MPa)(mm)(10−6)(yuan/m3)(kg/m3)(%)
M1138.629.03621357283287634.14%
M2129.328.20728329282487534.01%
M3149.524.15667343268878333.90%
M4151.627.95604424294093433.24%
M5140.927.78630281310080833.06%
M6124.729.02618329271294232.83%
M7133.527.25695359288583732.72%
M8130.926.75688278303278632.04%
M9139.925.63606281297270331.92%
M10143.525.46667355301174931.90%
Table A3. Carbon-emissions-per-unit volume oriented comprehensive properties of the top 10 mixture.
MIXCSFFASGSAw/bFSP
M110.480.50.451.341.380.151.50%2.90%
M210.450.350.371.321.480.131.50%3.09%
M310.330.470.41.421.380.171.50%1.84%
M410.290.260.370.61.440.141.50%1.91%
M510.160.410.461.291.50.121.50%3.85%
M610.210.410.481.51.370.161.50%2.47%
M710.350.360.251.321.280.171.50%2.68%
M810.160.40.31.421.430.131.50%2.40%
M910.250.420.291.441.490.142.00%2.57%
M1010.290.270.471.40.710.151.50%2.39%
Table A4. Carbon-emissions-per-unit volume oriented comprehensive properties of the top 10 mixture corresponding properties.
MIX σ FleFluShrCostCO2RCom
(MPa)(MPa)(mm)(10−6)(yuan/m3)(kg/m3)(%)
M1140.427.18603272336070136.79%
M2145.726.92623323337672536.50%
M3139.925.63606281297270335.68%
M4140.927.78630281310080835.65%
M5132.127.52662270343074835.60%
M6138.225.68625270309771535.50%
M7147.627.18622430314974235.49%
M8143.525.46667355301174935.07%
M9145.528.41620362348683434.72%
M10151.025.80613339335178934.69%

References

  1. T/CBMF 37-2018/T/CCPA 7-2018; Fundamental Characteristics and Test Methods of Ultra-High Performance Concrete. China Building Materials Federation, China Concrete & Cement-based Products Association: Beijing, China, 2018; pp. 1–16.
  2. Russell, H.G.; Graybeal, B.A. Ultra-High Performance Concrete: A State-of-the-Art Report for the Bridge Community; U.S. Department of Transportation Federal Highway Administration: McLean, VA, USA, 2013. [Google Scholar]
  3. Du, J.; Meng, W.; Khayat, K.H.; Bao, Y.; Guo, P.; Lyu, Z.; Abu-obeidah, A.; Nassif, H.; Wang, H. New development of ultra-high-performance concrete (UHPC). Compos. Part B Eng. 2021, 224, 109220. [Google Scholar] [CrossRef]
  4. Yu, Z.; Wu, L.; Yuan, Z.; Zhang, C.; Bangi, T. Mechanical properties, durability and application of ultra-high-performance concrete containing coarse aggregate (UHPC-CA): A review. Constr. Build. Mater. 2022, 334, 127360. [Google Scholar] [CrossRef]
  5. Ahmad, S.; Rasul, M.; Adekunle, S.K.; Al-Dulaijan, S.U.; Maslehuddin, M.; Ali, S.I. Mechanical properties of steel fiber-reinforced UHPC mixtures exposed to elevated temperature: Effects of exposure duration and fiber content. Compos. Part B Eng. 2019, 168, 291–301. [Google Scholar] [CrossRef]
  6. Shi, C.; Wu, Z.; Xiao, J.; Wang, D.; Huang, Z.; Fang, Z. A review on ultra high performance concrete: Part I. Raw materials and mixture design. Constr. Build. Mater. 2015, 101, 741–751. [Google Scholar] [CrossRef]
  7. Fang, Z.; Fang, H.; Huang, J.; Jiang, H.; Chen, G. Static behavior of grouped stud shear connectors in steel–precast UHPC composite structures containing thin full-depth slabs. Eng. Struct. 2022, 252, 113484. [Google Scholar] [CrossRef]
  8. Arora, A.; Almujaddidi, A.; Kianmofrad, F.; Mobasher, B.; Neithalath, N. Material Design of Economical Ultra-High Performance Concrete (UHPC) and Evaluation of Their Properties. Cem. Concr. Compos. 2019, 104, 103346. [Google Scholar] [CrossRef]
  9. Yu, R.; Spiesz, P.; Brouwers, H.J.H.J.H. Effect of nano-silica on the hydration and microstructure development of Ultra-High Performance Concrete (UHPC) with a low binder amount. Constr. Build. Mater. 2014, 65, 140–150. [Google Scholar] [CrossRef]
  10. Köksal, F.; Altun, F.; Yiǧit, I.; Şahin, Y. Combined effect of silica fume and steel fiber on the mechanical properties of high strength concretes. Constr. Build. Mater. 2008, 22, 1874–1880. [Google Scholar] [CrossRef]
  11. Nili, M.; Afroughsabet, V. Property assessment of steel-fibre reinforced concrete made with silica fume. Constr. Build. Mater. 2012, 28, 664–669. [Google Scholar] [CrossRef]
  12. Lee, C.Y.; Lee, H.K.; Lee, K.M. Strength and microstructural characteristics of chemically activated fly ash–cement systems. Cem. Concr. Res. 2003, 33, 425–431. [Google Scholar] [CrossRef]
  13. Hunger, M. An Integral Design Concept for Ecological Self-Compacting Concrete. Ph.D. Thesis, Technische Universiteit Eindhoven, Eindhoven, The Netherlands, 2010. [Google Scholar] [CrossRef]
  14. Wu, Z.; Shi, C.; He, W. Comparative study on flexural properties of ultra-high performance concrete with supplementary cementitious materials under different curing regimes. Constr. Build. Mater. 2017, 136, 307–313. [Google Scholar] [CrossRef]
  15. Nasr, M.S.; Hasan, Z.A.; Abed, M.K.; Dhahir, M.K.; Najim, W.N.; Shubbar, A.A.; Habeeb, Z.D. Utilization of High Volume Fraction of Binary Combinations of Supplementary Cementitious Materials in the Production of Reactive Powder Concrete. Period. Polytech. Civ. Eng. 2021, 65, 335–343. [Google Scholar] [CrossRef]
  16. Yu, R.; Spiesz, P.; Brouwers, H.J.H. Development of an eco-friendly Ultra-High Performance Concrete (UHPC) with efficient cement and mineral admixtures uses. Cem. Concr. Compos. 2015, 55, 383–394. [Google Scholar] [CrossRef]
  17. Edwin, R.S.; De Schepper, M.; Gruyaert, E.; De Belie, N. Effect of secondary copper slag as cementitious material in ultra-high performance mortar. Constr. Build. Mater. 2016, 119, 31–44. [Google Scholar] [CrossRef]
  18. Edwin, R.S.; Gruyaert, E.; De Belie, N. Influence of intensive vacuum mixing and heat treatment on compressive strength and microstructure of reactive powder concrete incorporating secondary copper slag as supplementary cementitious material. Constr. Build. Mater. 2017, 155, 400–412. [Google Scholar] [CrossRef]
  19. Yazici, H.; Yardimci, M.Y.; Yiǧiter, H.; Aydin, S.; Türkel, S. Mechanical properties of reactive powder concrete containing high volumes of ground granulated blast furnace slag. Cem. Concr. Compos. 2010, 32, 639–648. [Google Scholar] [CrossRef]
  20. Xiong, Z.; Mai, G.; Qiao, S.; He, S.; Zhang, B.; Wang, H.; Zhou, K.; Li, L. Fatigue bond behaviour between basalt fibre-reinforced polymer bars and seawater sea-sand concrete. Ocean Coast. Manag. 2022, 218, 106038. [Google Scholar] [CrossRef]
  21. He, S.; Li, Q.; Yang, G.; Zhou, X.; Mosallam, A.S.; Asce, F. Experimental Study on Flexural Performance of HSS-UHPC Composite Beams with Perfobond Strip Connectors. J. Struct. Eng. 2022, 148, 04022064. [Google Scholar] [CrossRef]
  22. Zhang, Y.; Zhu, Y.; Qu, S.; Kumar, A.; Shao, X. Improvement of flexural and tensile strength of layered-casting UHPC with aligned steel fibers. Constr. Build. Mater. 2020, 251, 118893. [Google Scholar] [CrossRef]
  23. Meng, W.; Asce, S.M.; Khayat, K.H.; Asce, A.M. Effect of Hybrid Fibers on Fresh Properties, Mechanical Properties, and Autogenous Shrinkage of Cost-Effective UHPC. J. Mater. Civ. Eng. 2018, 30, 04018030. [Google Scholar] [CrossRef]
  24. Khan, M.; Ali, M. Effect of super plasticizer on the properties of medium strength concrete prepared with coconut fiber. Constr. Build. Mater. 2018, 182, 703–715. [Google Scholar] [CrossRef]
  25. Aruntaş, H.Y.; Cemalgil, S.; Şimşek, O.; Durmuş, G.; Erdal, M. Effects of super plasticizer and curing conditions on properties of concrete with and without fiber. Mater. Lett. 2008, 62, 3441–3443. [Google Scholar] [CrossRef]
  26. Cheng, B.; Wang, J.; Yang, W.; Jia, L. Experimental study on preparation of ultra high strength concrete by the theory of the most compact. Concrete 2014, 1, 101–105. (In Chinese) [Google Scholar] [CrossRef]
  27. Chen, Q.; Zhu, H.; Yan, Z.; Ju, J.W.; Jiang, Z.; Wang, Y. A multiphase micromechanical model for hybrid fiber reinforced concrete considering the aggregate and ITZ effects. Constr. Build. Mater. 2016, 114, 839–850. [Google Scholar] [CrossRef]
  28. Ghafari, E.; Costa, H.; Júlio, E. RSM-based model to predict the performance of self-compacting UHPC reinforced with hybrid steel micro-fibers. Constr. Build. Mater. 2014, 66, 375–383. [Google Scholar] [CrossRef]
  29. DeRousseau, M.A.; Kasprzyk, J.R.; Srubar, W.V. Computational design optimization of concrete mixtures: A review. Cem. Concr. Res. 2018, 109, 42–53. [Google Scholar] [CrossRef]
  30. Sun, Y.; Zhang, J.; Li, G.; Wang, Y.; Sun, J.; Jiang, C. Optimized neural network using beetle antennae search for predicting the unconfined compressive strength of jet grouting coalcretes. Int. J. Numer. Anal. Methods Geomech. 2019, 43, 801–813. [Google Scholar] [CrossRef]
  31. Duan, Z.H.; Kou, S.C.; Poon, C.S. Prediction of compressive strength of recycled aggregate concrete using artificial neural networks. Constr. Build. Mater. 2013, 40, 1200–1206. [Google Scholar] [CrossRef]
  32. Khashman, A.; Akpinar, P. Non-Destructive Prediction of Concrete Compressive Strength Using Neural Networks. Procedia Comput. Sci. 2017, 108, 2358–2362. [Google Scholar] [CrossRef]
  33. Hammoudi, A.; Moussaceb, K.; Belebchouche, C.; Dahmoune, F. Comparison of artificial neural network (ANN) and response surface methodology (RSM) prediction in compressive strength of recycled concrete aggregates. Constr. Build. Mater. 2019, 209, 425–436. [Google Scholar] [CrossRef]
  34. Zhang, J.; Ma, G.; Huang, Y.; Sun, J.; Aslani, F.; Nener, B. Modelling uniaxial compressive strength of lightweight self-compacting concrete using random forest regression. Constr. Build. Mater. 2019, 210, 713–719. [Google Scholar] [CrossRef]
  35. Zhang, J.; Li, D.; Wang, Y. Toward intelligent construction: Prediction of mechanical properties of manufactured-sand concrete using tree-based models. J. Clean. Prod. 2020, 258, 120665. [Google Scholar] [CrossRef]
  36. Han, Q.; Gui, C.; Xu, J.; Lacidogna, G. A generalized method to predict the compressive strength of high-performance concrete by improved random forest algorithm. Constr. Build. Mater. 2019, 226, 734–742. [Google Scholar] [CrossRef]
  37. Duan, J.; Asteris, P.G.; Nguyen, H.; Bui, X.N.; Moayedi, H. A novel artificial intelligence technique to predict compressive strength of recycled aggregate concrete using ICA-XGBoost model. Eng. Comput. 2021, 37, 3329–3346. [Google Scholar] [CrossRef]
  38. Erdal, H.I. Two-level and hybrid ensembles of decision trees for high performance concrete compressive strength prediction. Eng. Appl. Artif. Intell. 2013, 26, 1689–1697. [Google Scholar] [CrossRef]
  39. Lee, J.H.; Yoon, Y.S.; Kim, J.H. A new heuristic algorithm for mix design of high-performance concrete. KSCE J. Civ. Eng. 2012, 16, 974–979. [Google Scholar] [CrossRef]
  40. Cheng, M.-Y.; Prayogo, D.; Wu, Y.-W. Novel Genetic Algorithm-Based Evolutionary Support Vector Machine for Optimizing High-Performance Concrete Mixture. J. Comput. Civ. Eng. 2013, 28, 06014003. [Google Scholar] [CrossRef]
  41. Badri, M.A. A combined AHP–GP model for quality control systems. Int. J. Prod. Econ. 2001, 72, 27–40. [Google Scholar] [CrossRef]
  42. El-Mikawi, M.; Mosallam, A.S. A methodology for evaluation of the use of advanced composites in structural civil engineering applications. Compos. Part B Eng. 1996, 27, 203–215. [Google Scholar] [CrossRef]
  43. Cuadrado, J.; Zubizarreta, M.; Rojí, E.; García, H.; Larrauri, M. Sustainability-Related Decision Making in Industrial Buildings: An AHP Analysis. Math. Probl. Eng. 2015, 2015, 157129. [Google Scholar] [CrossRef]
  44. Cessari, L.; Gigliarelli, E.; Cerqua, A. Application of the Analytic Hierarchy Process (Ahp) for Energetic Rehabilitation of Historical Buildings. In Proceedings of the 11 th International Symposium on the AHP, Sorrento, Naples, Italy, 15–18 June 2011. [Google Scholar] [CrossRef]
  45. ACI Committee 239. Ultra-High-Performance Concrete: An Emerging Technology Report (ACI 239R-18); American Concrete Institute: Farmington Hills, MI, USA, 2018. [Google Scholar]
  46. Alsalman, A.; Dang, C.N.; Micah Hale, W. Development of ultra-high performance concrete with locally available materials. Constr. Build. Mater. 2017, 133, 135–145. [Google Scholar] [CrossRef]
  47. Ibrahim, M.A.; Farhat, M.; Issa, M.A.; Hasse, J.A. Effect of material constituents on mechanical & fracture mechanics properties of ultra-high-performance concrete. ACI Struct. J. 2017, 114, 453–465. [Google Scholar] [CrossRef]
  48. Zhang, X.Y.; Yu, R.; Zhang, J.J.; Shui, Z.H. A low-carbon alkali activated slag based ultra-high performance concrete (UHPC): Reaction kinetics and microstructure development. J. Clean. Prod. 2022, 363, 132416. [Google Scholar] [CrossRef]
  49. Xu, D.; Cui, Y.; Li, H.; Yang, K.; Xu, W.; Chen, Y. On the future of Chinese cement industry. Cem. Concr. Res. 2015, 78, 2–13. [Google Scholar] [CrossRef]
  50. Tayeh, B.A.; Akeed, M.H.; Qaidi, S.; Bakar, B.H.A. Ultra-high-performance concrete: Impacts of steel fibre shape and content on flowability, compressive strength and modulus of rupture. Case Stud. Constr. Mater. 2022, 17, e01615. [Google Scholar] [CrossRef]
  51. El-Helou, R.G.; Haber, Z.B.; Graybeal, B.A. Mechanical Behavior and Design Properties of Ultra-High-Performance Concrete. ACI Mater. J. 2022, 119, 181–194. [Google Scholar] [CrossRef]
  52. Ullah, R.; Qiang, Y.; Ahmad, J.; Vatin, N.I.; El-Shorbagy, M.A. Ultra-High-Performance Concrete (UHPC): A State-of-the-Art Review. Materials 2022, 15, 4131. [Google Scholar] [CrossRef]
  53. Sohail, M.G.; Kahraman, R.; Al Nuaimi, N.; Gencturk, B.; Alnahhal, W. Durability characteristics of high and ultra-high performance concretes. J. Build. Eng. 2021, 33, 101669. [Google Scholar] [CrossRef]
  54. Abdellatief, M.; Elrahman, M.A.; Abadel, A.A.; Wasim, M.; Tahwia, A. Ultra-high performance concrete versus ultra-high performance geopolymer concrete: Mechanical performance, microstructure, and ecological assessment. J. Build. Eng. 2023, 79, 107835. [Google Scholar] [CrossRef]
  55. Li, S.; Zheng, W.; Zhou, W.; Jiang, Z.; Cui, Y. Local compression capacity of steel fiber reinforced ultra-high performance concrete containing coarse aggregate. Compos. Struct. 2023, 318, 117084. [Google Scholar] [CrossRef]
  56. Zhang, S.S.; Wang, J.J.; Lin, G.; Yu, T.; Fernando, D. Stress-strain models for ultra-high performance concrete (UHPC) and ultra-high performance fiber-reinforced concrete (UHPFRC) under triaxial compression. Constr. Build. Mater. 2023, 370, 130658. [Google Scholar] [CrossRef]
  57. Wang, H.; Li, B.; Yang, J.; Wang, L.; Yu, S.; Wang, J. Preparation and properties of shrinkage-compensating ultra-high performance concrete containing coarse aggregate. New Build. Mater. 2021, 48, 41–45. (In Chinese) [Google Scholar]
  58. Huang, W.; Yang, Y.; Cui, T.; Liu, Y. Study on the workability and mechanical properties of ultra-high performance concrete containing coarse aggregate. Concrete 2021, 8, 99–103. (In Chinese) [Google Scholar] [CrossRef]
  59. Li, Y.; Kong, L.; Li, Q. Experimental study on the mechanical properties of super high strength concrete with different mineral admixtures. China Sci. 2017, 12, 1141–1144. (In Chinese) [Google Scholar]
  60. Li, X.; Yang, C.; Zhou, Q.; Li, S. Research on Strength and Fluidity of Reactive Powder Concrete Based on Orthogonal Test. Bull. Chin. Ceram. Soc. 2019, 38, 1201–1210. (In Chinese) [Google Scholar] [CrossRef]
  61. Chen, Y. Preparation, Performance Research and Engineering Application of Ultra-high Performance Concrete. Build. Mater. 2021, 43, 453–455. (In Chinese) [Google Scholar] [CrossRef]
  62. Wang, Z.; Xiao, X.; Shui, Z.; Leng, Y.; Tong, Y.; Yu, R.; Wang, X. Rational Selection of the Dosage of Superplasticizer for UHPC Based on the Close Packing Theroy. Bull. Chin. Ceram. Soc. 2019, 38, 1503–1509. (In Chinese) [Google Scholar] [CrossRef]
  63. Liu, J.; Sun, W.; Miao, C.; Liu, J. Effect of mineral admixtures on drying and autogenous shrinkage of concrete with low water-to-binder ratio. J. Southeast Univ. Sci. Ed. 2009, 39, 580–585. (In Chinese) [Google Scholar] [CrossRef]
  64. Guo, W. Study on Preparation Method of Early Strength Ultra-High Performance Concrete. Master’s thesis, Hunan University, Changsha, China, 2019. (In Chinese). [Google Scholar] [CrossRef]
  65. Li, Y.L.; Zhao, X.L. Study on stainless steel blind bolted T-stub to concrete-filled stainless steel tube connections. Eng. Struct. 2022, 257, 114107. [Google Scholar] [CrossRef]
  66. Peng, G.; Yang, J.; Gao, Y.; Wang, B. Factors Influencing Compressive Strength of Ultra-high-performance Concrete with Coarse Aggregate. J. North China Univ. Water Resour. Electr. Power 2012, 33, 5–9. (In Chinese) [Google Scholar] [CrossRef]
  67. Wang, J.; Cheng, B.; Jia, L.; Liu, T. Research on Preparation of Ultra High Strength Concrete. China Concr. Cem. Prod. 2013, 11, 18–22. (In Chinese) [Google Scholar] [CrossRef]
  68. Chen, Q.; Ma, R.; Jiang, Z.; Wang, H. Compressive Strength Prediction and Mix Proportion Design of UHPC Based on GA-BP Neural Network. J. Build. Mater. 2020, 23, 176–183. (In Chinese) [Google Scholar] [CrossRef]
  69. Qian, H.; Jiao, C.; Lai, J.; Hu, D. Mix proportion design and experiment verification of reactive powder concrete. Concrete 2016, 5, 125–128. (In Chinese) [Google Scholar] [CrossRef]
  70. Luo, W.; Li, H.; Cao, B. Seismic performance of eccentrically-compressed steel pier under multi-directional earthquake loads. Earthq. Eng. Eng. Vib. 2021, 20, 771–789. [Google Scholar] [CrossRef]
  71. Ming, Y.; Chen, P.; Li, L.; Hu, C.; Chen, X.; Gan, G. Preparation of ultrafine mineral admixture and its experimental research in UHPC application. New Build. Mater. 2021, 48, 47–50. (In Chinese) [Google Scholar]
  72. Wu, L.; Shi, C.; Zhang, Z.; Wang, H. Effects of Steel Fiber on Drying Shrinkage of Ultra High Performance Concrete. Mater. Rev. 2017, 31, 58–65. (In Chinese) [Google Scholar] [CrossRef]
  73. Li, J. Research on Preparation of Super High Strength Concrete. J. Jiamusi Univ. Natural Sci. Ed. 2009, 27, 411–413. (In Chinese) [Google Scholar]
  74. Du, L. The Test Research about the Working Performance, Mechanical Properties and Carbonation Resistance Performance of Mineral Admixtures Concrete. Master’s Thesis, Inner Mongolia University of Technology, Hohhot, China, 2013. (In Chinese). [Google Scholar]
  75. Huang, Y.; Qi, X.; Li, C.; Gao, P.; Wang, Z.; Ying, J. Seismic behaviour of seawater coral aggregate concrete columns reinforced with epoxy-coated bars. Structures 2022, 36, 822–836. [Google Scholar] [CrossRef]
  76. Shi, X. Experimental study on preparation and performance of low viscosity ultra-high strength c100 concrete. Low Temp. Archit. Technol. 2019, 6, 31–34. (In Chinese) [Google Scholar] [CrossRef]
  77. Li, Y. Study on Property of Non-steam Curing Ultra-high Performance Concrete. Master’s Thesis, Harbin Institute of Technology, Harbin, China, 2019. (In Chinese). [Google Scholar] [CrossRef]
  78. Luo, X.; Wei, J.; Li, C.; Dong, R.; Chen, B. Experimental Investigations of the Shrinkage Behavior of Sealed UHPC. J. Basic Sci. Eng. 2018, 26, 830–842. (In Chinese) [Google Scholar] [CrossRef]
  79. Hu, A.; Liang, X.; Li, D.; Yu, J.; Shi, Q.; Li, L. Mix Design Method and Uniaxial Tensile Characteristics of Ultra-High Performance Concrete. J. Hunan Univ. Sci. 2018, 45, 39–46. (In Chinese) [Google Scholar] [CrossRef]
  80. Wen, C. Study on Workability and Mechanical Properties and Microstructure of Ultra High Performance Concrete. Master’s Thesis, Zhengzhou University, Zhengzhou, China, 2020. (In Chinese). [Google Scholar] [CrossRef]
  81. Zhou, M.; Chen, B.; Chen, H.; Hou, W. Compressive Behavior of Ultra-High Performance Concrete at Room Temperature Condition. Struct. Eng. 2021, 37, 183–189. (In Chinese) [Google Scholar] [CrossRef]
  82. Yang, Z. Study on Mechanical Properties of Reactive Powder Concrete. Master’s Thesis, Dalian Jiaotong University, Dalian, China, 2008. (In Chinese). [Google Scholar]
  83. Nie, J. Research on Key Influencing Factors of Mechanical Properties and Expansion of Ultra High Performance Concrete. Master’s Thesis, Changsha University of Science and Technology, Changsha, China, 2020. (In Chinese). [Google Scholar] [CrossRef]
  84. Sun, Z. Experimental Study on the Improvement of Flexural Behavior of Rectangular Beams by UHPC with High Flow State. Master’s Thesis, Inner Mongolia University of Technology, Hohhot, China, 2020. (In Chinese). [Google Scholar] [CrossRef]
  85. Wu, X. The Study on Predictive Modeling of Concrete Strength and Drying Shrinkage. Master’s Thesis, China Academy of Building Research, Beijing, China, 2008. (In Chinese). [Google Scholar]
  86. Zhou, Y. Study on the Tensile Properties of Ultra High Performance Fiber Reinforced Concrete with High Flowability. Master’s Thesis, Beijing Jiaotong University, Beijing, China, 2020. (In Chinese). [Google Scholar] [CrossRef]
  87. Shangguan, Y. Research and Application of Non-Steam Curing Reactive Powder Concrete. Master’s Thesis, Qingdao Technolgy University, Qingdao, China, 2010. (In Chinese). [Google Scholar]
  88. Ren, H. Effect of Ultrafine Powder on the Fluidity and Mechanical Properties of Ultra-high Performance Concrete. Master’s Thesis, Beijing Jiaotong University, Beijing, China, 2018. (In Chinese). [Google Scholar]
  89. Zhang, Q. Research of Steel Fiber Types and Curing Methods on Mechanical Properties of RPC. Master’s Thesis, Harbin Institute of Technology, Harbin, China, 2018. (In Chinese). [Google Scholar] [CrossRef]
  90. Zhang, W. Design and Preparation of Low Shrinkage Ultra-high Performance Concrete and Study on Shrinkage Reduction Mechanism. Master’s Thesis, Southeast University, Nanjing, China, 2019. (In Chinese). [Google Scholar] [CrossRef]
  91. Wang, L. Study on Prediction Model of Shared Bicycle Demand Based on Machine Learning. Master’s Thesis, Changsha University, Changsha, China, 2019. (In Chinese). [Google Scholar]
  92. Tang, Y.; Zhu, M.; Chen, Z.; Wu, C.; Chen, B.; Li, C.; Li, L. Seismic performance evaluation of recycled aggregate concrete-filled steel tubular columns with field strain detected via a novel mark-free vision method. Structures 2022, 37, 426–441. [Google Scholar] [CrossRef]
  93. Wang, W. Effects of the Steel Fibre on the Ultra-high Performance Fibre Reinforced Concrete (UHPFRC). World Build. Mater. 2019, 40, 13–16. (In Chinese) [Google Scholar]
  94. Chen, X. Basic Concrete Mix Ratio and Mechanical Properties Analysis for Ultra High Performance Fiber Reinforced Concrete. J. Shanghai Inst. Technol. Sci. 2016, 16, 325–329. (In Chinese) [Google Scholar] [CrossRef]
  95. Myers, R.H. Classical and Modern Regression with Applications; Duxbury Press: Belmont, CA, USA, 1990. [Google Scholar]
  96. Rumelhart, D.E.; Widrow, B.; Lehr, M.A. The basic ideas in neural networks. Commun. ACM 1994, 37, 87–92. [Google Scholar] [CrossRef]
  97. Chou, J.S.; Pham, A.D. Enhanced artificial intelligence for ensemble approach to predicting high performance concrete compressive strength. Constr. Build. Mater. 2013, 49, 554–563. [Google Scholar] [CrossRef]
  98. Atici, U. Prediction of the strength of mineral admixture concrete using multivariable regression analysis and an artificial neural network. Expert Syst. Appl. 2011, 38, 9609–9618. [Google Scholar] [CrossRef]
  99. McClelland, J.L.; Rumelhart, D.E.; Hinton, G.E. The Appeal of Parallel Distributed Processing; MIT Press: Cambridge MA, USA, 1988; pp. 52–72. [Google Scholar] [CrossRef]
  100. Géron, A. Hands-on Machine Learning with Scikit-Learing, Keras and Tensorfow; O’Reilly Media, Inc.: Sebastopol, CA, USA, 2019; p. 510. [Google Scholar]
  101. DeRousseau, M.A.; Laftchiev, E.; Kasprzyk, J.R.; Rajagopalan, B.; Srubar, W.V. A comparison of machine learning methods for predicting the compressive strength of field-placed concrete. Constr. Build. Mater. 2019, 228, 116661. [Google Scholar] [CrossRef]
  102. Breiman, L. Random forests. Mach. Learn. 2001, 45, 5–32. [Google Scholar] [CrossRef]
  103. Breiman, L. Bagging predictors. Mach. Learn. 1996, 24, 123–140. [Google Scholar] [CrossRef]
  104. Friedman, J.H. Greedy function approximation: A gradient boosting machine. Ann. Stat. 2001, 29, 1189–1232. [Google Scholar] [CrossRef]
  105. Dong, W.; Huang, Y.; Lehane, B.; Ma, G. XGBoost algorithm-based prediction of concrete electrical resistivity for structural health monitoring. Autom. Constr. 2020, 114, 103155. [Google Scholar] [CrossRef]
  106. Chen, T.; Guestrin, C. Xgboost: A scalable tree boosting system. In Proceedings of the 22nd ACM Sigkdd International Conference on Knowledge Discovery and Data Mining, San Francisco, CA, USA, 13–17 August 2016; pp. 785–794. [Google Scholar]
  107. Golafshani, E.M.; Behnood, A. Estimating the optimal mix design of silica fume concrete using biogeography-based programming. Cem. Concr. Compos. 2019, 96, 95–105. [Google Scholar] [CrossRef]
  108. Khan, M.I. Mix proportions for HPC incorporating multi-cementitious composites using artificial neural networks. Constr. Build. Mater. 2012, 28, 14–20. [Google Scholar] [CrossRef]
  109. Mahjoubi, S.; Barhemat, R.; Guo, P.; Meng, W.; Bao, Y. Prediction and multi-objective optimization of mechanical, economical, and environmental properties for strain-hardening cementitious composites (SHCC) based on automated machine learning and metaheuristic algorithms. J. Clean. Prod. 2021, 329, 129665. [Google Scholar] [CrossRef]
  110. Xiao, J.; Deng, Q.; Xia, B. Evolution and Prospects of Low-carbon Concrete Preparation. J. Archit. Civ. Eng. 2022, 39, 1–12. (In Chinese) [Google Scholar] [CrossRef]
  111. Pakravan, H.R.; Ozbakkaloglu, T. Synthetic fibers for cementitious composites: A critical and in-depth review of recent advances. Constr. Build. Mater. 2019, 207, 491–518. [Google Scholar] [CrossRef]
  112. Chen, M.; Zhong, H.; Chen, L.; Zhang, Y.; Zhang, M. Engineering properties and sustainability assessment of recycled fibre reinforced rubberised cementitious composite. J. Clean. Prod. 2021, 278, 123996. [Google Scholar] [CrossRef]
  113. Long, G.; Gao, Y.; Xie, Y. Designing more sustainable and greener self-compacting concrete. Constr. Build. Mater. 2015, 84, 301–306. [Google Scholar] [CrossRef]
  114. Chiaia, B.; Fantilli, A.P.; Guerini, A.; Volpatti, G.; Zampini, D. Eco-mechanical index for structural concrete. Constr. Build. Mater. 2014, 67, 386–392. [Google Scholar] [CrossRef]
  115. Nepomuceno, M.; Oliveira, L.; Lopes, S.M.R. Methodology for mix design of the mortar phase of self-compacting concrete using different mineral additions in binary blends of powders. Constr. Build. Mater. 2012, 26, 317–326. [Google Scholar] [CrossRef]
  116. Habert, G.; Denarié, E.; Šajna, A.; Rossi, P. Lowering the global warming impact of bridge rehabilitations by using Ultra High Performance Fibre Reinforced Concretes. Cem. Concr. Compos. 2013, 38, 1–11. [Google Scholar] [CrossRef]
  117. Aydin, S.; Baradan, B. The effect of fiber properties on high performance alkali-activated slag/silica fume mortars. Compos. Part B Eng. 2013, 45, 63–69. [Google Scholar] [CrossRef]
  118. Purnell, P. The carbon footprint of reinforced concrete. Adv. Cem. Res. 2015, 25, 362–368. [Google Scholar] [CrossRef]
  119. Heirman, G.; Hendrickx, R.; Vandewalle, L.; Van Gemert, D.; Feys, D.; De Schutter, G.; Desmet, B.; Vantomme, J. Integration approach of the Couette inverse problem of powder type self-compacting concrete in a wide-gap concentric cylinder rheometer: Part II. Influence of mineral additions and chemical admixtures on the shear thickening flow behaviour. Cem. Concr. Res. 2009, 39, 171–181. [Google Scholar] [CrossRef]
  120. Saaty, T.L. The Analytic Hierarchy Process: Planning, Priority Setting, Resource Allocation; Mcgraw-Hill: New York, NY, USA, 1980. [Google Scholar]
  121. Satty, T. The Fundamentals of Decision Making and Priority Theory with the Analytic Hierarchy Process; RWS Publications: Pittsburgh, PA, USA, 2000. [Google Scholar]
  122. Saaty, T.L.; Peniwati, K. Group Decision Making: Drawing out and Reconciling differences; RWS Publications: Pittsburgh, PA, USA, 2008. [Google Scholar]
Figure 1. Flow chart of UHPC property prediction and mix optimization design.
Sustainability 15 15338 g001
Figure 2. Correlation of compressive strength to components in UHPC.
Sustainability 15 15338 g002
Figure 3. Correlation heatmap.
Sustainability 15 15338 g003
Figure 4. Machine-learning architecture for solving regression problems.
Sustainability 15 15338 g004
Figure 5. BPNN.
Figure 5. BPNN.
Sustainability 15 15338 g005
Figure 6. GBR architecture.
Sustainability 15 15338 g006
Figure 7. Compressive strength of UHPC.
Sustainability 15 15338 g007
Figure 8. Predictions of the flexural strength, fluidity, and shrinkage of UHPC by XGBoost.
Sustainability 15 15338 g008
Figure 9. Importance of input features.
Sustainability 15 15338 g009
Figure 10. Distribution of the predicted results for UHPC random mixes.
Sustainability 15 15338 g010
Figure 11. Distribution of cost and carbon emission for UHPC random mixes.
Sustainability 15 15338 g011
Figure 12. Comprehensive properties evaluation index system of UHPCS.
Sustainability 15 15338 g012
Figure 13. Final results of mix optimization based on AHP.
Sustainability 15 15338 g013
Table 1. Statistical data of UHPC datasets.
AttributeAbbreviationUnitMinMaxMeanStd
Dataset 1: UHPC compressive strength (363 samples)
Silica fume content ratioSF-00.50.190.09
Fly ash content ratioFA-010.100.14
Slag content ratioSG-010.070.12
Fine aggregate content ratioS-02.281.240.42
Coarse aggregate content ratioA-03.420.270.72
Water-to-binder ratiow/b-0.140.260.180.03
Steel fiber contentF%0411
Superplasticizer contentSP%0.342.181
Compressive strength σ MPa120.30172.50137.6013.23
Dataset 2: UHPC flexural strength (72 samples)
Silica fume content ratioSF-00.400.210.072
Fly ash content ratioFA-00.500.260.203
Slag content ratioSG-00.420.080.158
Fine aggregate content ratioS-0.301.981.360.224
Coarse aggregate content ratioA-00.590.010.086
Water-to-binder ratiow/b-0.150.220.150.025
Steel fiber contentF%051.811.31
Superplasticizer contentSP%0.242.741.28
Flexural strengthFleMPa12.6433.5621.358.387
Dataset 3: UHPC fluidity (94 samples)
Silica fume content ratioSF-00.570.200.209
Fly ash content ratioFA-00.700.250.158
Slag content ratioSG-00.700.350.235
Fine aggregate content ratioS-16.522.661.681
Coarse aggregate content ratioA-09.122.313.883
Water-to-binder ratiow/b-0.140.880.350.273
Steel fiber contentF%041.131.35
Superplasticizer contentSP%0.341.301.94
FluidityFlumm500855662105.541
Dataset 4: UHPC shrinkage (63 samples)
Silica fume content ratioSF-01.370.210.540
Fly ash content ratioFA-03.540.230.681
Slag content ratioSG-010.10.164
Fine aggregate content ratioS-1.015.321.540.889
Coarse aggregate content ratioA-02.550.40.698
Water-to-binder ratiow/b-0.140.30.20.058
Steel fiber contentF%051.031.363
Superplasticizer contentSP%0.331.750.932
ShrinkageShr10−63361253608253.650
Table 2. Optimal hyperparameter combinations of the machine-learning algorithms.
MethodHyperparameterDescriptionValue
BPNNlearning_rateStep size of neural network weight update0.001
Activation functionFunctions running on neuronssigmoid
batch_sizeNumber of samples per training50
Number of Hidden NeuronsNumber of hidden layer neurons12
Max lterationsMaximum number of iterations for training200
DTmax_depththe maximum depth of the tree30
min_samples_leafthe minimum number of samples required to be at a leaf node4
min_samples_splitMinimum number of samples for nodes4
max_featuresMaximum number of features8
RFn_estimatorsNumber of decision trees in the forest35
max_depththe maximum depth of the tree25
min_samples_leafthe minimum number of samples required to be at a leaf node4
min_samples_splitMinimum number of samples for nodes4
max_featuresMaximum number of features8
GBRn_estimatorsNumber of weak learners4
max_depthThe maximum depth of the tree20
learning_rateStep size when iterating decision trees0.003
XGBoostn_estimatorsNumber of weak learners4
learning_rateStep size when iterating decision trees0.001
gammaMinimum objective function reduction required for further branching at leaf nodes of a tree0
max_depthThe maximum depth of the tree20
Table 3. Performance of ML algorithms for UHPC compressive strength prediction.
ModelPerformance Index
RMSE (Mpa)MAE (Mpa)MAPE (%)R2
LR10.468.609.210.881
BPNN10.138.836.090.913
DT6.344.393.720.968
RF5.213.913.540.978
GBR4.984.233.840.975
XGBoost4.833.492.810.981
Table 4. Performance of XGBoost for flexural strength, fluidity, and shrinkage prediction.
PerformanceRMSEMAEMAPE (%)R2
Flexural strength0.920.914.370.959
Fluidity23.7818.253.220.937
Shrinkage22.5219.633.920.982
Table 5. Compatibility factor constraint range.
Input VariablesRange Constraints
Silica fume content ratio(0 ~ 0.5)
Fly ash content ratio(0 ~ 0.5)
Slag content ratio(0 ~ 0.5)
Fine aggregate content ratio(0 ~ 1.5)
Coarse aggregate content ratio(0 ~ 1.5)
Water-to-binder ratio(0.12 ~ 0.26)
Steel fiber content(0% ~ 5%)
Superplasticizer content(0.3% ~ 4%)
Table 6. UHPC raw material density and unit price and carbon dioxide equivalent.
ComponentDensity (kg/m3)Cost (yuan/kg)CO2-eq (kg/kg)
Cement [114,119]31500.70.832
Silica fume [115,116]25001.70.0003
Fly ash [118,119]25000.350.009
Slag [117,118]28001.3350.019
Fine aggregate [110]26500.450.0025
Coarse aggregate [110]25000.20.0022
Water [114,119]10000.003450.0003
Steel fiber [111,112,114]7800112.75
Superplasticizer [113,119]1350250.72
Note: 1 dollar = 7.2749 yuan, based on the 16 September 2023 exchange rate.
Table 7. AHP model judgment scale and meaning.
ImportanceDefinition
1Equal importance
3Moderate dominance
5Strong dominance
7Demonstrated dominance
9Extreme dominance
2, 4, 6, 8Intermediate values
Table 8. Weighting matrix under unit volume cost orientation.
Criterion Layer σ FleFluShrCostCO2Weight
σ 11221/230.188
Fle11221/230.188
Flu1/21/2111/420.099
Shr1/21/2111/420.099
Cost2244150.366
CO21/31/31/21/21/510.059
Table 9. Weighting matrix under unit volume carbon emissions orientation.
Criterion Layer σ FleFluShrCostCO2Weight
σ 112231/20.188
Fle112231/20.188
Flu1/21/21121/40.099
Shr1/21/21121/40.099
Cost1/31/31/21/211/50.059
CO22244510.366
Table 10. Base group mixture.
MIXCSFFASGSAw/bFSP
M010.010.190.150.990.260.245.00%0.63%
Table 11. Corresponding properties of the base group mixture.
MIX σ (MPa)Fle (MPa)Flu (mm)Shr (10−6)Cost (yuan/m3)CO2 (kg/m3)
M012022.3765576555961711
Disclaimer/Publisher’s Note: The statements, opinions and data contained in all publications are solely those of the individual author(s) and contributor(s) and not of MDPI and/or the editor(s). MDPI and/or the editor(s) disclaim responsibility for any injury to people or property resulting from any ideas, methods, instructions or products referred to in the content.

