Article

Collaborative Optimization Scheduling of Resilience and Economic Oriented Islanded Integrated Energy System under Low Carbon Transition

School of Economics and Management, Shanghai University of Electric Power, Shanghai 201306, China
*
Author to whom correspondence should be addressed.
Sustainability 2023, 15(21), 15663; https://doi.org/10.3390/su152115663
Submission received: 15 September 2023 / Revised: 12 October 2023 / Accepted: 1 November 2023 / Published: 6 November 2023

Abstract

:
With the development of new energy sources and the increase in the installed scale of energy coupling equipment, the low-carbon transformation of the energy supply of the integrated energy system (IES) has a serious impact on the reliability of the IES supply, and there is an urgent need for a reasonable and accurate assessment and trade-off between the IES resilience and economics. In this regard, this paper models the overall optimization of the resilience and economic configuration and operation scheduling of the IES in the islanded operation mode after grid faults, proposes a two-layer optimization strategy model of resilience and economy, and solves the unit configuration, coupled output characteristics, and optimal scheduling of the islanded IES using the Markov decision-making process and forbearing stratified sequencing method, and evaluates and analyzes the resilience and cost of the various types of IES configuration schemes. Resilience and cost are also evaluated and analyzed. Finally, an example analysis is carried out in an electric-heat-cooling integrated energy system. The results show that the proposed two-tier optimization strategy model can optimize the IES configuration scheme and coordinate the scheduling of each equipment, and the overall annualized cost of the energy system decreases by CNY 45.21 thousand, or a percentage decrease of 5.24%, compared to the same configuration of the conventional strategy. The typical day toughness index improved by 7.33%, 7.56%, and 13.01% in the spring, summer, and autumn, respectively.

1. Introduction

With the development of society and economy, governments are paying more and more attention to the continuous impact of greenhouse gases on climate change, and are vigorously developing new energy sources to replace coal-fired power generation, while promoting a low-carbon transition in energy supply, which also creates great challenges to the reliability of energy supply in IESs [1,2,3]. Due to the different levels of technology and cost of energy supply equipment [4,5], energy storage, and demand-side loads for IESs, as well as the complexity of the coupling relationship between different energy types, the traditional IES strategies are no longer effective, and there is an urgent need for IES scheduling optimization and apples-to-apples with multi-objective and synergistic considerations for multiple energy sources [6,7,8].
And some extreme events cause energy supply system failure and shutdown, which may be fatal to IESs, hospitals, schools, food factories, etc. [9,10]. Reference [11] quantitatively assessed the impact of system failures due to extreme weather. Reference [12] specifically examines the correlation of IES failures with socio-economic and physical factors after extreme events. IESs face the influence of external environment and fluctuating characteristics of their own equipment, exhibiting phenomena such as reduced reliability of energy supply and loss of load generation after the influence of external environment and stochastic events, which is similar to the concept of resilience in physics. The ability of the IES to stabilize when supplying energy and reduce the loss of load of electricity, heat and cooling is referred to as the resilience of the IES.
Currently, most of the research on optimizing IES resilience focuses on the configuration phase and the operational strategy phase. Reference [13] proposes a methodology for the configuration of unit equipment and standby, which takes into account the multiple threats to the reliability of energy supply during the prevention phase of extreme events affecting the IES, such as wind power prediction errors and unit outage rates, with the objective of optimizing the configuration scheme to maximize the response to exceptional events. Reference [14] delineates customer loads and critical infrastructure loads, considers critical loads, and synergizes multiple resources such as electricity, water, and gas to facilitate the IES to achieve normal operation and maximize the recovery of multiple types of loads. Reference [15] investigated the resilience of IES energy supply in the survival phase, and proposed a methodology for the recovery of electricity and gas IES timing faults, realizing the two-way flow of energy through the establishment of combined heat and power (CHP) and electricity-to-gas equipment, and making decisions about the integrated energy supply system. Reference [14] proposed a multi-stage resilience optimization model for IES with minimum amount of lost load during the survival period as an objective function so as to improve the resilience of IES energy supply. Reference [16] proposed a robust resilience-oriented optimization model for distribution networks considering distribution network line failures under extreme natural disasters to enhance the resilience of power systems. Reference [17] proposed a two-stage recovery strategy model to enhance the ability of IES to cope with multi-fault problems. Current research on the IES resilience problem mostly focuses on individual stage IES resilience enhancement, while research on how to enhance IES resilience for multi-stage co-optimization is still very limited.
In order to further accurately simulate the IES supply operation and reduce the decision time, research workers have conducted studies combining deep learning and algorithms. Reference [18] proposed a robust optimization model suitable for wind power uncertainty, but the power system resilience enhancement strategy based on robust form determination is less flexible. The current methods for short-term power generation prediction of units mainly include physical modelling method and deep learning method, and deep learning is favored due to its fast computational speed and high accuracy [19,20]. Reference [21] proposes a genetic long and short-term memory framework consisting of long- and short-term memories and genetic algorithms to predict the short-term wind power. The ability of LSTM to automatically learn features from sequential data and the global optimization strategy of the genetic algorithm were utilized to optimize the window size and the number of neurons in the LSTM layer. Gated recurrent unit (GRU) models have been applied with some success in areas such as short-term wind power prediction [22,23,24,25]. Reference [26] proposed a new algorithm that combines Conditional Generative Adversarial Networks with Convolutional Neural Networks and Bidirectional Long and Short-Term Memory in order to improve the accuracy of the hourly PV power prediction. Reference [27] used BiLSTM model and ELM model for prediction of high frequency and low frequency components respectively. IRSA was used to optimize the parameters of the model. Finally, the predicted values of each component are summed to give the final wind power prediction.
Rationally configuring equipment to organically and synergistically supply and store energy to improve the resilience of an integrated energy system in the operational phase has the advantage of high feasibility, but excessive redundancy and robustness can also burden the economics of the system. It is important to accurately evaluate the relationship between resilience and economics of integrated energy systems. For this kind of multi-objective problem of tolerance hierarchical sequence method [28], there have been more mature practice cases, which can avoid the conflict of the objective function ordering rules and the difficulty of determining the weighting coefficients, and the tolerance hierarchical sequence method is the focus of the solution method in this study.
IESs face uncertainties such as distributed energy output and load variations [29,30], and in resource-limited energy supply processes; conventional strategies may lead to premature energy depletion of energy storage devices, or difficulties in adequately invoking storage to ensure the continuous operation of critical loads in islanded operation, which may lead to large load loss and additional cost burden on the IES. When these uncertainties are considered, the multi-objective problem of IESs can be viewed as an optimal decision process for stochastic dynamic systems. Reference [28] considers the Markov Decision Process (MDP) as a mathematical method for studying dynamic stochastic sequential decision problems of the same class as Markov, and reference [31] calculates the resilience of IES under different types of natural disasters through a Monte Carlo simulation and Markov state transfer. In this paper, it can be used to explain and deal with the decision-making problem of energy supply and coupled equipment states of the IES at different moments in an uncertain environment.
Based on the above facts, this paper addresses the limitations of the above studies, and models the toughness and economic configuration and operation of the IES under the islanded operation mode, proposes a two-layer optimization strategy model, solves and optimizes the unit configuration and coupled output characteristics of the IES by using the Markov decision process and the tolerant hierarchical sequence method, and simulates the fluctuations of the new energy output and other uncertainties of the system. We evaluate and analyze the resilience and cost of various islanded IES configurations, weigh and analyze the most resilience and economic IES configurations, and, finally, validate the effectiveness of this paper’s strategy through simulation.
The objective of this study is to propose a two-tier optimization strategy model in IES configuration and operation optimization and to demonstrate the effectiveness and practicality of the strategy. Unlike the previous research, the main contributions of this study are listed as follows.
(1)
Aiming at the difference between IES device configuration and actual operation, this paper proposes a two-layer optimization strategy model and innovatively extends the IES configuration and optimization strategy by using the BGRU model and the IALO algorithm to predict the outgoing power and to reduce the time consuming to solve the problem;
(2)
In this paper, the Markov decision-making process is applied to the IES energy supply chain to make full use of the energy storage so as to further optimize the reliability and economy of the IES energy supply in an integrated manner;
(3)
Depending on how much resilience and economic goals are valued, combined with the parameterization of the forbearing stratified sequencing method, it is possible to adjust the goals that the IES configuration runs want to achieve.
The remaining sections of this study are organized as follows. Section 3 describes the relevant methodology used in this study. Section 2 the model structure and measures of IES devices. Section 4 presents the empirical results and their analyses. Finally, Section 5 gives the conclusions of this study and the focus of future research work.

2. Modeling

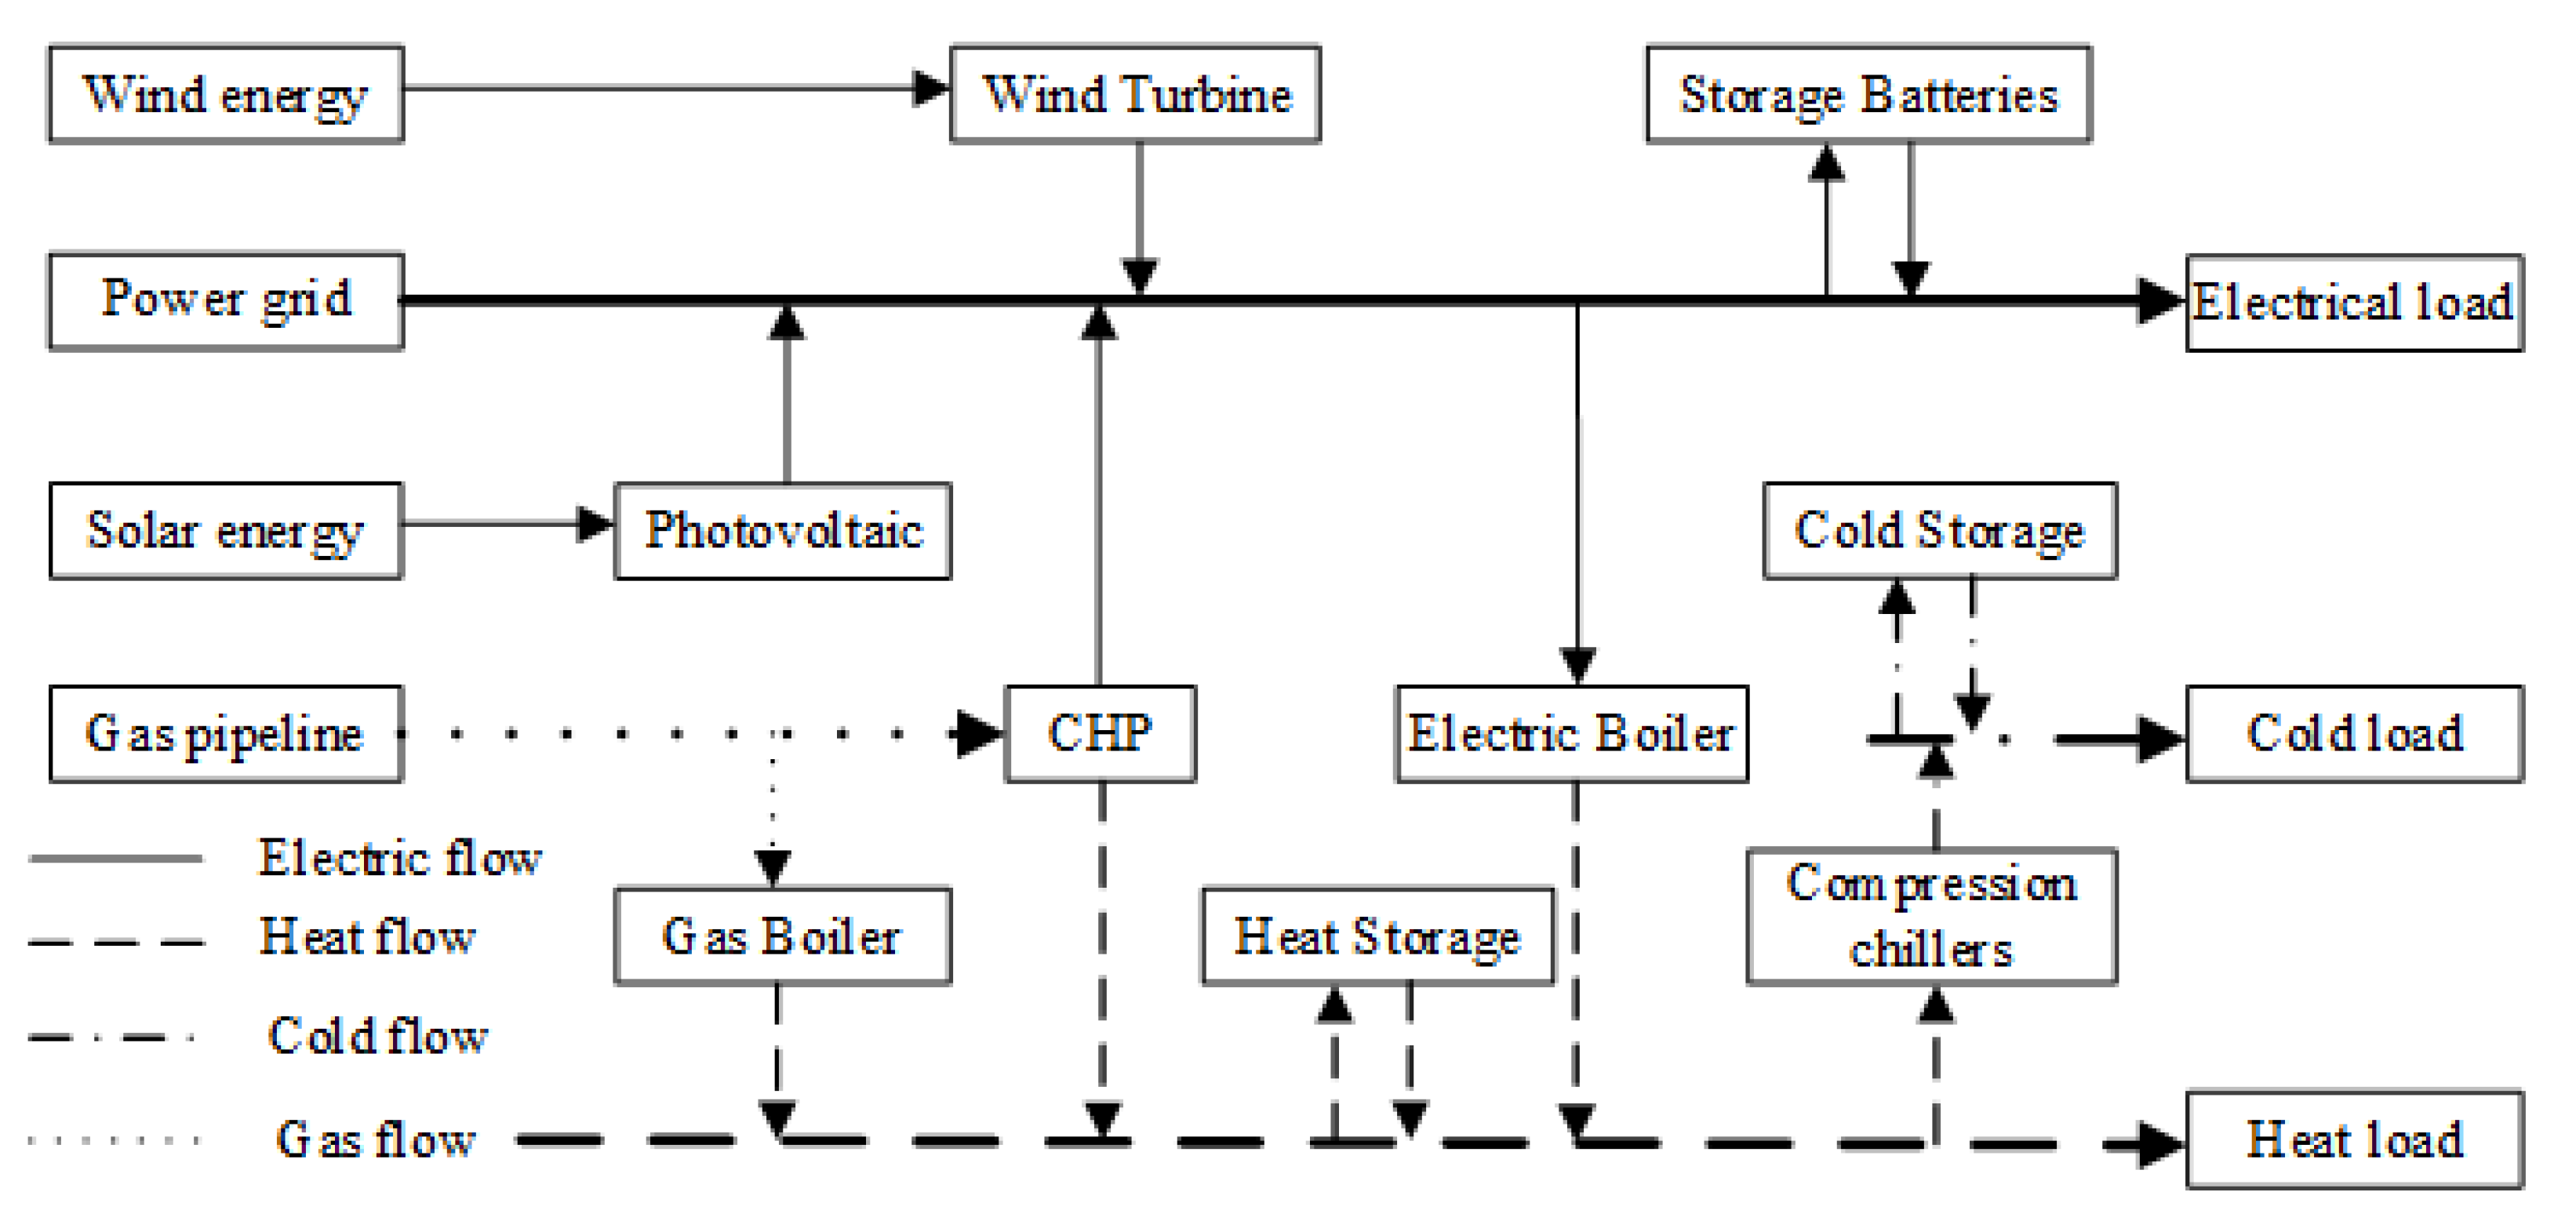
2.1. Integrated Energy System Model

This paper investigates the ability of the park’s integrated energy system to remain resilient and economical in the face of extreme events that turn it into islanded operation. The detailed integrated energy system is shown in Figure 1. The islanded integrated energy system in Figure 1 contains four main parts: the electric power supply system, the heating subsystem, the cooling subsystem, and the energy storage system, in which the electric power subsystem is the distribution grid system with wind turbines, photovoltaic, Combined Heat and Power (CHP) units, and as the power source; the heating subsystem utilizes the electric boiler, the gas boiler, and the CHP units to convert the electric power supplied by the electric power grid and natural gas supplied by natural gas network into heat energy to supply heating to users; the cooling system mainly refers to compression chillers; in addition, there are storage batteries, heat storage tanks, and cold storage tanks to regulate the real-time output. The abbreviations used in this paper are shown in Table 1.
IESs utilize CHP units consisting of gas turbines and waste boiler heat recovery systems, wind turbines, and distributed photovoltaics to supply electric loads.
P C H P t = η C H P e G C H P t
0 P W T t u W T
0 P P V t u P V
IES heating equipment includes CHP unit, gas boiler, and electric boiler. CHP generates electricity and heat through the unit by consuming natural gas, and gas boiler generates heat by consuming natural gas, and the heat generated is related to the energy conversion efficiency of the gas boiler and the amount of fuel. Since the system is firstly provided with electricity and heat by the CHP unit, when it cannot satisfy the heat demand, the electric boiler generates the heat to supply the heat load.
H C H P t = η C H P h λ g G C H P t
H G B t = η G B λ g G G B t
H E B t = η E B E E B t
The IES is supplied with cold loads by converting electrical energy from compression chillers.
C C C t = η C C E C C t

2.2. Objective Function

The resilience of the IES has rich meanings, and this paper mainly focuses on the robustness after the occurrence of faults at the assessment level, and the results of the robustness assessment can reflect the degree of resilience of the integrated energy system in dealing with the risk of extreme weather, and the better the robustness is, the smaller the amount of lost load of the IES energy supply is. In this paper, the operational resilience index R of the integrated energy system is proposed from the point of view of load loss, and the formula is as follows:
R = 0 t 1 1 + i = 1 S j = 1 3 k = 1 2 l = 1 2 ( χ j Δ e i t + χ k Δ h i t + χ l Δ c i t ) S ( L E t + L H t + L C t ) d t
The main considerations in terms of economic cost objectives for IESs are annualized investment costs, post-operational equipment operation, and energy consumption costs.
C = C I + C O + C C
C I = r v ( 1 + r v ) y v ( 1 + r v ) y k 1 v = 1 N μ v n v
C O = t = 1 T C O M v P V t
C C = t = 1 T C E C v P V t

2.3. Binding

Multiple energy flows in the IES should meet energy balance constraints.
P C H P t + P P V t + P C H P t + P S B D t = L E t + E E B t + E C C t + P S B C t
P C H P t + P E B t + P G B t + P H S D t = L H t + P H S C t
P C C t + P C S D t = L C t + P C S C t
The output power of each energy supply equipment in the IES should not exceed its maximum installed capacity in each time cycle.
0 P v t I v , v C H P , P V , W T , G B , E B , C C
CHP, PV, WT, GB, EB, and CC represent CHP units, photovoltaic arrays, wind turbine generators, gas boilers, electric boilers, and compression chillers, respectively.
Due to the spatial and geographical conditions of the region where the island IES is located, the total installed size of the energy supply and energy coupling equipment cannot exceed the upper limit.
0 v = 1 n I v I max
For energy storage devices, the state of charge of the batteries, the state of storage of the heat storage tanks, and the state of storage of the cold storage tanks must not exceed their upper and lower limits:
S S B t ¯ S S B t S S B t ¯
S H S t ¯ S H S t S H S t ¯
S C S t ¯ S C S t S C S t ¯
In this paper, the initial energy storage of the energy storage system at the beginning of a typical day is set to be 60%.

3. Methodology

3.1. IES Mdp

The Markov reward decision process is a mathematical framework for modeling reward values and strategy solving; this paper is used for sequential decision making problems at discrete moments of a typical day in the IES and the state space in which it is located at that time, and by constructing the MDP model, the optimal decision making strategy can be solved by using the methods such as reinforcement learning, so as to enable the integrated energy system to realize the efficient utilization of energy resources and operation management. In the IES energy supply, the MDP process includes state space St, decision action space A, transfer probability PR, reward function RW, and decay coefficient γ. The core objective of the MDP problem is to find the optimal strategy of the system.
The state space St includes the state quantities of the IES energy supply state space in the decision cycle at moment t. The IES control center in state St selects the action that maximizes the cumulative reward value of the multi-objective planning.
S t = ( t , P v t , L E t , L H t , L C t , S S B t , S H S t , S C S t ) , v C H P , P V , W T , G B , E B , C C
The decision action space A of the IES, on the other hand, involves the development of an allocation scheme for energy resources, e.g., choosing when to start or stop an energy generation unit, adjusting the conversion ratio between different energy sources, etc. It can be represented as:
A = S t , P R ( S t + 1 | S t , a k ) , γ
When IES is in the state, the decision action ak is selected and the transfer probability from state St to St+1 can be expressed as:
P R ( s t + 1 | s k , a k ) = P R ( P v t + 1 | P v t ) × P R ( S H S t + 1 | S H S t ) × P R ( S C S t + 1 | S C S t ) × P R ( S S B t + 1 | S S B t ) × P R ( t + 1 | t )
The isolated IES takes the system multi-objective weighted reward function value as the optimization objective, and sets the reward and punishment reward function of the MDP; the setting of the reward function will be directly related to the convergence speed and degree of the algorithm, when the integrated energy system is in the state St, the system-weighted reward value of the selected action At can be expressed as RW (St, At).
The model ultimately seeks the optimal decision to maximize the economic weighted value of resilience; in order to consider the impact of the current behavior on future rewards, the total discounted rewards in the tth decision cycle is denoted by RWt, which is defined as the sum of the immediate rewards at the moment t and the discounted rewards at the moment t + 1. γ is the discount factor, reflecting the importance of future returns. the smaller the value of γ, the greater the importance of current returns.
R W t = r ( s t , a t ) + γ i = 1 r ( s k + i , a k + i )

3.2. Forbearing Stratified Sequencing Method

Considering that there are two objective functions in the model problem of this paper, and their magnitudes and influence degrees are different, which is a typical multi-objective problem, the tolerant hierarchical sequence method, which can avoid the conflict of the objective function ordering rules and the difficulty of determining the influence weight coefficients, is chosen to solve the function.
The tolerance hierarchical sequence method puts the objectives in the multi-objective planning problem in accordance with its importance priority ordering, gives priority to solving the optimal solution of the objective function of high importance, and then considers the pre-given tolerance ε as the priority condition of the low priority objectives; it then continues to solve the optimal solution of the next objective on the basis of this, and so on until all the objectives are all solved, and the value of the tolerance ε represents the IES’s pair of the transfer to the risk of loss of load and the degree of acceptance of economic costs that may occur after the islanding, the use of various types of resources to improve the system resilience and thus minimize the amount of loss of load, and reduce the cost of degradation of the importance of the two objective functions by the decision maker wants to achieve the optimization effect to be determined.
The steps to solve the multi-objective planning problem are as follows:
min R q s . t . g 1 q 0 h   q = 0
In the first step, the first priority objective is solved first. The optimal resilience indicator V* is solved.
min V q s . t .   g 1 q 0       g 2 q = V q 1 + ε R *       h q = 0
In the second step, the tolerance ε is considered, and new constraints are replaced and added to optimize the second-stage objective function.
The optimal resilience metrics and operating costs are finally solved along with the system’s relatively optimal operating strategy Q and the corresponding weighted reward value Rw for the optimal resilience economy.

3.3. Improved Ant Lion Algorithm

The ALO algorithm is a heuristic algorithm proposed by Seyedali Mirjalili in 2015 that mimics learning the hunting process of ant lions in nature with good global merit seeking capability. The algorithm simulates several main aspects of the ant colony by walking randomly, setting traps, catching prey, and reconstructing traps. However, it sometimes falls into local optimum and converges slowly during the solution process.
Therefore, this paper improves the ALO algorithm to cope with the shortcomings of the original algorithm in the global search for superiority and convergence accuracy. The adoption of the Cauchy Gaussian variation can enhance the ant lion colony species and effectively improve the diversity and global search ability of ant lions. The density function of the Cauchy distribution is defined as follows:
s = 1 π ( 1 t 2 + x 2 ) , x ( , + )
In addition, the use of the Cauchy Gaussian variation can also shorten the convergence time of the algorithm. By combining the random vector of the Cauchy distribution with the state of the elite ant lion, it can make the individual more inclined to choose the action plan with higher risk in the decision-making process, thus achieving a speed-up effect and providing a guarantee for its greater role in practical applications. The specific expression of the variation is:
M i j = M i j + η C ( 0 , 1 )
When the algorithm enters an iterative loop, each time an iteration is executed, an optimal value for the current iteration is generated. In order to improve the performance and generalization ability of the algorithm, the optimal value of all iterations needs to be recorded during the execution of iterations. Usually, the optimal value converges with the number of iterations, but if two adjacent iterations produce almost the same optimal value, it means that the algorithm may have fallen into a local optimal point or trap. In this case, the Corsi–Gaussian variational method is used.
Variation operation: Overwrite the fitness value and number of optimal antlions to the original population size for the next iteration process and use the variation to update the position and optimal value of the antlion population as follows:
x 0 = x 0 + x 0 C ( 0 , 1 )
y 0 = y 0 + y 0 C ( 0 , 1 )

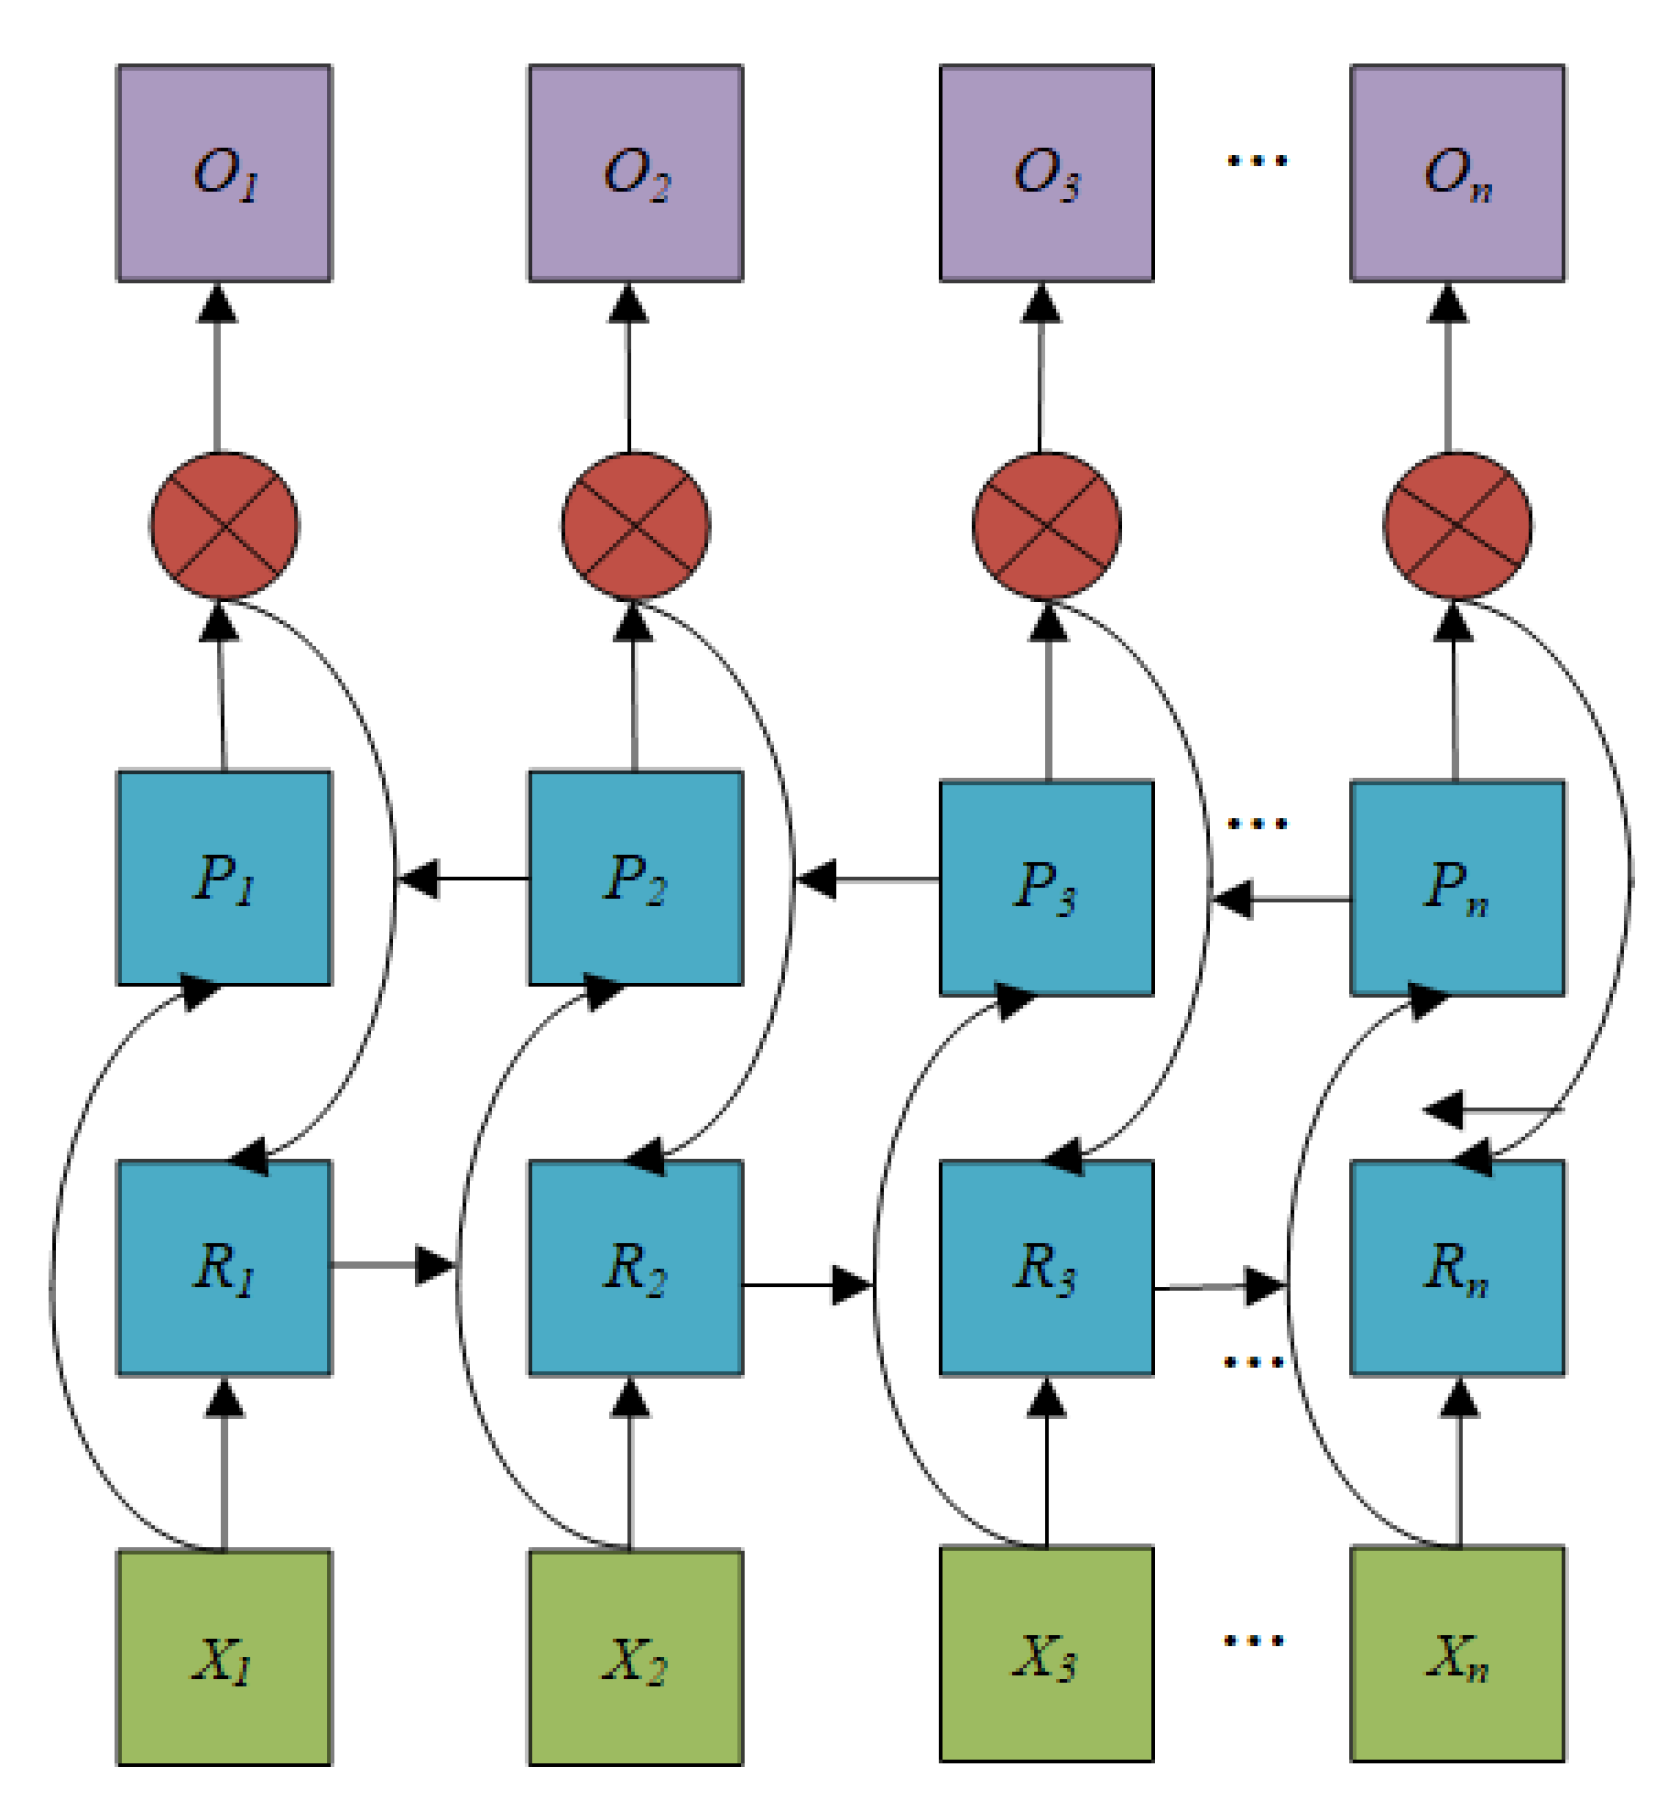
3.4. Bidirectional Gated Recurrent Unit

The unidirectional GRU unit model can only extract features in a single direction of data input, while wind power is a kind of time series data with bi-directional continuity, which means that for power prediction at a certain moment, it is necessary to consider not only the power situation at the historical moment, but also the power change trend at the future moment. In order to better handle this kind of time series data with bi-directional continuity, Bidirectional Gated Recurrent Unit (BGRU) introduces the inverse GRU on the basis of the unidirectional GRU to form a bi-directional gated recurrent network. By learning both forward and inverse data features, the bidirectional gated recurrent network can more accurately predict the power values at future moments and better capture the correlations and dependencies in time series data, thus greatly enhancing the capability of time series feature extraction. Therefore, in this paper, the BGRU network model, which performs well in extracting bidirectional timing features, is used as the base model to predict the real-time power of wind power generation. The BGRU network model is shown in Figure 2.

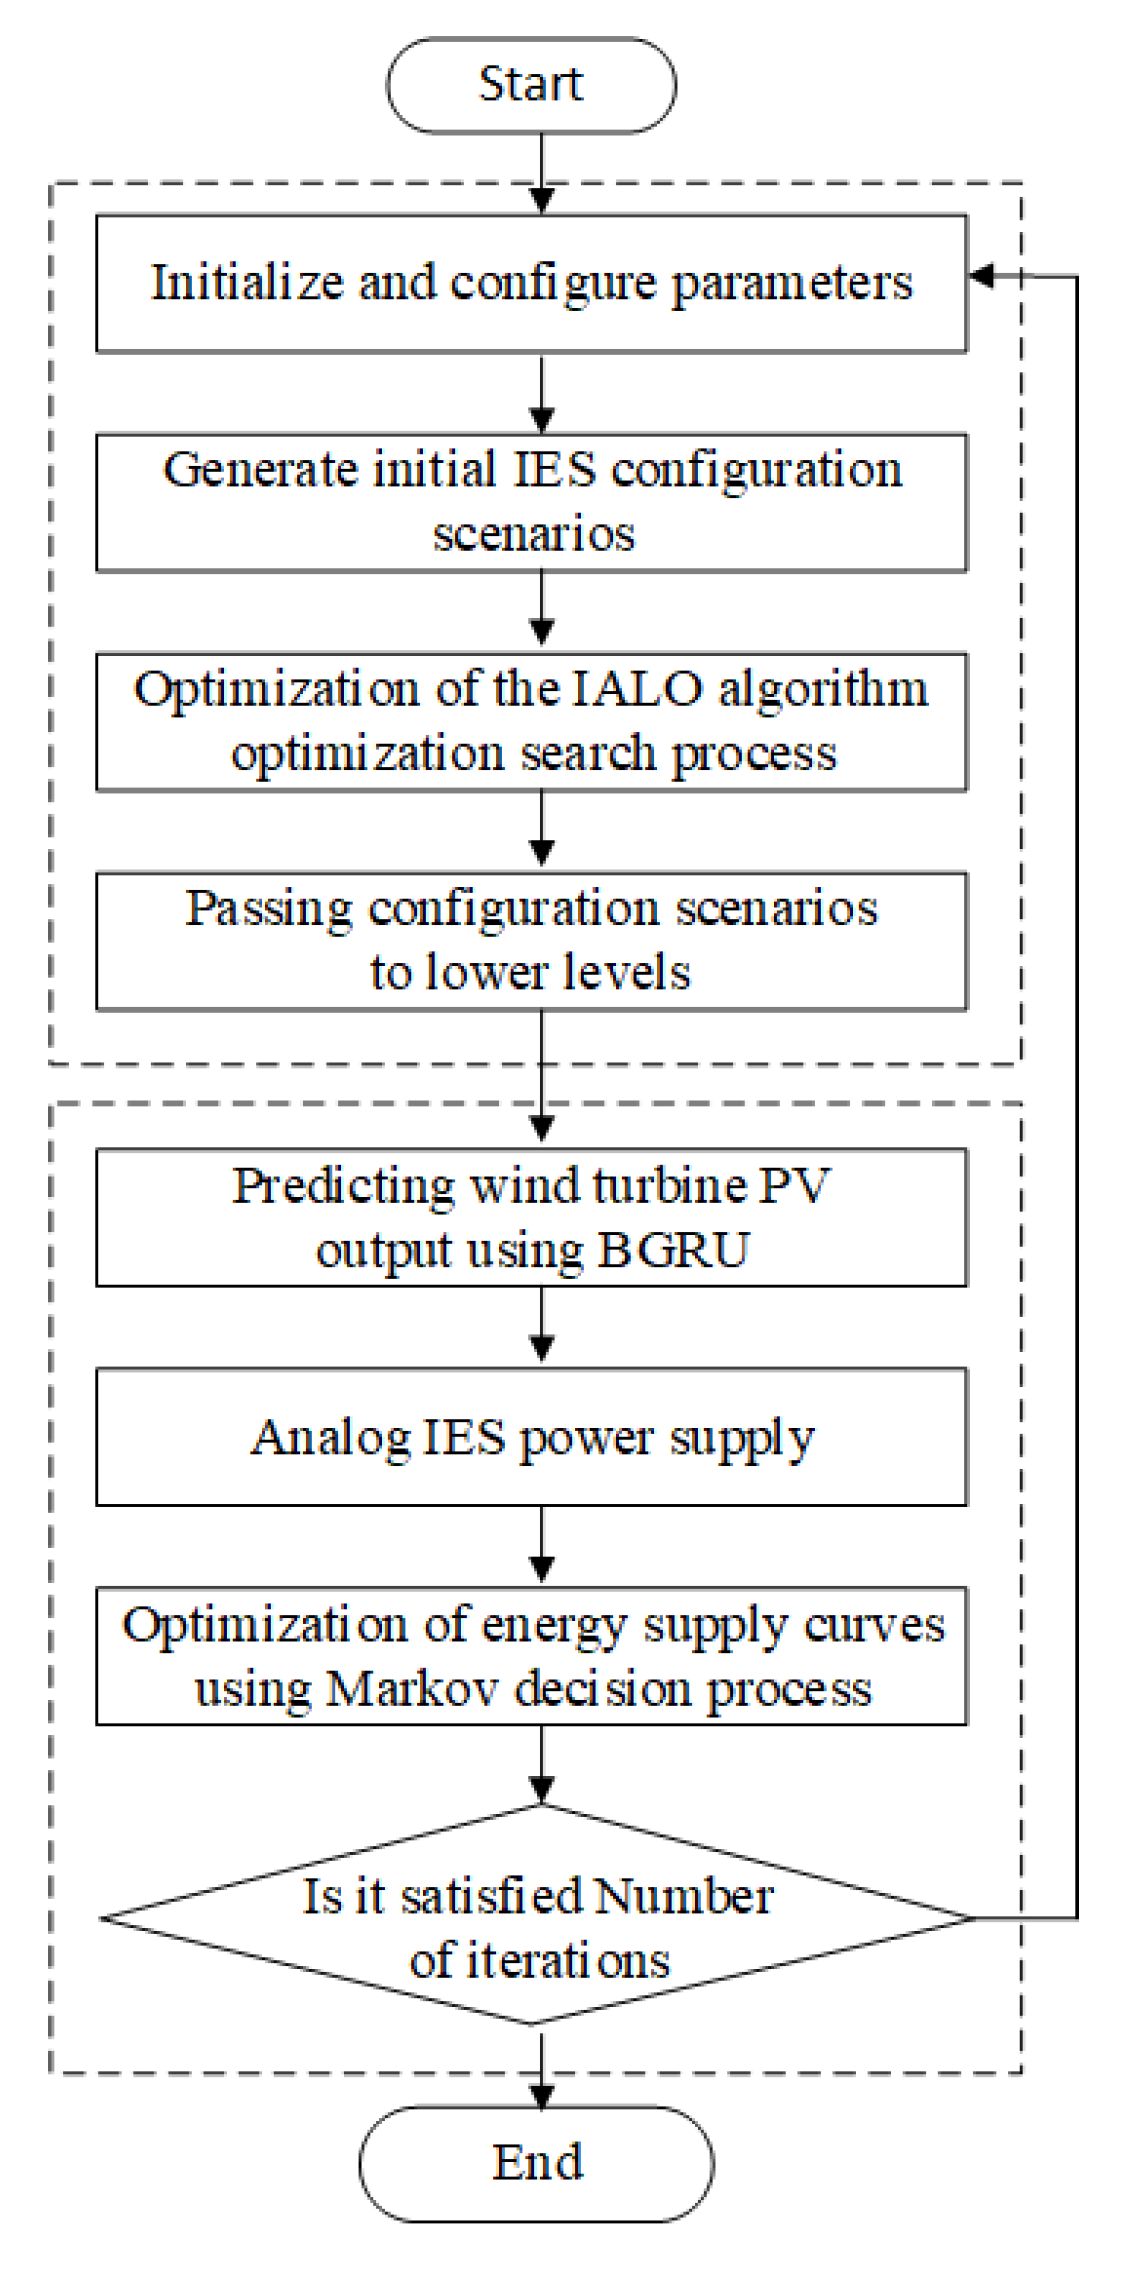
3.5. Resilient Economy Two-Layer Optimization Strategy

This paper proposes a two-tier optimization algorithm for the islanded IES resilience economy to achieve the overall objective. In the upper layer decision-making, the isolated IES first solves the mixed integer linear model planning by means of enhancing redundancy and adjusting the energy supply structure to find the optimal configuration investment plan of IES within a certain range, and passes the configuration plan as a parameter to the lower layer IES control center. In the lower layer, based on the acquired IES energy supply configuration plan, the isolated IES control center uses the BGRU network model to forecast the outputs of wind turbines and distributed PV, respectively, and uses the Markov reward decision-making process to assist the decision-making to rationally adjust the output scheme of power supply, heating, cooling, and energy coupling equipment according to the future reward value in the subsequent moments, and make full use of the incremental energy storage characteristics of CHP unit, gas boiler, electric boiler, compressed chiller, and storage batteries at all levels, to satisfy the resilience economy optimization of the island IES. The optimized resilience indicator loss of load and operation and maintenance costs are fed back to the upper layer, which obtains the system economic costs based on the acquired data parameters, plus the discounted investment costs, solves and accelerates the optimization of the resilience economy multi-objective problem by using the Tolerance Hierarchical Sequence Method and the IALO algorithm, and solves the optimal solution of the isolated island IES configuration and operation optimization in multiple iterations. The specific flow of the elastic economy two-layer optimization strategy is shown in Figure 3.

4. Examples and Results

In this paper, a certain IES containing electricity, heat, and gas is selected to conduct an arithmetic analysis; the annual utilization hours of the PV power generation equipment in the region is about 1020 h, and the annual utilization hours of the wind turbines is about 1920 h. When the extreme event occurs, the grid turns to island operation, the electricity source is composed of rooftop distributed PV from the IES and wind turbines in the region, and the natural gas source is delivered from the underground pipeline of natural gas that is laid underground and unaffected. In this paper, three types of typical days in summer, typical days in winter, and typical days in spring and fall are set up, and the electricity, heat, and cooling loads on the typical days of the three seasons are shown in Figure 4.

4.1. Prediction Model Analysis

In order to critically assess the prediction accuracy of the model, three metrics are used as the basis of this paper: mean absolute error (MAE), mean absolute percentage error (MAPE), root mean-square error (RMSE).
In this section, SVR, LSTM, GRU, and BGRU network models are developed to fit and predict the actual wind turbine power generation series, and the prediction accuracy of their fitting results are shown in Table 2. However, all other indicators did not reach the optimum, the prediction results of the BGRU network had a smaller error compared with the other models, and its MAPE was 9.03% and RMSE was 39.82 kW, both of which reached the optimum. At the same time, according to the prediction results shown in Figure 5, it is difficult to predict the sample part with more concentrated and complex changes, but the purple curve fits better overall. Therefore, the subsequent work uses the BGRU network as the base prediction model.

4.2. Algorithm Function Performance Test

In order to test the effect of IALO algorithm performance improvement, four single model algorithm control variables, IPSO, SSA, ALO, and IALO, were selected for comparison experiments. The population parameter is set to 40 and the number of iterations is set to 200; the test function is shown in Equation (9), and its function-related parameters are set with reference to Table 2. The average adaptation values of the four single-model algorithms after the test calculation are compared as shown in Table 3.
f 1 = i n | x i + | i n | x i |
f 2 = 3 exp 1 5 1 n i = 1 n x i 2 + e
f 3 = 2 x 1 2 11 5 x 1 4 1 3 x 1 6 4 x 1 x 2 3 x 2 2 + x 2 4
The results in Table 3 show that IALO has the best overall performance among the four algorithms in the comparison of the fitness values in the test function, followed by IPSO and ALO, while the SSA algorithm has a poor performance in the test fitness values.

4.3. Configuration Results

In the first tier of the optimization strategy, the IES shifts to silo operation in the face of extreme events, and the best configuration investment plan is found by enhancing the redundancy of the installed size and adjusting the supply structure of energy coupling equipment and energy supply devices.
In this paper, due to the space limitation of the environmental area, the upper limit of the scale capacity of IES energy supply and energy coupling equipment Imax is set to 4 MW. Five different scenarios are formulated based on the parameter settings and priority objectives of the tolerant hierarchical sequence method to compare and analyze:
Scenario 1: With economy as the first priority target, the tolerance parameter ε setting for the resilience index is set to be 0.6 and a Markov decision process is used to go for energy supply regulation strategies.
Scenario 2: With economy as the first priority target, the tolerance parameter ε setting for the resilience indicator is set to be 0.2 and a Markov decision process is used to go for energy supply regulation strategies.
Scenario 3: With resilience as the first priority target, the tolerance parameter ε setting for economic indicators is set to be 0.8 and a Markov decision process is used to go for energy supply regulation strategies.
Scenario 4: With resilience as the first priority target, the tolerance parameter ε setting for economic indicators is set to be 0.4 and a Markov decision process is used to go for energy supply regulation strategies.
Scenario 5: With resilience as the first priority objective, the tolerance parameter ε for the economic indicators is set to 0.4. However, the Markov decision process energy supply regulation strategy is not used.
In MATLAB 2020b, a resilient economic two-tier optimization strategy, as well as the methodology proposed in this paper, is used to obtain the initial configuration of an islanded integrated energy system. The obtained energy coupling equipment configuration options are shown in the Table 4.
Considering the three critical loads of electricity, heat, and cold, the amount of integrated energy system loss of load at each time point is derived, the time period with more load supply loss in IES decision-making is identified to readjust the energy supply allocation planning, and the energy supply structure and the parameters such as the installed capacity of the coupled equipment, the resilience tolerance, and the key loads are adjusted by continuous feedback iteration. Economic and resiliency indicators are shown in the Table 5 and Table 6.
From the results in the table, it can be seen that the choice of the first objective, and the tolerance setting of the secondary objective will seriously affect the results of the configuration of the supply coupling equipment for the islanded IES, and due to the constraints of the economic indicators and the amount of lost load, the total configuration size of the five scenarios for the islanded IES will basically be close to the maximum installed scale capacity of 4 MW.
Scenarios 4 and 5, the first objective of the selection of resilience indicators and economic cost tolerance settings are also the same, so the two scenarios of the annualized investment costs and the configuration of the energy supply coupling equipment to solve the same results, the difference between the two is that Scenario 5 does not use the Markov returns to assist in decision-making to regulate the supply of energy. From the typical day data, annualized operation, and maintenance and energy costs, in Scenario 5, IES energy supply equipment scheduling process, the IES center did not receive the return value of the scheduling strategy for the future time period, and only found that the new energy generation equipment cannot meet the load requirements after the hasty dispatch to meet the demand at that time, and cannot trade-off the overall economic cost of a typical day within 24 h and resilience goals. And scenario five will be the relationship between heating, power supply, and cooling separately, not fully utilizing the coupled equipment before the synergistic effect, resulting in energy supply equipment part of the time period of the phenomenon of excess power. Energy consumption is not used by the demand side, so that the waste of resources and the economic cost, and the annualized cost of operation and maintenance of the scenario four rose by 14.87%, and the annualized cost of energy consumption rose by 17.60%, reaching CNY 124.51 thousand. Meanwhile, the energy coupling conversion equipment is not fully utilized during the typical daily peak load demand hours in summer and winter, resulting in more lost loads than Scenario IV, with the typical daily resilience index in summer and the typical daily resilience index in winter being only 0.873 and 0.784, respectively. In Scenario IV, the Markov decision-making process-assisted regulation of the supply of energy makes the overall annualized cost of the IES fall by CNY 45.21 thousand, with a decline percentage of 5.24%. The good regulation strategy, which uses energy coupling equipment to charge when load demand is low and discharges during peak load consumption to achieve the effect of peak shaving and valley filling, improves the typical daily resilience indexes by 7.33%, 7.56%, and 13.01% in spring, summer, and fall, respectively, relative to Scenario 5. The first four scenarios all use a conditioning strategy with a Markov decision process. With the increasing weight on the resilience indicator load loss, the installed size of photovoltaic and electric boilers also tends to rise, because the output curve of photovoltaic is mostly in the daytime period of a typical day, which is roughly the same trend as that of the electric load curve, and the electric boiler with the elevated investment cost, but also can quickly convert electric energy into heat, which enhances the resilience of the winter heat supply. In Scenarios 1 and 2, the installed number of gas units and fan units is significantly higher than Scenarios 3 and 4, which may be caused by the higher cost of gas units and the fan in the middle of the night. There will be a certain degree of wind abandonment phenomenon of energy supply, and both scenarios in which the battery size is only 500 kW, which will soon be filled, and cannot be very good peak shaving to fill in the valley, result in a large amount of load loss enhancement. All four scenarios are solved by investing in a set of compression chillers.
It can be seen that in Scenario 1, where economy is the first priority goal, its total cost, investment cost, and energy consumption cost are less than Scenario 2, Scenario 3, and Scenario 4, and the total cost is decreased by 6.94%, 12.04%, and 15.77%, respectively, compared to Scenarios 2, 3, and 4, but its typical day resilience indexes are basically the worst performers of all four scenarios except for a better typical day in summer due to the configuration of the compression chillers and storage tanks, and the typical day in spring, fall, and winter with a spike in heat loads are poorly performed. The IES in the upper control will control the cost in the first place, and will not purchase enough heat storage tanks such as thermal energy storage and electric boilers, and due to the cost of too many gas-fired units subject to the limitations of the natural gas pipeline supply, it cannot be sufficient to supply the IES’ required heat. In contrast, Scenario 4 basically does not consider the cost aspects of the problem. The reasonable configuration of the ratio between the supply and coupling equipment, as far as possible configuration of electric heat and cold energy storage equipment, makes full use of the synergistic relationship between the PV and the fan before a typical spring and fall day; its resilience index is 0.994, and the loss of load is only a very considerable 4.51%, although on a typical winter day there is still a 12.92% combined loss of load. The resilience metrics and economic costs associated with continuing to invest in compression chillers and storage tanks clearly do not meet the tolerance requirements of Scenario 4, and the loss of load is within an acceptable range, where the IES energy supply capacity is utilized to its fullest potential.

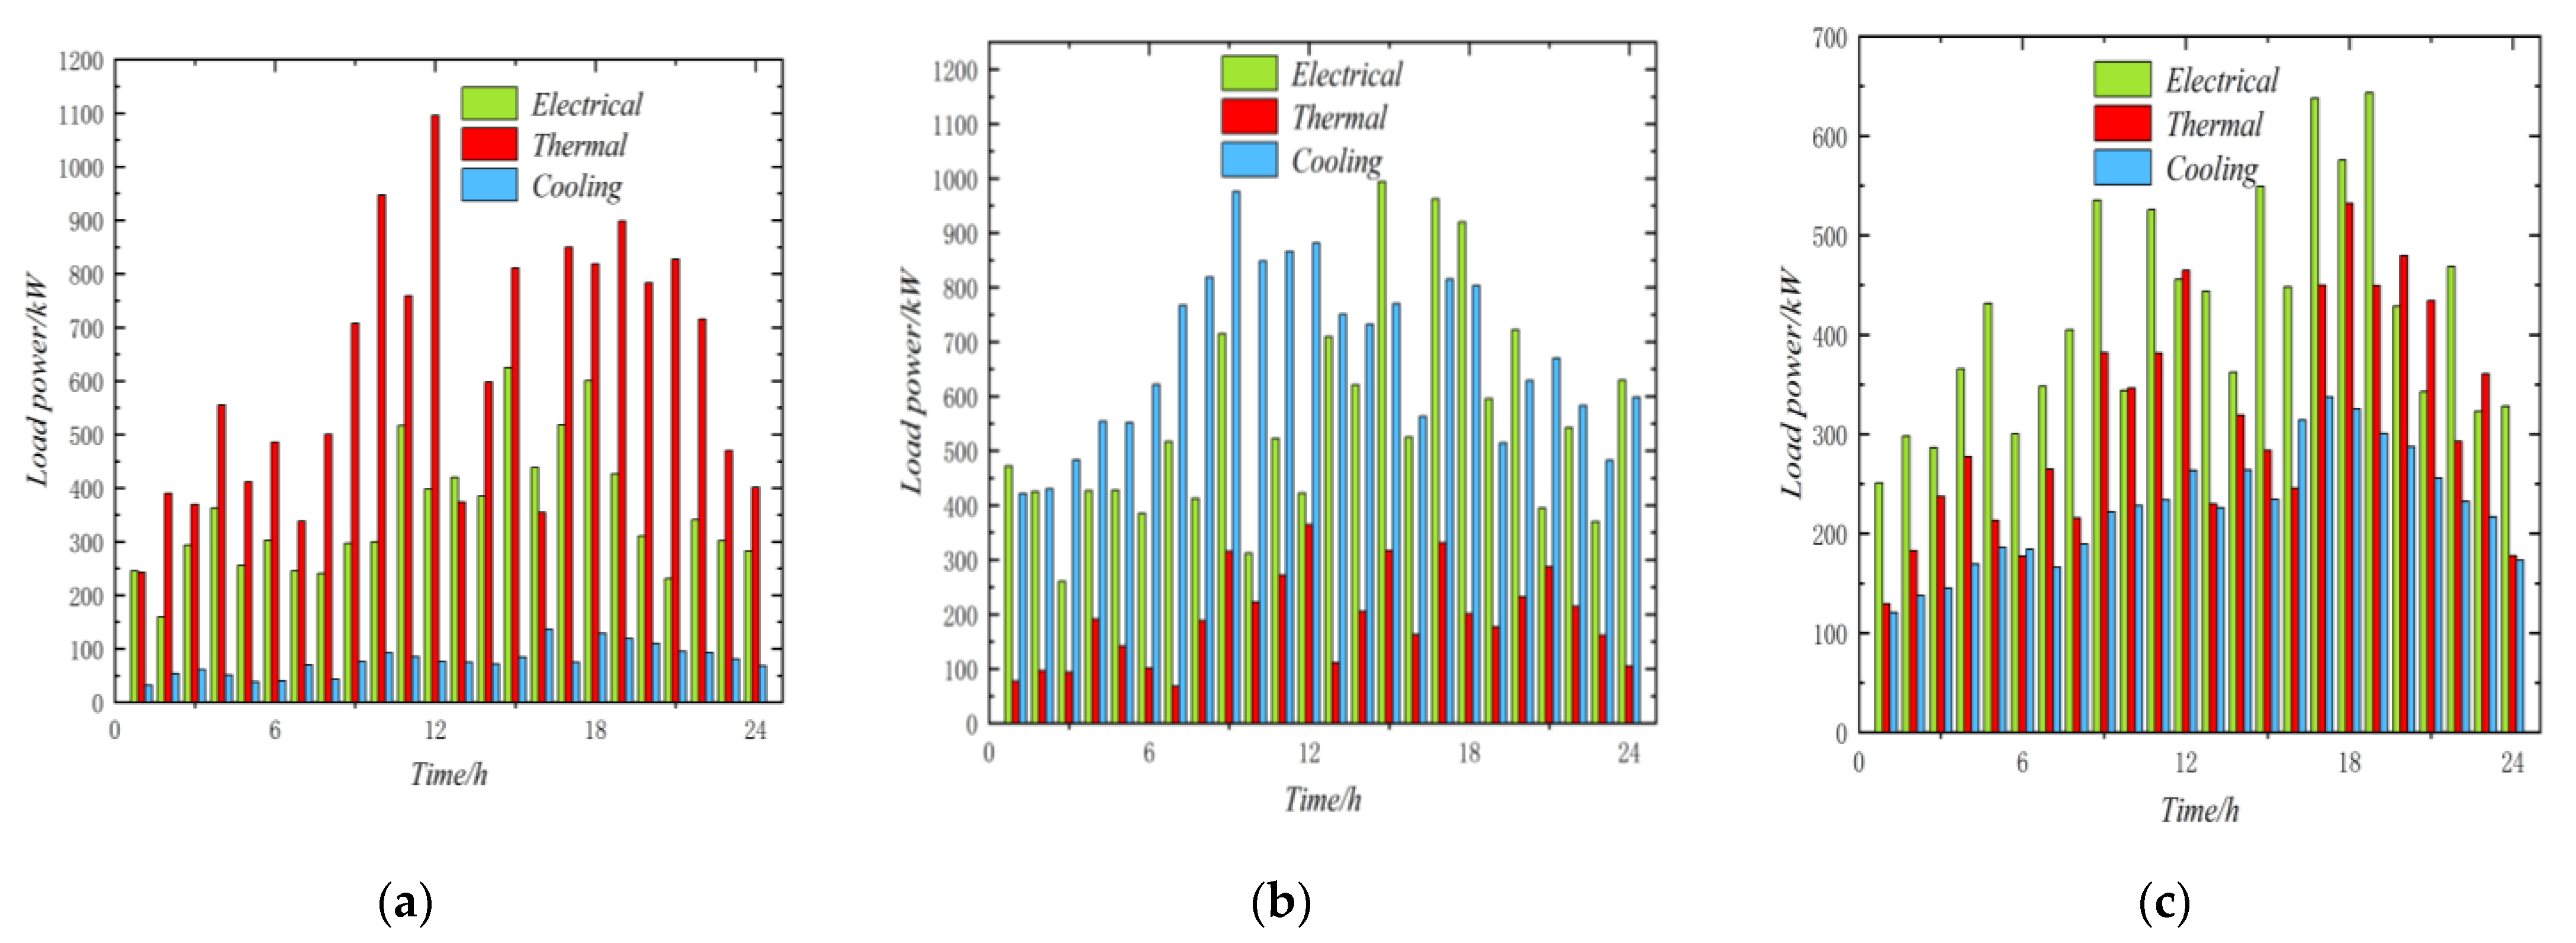
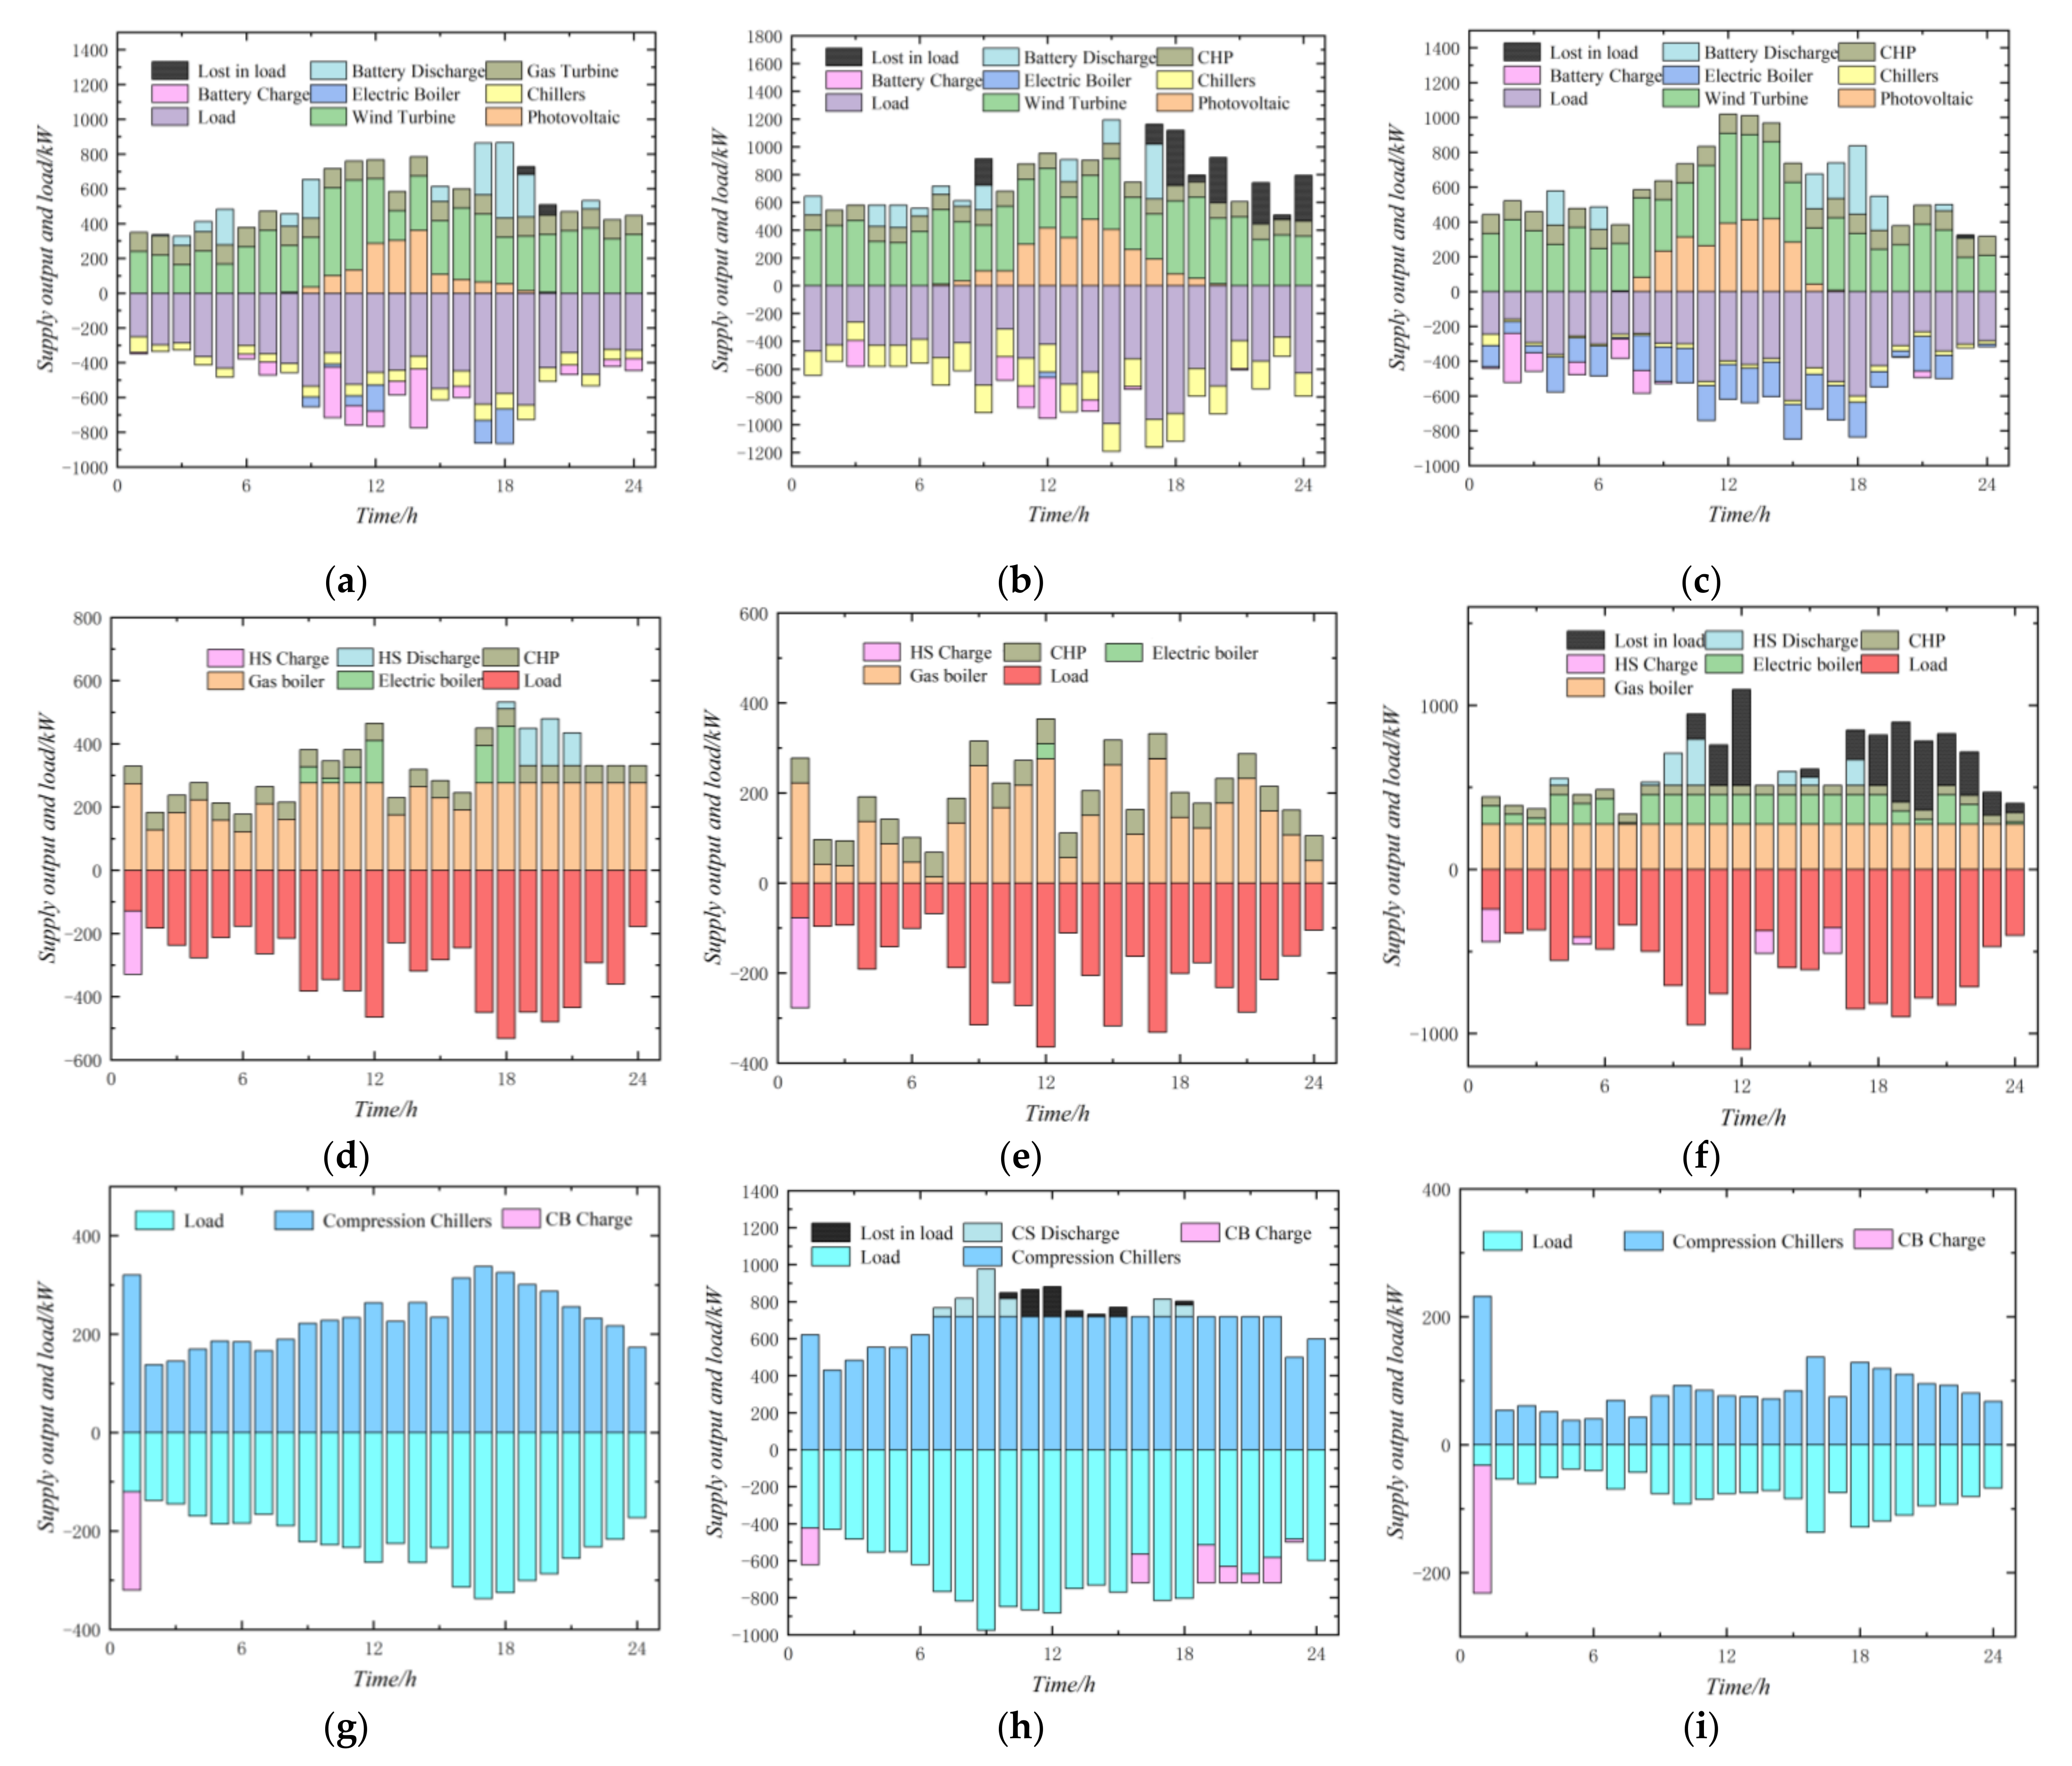
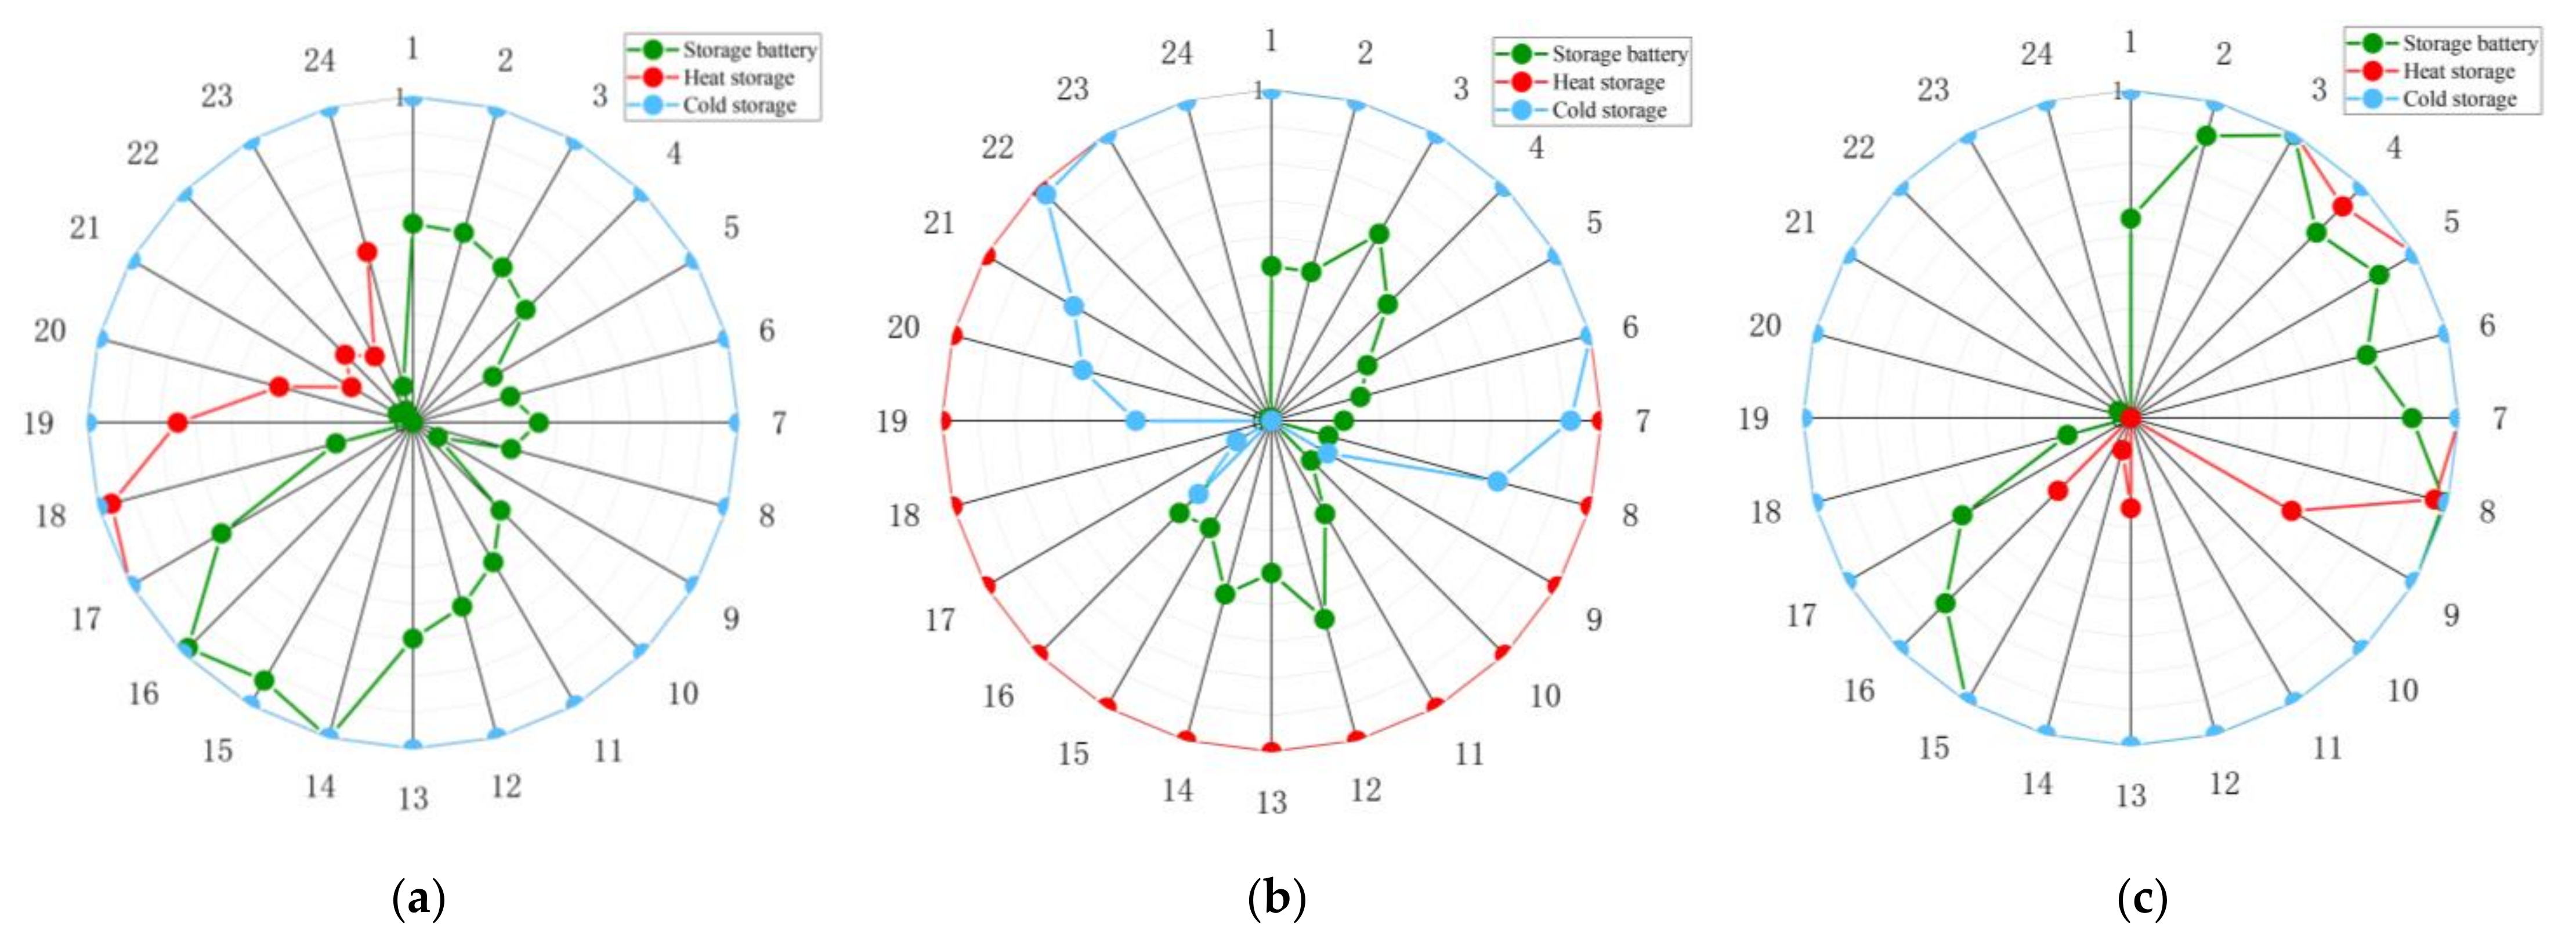
4.4. Operation Analysis

As an example, for Scenario 4, which has the greatest diversity in the types of energy-supply coupling equipment, the supply outputs and load profiles for each time period of the three typical days of the islanded integrated energy system are shown in Figure 6 and Figure 7 and Table 7 and Table 8.
On a typical day in spring and fall, the IES energy supply in the configuration of Scenario 4 is very effective, especially in the heating and cooling segments, where the IES perfectly supplies all the loads by utilizing relatively stable gas boilers, CHP units, and compression chillers. The cold storage tanks are not discharged on this typical day, and the heat storage tanks are only discharged from 19:00 to 22:00 h to balance the heat loads. In the power supply segment, the storage battery has more use; most of the time, it is involved in the IES energy supply, discharging at 4 to 6 o’clock and 14 o’clock to 19 o’clock, and recharging at 9 o’clock to 14 o’clock to maintain the battery operation, while the wind turbine, PV, and CHP as the main power supply most of the loads, and it can be seen that the wind turbine output is relatively smooth, and the trend of the PV output and the load curve have also similarities. The loss of load in the supply chain mainly comes from 19:00 to 21:00, which is a small amount of loss of load because there is almost no PV output in the IES, and the batteries have been depleted by the peak power consumption in the previous hours.
And when it comes to the simulation session on a typical summer day, the hot weather makes the demand of cold load rise sharply, and the cooling supply session is seriously challenged, the compression chillers are running at peak power from eight to 22 o’clock, and the power out of the remaining time period is higher than half of the rated maximum, and the saving cold tanks are supplying the cold by releasing from eight to ten o’clock, although the cold load is more than the maximum refrigeration capacity of the chillers, and the remaining capacity of the 500 kW storage tank was not enough to supply the cooling load until 11:00, and there was a cooling loss of 430.79 kW in the following six hours. The IES heating supply remained stable. At the height of summer, the usage of various electrical equipment rises sharply, plus the electric conversion of the compressed refrigeration machine also consumes a considerable portion of electricity, resulting in the irregularity of the IES electric load curve on a typical summer day. Although the fans, PV, and CHP units supply electricity stably, the irradiation intensity of the sun gradually becomes weaker from 17:00 to 24:00 when the sun goes down, and it is difficult for the fans and CHP units to support the full electric load, and the lost load totaled 4639.52 kW.
With lower temperatures in winter, the IES does not have much problem in both cooling and power supply on a typical day in winter, the loss of load in both power and cooling segments is zero with the synergistic effect of the multiple energy supply units and the energy coupling equipment. While facing a large number of lost loads from heat loads, due to the weighting of the IES economic indicators in addition to the resilience indicators in the process of solving the multi-objective using the tolerant hierarchical sequence method, it is taken into account that the lost loads only occur on typical winter days that only account for about a quarter of the year. Therefore, the installed capacity of the heating equipment includes only 300 lW gas boilers and 200 kW electric boilers, and the energy storage equipment has only 500 kW capacity, although the battery is charged and discharged by the Markov decision process to calm the heat load, the lack of the installed size allows the IES typical day in the morning and most of the evening to generate a large number of lost loads, and if you want to reduce the generation of lost loads, you can be in the tolerance setting parameter settings for appropriate cost reduction.

5. Conclusions

In this paper, on the basis of fully considering the economy and reliability of IES energy supply, a two-layer optimization strategy based on the resilience economy-oriented IES configuration optimization method for isolated islands is proposed. In the upper layer decision-making, the IES first solves the mixed integer linear model planning by means of enhancing redundancy and adjusting the energy supply structure to find the optimal configuration investment plan of IES within a certain range, and passes the configuration plan as a parameter to the lower layer IES control center. In the lower layer, based on the acquired IES energy supply configuration plan, the isolated IES control center uses the BGRU network model to forecast the outputs of wind turbines and distributed PV, respectively, and uses the Markov reward decision-making process to assist the decision-making to rationally adjust the output scheme of power supply, heating, cooling, and energy coupling equipment according to the future reward value in the subsequent moments.
The following conclusions are obtained through the analysis of the arithmetic examples:
(1)
The use of a two-layer optimization strategy can provide timely feedback to convey resilience and economic metrics, accelerate the solution of the resilience-economy multi-objective problem using the tolerance hierarchical sequence method and the IALO algorithm, and arrive at an optimal solution for the optimization of the IES configuration and operation in multiple iterations;
(2)
During the typical day operation phase, using the Markov reward decision-making process can make decisions that are most compatible with the loss of load and economic cost multi-objective planning to further optimize the reliability and economics of the IES supply capacity in a comprehensive manner;
(3)
The method proposed in this paper can be combined with the parameter setting of the tolerance of the forbearing stratified sequencing method and the selection of priority objectives to adjust the resilience and economic cost objectives that the IES decision maker wants to achieve.
In addition, a more rational combination of forecasting models and fully extracting the time-series characteristics of power data, or quantifying the impact of stochastic extreme events are the focus of future research work.

Author Contributions

H.M.: Conceptualization, Methodology, Typesetting, Experimental analysis, Writing—original draft. Y.W.: Funding acquisition, Methodology, Data collation, Supervision, Writing—review. M.H.: Writing—editing. All authors have read and agreed to the published version of the manuscript.

Funding

This research was funded by the National Natural Science Foundation of China 71972127.

Institutional Review Board Statement

Not applicable.

Informed Consent Statement

Not applicable.

Data Availability Statement

Not applicable.

Conflicts of Interest

The authors declare that they have no known competing financial interests or personal relationships that could have appeared to influence the work reported in this paper.

References

  1. Wang, J.; Zheng, X.; Tai, N.; Wei, W.; Li, L. Resilience-Oriented Optimal Operation Strategy of Active Distribution Network. Energies 2019, 12, 3380. [Google Scholar] [CrossRef]
  2. Kabeyi, B.; Olanrewaju, A. Sustainable Energy Transition for Renewable and Low Carbon Grid Electricity Generation and Supply. Front. Energy Res. 2022, 9, 1032. [Google Scholar] [CrossRef]
  3. Ren, H.; Jiang, Z.; Wu, Q.; Li, Q.; Yang, Y. Integrated optimization of a regional integrated energy system with thermal energy storage considering both resilience and reliability. Energy 2022, 261, 125333. [Google Scholar] [CrossRef]
  4. Pan, X.; Shen, Z.; Song, M.; Shu, Y. Enhancing green technology innovation through enterprise environmental governance: A life cycle perspective with moderator analysis of dynamic innovation capability. Energy Policy 2023, 182, 113773. [Google Scholar] [CrossRef]
  5. He, M.; Wang, Y.; Ma, H. Ecological effect life cycle assessment of house buildings based on emergy footprint model. Sci. Rep. 2023, 13, 16441. [Google Scholar] [CrossRef] [PubMed]
  6. Mehleri, E.D.; Sarimveis, H.; Markatos, N.C.; Papageorgiou, L.G. A mathematical programming approach for optimal design of distributed energy systems at the neighbourhood level. Energy 2012, 44, 96–104. [Google Scholar] [CrossRef]
  7. Zafeiropoulou, M.; Mentis, I.; Sijakovic, N.; Terzic, A.; Fotis, G.; Maris, T.I.; Vita, V.; Zoulias, E.; Ristic, V.; Ekonomou, L. Forecasting Transmission and Distribution System Flexibility Needs for Severe Weather Condition Resilience and Outage Management. Appl. Sci. 2022, 12, 7334. [Google Scholar] [CrossRef]
  8. Adewumi, O.B.; Fotis, G.; Vita, V.; Nankoo, D.; Ekonomou, L. The Impact of Distributed Energy Storage on Distribution and Transmission Networks’ Power Quality. Appl. Sci. 2022, 12, 6466. [Google Scholar] [CrossRef]
  9. Cadini, F.; Agliardi, G.L.; Zio, E. A modeling and simulation framework for the reliability/availability assessment of a power transmission grid subject to cascading failures under extreme weather conditions. Appl. Energy 2017, 185, 267–279. [Google Scholar] [CrossRef]
  10. Li, X.; Sun, T.; Hou, K. Evaluating Resilience of Island Integrated Energy Systems with Earthquake. Proc. CSEE 2020, 40, 17. [Google Scholar]
  11. Watson, P.L.; Spaulding, A.; Koukoula, M.; Anagnostou, E. Improved quantitative prediction of power outages caused by extreme weather events. Weather Clim. Extrem. 2022, 37, 100487. [Google Scholar] [CrossRef]
  12. Azad, S.; Ghandehari, M. A Study on the Association of Socioeconomic and Physical Cofactors Contributing to Power Restoration After Hurricane Maria. IEEE Access 2021, 9, 98654–98664. [Google Scholar] [CrossRef]
  13. Chen, Y.; Xu, F.; Zhang, W. Research on standby configuration and retention criteria for energy security in new power systems. J. Power Syst. Autom. 2022, 34, 32–40. [Google Scholar] [CrossRef]
  14. Liu, J.Y.; Shen, B.; Zhou, J. A resilient urban distribution network restoration approach taking into account critical load function restoration requirements. Electric Power Constr. 2022, 43, 66–75. [Google Scholar]
  15. Lv, C.; Yu, H.; Li, P. Coordinated operation and planning of integrated electricity and gas community energy system with enhanced operational resilience. IEEE Access 2020, 8, 59257–59277. [Google Scholar] [CrossRef]
  16. Liu, T.; Zhu, Y.; Sun, R. Resilience enhanced strategy for cyber-physical power system under extreme natural disasters. Autom. Electr. Power Syst. 2021, 45, 40–48. [Google Scholar]
  17. Jia, B.; Li, D.; Li, X. Two-stage restorationstrategy for multi fault of an electric gas integrated energy system. Power Syst. Prot. Control 2022, 50, 113–123. [Google Scholar]
  18. Ye, H.; Wang, J.; Ge, Y.; Li, J.; Li, Z. Robust integration of high-level dispatchable renewables in power system operation. IEEE Trans. Sustain. Energy 2017, 8, 826–835. [Google Scholar] [CrossRef]
  19. Huang, G.B.; Zhu, Q.Y.; Siew, C.K. Extreme Learning Machine: Theory and Application. Neurocomputing 2006, 70, 489–501. [Google Scholar] [CrossRef]
  20. Zhang, J.; Zhang, Z. Short-Term photovoltaic system power forecasting based on PSO-BP neural network. Renew. Energy Resour. 2012, 30, 28–32. [Google Scholar]
  21. Farah, S.; Aneela, Z.; Muhammad, M. A novel genetic LSTM model for wind power forecast. Energy 2021, 223, 120069. [Google Scholar]
  22. Zhang, P.; Li, C.; Peng, C.; Tian, J. Ultra-Short-Term Prediction of Wind Power Based on Error Following Forget Gate-Based Long Short-TermMemory. Energies 2020, 13, 5400. [Google Scholar] [CrossRef]
  23. Shaikh, A.K.; Nazir, A.; Khan, I.; Shah, A.S. Short term energy consumption forecasting using neural basis expansion analysis for interpretable time series. Sci. Rep. 2022, 12, 22562. [Google Scholar] [CrossRef]
  24. Cheng, W.; Li, J.; Xiao, H.C.; Ji, L.N. Combination predicting model of traffic congestion index in weekdays based on LightGBM-GRU. Sci. Rep. 2022, 12, 2912. [Google Scholar] [CrossRef] [PubMed]
  25. Sajjad, M.; Khan, Z.A.; Ullah, A.; Hussain, T.; Ullah, W.; Lee, M.Y.; Baik, S.W. A Novel CNN-GRU-Based Hybrid Approach for Short-Term Residential Load Forecasting. IEEE Access 2020, 8, 143759–143768. [Google Scholar] [CrossRef]
  26. Xiaoqiao, H.; Qiong, L.; Yonghang, T.; Zaiqing, C.; Jun, L.; Junsheng, S.; Wuming, L. Time series forecasting for hourly photovoltaic power using conditional generative adversarial network and Bi-LSTM. Energy 2022, 246, 123403. [Google Scholar]
  27. Xiong, J.; Peng, T.; Tao, Z.; Zhang, C.; Song, S.; Nazir, M.S. A dual-scale deep learning model based on ELM-BiLSTM and improved reptile search algorithm for wind power prediction. Energy 2023, 266, 126419. [Google Scholar] [CrossRef]
  28. Zajac, S.; Huber, S. Objectives and methods in multi-objective routing problems: A survey and classification scheme. Eur. J. Oper. Res. 2021, 290, 1–25. [Google Scholar] [CrossRef]
  29. Zeng, Z.; Fang, Y.P.; Zhai, Q.; Du, S. A Markov reward process-based framework for resilience analysis of multistate energy systems under the threat of extreme events. Reliab. Eng. Syst. Saf. 2021, 209, 107443. [Google Scholar] [CrossRef]
  30. Duan, Y.; Zhao, Y.; Hu, J. An initialization-free distributed algorithm for dynamic economic dispatch problems in microgrid: Modeling, optimization and analysis. Sustain. Energy Grids Netw. 2023, 34, 101004. [Google Scholar] [CrossRef]
  31. Zhang, M.; Hu, Z.; Wag, X. Two stage stochastic programming scheduling model based on dynamic scenario sets and demand response. Autom. Electr. Power Syst. 2017, 41, 68–76. [Google Scholar]
Figure 1. Schematic diagram of the structure of the IES of the park.
Sustainability 15 15663 g001
Figure 2. Feedback diagram of BGRU.
Sustainability 15 15663 g002
Figure 3. Solving process of two-layer optimization model for resilient economy.
Sustainability 15 15663 g003
Figure 4. Solving process of two-layer optimization model for resilient economy. (a) Spring and Fall; (b) Summer; (c) Winter.
Sustainability 15 15663 g004
Figure 5. Comparison of prediction errors for model samples. (a) SVR; (b) GRU; (c) LSTM; (d) BGRU.
Sustainability 15 15663 g005
Figure 6. Typical Daily Energy Supply Operation. (a) Electric supply in spring and fall; (b) Electric supply in summer; (c) Electric supply in winter; (d) Heat supply in spring and fall; (e) Heat supply in summer; (f) Heat supply in winter; (g) Cold supply in spring and fall; (h) Cold supply in summer; (i) Cold supply in winter.
Sustainability 15 15663 g006
Figure 7. Typical Day Energy Storage Device Status. (a) Spring and Fall; (b) Summer; (c) Winter.
Sustainability 15 15663 g007
Table 1. Abbreviations named in this article.
Sets and SymbolsAbbreviationsSets and SymbolsAbbreviations
tIndex of time periodsqStart-stop state and output value of each unit
sIndex of simulation runs of IES counting examplehEquation constraint
vIndex of equipmentgInequality constraint
¯, _ Max and min value of parametersQOptimal operating strategy of IES
CORandom coefficient generated by the Cauchy distribution function
ParametersAbbreviationsParametersAbbreviations
ηCHPeConversion efficiency of gas-to-electricity of the CHP unitμvUnit price of investment in the equipment v
ηCHPhConversion efficiency of gas-to-thermal of the CHP unityvUseful life of the equipment v
λgCalorific value of consumed
natural gas
COMvOperation and maintenance coefficients for the equipment v
ηGBGas turbine’s power generation efficiencyCECvEnergy consumption coefficients for the equipment v
ηEBElectric transfer efficiency of the electric boilerIvCorresponding maximum installed capacity of device v
ηCCConversion efficiency of the compression refrigerator from electricity to coldImaxUpper limit of the size capacity
of the IES
χj, χk, χlIndex of load levels in the electricity, and heating and cooling networksγMarkov reward decision process discount factor
rvDiscount rate of the equipment v
VariablesAbbreviationsVariablesAbbreviations
PCHPtGeneration power of the CHP unitat time tRResilience index of the IES
GCHPtAmount of natural gas consumed by the CHP unit at time tRwCorresponding weighted reward value for IES
PWTtActual output of the wind turbineΔestLoad loss of the electricity
uWTtInstalled capacity of the wind turbineΔhstLoad loss of the heat
PPVtActual output of the photovoltaicΔcstLoad loss of the cooling
uPVtInstalled capacity of the photovoltaicLEtBaseline loads of the electricity
PvtOutput power of the energy supply equipment v at time tLHtBaseline loads of the heat
HCHPtHeating power supplied by the CHP unit at time tLCtBaseline loads of the cooling
HGBtAmount of heat supplied by the gas boiler at time tMijInitial position
HEBtThermal power of the electric boiler at time tMijNext updated position of the initial position
EEBtElectrical power consumed by the electric boiler at time tx0, y0Original positions of the ant lion
CCCtRefrigeration power of the compression refrigerator at time tx’0, y’0New positions of ant lion
ECCtElectric power consumed by the compressor at time tηConstant controlling the variation step
PSBDtStorage battery discharge power at time tCTotal economic cost of the IES
PSBCtStorage battery charge power at time tCiInvestment cost of energy supply equipment
PHSDtHeat storage tank discharge power at time tCoOperation and maintenance cost of the IES
PHSCtHeat storage tank charge power at tCcEnergy consumption costs
PCSDtCold storage tank discharge power at time tnvNumber of units of the type of equipment v
PCSCtCold storage tank charge power at time tεTolerance
SSBtCharging state of the storage batterySHStCharging state of the heat storage tank
SCStCharging state of the cold storage tank
Table 2. Comparison of model prediction accuracy.
IndicatorsMAEMAPERMSEIndicators
SVR44.8111.93%68.78SVR
LSTM32.668.96%44.20LSTM
GRU34.099.43%41.21GRU
BGRU30.619.03%39.82BGRU
Table 3. Comparison of Test Function Fitness Values.
IPSOSSAALOIALO
f11.599 × 10−1238.60.0851.4117 × 10−60
f213.58217.7538.7509.351 × 10−11
f3−0.914−1.131−1.032−1.032
Table 4. Integrated Energy System Configuration Results.
EquipmentNumber of Equipment
Scenario IScenario 2Scenario 3Scenario 4&5
Gas turbine6643
Gas boiler5433
Chillers1111
Photovoltaic2435
Wind turbine6553
Electric boiler0112
Heat storage tank0111
Cold storage tank0001
Storage battery1122
Table 5. Comparison of Economic Indicators.
ScenarioCosts/Thousand ¥
CCICOCC
Scenario 1688.19473.69137.9876.52
Scenario 2739.55494.92154.5490.09
Scenario 3782.37495.61169.95116.81
Scenario 4817.06532.46178.72105.88
Scenario 5862.27532.46205.30124.51
Table 6. Comparison of Resilience Indicators.
ScenarioR
Spring and FallSummerWinter
Scenario 10.8530.8230.679
Scenario 20.8800.8030.731
Scenario 30.8970.8060.835
Scenario 40.9960.9390.886
Scenario 50.9280.8730.784
Table 7. Typical Daily Loss of Load.
TimeSpring and FallSummerWinter
ElectricHeatColdElectricHeatColdElectricHeatCold
10.00 0.00 0.00 0.00 0.00 0.00 0.00 0.00 0.00
20.00 0.00 0.00 0.00 0.00 0.00 0.00 0.00 0.00
30.00 0.00 0.00 0.00 0.00 0.00 0.00 0.00 0.00
40.00 0.00 0.00 0.00 0.00 0.00 0.00 0.00 0.00
50.00 0.00 0.00 0.00 0.00 0.00 0.00 0.00 0.00
60.00 0.00 0.00 0.00 0.00 0.00 0.00 0.00 0.00
70.00 0.00 0.00 0.00 0.00 0.00 0.00 0.00 0.00
80.00 0.00 0.00 0.00 0.00 0.00 0.00 0.00 0.00
90.00 0.00 0.00 190.98 0.00 0.00 0.00 0.00 0.00
100.00 0.00 0.00 0.00 0.00 30.52 0.00 153.43 0.00
110.00 0.00 0.00 0.00 0.00 146.06 0.00 247.51 0.00
120.00 0.00 0.00 0.00 0.00 161.58 0.00 584.50 0.00
130.00 0.00 0.00 0.00 0.00 30.92 0.00 0.00 0.00
140.00 0.00 0.00 0.00 0.00 12.11 0.00 0.00 0.00
150.00 0.00 0.00 0.00 0.00 49.60 0.00 49.76 0.00
160.00 0.00 0.00 0.00 0.00 0.00 0.00 0.00 0.00
170.00 0.00 0.00 144.04 0.00 0.00 0.00 182.06 0.00
180.00 0.00 0.00 398.75 0.00 21.64 0.00 307.74 0.00
1944.22 0.00 0.00 48.03 0.00 0.00 0.00 487.36 0.00
2059.75 0.00 0.00 326.21 0.00 0.00 0.00 422.12 0.00
210.00 0.00 0.00 0.00 0.00 0.00 0.00 316.00 0.00
220.00 0.00 0.00 298.92 0.00 0.00 0.00 264.44 0.00
230.00 0.00 0.00 33.38 0.00 0.00 0.00 139.15 0.00
240.00 0.00 0.00 329.83 0.00 0.00 0.00 56.79 0.00
Total103.970.000.001770.130.00452.430.003210.870.00
Table 8. Typical Day Energy Storage Device Status.
TimeSpring and FallSummerWinter
SBHSCSSBHSCSSBHSCS
10.61 1.00 1.000.47 1.001.00 0.61 1.00 1.00
20.60 1.00 1.000.46 1.001.00 0.89 1.00 1.00
30.55 1.00 1.000.65 1.001.00 1.00 1.00 1.00
40.49 1.00 1.000.50 1.001.00 0.80 0.91 1.00
50.28 1.00 1.000.33 1.001.00 0.87 1.00 1.00
60.31 1.00 1.000.28 1.001.00 0.74 1.00 1.00
70.39 1.00 1.000.22 1.000.91 0.86 1.00 1.00
80.31 1.00 1.000.18 1.000.71 0.99 0.96 1.00
90.09 1.00 1.000.00 1.000.20 1.00 0.57 1.00
100.38 1.00 1.000.17 1.000.00 1.00 0.00 1.00
110.49 1.00 1.000.32 1.000.00 1.00 0.00 1.00
120.58 1.00 1.000.62 1.000.00 1.00 0.00 1.00
130.66 1.00 1.000.46 1.000.00 1.00 0.27 1.00
141.00 1.00 1.000.54 1.000.00 1.00 0.10 1.00
150.91 1.00 1.000.37 1.000.00 1.00 0.00 1.00
160.98 1.00 1.000.39 1.000.31 0.80 0.31 1.00
170.68 1.00 1.000.00 1.000.12 0.59 0.00 1.00
180.24 0.96 1.000.00 1.000.00 0.20 0.00 1.00
190.00 0.72 1.000.00 1.000.41 0.00 0.00 1.00
200.00 0.42 1.000.00 1.000.59 0.01 0.00 1.00
210.05 0.22 1.000.01 1.000.69 0.04 0.00 1.00
220.01 0.29 1.000.01 1.000.97 0.01 0.00 1.00
230.04 0.23 1.000.01 1.001.00 0.00 0.00 1.00
240.12 0.54 1.000.01 1.001.00 0.00 0.00 1.00
Disclaimer/Publisher’s Note: The statements, opinions and data contained in all publications are solely those of the individual author(s) and contributor(s) and not of MDPI and/or the editor(s). MDPI and/or the editor(s) disclaim responsibility for any injury to people or property resulting from any ideas, methods, instructions or products referred to in the content.

