Article

An Assessment of the Heavy Metal Contamination, Risk, and Source Identification in the Sediments from the Liangtan River, China

1
Water Environment Engineering Technology Innovation Center, Chongqing Academy of Ecological and Environmental Sciences, Chongqing 401336, China
2
Southwest Branch of Chinese Research Academy of Environmental Sciences, Chongqing 401336, China
3
College of Resources and Environment, Southwest University, Chongqing 400716, China
*
Authors to whom correspondence should be addressed.
Sustainability 2023, 15(23), 16228; https://doi.org/10.3390/su152316228
Submission received: 19 September 2023 / Revised: 26 October 2023 / Accepted: 15 November 2023 / Published: 23 November 2023
(This article belongs to the Special Issue Heavy Metal Pollution and Ecological Risk Assessment)

Abstract

:
The contents of six heavy metals (HMs: Cr, Cu, As, Pb, Cd, and Zn) in sediments from the upper reaches of Liangtan River (LTR) were determined. The geo-accumulation index (Igeo), pollution load index (PLI), and potential ecological risk index (RI) were employed to assess the HM contamination in the sediments. Pearson’s correlation coefficient analysis (PCC), principal component analysis (PCA), and cluster analysis (CA) were used to infer the sources of HMs. The average concentrations of Cr, Cu, As, Pb, Cd, and Zn were 44.63 ± 25.36, 31.40 ± 22.56, 4.66 ± 2.07, 29.20 ± 27.73, 0.25 ± 0.06, and 68.87 ± 104.62 μg/g, respectively. The Igeo indicated that the Cd contamination level was unpolluted to moderately polluted. The mean PLI was 0.97 ± 0.53, suggesting that the sediments were unpolluted, but close to moderately contaminated. The RI values indicated that the potential environmental risk of HMs in the sediments of the LTR was low. The results of PCC, PCA, and CA suggested that the Cr, Cu, As, and Zn in the sediment may mainly originate from natural processes; Pb mainly comes from human industrial and agricultural production activities as well as natural processes; and the main source of Cd may be the production activities of the surrounding chemical enterprises and chemical fertilizer application in farmland.

1. Introduction

It is difficult for heavy metals (HMs) to migrate and degrade. A considerable proportion of HMs that are imported into surface water accumulate in the sediments, becoming a potential threat to the surface water quality [1,2]. In addition, HMs can destroy the photosynthesis of aquatic plants, the enzyme activities and functions of algae and microorganisms, and the physiological, biochemical and reproductive functions of fish, and they are gradually enriched in various organisms [3,4]. Although HM accumulation causes adverse impacts on the aquatic environment, the phenomenon of HM discharge into water bodies due to human activities continues. For example, during the process of industrialization and/or urbanization, numerous heavily polluting industrial enterprises have been introduced into urban and/or rural areas. At the same time, there is also a lack of facilities for treating domestic sewage from residents. Agricultural production still occurs in the outer suburbs of urban areas, which results in excessive fertilization, pesticide application, and improperly handled manure produced by livestock and poultry breeding. The long-term input of exogenous HMs such as HMs in industrial wastewater, domestic sewage, and agricultural fertilizers and pesticides, causes the accumulation of HMs in the sediments of river and lake systems [5,6,7]. As a result, rivers and lakes located in regions undergoing urbanization and/or industrialization may face potential ecological and environmental risks because of the accumulation of HMs in sediments. For instance, Islam et al. found that the sediments from river Korotoa, an urban river in the developing country Bangladesh, were heavily polluted by Cr, As, Cd, and Pb, due to industrialization and urbanization [1]. Tang et al. reported that sediments from three rivers in Hebei Province, a province in northern China undergoing rapid urbanization and industrialization, were polluted by Cr, Pb, Cu, Zn, and Ni to different degrees [8]. Similarly, a study on river sediments from urban, rural, and reclamation areas in Pear River Estuary area in Guangdong, China, also showed that urbanization and reclamation processes are important reasons that cause the HM pollution of river sediments [9]. Therefore, the pollution and the risk of HMs in the sediments of rivers located in regions undergoing urbanization and/or industrialization should be paid attention to and taken into consideration to balance the economic development and the aquatic ecosystem health.
The Liangtan River (LTR), which is located at the end of the Three Gorges Reservoir (TGR) area, is a secondary tributary of the Yangtze River. As an important and typical tributary of the Jialing River basin, the LTR is the longest secondary tributary among the secondary tributaries in the main urban area of Chongqing. The total length of the main stream is 88 km, and the basin area is 510.1 km2, flowing through 15 towns across three districts. The LTR is very representative of the secondary tributaries in the Chongqing metropolitan area. Located in the backwater area upstream of the TGR area, the long-term influence of the LTR’s water quality on the TGR’s water quality cannot be ignored. However, in recent years, as a result of the discharge of domestic sewage and industrial wastewater, the LTR has been seriously polluted, and the LTR’s water quality has exhibited a decreasing trend. This not only affects the development of industrial and agricultural activities in the river basin, but it also threatens the drinking water safety of hundreds of thousands of people downstream.
The upper reaches of the LTR are located in Jiulongpo District, Chongqing, which contains dense buildings and many residents. In recent years, with the accelerating shift of the Jiulongpo District economy from agriculture toward industrial transformation, the industrial production activities around the LTR in the Jiulongpo District have extensively increased. According to statistics, in 2019, the number of industrial enterprises in the Jiulongpo District had reached 440 [10]. There are a wide variety of enterprises in the river basin, including food processing, automobile and motorcycle vehicle parts and other manufacturing, mechanical processing, plastic processing, and textile industrial enterprises. A lot of industrial wastewater is discharged into the LTR after treatment, which has an adverse impact on the water quality of the LTR [11,12,13,14]. Since industrial wastewater usually contains large amounts of HMs, such as Cu, Cr, Pb, Zn, and Cd [11,12], after industrial wastewaters are discharged into the LTR, they may cause HM accumulation in the sediments [13,14]. Moreover, according to field investigations, some decentralized domestic sewage is discharged directly or overflows into the upper reaches of the LTR and its tributaries without treatment, and some centralized sewage is leaked into the upper reaches of the LTR and its tributaries due to damage to the sewage pipes. The domestic sewage is reported to contain a certain extent of HMs [15,16,17], which also contributes to the HM contamination in sediments. In addition, the agricultural areas in the Jiulongpo District are still large, which means that the agricultural non-point source pollution may be widespread. Field investigations have found that the water quality of many river sections in the upper reaches of the LTR is class V or worse than class V, and nitrogen and phosphorus are the main pollutants [18], indicating that the non-point source pollution due to runoff erosion, pesticides, and fertilizers is serious. Since pesticides and fertilizers often contain HMs [19,20], the non-point source pollution may contribute to HM contamination in sediments. Therefore, human activities, such as the discharge of industrial wastewater and domestic sewage, as well as agricultural activities which cause non-point source pollution, may lead to HM accumulation in the sediments in the upper reaches of the LTR in the Jiulongpo District. Although the possible environmental risks caused by HMs in river and lake sediments have gradually received research attention, and studies on the risk of HMs and their sources in some key river and lake basins have been conducted [21,22,23,24], studies on the environmental risk and sources of HMs in sediments in the LTR are still relatively limited [25].
This work aims to determine the contents of six HMs (Cr, Cu, As, Pb, Cd, and Zn) in the sediments from the upper reaches of the LTR in Jiulongpo District, assess the contamination and potential risks of HMs, and analyze the possible sources of the HMs in the sediments. The results of this work may serve as a reference for the management of the water environment of secondary rivers in the TGR area as well as regions undergoing urbanization and/or industrialization.

2. Materials and Methods
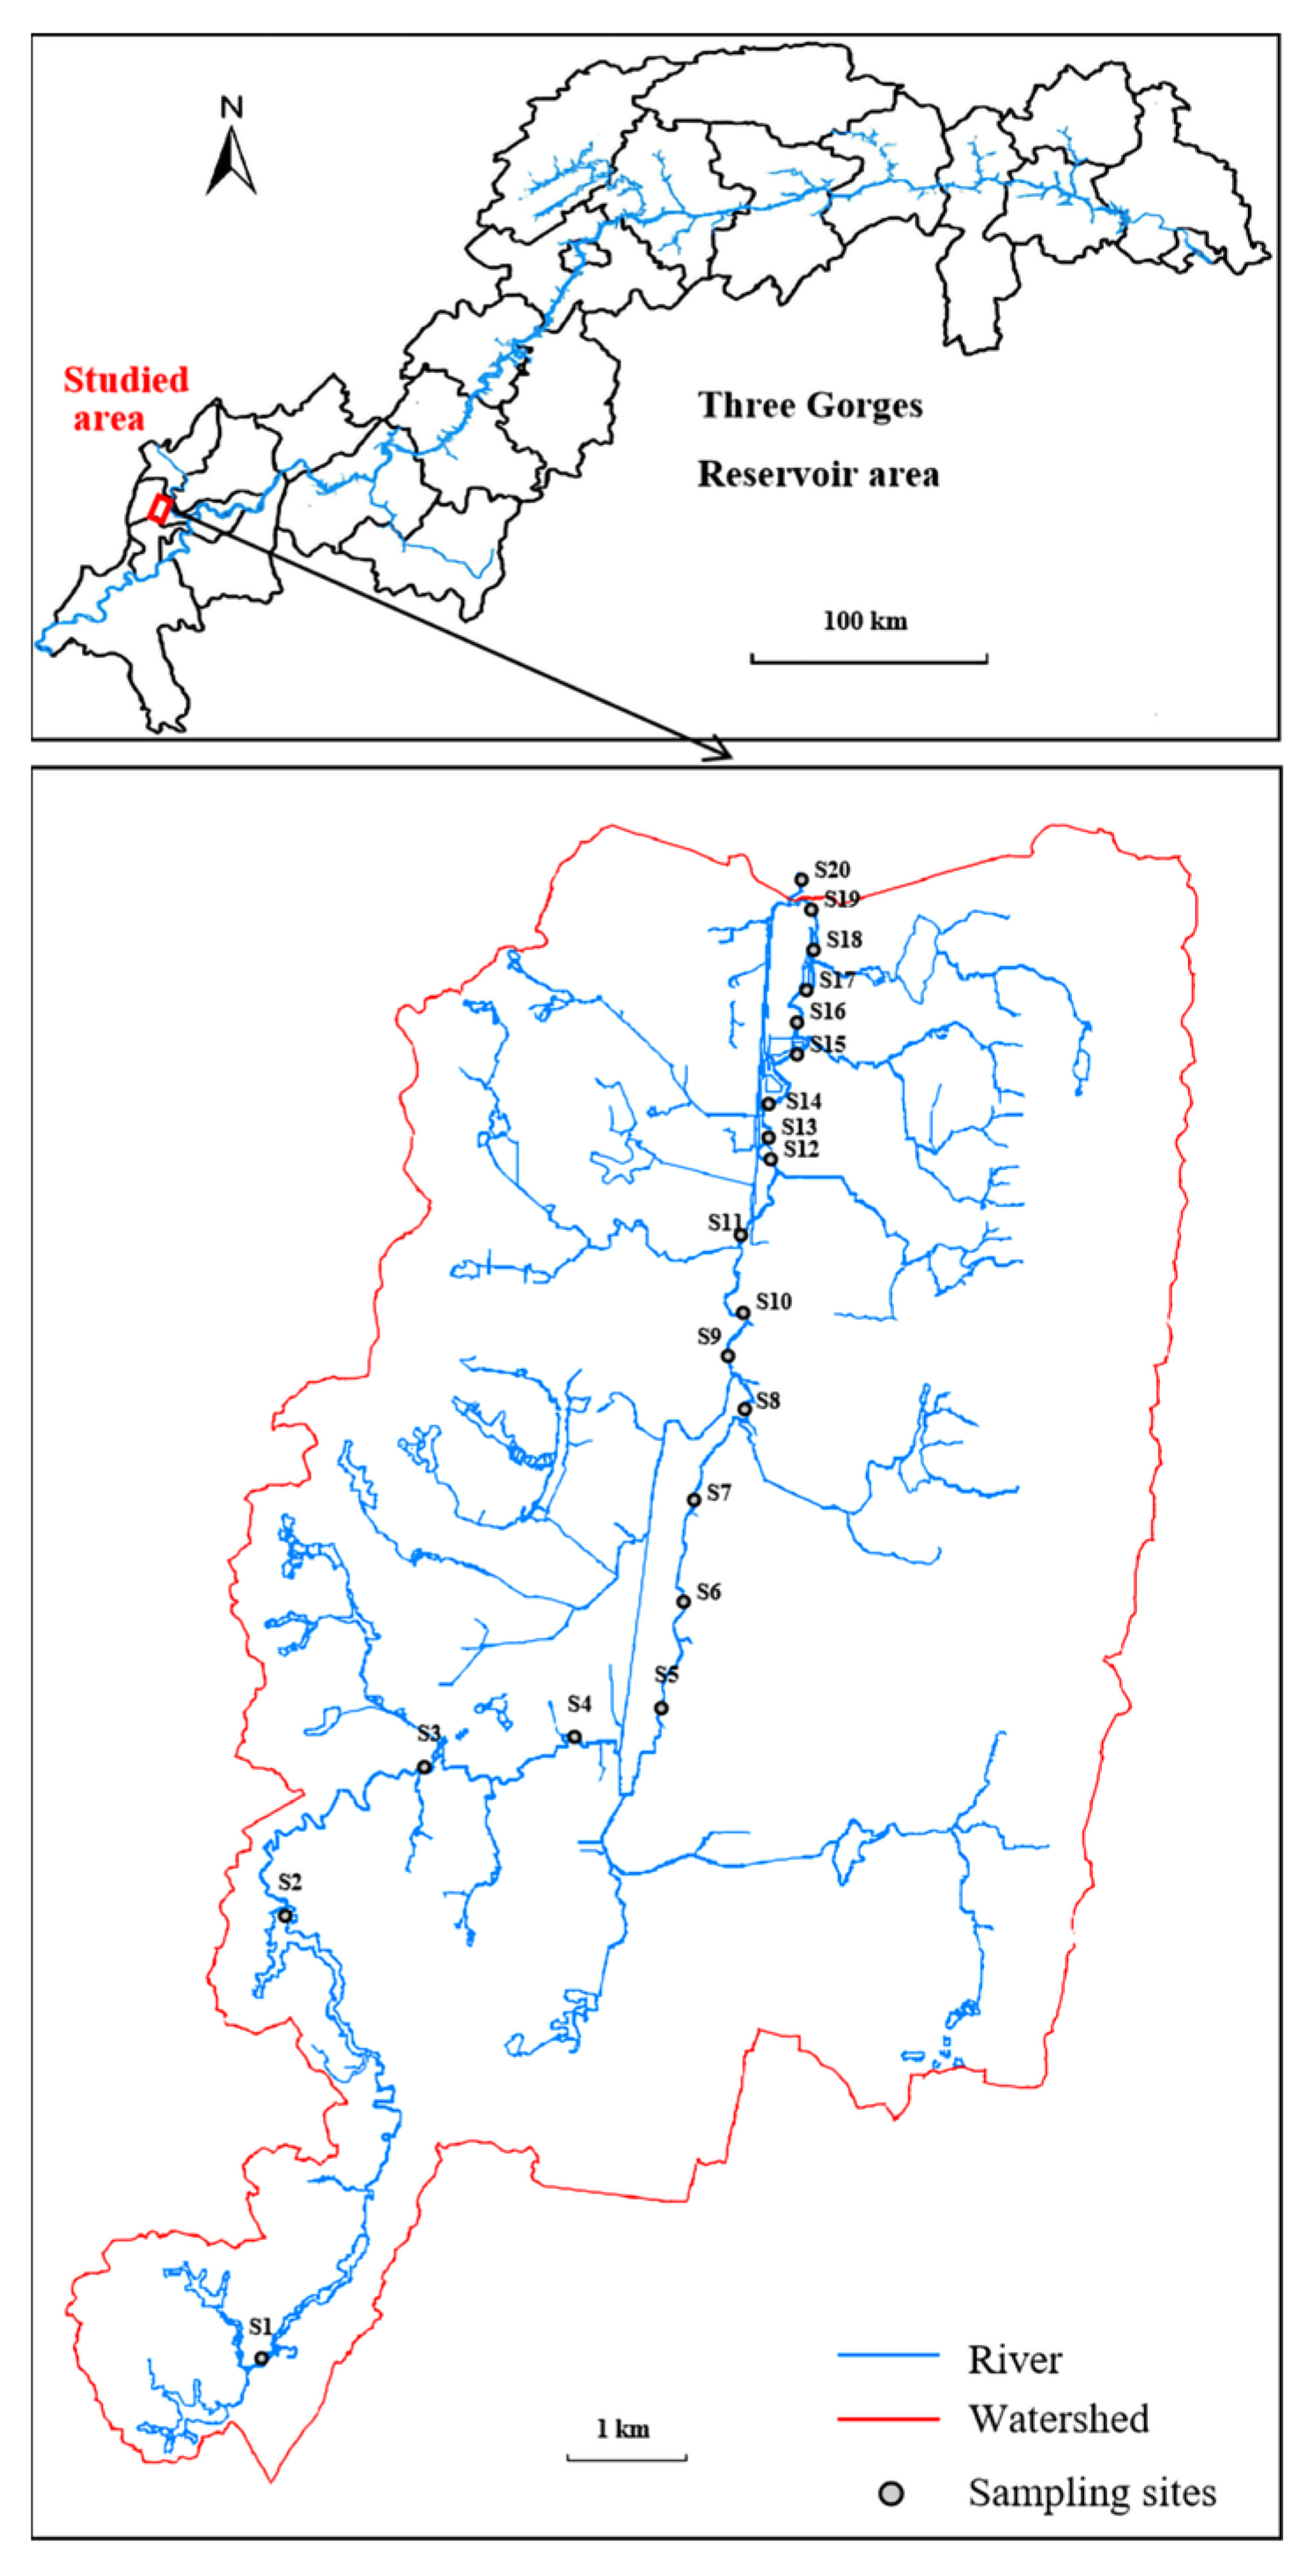
2.1. Study Area

The LTR is located between the Jinyun Mountain vein and the Zhongliang Mountain vein, to the west of the main city of Chongqing. The LTR is a tributary on the right bank of the lower reaches of the Jialing River (Figure 1). Originating from the Liaojiagou Reservoir in Baishiyi Town, Jiulongpo District, it flows north through Jiulongpo District, Shapingba District, and Beibei District, and flows into the Jialing River in Longqiao Street of the old city of Beibei. The total length of the LTR is 88 km, and the watershed area is 511.8 km2. The average water depth during the dry season is 0.6–1.0 m, and the annual average flow is 6.70 m3/s. The upper reaches of the LTR are located within the Jiulongpo District, and the length of the LTR in Jiulongpo District is 17.9 km, while the basin area is 64.5 km2. The LTR basin within the Jiulongpo District is a typical area in which urbanization is transforming the area from a rural area to an urban area.

2.2. Sample Collection and Analysis

Surface sediment samples in the river bottom were collected along the main stream of LTR in January 2020. There are 20 sampling sites, and their locations are shown in Figure 1. More informations about these sampling sites can be found in the Supplementary Materials (Table S1). According to the field investigation, the upstream areas on both sides of the LTR are mainly covered by natural vegetation and some farmland, and in the midstream and downstream areas, there are more and more human settlements and agricultural land on both sides of the river. Therefore, in the upstream, where the sediments may be less impacted by human activities, fewer sampling sites (S1–S4) are set, while in the midstream and downstream, more sampling sites (S5–S20) are set. Sediment samples were collected along the deep river line by gravity grab at a depth of 20–30 cm. Three sediment samples were collected at the same sampling site and then mixed as one sample. The samples were sent back to the laboratory on the same day, freeze-dried, and then ground until all particles’ sizes were less than 0.149 mm [25]. All sediment samples were stored in sealed clean Kraft paper envelopes at room temperature until analysis. According to the field investigation, HMs such as Cr, Cu, As, Pb, Cd, and Zn, have been detected in the wastewaters from industrial parks and municipal wastewater treatment plants. Therefore, the six HMs Cr, Cu, As, Pb, Cd, and Zn, which may accumulate in the sediments more quickly because of wastewater discharge and cause potential risk to the aquatic environment, are chosen for measurements. Details of the HM preparation and analysis processes can be found in a previous study [25]. Briefly, 0.5 g of sediment samples was digested in 10 mL of H2SO4 and 5 mL of HF. After cooling, the digested sample was evaporated by adding HClO4 until a transparent solution was obtained. The digested sample was diluted up to 50 mL with double-deionized water for HM analysis. In the acid extracts, the contents of the six HMs, Cr, Cu, As, Pb, Cd, and Zn, in the sediments were measured with inductively coupled plasma mass spectrometry (iCAPTM RQplus ICP-MS, Thermo Scientific, Waltham, MA, USA). Detailed informations about HM measurement with ICP-MS can be found in the Supplementary Materials (Calibration method for heavy metal determination using ICP-MS).

2.3. Assessment of Sediment Contamination

2.3.1. Geo-Accumulation Index (Igeo)

The Igeo is extensively utilized to assess HM contamination in sediments [26,27,28,29]. This index shows the relationships between HMs in sediments and in the environmental background. Thus, this index can be used to reflect HM pollution from human activities. The Igeo values are estimated using the ratio of the sediment HM concentration to the geo-chemical background reference values [30]. The Igeo values were estimated as follows:
I g e o = l o g 2 ( C s i 1.5 × C b i )
where Csi is the measured HM concentration in sediments, and Cbi is the environment background concentration of HMs. In this work, the environment background values (BGVs) of Cr, Cu, As, Pb, Cd, and Zn were 76.14, 23.83, 5.82, 25.48, 0.13, and 75.84 µg/g, respectively [31].
According to the range of the values of Igeo, the corresponding HM pollution levels were obtained (Table 1) [32].

2.3.2. Pollution Load Index (PLI)

The PLI is also a commonly used index to evaluate HM pollution that can directly reflect the level of HM pollution [33,34,35,36]. The PLI is calculated according to the following equation [37]:
PLI = i = 1 n C s i C b i 1 / n
where Csi and Cbi are mentioned in Section 2.3.1. Based on the PLI value, the metal pollution levels of the sampling sites can be divided into four levels, which are not contaminated (PLI < 1), moderately contaminated (1–2), seriously contaminated (2–5), and extremely contaminated (PLI > 5) [38].

2.3.3. Potential Ecological Risks

The extent of potential ecological risk caused by HM pollution to the water environment can be assessed using the potential ecological risk index (RI). The RI is calculated as follows [30]:
RI = i = 1 n T i × C s i C b i
where Ti is the toxic response factor of HM i, and the Ti values of Cr, Cu, As, Pb, Cd, and Zn are 2, 5, 10, 5, 30, and 1, respectively [39]. The evaluated criteria of RI are shown in Table 2.

2.4. Quality Assurance and Quality Control (QA/QC)

All glassware and Teflon devices were thoroughly acid-washed. Reagents of analytical grade were used for blanks and calibration curves. QA/QC procedures were conducted by using standard reference materials (GBW07401, obtained from Chinese Academy of Measurement Science) with each batch of samples (one blank and one standard for each 15 samples). Moreover, a recovery test of standard addition was also performed to verify the accuracy and precision of the digestion procedure. The recovery of HM content in the standard was between 95% and 115%, and the analysis error of the three groups of parallel samples was less than 15% [13]. All analyses were performed in duplicate under the same conditions.

2.5. Statistical Analysis

Origin 2018 (Origin Lab, Northampton, MA, USA) was used to perform principal component analysis (PCA) and cluster analysis (CA). SPSS Statistics 19.0 (SPSS Inc., Chicago, IL, USA) were used to calculate standard derivations, mean, and coefficient of variation (CV) and to perform Pearson’s correlation analysis (PCC). For all tests, p < 0.05 and p < 0.01 were considered to indicate statistical significance.

3. Results and Discussion

3.1. HM Concentrations in the Sediments from the LTR

The concentrations of Cr, Cu, As, Pb, Cd, and Zn in the sediments from the 20 sampling sites in the upper reaches of the LTR in Jiulongpo District were determined (Figure 2). The average concentrations of Cr, Cu, As, Pb, Cd, and Zn were 44.63 ± 25.36, 31.40 ± 22.56, 4.66 ± 2.07, 29.20 ± 27.73, 0.25 ± 0.06, and 68.87 ± 104.62 μg/g, respectively, which were 0.59, 1.32, 0.80, 1.15, 1.90, and 0.91 times the BGVs of each HM, respectively. Therefore, the sediments in the upper reaches of the LTR were most heavily contaminated with Cd, followed by Cu and Pb. The variation coefficients of the contents of Cr, Cu, As, Pb, Cd, and Zn among different samples were 56.8%, 71.8%, 44.5%, 81.3%, 24.5%, and 151.9%, respectively, indicating that the spatial variations of HMs in the sediments were large. Differences in the intensity of human activities are usually the main cause of spatial variations in pollutant contents in sediments. For example, there is often significant spatial variation in the pollutant levels in river sediments between urban and rural areas [40,41,42,43]. The study area where the LTR flows through mainly consists of natural environment and farmland, in addition to some densely populated areas, such as towns and industrial parks. For instance, the sampling site S2 is Liaojiagou Reservoir, where decentralized villagers have settled and cultivated around the reservoir for many years. The domestic and farming wastewater may have been directly discharged into the reservoir for many years. Therefore, HMs contained in the wastewater were transferred into the reservoir and accumulated in the sediment for a long time. In addition, the reservoir environment favors the accumulation of HMs because of the slow exchange of water in the reservoir with the outer environment. Consequently, the HM concentrations in the sediment from S2 were high. For one more example, the HM contents in sediment from the sampling site S3 are relatively low, and this is reasonable, because S3 is located in the area containing mainly natural vegetation and with human activities being rare. Generally, the differences in the natural environment and human activities along both sides of the LTR may be the main reason for the large spatial variation in HMs in the sediments.

3.2. Evaluation of HM Pollution in Sediments

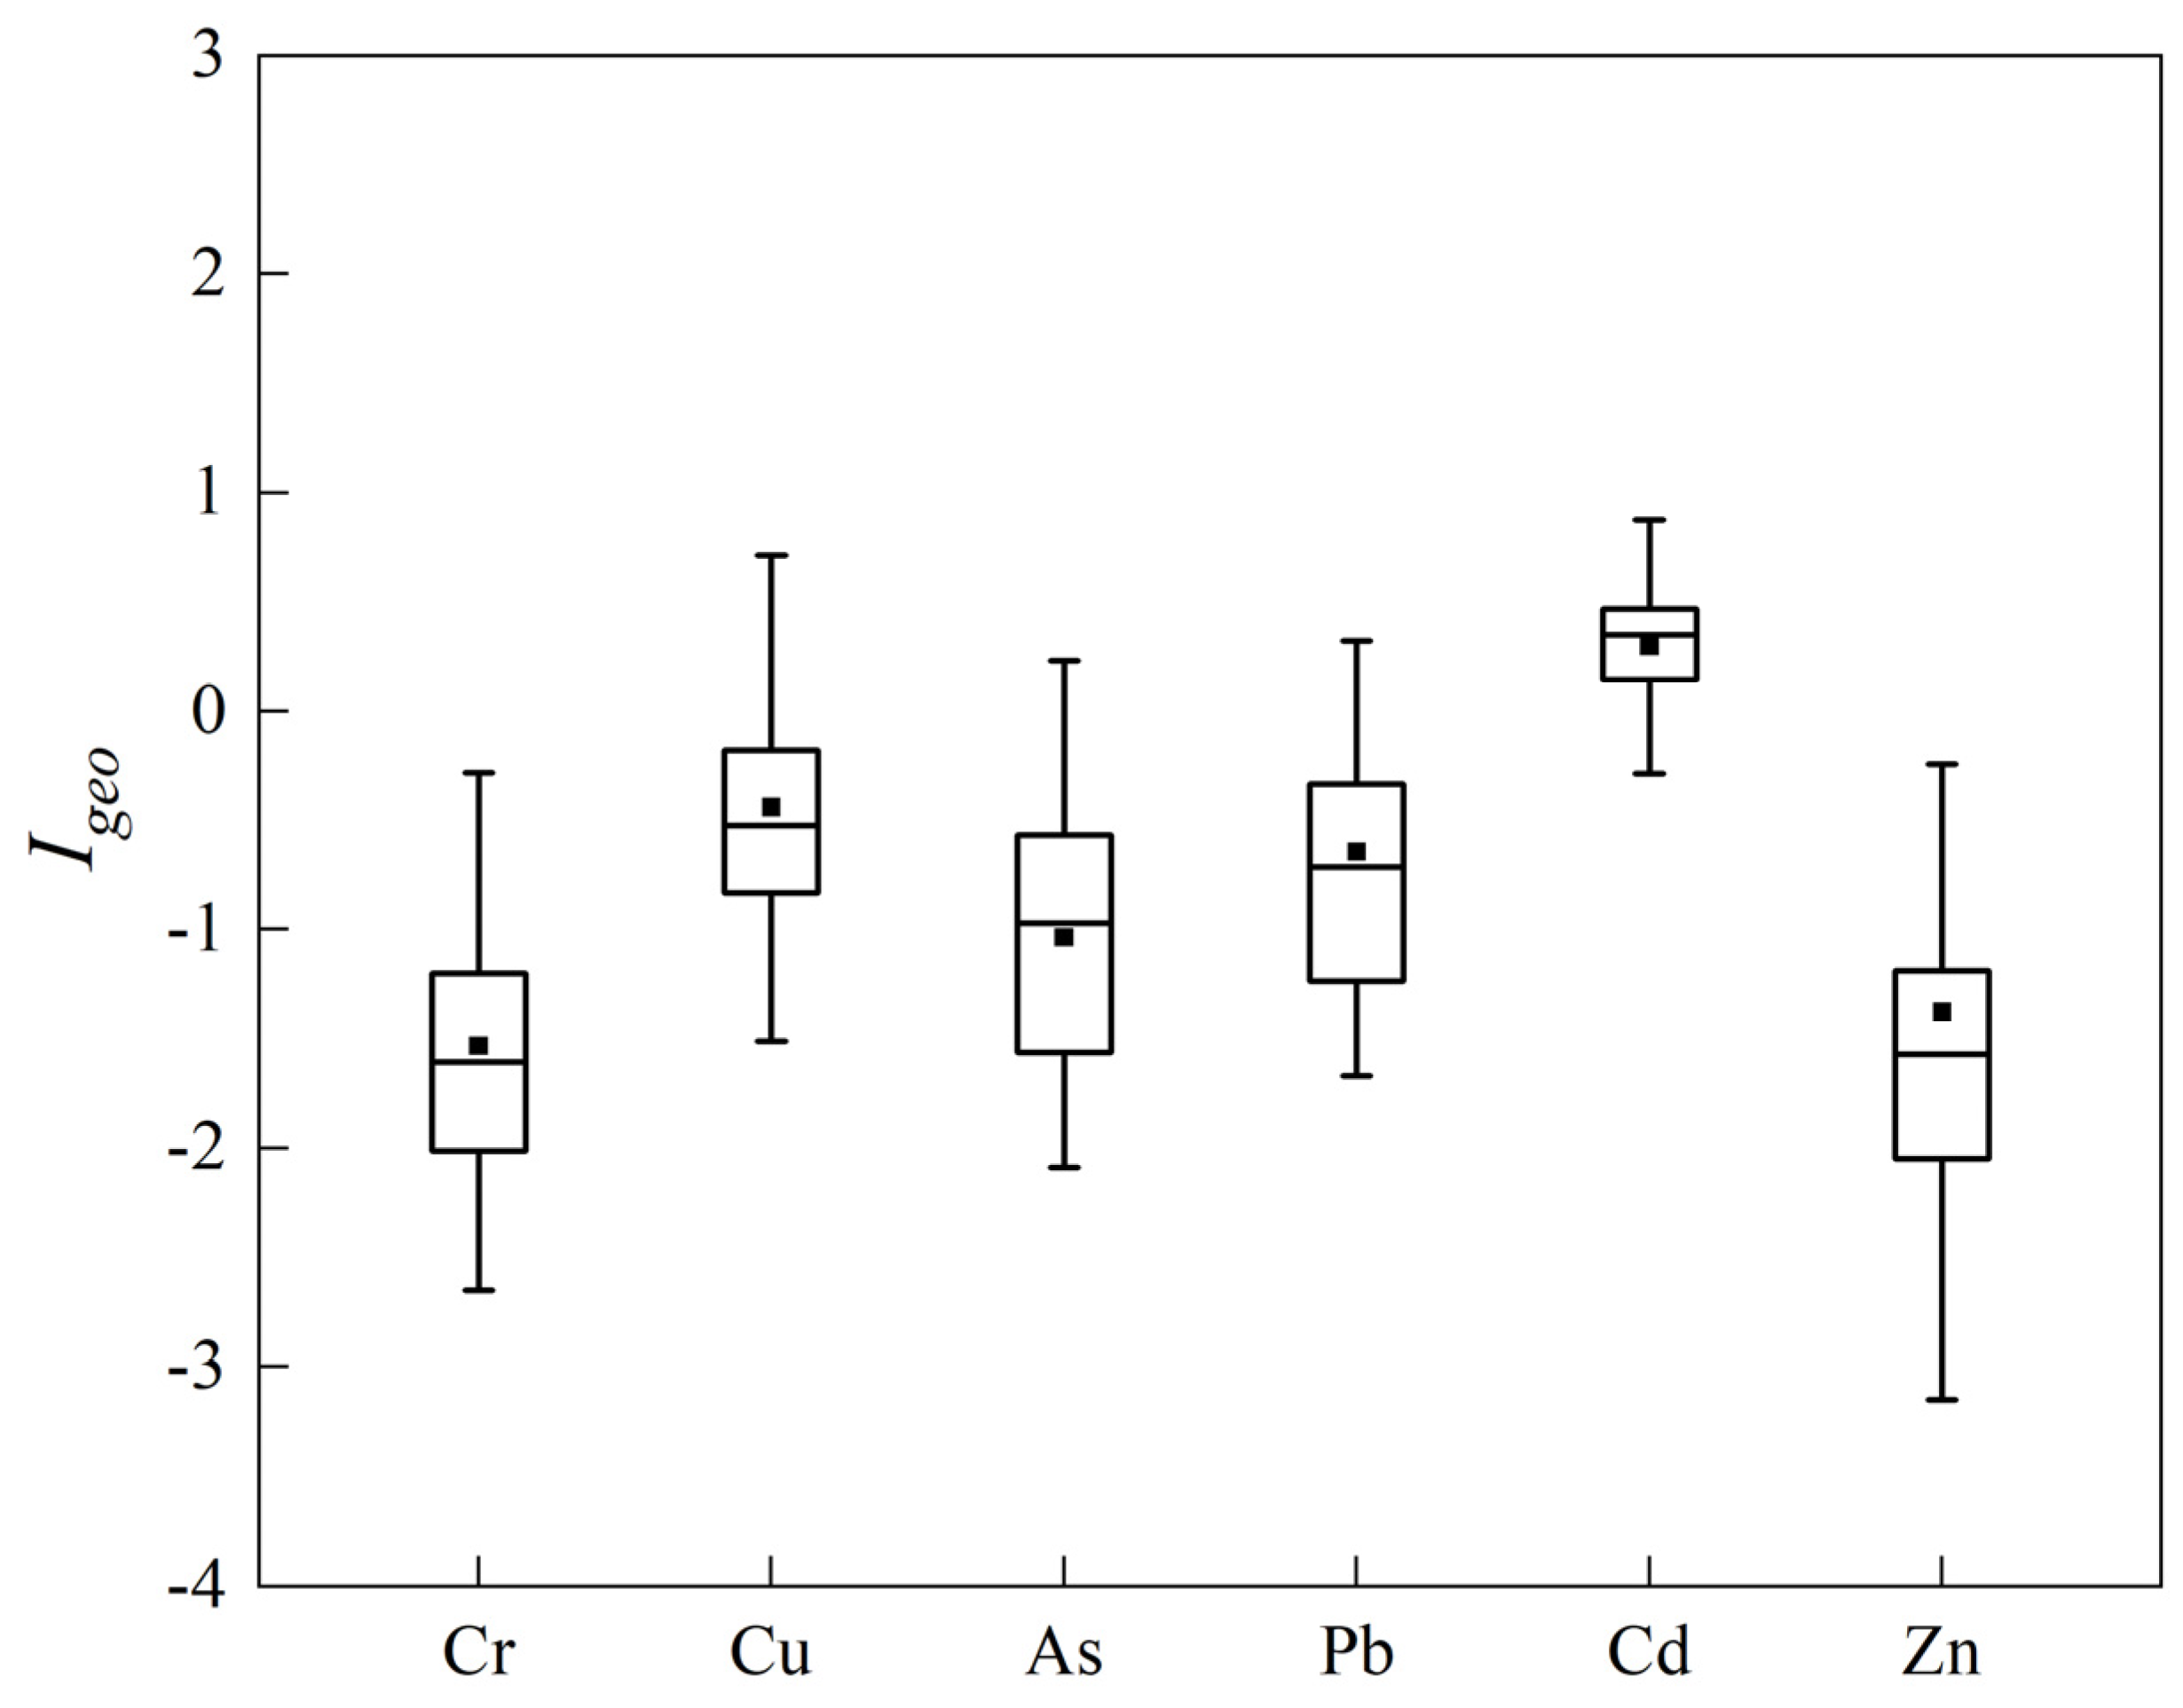
3.2.1. Geo-Accumulation Index (Igeo) of HMs in the Sediments

The mean Igeo values of Cr, Cu, As, Pb, Cd, and Zn in the sediments from the LTR were −1.53 ± 0.70, −0.44 ± 0.82, −1.03 ± 0.63, −0.64 ± 0.79, 0.30 ± 0.38, and −1.38 ± 1.17, respectively (Figure 3). Among them, the mean Igeo values of Cr, Cu, As, Pb, and Zn were all less than 0, implying that there was no Cr, Cu, As, Pb, and Zn pollution. The mean Igeo value of Cd was between 0 and 1, and the Igeo values of 75% of sampling sites were between 0 and 1, indicating that overall, the Cd contamination in the sediments was at the level of unpolluted to moderately polluted. Therefore, according to the Igeo values of the HMs, the dominant HM pollution in the sediments in the upper reaches of the LTR was Cd pollution. Cd pollution in the sediments in other rivers and lakes in the TGR areas has also been reported, and Cd was mainly derived from human activities [44,45,46].

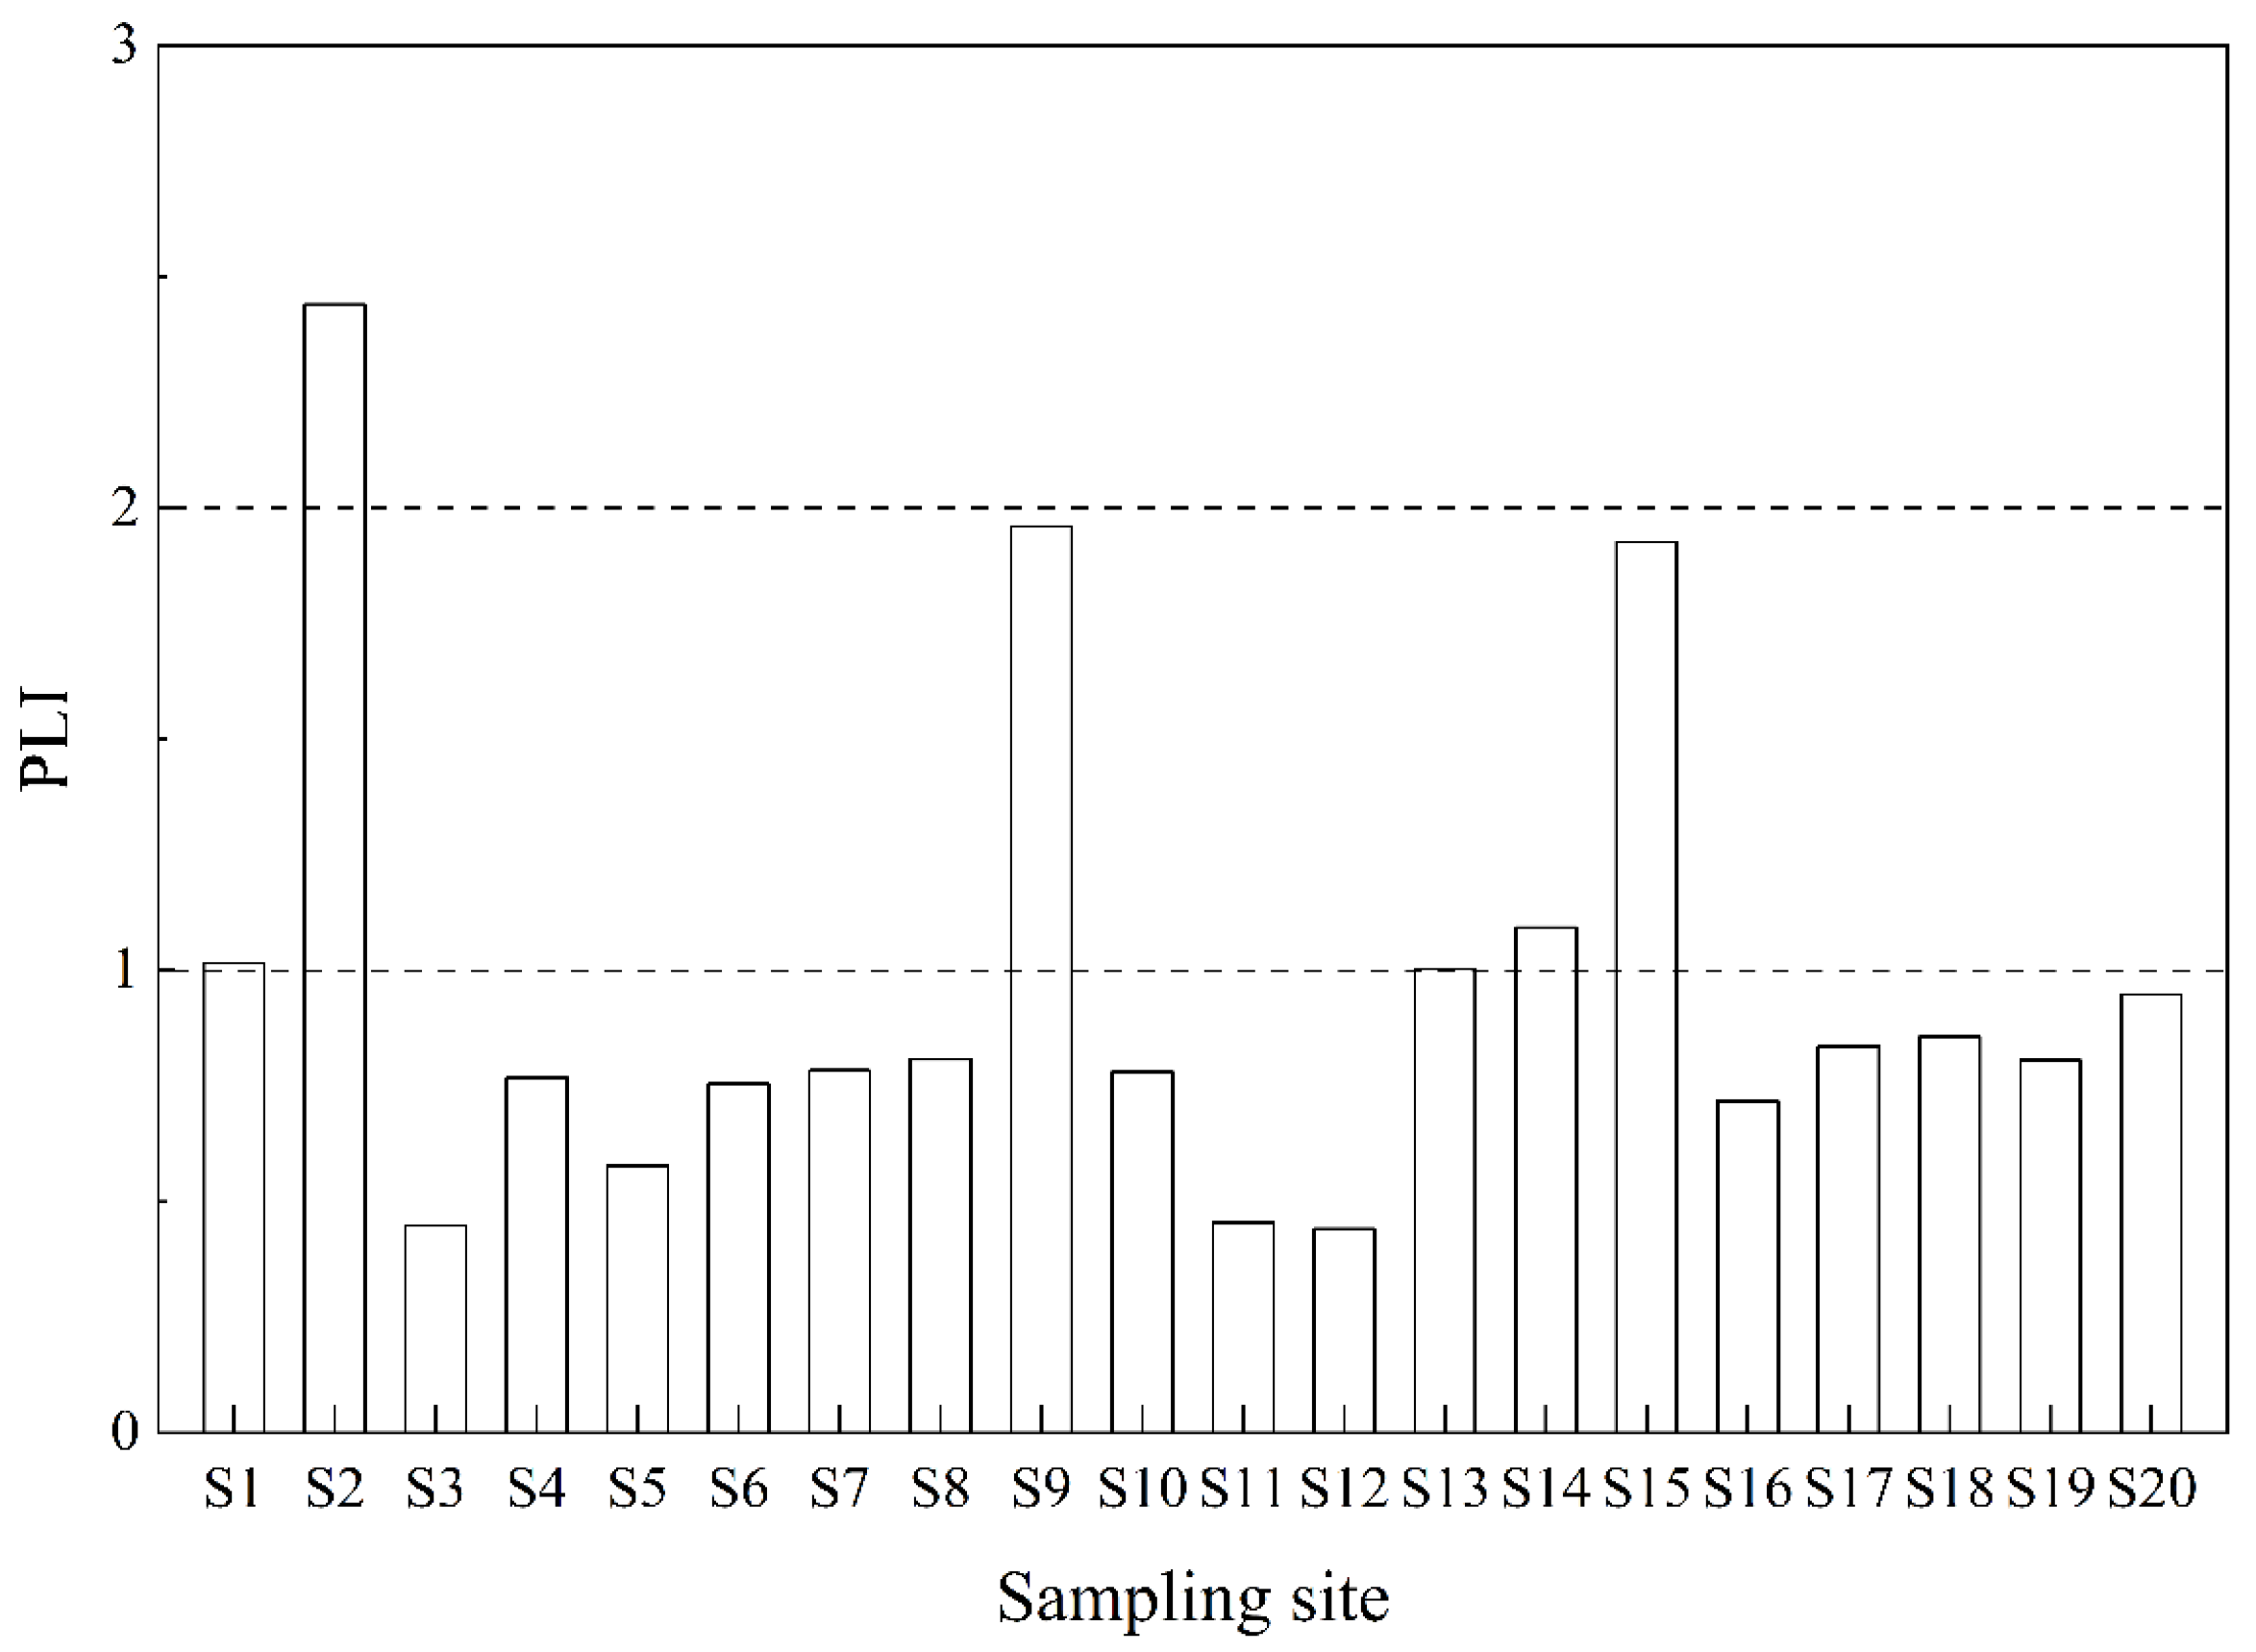
3.2.2. PLI of HMs in the Sediments

The PLI values of HMs in the sediments at each sampling point in the upper reaches of the LTR are shown in Figure 4. Among the twenty sampling sites, the PLI value of one sampling site was between 2 and 3, indicating serious pollution, while the PLI values of five sites were between 1 and 2, indicating moderate contamination. The PLI values of the other 14 sampling sites were less than 1, indicating no pollution. The mean PLI values of the 20 sampling sites were 0.97 ± 0.53, indicating that the overall HM pollution level in the LTR in Jiulongpo District corresponds to an unpolluted state, but it is close to moderately contaminated.
The three sampling sites that need to be focused on are sites S2, S9, and S15, with PLI values of 2.44, 1.96, and 1.93, respectively. The sediment from S2 was seriously polluted, and sites S9 and S15 were very close to a severe pollution level. According to the results of the HM concentrations at these three points, the concentrations of Cr, Cu, As, Pb, Cd, and Zn at site S2 were 1.23, 3.50, 1.76, 1.77, 2.47, and 6.35 times the BGVs, respectively. The concentrations of Cr, Cu, As, Pb, Cd, and Zn at site S9 were 1.56, 4.05, 0.91, 1.87, 2.09, and 2.54 times the BGVs, respectively. The concentrations of Cr, Cu, As, Pb, Cd, and Zn at site S15 were 1.02, 2.46, 1.32, 4.73, 2.58, and 1.27 times the BGVs, respectively. Except for the amount of As in the sediment from site S9, which did not exceed the background value, and the Cr in the sediment from site S15, which was essentially equal to the BGV, the HMs in the sediments from the three sampling sites were all higher than the reference environmental BGVs. This suggests that HM accumulation in these three sampling sites may be related to human activity. The reason why the HM concentrations in the sediment from site S2 are higher than the BGVs have been mentioned in Section 3.1. According to the field investigation, site S9 is located in densely populated and entrepreneurial areas. Near site S9, there are many industrial enterprises, such as Chongqing Lizhan Standard Parts Manufacturing Co., Ltd., Chongqing, China, Chongqing Futing Metal Material Co., Ltd., Chongqing, China, Houzhi Machinery Manufacturing Co., Ltd., Chongqing, China, and so on. Therefore, industrial wastewater containing HMs may be discharged into the LTR. Moreover, there are many small residential areas near site S9, which means that domestic wastewater may also be discharged into the LTR. Similarly, around the upstream areas of site S15, there are two industrial parks (the Xinyuan Industrial Park and the Hanggu High-end Equipment Manufacturing Park), and there are several industrial enterprises outside the industrial parks. Therefore, the relatively high HM concentrations in the sediment from S15 may relate to the industrial activities.

3.2.3. Potential Ecological Risk Index (RI)

The RI values of HMs in the sediments from each sampling site in the LTR are shown in Figure 5. The RI values of all 20 sampling sites were less than 150, with an average value of 84.89, indicating that the potential ecological risk posed by the HMs in the sediments in the upper reaches of the LTR is low. Among them, the RI values of the HMs in the sediments from sampling sites S2, S9, and S15 were 2.44, 1.96, and 1.93, respectively, which were relatively high and implied that the potential ecological risk levels of these sites were of a close to moderate risk. This is consistent with the evaluations based on the high PLI values at these three sites mentioned in Section 3.2.2. This means that the HM elements in the sediments of these three sites pose a potential threat to the ecology of the three sites and the nearby areas, which needs more attention in future studies and water environment management.

3.3. Potential Sources of HMs

To fully evaluate the HM pollution of the sediments in the upper reaches of the LTR, PCC of the six kinds of HMs in the sediments was conducted, which helped analyze the main source of HM pollution in the sediment [43,47]. As can be seen in Table 3, there were strong significant correlations between Cr and Cu, As, and Zn (p < 0.01), with correlation coefficients of 0.971 (Cr and Cu), 0.698 (Cr and As), and 0.731 (Cr and Zn). This means that these four HMs may share more of the same sources or be affected by common factors [48,49]. The finding of some correlations between Pb and Cr, Cu, and As indicates that there may be some similar sources or some common influential factors between Pb, Cr, Cu, and As. The correlation between Cd and other HMs was relatively weak, which suggests that the sources of Cd in the sediments may be different from the sources of other HMs.
PCA was utilized to further analyze the sources of HMs in sediments. Through Kaiser–Meyer–Olkin and Bartlett’s sphericity test in the SPSS 19.0 software, the results showed that the standardized HM data were suitable for PCA. The PCA results are shown in Table 4 and Figure 6a. The PCA reduced the sediment HM data set to three main components, explaining 90.84% of the total variance. The first component, mainly containing Cr, Cu, As, and Zn, explained 69.14% of the total variance. The second component included only Pb, explaining 13.07% of the total variance, and the third component included Cd, explaining 8.63% of the total variance.
In recent years, CA has been increasingly applied to identify the potential sources of HMs in sediment and/or soil [50,51,52,53,54]. The CA results for HMs in the sediment indicated that the six HMs could be briefly divided into two categories (the red one and the blue one in Figure 6b). The first category (the red one in Figure 6b) is composed of Cr, Cu, As, and Zn, where the distance between Cr and Cu is closer, and the distance between As and Zn is slightly further, which is consistent with the results of the PCC and PCA. The second category (the blue one in Figure 6b) contains Pb and Cd, and the distance between the two elements is obviously longer (Figure 6b). Within the Jiulongpo District, the upper reaches of the LTR mainly flows through three towns: Baima Town, Baishiyi Town, and Hangu Town. For years, these three towns mainly relied on agriculture. With the accelerating urbanization in recent years, the three towns have introduced a large number of industrial enterprises, mainly including machinery manufacturing, iron and steel smelting, electronic information technology, textiles and clothing, chemical and raw material production, building materials, and food processing. Therefore, agricultural non-point source pollution, residential/industrial point source pollution, and natural soil erosion are the main sources of HMs in river sediments.
As mentioned before, the PCC results showed that the concentrations of Cu and Cr had a high positive correlation (correlation coefficient: 0.971), which means that the trends of these two heavy metals in the sample are consistent. This may indicate that these two heavy metals have the same sources or some common sources. Similarly, the PCA results showed that both Cu and Cr had higher loadings in PCA1, which means that they may be influenced by the same or some common factors. The CA results showed that the distance between Cu and Cr was the shortest, which indicated that they may have similar characteristics. Therefore, combined with the results of the PCC, PCA, and CA of HMs in the sediments, it was speculated that Cu and Cr in the sediments from the LTR may have the same or some common source, which may be industrial wastewaters and/or utilizations of fertilizers and pesticides [46]. Furthermore, according to the comparisons of the Cu and Cr concentrations in the sediments from each sampling site with the reference environmental background value, the Cu and Cr pollution in the sediments from sites S2 and S9 is more serious. According to the field investigation, the common source may be the dust and wastewater containing Cu and Cr produced by the surrounding machinery manufacturing and iron and steel smelting enterprises [55]. In addition, when using pesticides and fertilizers, it is possible to discharge wastewater containing Cu and Cr into the environment [20,56]. Cu in the sediments from sites S1, S13, S14, S15, and S17 was also significantly higher than the environmental background value, and its main source was also related to the surrounding human industrial and agricultural production activities [46]. The Cu and Cr contents in the sediments from other sites were not significantly higher than the reference environmental BGVs and might be mainly derived from natural soil erosion.
As and Zn in the sediments of the LTR were far apart in the CA, and both were positively affected by PC 1 and highly correlated. These results indicate that As and Zn in the sediments have partially the same or similar sources. Considering that the contents of As and Zn in most sampling sites did not exceed the reference environmental BGVs, the main source of As and Zn in the sediments at these sites may be natural soil erosion. As and Zn in the sampling points that exceed the reference environmental BGVs may mainly originate from surrounding agricultural production, industrial production, and domestic sewage. In agriculture, the utilization of fertilizers and the livestock and poultry waste containing As and Zn [57,58], in addition to the utilization of pesticides containing As and Zn [20], can lead to the discharge of As and Zn into the soil and water, and eventually into river sediments. In terms of industrial production, electronic products processing and manufacturing, metal smelting, and chemical production processes all produce and discharge wastewater containing As and Zn. According to the field investigation, there are several electronic product manufacturing factories and metal smelting plants along the midstream and downstream of the LTR, which may explain the sources of As and Zn in the sediments from the industrial production perspective. In terms of domestic sewage, because As and Zn have certain applications in many cosmetics, skin care products, and detergents, domestic sewage may also contain small amounts of As and Zn. The discharge of this domestic sewage into the river without treatment or without proper treatment will result in the accumulation of As and Zn in the sediment.
Pb and Cd were far apart in the CA, had no significant correlation in PCC, and were influenced by different PCs in the PCA. These results suggest that the main sources of Pb and Cd in the sediments of the LTR may be different. The Pb contents in the sediments at sampling sites S2, S6, S9, S14, S15, and S19 were 1.77, 1.21, 1.87, 1.17, 4.73, and 1.40 times the environmental BGVs, respectively, making them significantly higher than the BGVs and indicating that the Pb in these sampling sites may be affected by human activities. Studies have shown that Pb is mainly emitted into the water and soil as a result of human activities such as the consumption of fossil fuels [39,59]. Fertilizers may also contain Pb [60]. The Pb in other sampling sites is mainly related to natural processes, such as soil erosion. Therefore, the main source of Pb in the sediments from the LTR may be a mixture of human activities and natural processes.
The Cd contents in the 20 sampling sites of the LTR were all higher than the reference environmental background value. Except for the sediments from sites S3, S5, S11, and S12, the Cd contents in other sediments were more than 1.5 times the reference environmental background value. It can be speculated that the Cd in the sediments of the LTR is significantly influenced by human activities. Research has shown that Cd is widely used in alloy, chemical, pharmaceutical, electroplating, chemical fertilizer, and nickel–chromium battery manufacturing, as well as other industrial fields [61,62,63]. According to the field investigation, there are several pharmaceutical manufacturing factories, chemical reagent manufacturing plants, and electroplating plants along the LTR. Therefore, it is concluded that Cd in the sediments of the LTR may mainly originate from the production activities of surrounding chemical enterprises and the application of chemical fertilizer in farmland.

4. Conclusions

In this work, the contents of six HMs (Cr, Cu, As, Pb, Cd, and Zn) in the sediments of the LTR within Jiulongpo District were monitored, and the HM pollution and potential ecological risks were assessed. Among the six types of HMs, only Cd was detected at a polluted level in the sediments from the LTR, while the other HM contents were at an unpolluted level. From the perspective of the overall pollution of the six HMs, except for the serious HM pollution in sampling sites S2, S9, and S15, the overall HM pollution in the sediment of the LTR within Jiulongpo District was in an unpolluted state, but it was close to moderately contaminated. The potential environmental risk of HMs in the sediments was at a low risk level, but some points were close to the medium risk level, which needs further attention. Cr, Cu, As, and Zn in the sediments may mainly originate from natural processes such as soil erosion; Pb mainly comes from human industrial and agricultural production activities. In addition to natural processes such as soil erosion, the main source of Cd may be the production activities of surrounding chemical enterprises and the use of chemical fertilizers in farmland. Overall, HM pollution in the sediments of the LTR within Jiulongpo District has a low potential risk. In the future, attention should be paid to the management of the HM Cd in the sediments of the LTR, and the supervision and management of pollution sources in agricultural and industrial activities should be strengthened.

Supplementary Materials

The following supporting information can be downloaded at: https://www.mdpi.com/article/10.3390/su152316228/s1, Table S1: Locations of the sampling sites, and Calibration method for heavy metal determination using ICP-MS.

Author Contributions

Conceptualization, T.-F.M., J.W. and L.F.; methodology, Y.-C.Y.; software, T.-T.C.; validation, W.-L.L. and Y.Y.; investigation, T.-F.M., J.W. and J.P.; resources, L.F.; writing—original draft preparation, T.-F.M.; writing—review and editing, T.-F.M., J.P. and L.F.; visualization, Y.-C.Y.; supervision, L.F.; project administration, L.F. All authors have read and agreed to the published version of the manuscript.

Funding

This work is funded by Chongqing Science and Technology Plan Project (cstc2018jszx-zdyfxmX0020).

Institutional Review Board Statement

Not applicable.

Informed Consent Statement

Not applicable.

Data Availability Statement

The data presented in this study are available on request from the corresponding author.

Conflicts of Interest

The authors declare no conflict of interest.

References

  1. Islam, M.S.; Ahmed, M.K.; Raknuzzaman, M.; Habibullah-Al-Mamun, M.; Islam, M.K. Heavy metal pollution in surface water and sediment: A preliminary assessment of an urban river in a developing country. Ecol. Indic. 2015, 48, 282–291. [Google Scholar] [CrossRef]
  2. Kong, M.; Zhu, Y.Z.; Han, T.L.; Zhang, S.; Li, J.L.; Xu, X.T.; Chao, J.Y.; Zhang, Y.M.; Gao, Y.X. Interactions of heavy metal elements across sediment-water interface in Lake Jiaogang. Environ. Pollut. 2021, 286, 117578. [Google Scholar] [CrossRef] [PubMed]
  3. Sekhar, K.C.; Chary, N.S.; Kamala, C.T.; Raj, D.S.S.; Rao, A.S. Fractionation studies and bioaccumulation of sediment-bound heavy metals in Kolleru lake by edible fish. Environ. Int. 2004, 29, 1001–1008. [Google Scholar] [CrossRef]
  4. Zhang, H.; Jiang, Y.; Ding, M.; Xie, Z. Level, source identification, and risk analysis of heavy metal in surface sediments from river-lake ecosystems in the Poyang Lake, China. Environ. Sci. Pollut. Res. 2017, 24, 21902–21916. [Google Scholar] [CrossRef]
  5. Zhu, Y.J.; Lu, X.W.; Yang, L.N.; Wang, L.J. Accumulation and source of heavy metals in sediment of a reservoir near an industrial park of northwest China. Front. Earth Sci. 2016, 10, 707–716. [Google Scholar] [CrossRef]
  6. Herath, I.K.; Wu, S.; Ma, M.; Ping, H. Heavy metal toxicity, ecological risk assessment, and pollution sources in a hydropower reservoir. Environ. Sci. Pollut. Res. 2022, 29, 32929–32946. [Google Scholar] [CrossRef]
  7. Zeng, J.; Han, G.; Hu, M.; Wang, Y.; Liu, J.; Zhang, S.; Wang, D. Geochemistry of Dissolved Heavy Metals in Upper Reaches of the Three Gorges Reservoir of Yangtze River Watershed during the Flood Season. Water 2021, 13, 2078. [Google Scholar] [CrossRef]
  8. Tang, W.; Shan, B.; Zhang, H.; Zhu, X.; Li, S. Heavy metal speciation, risk, and bioavailability in the sediments of rivers with different pollution sources and intensity. Environ. Sci. Pollut. Res. 2016, 23, 23630–23637. [Google Scholar] [CrossRef]
  9. Zhang, G.; Bai, J.; Xiao, R.; Zhao, Q.; Jia, J.; Cui, B.; Liu, X. Heavy metal fractions and ecological risk assessment in sediments from urban, rural and reclamation-affected rivers of the Pearl River Estuary, China. Chemosphere 2017, 184, 278–288. [Google Scholar] [CrossRef]
  10. Chongqing Jiulongpo District Statistical Bureau. 2019 Statistical Communique on National Economic and Social Development of Jiulongpo District; Jiulongpo District Government, Chongqing: Chongqing, China, 2020. [Google Scholar]
  11. Rafique, M.; Hajra, S.; Tahir, M.B.; Gillani, S.S.A.; Irshad, M. A review on sources of heavy metals, their toxicity and removal technique using physico-chemical processes from wastewater. Environ. Sci. Pollut. Res. 2022, 29, 16772–16781. [Google Scholar] [CrossRef]
  12. Sathinathan, P.; Parab, H.M.; Yusoff, R.; Ibrahim, S.; Vello, V.; Ngoh, G.C. Photobioreactor design and parameters essential for algal cultivation using industrial wastewater: A review. Renew. Sustain. Energy Rev. 2023, 173, 113096. [Google Scholar] [CrossRef]
  13. Yongo, E.; Jin, F.; Mutethya, E.; Wu, D.; Zhang, P.; Guo, Z. Sediment Heavy Metal Pollution Assessment in Changwang and Wuyuan Rivers in Hainan Island, China. Water 2023, 15, 1580. [Google Scholar] [CrossRef]
  14. Xu, J.Y.; Chen, Y.W.; Zheng, L.L.; Liu, B.H.; Liu, J.F.; Wang, X.L. Assessment of Heavy Metal Pollution in the Sediment of the Main Tributaries of Dongting Lake, China. Water 2018, 10, 60. [Google Scholar] [CrossRef]
  15. Ang, S.Y.; Goh, H.W.; Mohd Fazli, B.; Haris, H.; Azizan, N.A.; Zakaria, N.A.; Johar, Z. Heavy Metals Removal from Domestic Sewage in Batch Mesocosm Constructed Wetlands using Tropical Wetland Plants. Water 2023, 15, 797. [Google Scholar] [CrossRef]
  16. Rule, K.L.; Comber, S.D.W.; Ross, D.; Thornton, A.; Makropoulos, C.K.; Rautiu, R. Diffuse sources of heavy metals entering an urban wastewater catchment. Chemosphere 2006, 63, 64–72. [Google Scholar] [CrossRef] [PubMed]
  17. Drozdova, J.; Raclavska, H.; Raclavsky, K.; Skrobankova, H. Heavy metals in domestic wastewater with respect to urban population in Ostrava, Czech Republic. Water Environ. J. 2019, 33, 77–85. [Google Scholar] [CrossRef]
  18. Gong, D.C.; Gao, X.; Ntakirutimana, T.; Guo, J.S.; Li, K. Water Quality Status along the Liangtan River and Control Planning Alternatives for Pollution Reduction. Pol. J. Environ. Stud. 2013, 22, 1061–1067. [Google Scholar]
  19. Rostami, S.; Kamani, H.; Shahsavani, S.; Hoseini, M. Environmental monitoring and ecological risk assessment of heavy metals in farmland soils Ecological risk assessment of heavy metals in Kamfiruz district. Hum. Ecol. Risk Assess. 2021, 27, 392–404. [Google Scholar] [CrossRef]
  20. Belon, E.; Boisson, M.; Deportes, I.Z.; Eglin, T.K.; Feix, I.; Bispo, A.O.; Galsomies, L.; Leblond, S.; Guellier, C.R. An inventory of trace elements inputs to French agricultural soils. Sci. Total Environ. 2012, 439, 87–95. [Google Scholar] [CrossRef] [PubMed]
  21. Abdelaal, A.; Abdelkader, A.I.; Alshehri, F.; Elatiar, A.; Almadani, S.A. Assessment and Spatiotemporal Variability of Heavy Metals Pollution in Water and Sediments of a Coastal Landscape at the Nile Delta. Water 2022, 14, 3981. [Google Scholar] [CrossRef]
  22. Huang, L.; Fang, H.W.; Ni, K.; Yang, W.J.; Zhao, W.H.; He, G.J.; Han, Y.; Li, X.C. Distribution and Potential Risk of Heavy Metals in Sediments of the Three Gorges Reservoir: The Relationship to Environmental Variables. Water 2018, 10, 1840. [Google Scholar] [CrossRef]
  23. Li, J.L.; Zuo, Q.T.; Feng, F.; Jia, H.T. Occurrence and Ecological Risk Assessment of Heavy Metals from Wuliangsuhai Lake, Yellow River Basin, China. Water 2022, 14, 1264. [Google Scholar] [CrossRef]
  24. Kong, P.R.; Cheng, X.; Sun, R.H.; Chen, L.D. The Synergic Characteristics of Surface Water Pollution and Sediment Pollution with Heavy Metals in the Haihe River Basin, Northern China. Water 2018, 10, 73. [Google Scholar] [CrossRef]
  25. Gao, J.M.; Sun, X.Q.; Jiang, W.C.; Wei, Y.M.; Guo, J.S.; Liu, Y.Y.; Zhang, K. Heavy metals in sediments, soils, and aquatic plants from a secondary anabranch of the three gorges reservoir region, China. Environ. Sci. Pollut. Res. 2016, 23, 10415–10425. [Google Scholar] [CrossRef]
  26. Wang, Q.W.; Huang, X.L.; Zhang, Y.N. Heavy Metals and Their Ecological Risk Assessment in Surface Sediments of the Changjiang River Estuary and Contiguous East China Sea. Sustainability 2023, 15, 4323. [Google Scholar] [CrossRef]
  27. Yozukmaz, A.; Yabanli, M. Heavy Metal Contamination and Potential Ecological Risk Assessment in Sediments of Lake Bafa (Turkey). Sustainability 2023, 15, 9969. [Google Scholar] [CrossRef]
  28. Corrêa, J.J.M.; Cutrim, M.V.J.; da Cruz, Q.S. Evaluation of metal contamination in surface sediments and macroalgae in mangrove and port complex ecosystems on the Brazilian equatorial margin. Environ. Monit. Assess. 2023, 195, 432. [Google Scholar] [CrossRef]
  29. Varol, M. Assessment of heavy metal contamination in sediments of the Tigris River (Turkey) using pollution indices and multivariate statistical techniques. J. Hazard. Mater. 2011, 195, 355–364. [Google Scholar] [CrossRef] [PubMed]
  30. Hakanson, L. An ecological risk index for aquatic pollution control.a sedimentological approach. Water Res. 1980, 14, 975–1001. [Google Scholar] [CrossRef]
  31. Chen, G.-W. A Study on Migration and Enrichment of Heavy Metals in Soil and Their Ecological Effects in Chongqing Metropolitan Area. Ph.D. Thesis, Chengdu University of Technology, Chengdu, China, 2008. [Google Scholar]
  32. Strady, E.; Dinh, Q.T.; Némery, J.; Nguyen, T.N.; Guédron, S.; Nguyen, N.S.; Denis, H.; Nguyen, P.D. Spatial variation and risk assessment of trace metals in water and sediment of the Mekong Delta. Chemosphere 2017, 179, 367–378. [Google Scholar] [CrossRef] [PubMed]
  33. Austria, E.S.; Fuentes, E.M.; Lamorena, R.B. Metal and metalloid speciation and pollution assessment across a small-scale mining creek system tributary. Environ. Earth Sci. 2023, 82, 217. [Google Scholar] [CrossRef]
  34. Huang, C.C.; Cai, L.M.; Xu, Y.H.; Jie, L.; Hu, G.C.; Chen, L.G.; Wang, H.Z.; Xu, X.B.; Mei, J.X. A comprehensive approach to quantify the source identification and human health risk assessment of toxic elements in park dust. Environ. Geochem. Health 2023, 6, 5813–5827. [Google Scholar] [CrossRef] [PubMed]
  35. Ismail, M.M.; El Zokm, G.M. Evaluation of the response of phytoplankton communities to heavy metal stresses using multi-statistical approaches, Alexandria coast, Egypt. Int. J. Environ. Sci. Technol. 2023, 4, 13595–13608. [Google Scholar] [CrossRef]
  36. Meng, Y.; Li, P.; Xiao, L.; Wang, R.; Yang, S.; Han, J.; Hu, B. Heavy Metal Content and Pollution Assessment in Typical Check Dam Sediment in a Watershed of Loess Plateau, China. Sustainability 2022, 14, 8597. [Google Scholar] [CrossRef]
  37. Tomlinson, D.L.; Wilson, J.G.; Harris, C.R.; Jeffrey, D.W. Problems in the assessment of heavy-metal levels in estuaries and the formation of a pollution index. Helgoländer Meeresuntersuchungen. 1980, 33, 566–575. [Google Scholar] [CrossRef]
  38. Huang, C.-C.; Cai, L.-M.; Xu, Y.-H.; Jie, L.; Chen, L.-G.; Hu, G.-C.; Jiang, H.-H.; Xu, X.-B.; Mei, J.-X. A comprehensive exploration on the health risk quantification assessment of soil potentially toxic elements from different sources around large-scale smelting area. Environ. Monit. Assess. 2022, 194, 206. [Google Scholar] [CrossRef] [PubMed]
  39. Zhang, Z.; Lu, Y.; Li, H.; Tu, Y.; Liu, B.; Yang, Z. Assessment of heavy metal contamination, distribution and source identification in the sediments from the Zijiang River, China. Sci. Total Environ. 2018, 645, 235–243. [Google Scholar] [CrossRef]
  40. Xiao, H.; Shahab, A.; Xi, B.; Chang, Q.; You, S.; Li, J.; Sun, X.; Huang, H.; Li, X. Heavy metal pollution, ecological risk, spatial distribution, and source identification in sediments of the Lijiang River, China. Environ. Pollut. 2021, 269, 116189. [Google Scholar] [CrossRef]
  41. Xiao, R.; Bai, J.; Huang, L.; Zhang, H.; Cui, B.; Liu, X. Distribution and pollution, toxicity and risk assessment of heavy metals in sediments from urban and rural rivers of the Pearl River delta in southern China. Ecotoxicology 2013, 22, 1564–1575. [Google Scholar] [CrossRef] [PubMed]
  42. Bing, H.; Zhou, J.; Wu, Y.; Wang, X.; Sun, H.; Li, R. Current state, sources, and potential risk of heavy metals in sediments of Three Gorges Reservoir, China. Environ. Pollut. 2016, 214, 485–496. [Google Scholar] [CrossRef]
  43. Xiao, X.; Tong, Y.; Wang, D.; Gong, Y.; Zhou, Z.; Liu, Y.; Huang, H.; Zhang, B.; Li, H.; You, J. Spatial distribution of benthic toxicity and sediment-bound metals and arsenic in Guangzhou urban waterways: Influence of land use. J. Hazard. Mater. 2022, 439, 129634. [Google Scholar] [CrossRef]
  44. Fang, Z.-Q.; Wang, Y.-M.; Wang, X.; Xie, D.-T.; Wang, D.-Y. Spatial Distribution and Risk Assessment of Heavy Metals in Sediments of the Ruxi Tributary of the Three Gorges Reservoir. Environ. Sci. 2020, 41, 1338–1345. [Google Scholar] [CrossRef]
  45. Zhao, X.; Li, T.-Y.; Zhang, T.-T.; Luo, W.-J.; Li, J.-Y. Distribution and health risk assessment of dissolved heavy metals in the Three Gorges Reservoir, China (section in the main urban area of Chongqing). Environ. Sci. Pollut. Res. 2017, 24, 2697–2710. [Google Scholar] [CrossRef] [PubMed]
  46. Liang, A.; Wang, Y.; Guo, H.; Bo, L.; Zhang, S.; Bai, Y. Assessment of pollution and identification of sources of heavy metals in the sediments of Changshou Lake in a branch of the Three Gorges Reservoir. Environ. Sci. Pollut. Res. 2015, 22, 16067–16076. [Google Scholar] [CrossRef] [PubMed]
  47. Tang, H.J.; Ke, Z.X.; Yan, M.T.; Wang, W.J.; Nie, H.Y.; Li, B.X.; Zhang, J.P.; Xu, X.R.; Wang, J. Concentrations, Distribution, and Ecological Risk Assessment of Heavy Metals in Daya Bay, China. Water 2018, 10, 780. [Google Scholar] [CrossRef]
  48. Wang, J.K.; Gao, B.; Yin, S.H.; Liu, L.S.; Xu, D.Y.; Li, Y.Y. Comprehensive Evaluation and Source Apportionment of Potential Toxic Elements in Soils and Sediments of Guishui River, Beijing. Water 2019, 11, 1847. [Google Scholar] [CrossRef]
  49. Ma, L.; Yang, Z.; Li, L.; Wang, L. Source identification and risk assessment of heavy metal contaminations in urban soils of Changsha, a mine-impacted city in Southern China. Environ. Sci. Pollut. Res. 2016, 23, 17058–17066. [Google Scholar] [CrossRef] [PubMed]
  50. Huang, X.Y.; Yu, H.M.; Zhao, X.M.; Guo, X.; Ye, Y.C.; Xu, Z. Spatial Variation in Cadmium and Mercury and Factors Influencing Their Potential Ecological Risks in Farmland Soil in Poyang Lake Plain, China. Front. Env. Sci. 2021, 9, 1497. [Google Scholar] [CrossRef]
  51. Bux, R.K.; Batool, M.; Shah, S.M.; Solangi, A.R.; Shaikh, A.A.; Haider, S.I.; Shah, Z.U. Mapping the Spatial distribution of Soil heavy metals pollution by Principal Component Analysis and Cluster Analyses. Water Air Soil. Poll. 2023, 234, 330. [Google Scholar] [CrossRef]
  52. Liu, J.J.; Wang, P.F.; Wang, C.; Qian, J.; Hou, J. Heavy metal pollution status and ecological risks of sediments under the influence of water transfers in Taihu Lake, China. Environ. Sci. Pollut. Res. 2017, 24, 2653–2666. [Google Scholar] [CrossRef] [PubMed]
  53. Wang, F.; Ren, X.M.; Qiu, Y.; Cheng, J.D.; Chen, Y.; Wang, L.L.; Zhang, L.M.; Zhao, S.S.; Wang, X.P.; Sun, C. Characterization and Risk Assessment of Heavy Metals in River Sediments on the Western Bank of Taihu Lake, China. Bull. Environ. Contam. Tox. 2022, 109, 609–615. [Google Scholar] [CrossRef] [PubMed]
  54. Zhang, Z.X.; Zhang, N.; Li, H.P.; Lu, Y.; Wang, Q.; Yang, Z.G. Risk assessment, spatial distribution, and source identification of heavy metal(loid)s in paddy soils along the Zijiang River basin, in Hunan Province, China. J. Soil. Sediment. 2019, 19, 4042–4051. [Google Scholar] [CrossRef]
  55. Liu, C.; Lan, Q.; Yan, B.; Wang, J.; Wang, H.; Wu, Y.; Fu, C.; Zhong, Y.; Li, C.; Li, S. Spatio-temporal variation and hazard assessment of potentially toxic metal element contamination in sediments and water before and after a water-level fluctuation cycle in the Three Gorges Reservoir, Wanzhou, China. Environ. Monit. Assess. 2023, 195, 920. [Google Scholar] [CrossRef]
  56. Addo-Bediako, A.; Matlou, K.; Makushu, E. Heavy metal concentrations in water and sediment of the Steelpoort River, Olifants River System, South Africa. Afr. J. Aquat. Sci. 2018, 43, 413–416. [Google Scholar] [CrossRef]
  57. Cang, L.; Wang, Y.J.; Zhou, D.M.; Dong, Y.H. Heavy metals pollution in poultry and livestock feeds and manures under intensive farming in Jiangsu Province, China. J. Environ. Sci. 2004, 16, 371–374. [Google Scholar]
  58. Lambert, R.; Grant, C.; Sauve, S. Cadmium and zinc in soil solution extracts following the application of phosphate fertilizers. Sci. Total Environ. 2007, 378, 293–305. [Google Scholar] [CrossRef] [PubMed]
  59. Yang, H.J.; Kang, T.W.; Choi, B.; Hwang, S.H.; Shin, D.; Park, W.P. Potential Sources of Heavy Metals in Sediments of an Urban-Agricultural Watershed and Relationship with Land Use Using a Statistical Approach. Sustainability 2022, 14, 9444. [Google Scholar] [CrossRef]
  60. Micó, C.; Recatalá, L.; Peris, M.; Sánchez, J. Assessing heavy metal sources in agricultural soils of an European Mediterranean area by multivariate analysis. Chemosphere 2006, 65, 863–872. [Google Scholar] [CrossRef] [PubMed]
  61. Niu, Y.; Jiang, X.; Wang, K.; Xia, J.; Jiao, W.; Niu, Y.; Yu, H. Meta analysis of heavy metal pollution and sources in surface sediments of Lake Taihu, China. Sci. Total Environ. 2020, 700, 134509. [Google Scholar] [CrossRef]
  62. Martinková, E.; Chrastný, V.; Francová, M.; Šípková, A.; Čuřík, J.; Myška, O.; Mižič, L. Cadmium isotope fractionation of materials derived from various industrial processes. J. Hazard. Mater. 2016, 302, 114–119. [Google Scholar] [CrossRef]
  63. Verplanck, P.L.; Frederic, R. Siegel: Environmental Geochemistry of Potentially Toxic Metals. Miner. Depos. 2003, 38, 258. [Google Scholar] [CrossRef]
Figure 1. Sampling sites in the upper reaches of the LTR in the Jiulongpo District.
Sustainability 15 16228 g001
Figure 2. Concentrations of Cr (A), Cu (B), As (C), Pb (D), Cd (E), and Zn (F) in the sediments from sampling sites of LTR.
Sustainability 15 16228 g002
Figure 3. Igeo values of various HMs in the LTR sediments.
Sustainability 15 16228 g003
Figure 4. HM PLI values in the upper reaches of the LTR.
Sustainability 15 16228 g004
Figure 5. Potential ecological RI of HMs in the sediments in the upper reaches of the LTR.
Sustainability 15 16228 g005
Figure 6. Results of PCA (a) and CA (b) of HMs in sediments.
Sustainability 15 16228 g006
Table 1. HM pollution levels corresponding to different Igeo values.
IgeoPollution Level
<0Unpolluted
[0, 1)Unpolluted to moderately polluted
[1, 2)Moderately polluted
[2, 3)Moderately to strongly polluted
[3, 4)Strongly polluted
[4, 5)Strongly to extremely polluted
≥5Extremely polluted
Table 2. Potential ecological risk criteria for HM pollution.
RI ValueClassLevel of Comprehensive
Potential Ecological Risk
RI < 1501Low risk
150 ≤ RI < 3002Moderate risk
300 ≤ RI < 6003Considerable risk
RI ≥ 6004Very high risk
Table 3. PCC results of HMs in the sediments in the upper reaches of the LTR.
CrCuAsPbCdZn
Cr--
Cu0.971 **--
As0.698 **0.674 **--
Pb0.595 **0.582 **0.565 **--
Cd0.485 *0.4310.3520.33--
Zn0.731 **0.804 **0.711 **0.340.318--
Note: ** means p < 0.01, * means p < 0.05.
Table 4. PCA results of HMs in the sediments in the upper reaches of the LTR.
VarianceComponent Loadings
PCA1PCA2PCA3
Cr0.45709−0.15745−0.22311
Cu0.45633−0.25551−0.26212
As0.420750.041030.36629
Pb0.347980.57482−0.60231
Cd0.353240.532650.59785
Zn0.39992−0.542310.16476
Eigenvalue4.148580.784080.51786
Percentage of Variance (%)69.1430413.067938.63102
Cumulative (%)69.1430482.2109790.84199
Disclaimer/Publisher’s Note: The statements, opinions and data contained in all publications are solely those of the individual author(s) and contributor(s) and not of MDPI and/or the editor(s). MDPI and/or the editor(s) disclaim responsibility for any injury to people or property resulting from any ideas, methods, instructions or products referred to in the content.

