Article

Dam Sustainability’s Interdependency with Climate Change and Dam Failure Drivers

1
Department of Land, Water and Environment, The University of Jordan, Amman 11942, Jordan
2
Department of Civil Engineering, The University of Jordan, Amman 11942, Jordan
3
Department of Geology, The University of Jordan, Amman 11942, Jordan
4
United Nation Development Programme, Amman 11194, Jordan
*
Author to whom correspondence should be addressed.
Sustainability 2023, 15(23), 16239; https://doi.org/10.3390/su152316239
Submission received: 26 October 2023 / Revised: 14 November 2023 / Accepted: 20 November 2023 / Published: 23 November 2023
(This article belongs to the Special Issue Environmental Sustainability in Natural and Engineering Systems)

Abstract

:
The complex interplay between the drivers of dam failure and climate change factors constitutes a central focus of this study. Variations in temperature and precipitation patterns have profound effects on dam storage volume, quality, and structural stability. This research serves two purposes. First, it employs the Wroclaw Taxonomic Method (WTM) to construct a comprehensive indicator called the Index of Sustainable Dams (ISD). The King Talal Dam (KTD) was chosen as a case study using data spanning from 2011 to 2022, encompassing 14 variables. Second, the Granger Causality Test (GCT) is applied to examine the causal connections between the ISD, climate change, and dam failure. The research provides an in-depth evaluation of the KTD in terms of the ISD and its three critical dimensions: environmental, economic, and social. It also reveals substantial bidirectional causality relationships between the ISD, climate change (as measured by mean maximum and minimum temperature and mean annual precipitation), and dam failure (as measured by dam age, sediment yield, and storage). The analysis confirms a strong interdependence among the drivers of climate change, dam failure, and dam sustainability. Moreover, combining the WTM and the GCT is efficient for assessing the sustainability of various dam types.

1. Introduction

1.1. Background

Research in the field of sustainability has increased significantly in recent years, driven by the increasing influence of climate change. Sustainability is often defined as development that meets the needs of the present generation without compromising the ability of future generations to meet their requirements [1]. Sustainability advocates for the preservation of the environment by promoting responsible resource management, as well as reducing pollution and mitigating climate change impacts. Also, sustainability extends into social equity by attempting to eliminate disparities and provide equal opportunities for everyone. In addition, it supports economic stability through job creation and the development of cleaner industries. It strengthens well-being by improving public health and promoting resilient communities [2]. In the realm of water resources, responsible management is essential. Proper water resource management involves not only the efficient distribution of clean, safe, and hygienic water but also the effective treatment of water and wastewater to mitigate pollution [3].
Dams provide several benefits to humans, including storing water for agriculture and urban use, mitigating floods, and generating hydroelectric power. Achieving dam sustainability is complicated since it extends beyond technical matters. It involves a balance of ecological, socioeconomic, and policy factors. Furthermore, it requires the development of a long-term management strategy while minimizing harm to ecosystems and upholding various roles in hydrology, the environment, society, and policy frameworks [4]. Climate change poses unprecedented challenges to dams because their failure can result in catastrophic economic and social consequences. Risk is often estimated by considering the potential scenarios, their probabilities, and the associated consequences. Risk analysis techniques have evolved to provide a holistic perspective on dam safety. Nevertheless, most of the assessments have not considered the dynamic nature of climate change [5].

1.2. Literature Review

1.2.1. Water Resources Sustainability

Within the realm of sustainable development, performance metrics predominantly take the form of sustainability indicators and indices (SIIs). SIIs have assumed a progressively significant role in both the scientific study and practical application of sustainability. The creation of indicators for estimating sustainable development started after the United Nations Conference on Environment and Development in Rio de Janeiro in 1992. During this conference, the development of sustainability indicators was mandated. In 2002, the commitment was reaffirmed at the World Summit on Sustainable Development in Johannesburg. Since then, many groups, including organizations, governments, non-profits, communities, businesses, and researchers, have worked hard to create and use sustainability indicators. Presently, there are hundreds of these indicators and measures being used worldwide [6]. Sustainability indicators are derived from real measurements or observations of socioeconomic and environmental data. Sustainability includes economic, social, and environmental aspects, each consisting of various components. This broad diversity results in a wide range of indicators that differ in scope, purpose, and scale. Nevertheless, using too many indicators can cause confusion. As a result, they are often merged through mathematical manipulations to generate indices.
Sustainability is necessary for water resources management in Jordan since the water shortage has become an increasingly serious concern, impeding the economic growth of many countries in the region [7]. Water resources are scarce and the country’s population continues to grow. This has led to a significant environmental challenge. This rapid population increase, coupled with the large number of incoming refugees, has resulted in an imbalance between the population and the available water resources. To support the population sustainably, Jordan’s water resources have been limited. Jordan’s struggle with water scarcity has been further compounded because it shares the majority of its surface water resources with neighboring countries. This control over water resources by its neighbors has restricted Jordan’s access to its fair allocation of water [8].
In studying the pressing issue of water scarcity in Jordan, it is crucial to establish a standardized method for evaluating the sustainability of dams. For instance, some studies have used computational hydrology techniques, such as numerical modeling and data analysis, to estimate the sustainability index of dams [9]. Other studies have used multicriteria decision analysis or life cycle assessment to evaluate the sustainability of dams [10,11,12]. Several case studies on dams and reservoirs have explored various aspects of their sustainability. The lack of a universally agreed-upon framework for assessing dam sustainability presents a significant obstacle to effectively managing these vital infrastructures. Current methodologies often depend on subjective or qualitative evaluations, which naturally hinder objective comparisons between different dams and the identification of pathways for enhancement.

1.2.2. Estimation and Testing Sustainability Index

In 1951, the Wroclaw Graduate School of Economics formulated the Wroclaw Taxonomic Method, also known as the dendric method. This method relies on the measurement of the distance from a theoretical unit representing the optimal performance across all considered indicators [13]. The Wroclaw Taxonomic Method (WTM) was applied by Senetra and Szarek-Iwaniuk [14] to identify and analyze problem areas in the regions of Warmia and Mazury in Poland, revealing the variations in socioeconomic and demographic parameters. The taxonomic analyses were utilized by Klóska et al. [15] to rank the provinces of Poland in terms of regional development. They indicated a clear stabilization of high-ranked positions and potential increasing disparities between the most and least developed regions. Regarding causality testing, the Granger Causality Test was introduced by Clive Granger in 1969. It served as a statistical hypothesis test aimed at addressing whether one given time series had the predictive capacity for another. The test explored the potential causal relationship between two variables by examining whether the past values of one variable contained information relevant to predicting the future values of another [16]. The GCT serves as a valuable tool for discerning causal relationships among key factors [17]. This test is popular in several fields, including economics and climate change studies [18]. For instance, the GCT was employed by Dörgő et al. [19] to measure the interconnectedness among the United Nations sustainability goals, identifying causal relationships represented in a network of sustainability indicators. In addition, the GCT was used by Bildirici et al. [20] to investigate the impact of industry on environmental sustainability in Turkey. The WTM was combined with the GCT by Agovino et al. [21] to assess the agricultural sustainability in euro countries related to climate change. In this study, the combination was used to estimate and test the composite indicator of dam sustainability. It is worth mentioning that no such work has been previously conducted on dams.

1.2.3. Sub-Indicators of Sustainability Pillars

The environmental, social, and economic pillars of water resources sustainability are described by sub-indicators related to water quality, seismic status, irrigation uses, renewable energy, population growth, and employment. The water quality of a dam’s effluent plays a crucial role in ensuring its environmental sustainability. It was assessed using various parameters, including physicochemical properties, such as pH and Total Dissolved Solids (TDS), and biological properties, such as Biological Oxygen Demand (BOD). The pH levels are crucial because they influence the overall health of aquatic ecosystems. Many aquatic organisms have specific pH requirements and significant deviations from their preferred pH range can harm them. Dams can influence the pH of downstream water due to factors such as sedimentation and water temperature [22]. By safely releasing treated wastewater, dams protect the aquatic environment from the harmful contaminants and pollutants contained in untreated wastewater. This protective measure ensures the water quality and well-being of the downstream ecosystem. Moreover, the controlled release of treated wastewater can have a positive impact on the ecosystem by providing essential nutrients, such as nitrogen and phosphorus [23].
Jordan’s tectonic location is within the boundaries of the northwestern part of the Arabian Plate. The Dead Sea Transform Fault (DSTF) represents the boundary between the Arabian and African Plates. In Jordan, the DSTF consists of two faults: the Jordan Valley Fault on the western side, which extends from the southern corner of the Dead Sea to Lake Tiberias, and the Wadi Araba Fault on the eastern side, which extends from the south of the Dead Sea to the Gulf of Aqaba [24]. Over the last century of monitoring seismic recordings along the DSTF, most of the recorded earthquakes were relatively weak [25]. In the modern era, the most powerful earthquakes were recorded far south of the Dead Sea, for example, those in the Gulf of Aqaba, in 1995, with a Moment Magnitude (Mw) of 7.3 Hz. In 1927, an earthquake was recorded with a Local Magnitude (ML) of 6.2 Hz, with the epicenter near Jericho. Dozens of earthquakes have been recorded along the DSTF with MLs less than 6 Hz during the last three centuries, according to records [26]. Seismic risk in Jordan is associated with the potential for larger, more destructive earthquakes. Jordan’s infrastructure, including dams and buildings, is vulnerable to seismic events and the country’s rapidly growing population adds to this risk. Jordan has established seismic monitoring networks and institutions, such as the Jordan Seismological Observatory, to track and analyze seismic activity. These efforts are crucial for early warnings and preparedness [27,28].
Sustainability management considers the well-being of these communities and addresses their evolving needs. As the population grows, there is an increased demand for infrastructure and services, including housing, schools, healthcare, and transportation. Sustainable management involves providing essential services to enhance the residents’ quality of life [29]. Moreover, well-planned and accessible road networks contribute to social inclusion by ensuring that all community members have equal access to services and opportunities. Sustainable management prioritizes the development of road infrastructure that serves the diverse needs of the population, fostering social equity and inclusivity [30]. Additionally, sustainability management strives to optimize water resource use. The efficient allocation of stored water for irrigation minimizes waste and maximizes its economic value. This practice benefits the agricultural sector. Efficient irrigation practices reduce the operational costs for farmers [31,32]. Finally, hydroelectric power is a renewable energy source. Improving the efficiency of the power plant enhances its contribution to the local energy grid and reduces its dependence on non-renewable energy sources. This can lead to long-term economic savings and increased energy security. The operation and maintenance of hydroelectric power plants create job opportunities and support local economic growth. A more efficient plant can lead to increased investment in the energy sector, thereby contributing to job creation and overall economic development. The revenue generated by hydroelectric power plants diversifies the local economy. Sustainable dam management encourages the efficient use of this revenue to support local businesses, infrastructure development, and community projects [33].

1.3. Research Importance and Contribution

The research gap becomes evident when observing the scarcity of studies investigating the interplay between dam sustainability, climate change, and dam failure drivers. This scarcity is underscored by the limited number of studies on the sustainability of dams, particularly in Jordan. The novelty of this study lies in the exploration of how social, economic, and environmental factors impact dam sustainability, adding valuable insights to this field. The research problem was framed by the urgent need to assess the sustainability of the King Talal Dam (KTD) in relation to climate change and the potential failure to develop emergency strategies. The findings of the KTD failure analysis conducted by Al-Omari [34] revealed that the maximum peak flow for failure will exceed 30,000 m3/s, leading to significant loss of life and property in downstream areas, such as Tawal Shamali, Debab, Sawalhah, and Abu Ezzighan. This study was created to contribute, firstly, by providing a comprehensive explanation of the interdependency between climate change and dam failure drivers. Secondly, it introduces a quantitative model for assessing dam sustainability, bridging a significant gap in the existing literature. The importance of this study extends beyond Jordan, addressing the broader challenge of sustainable dam management in the face of climate change.

2. Methodology

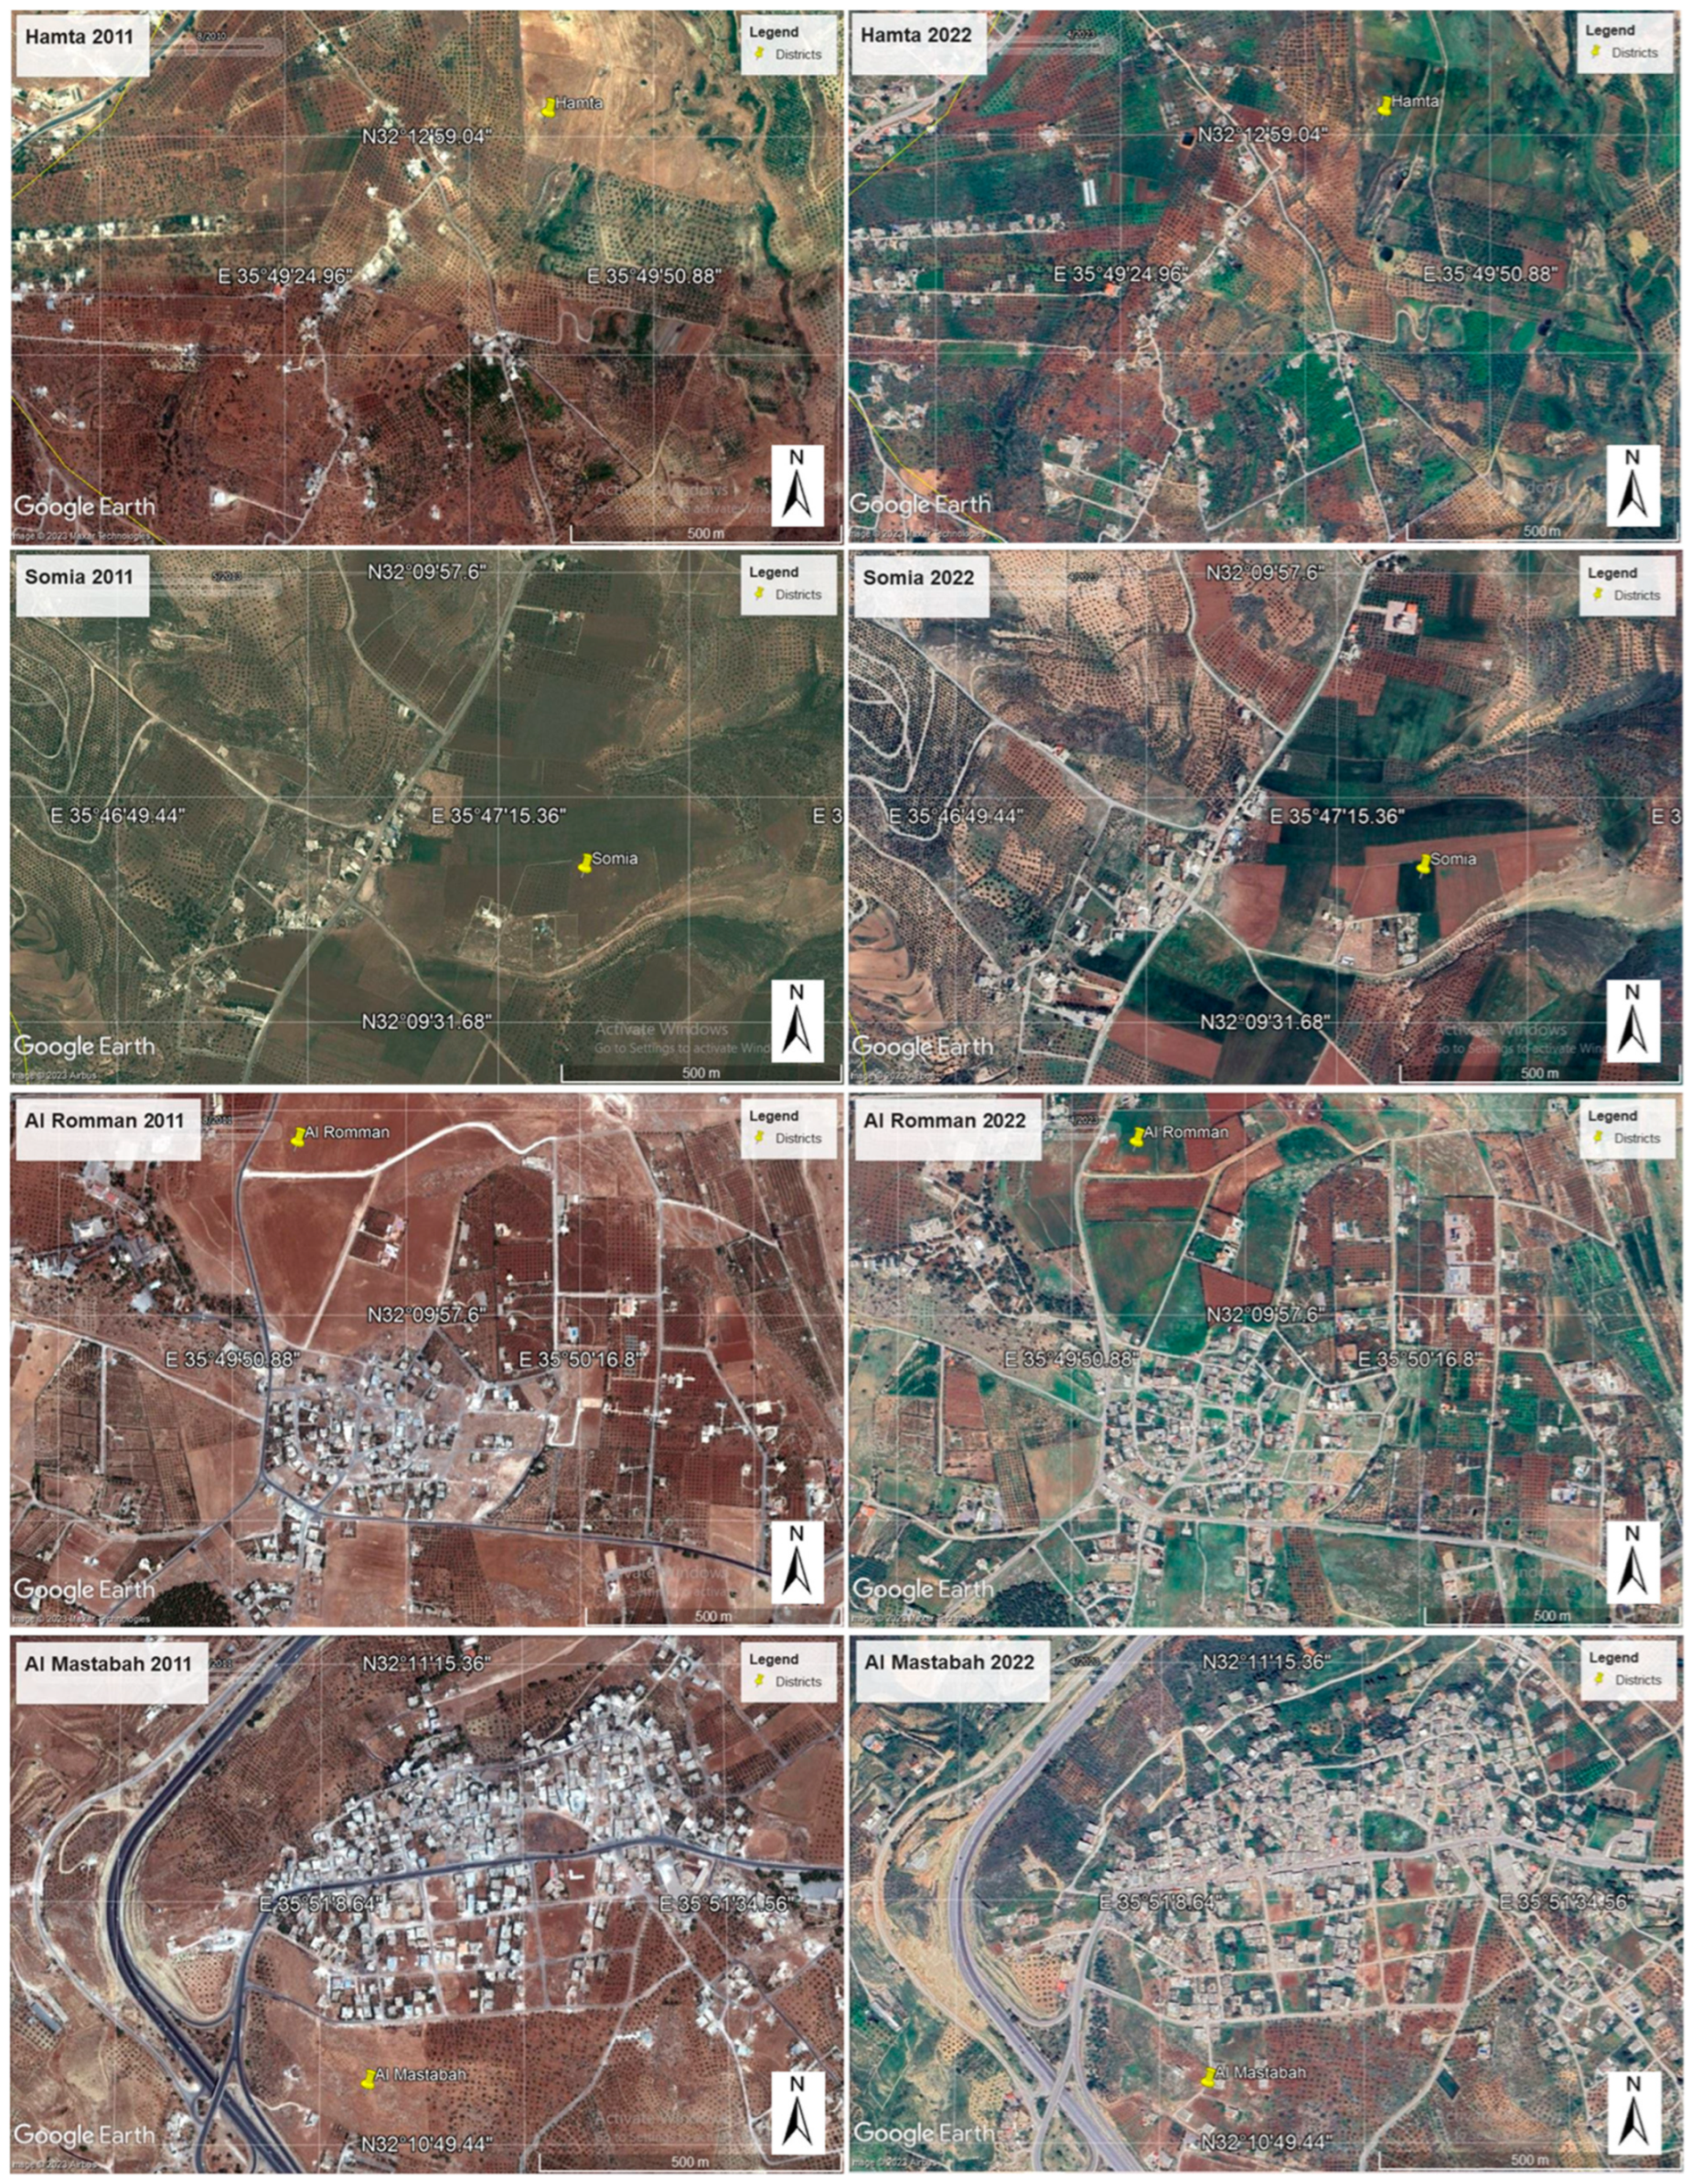
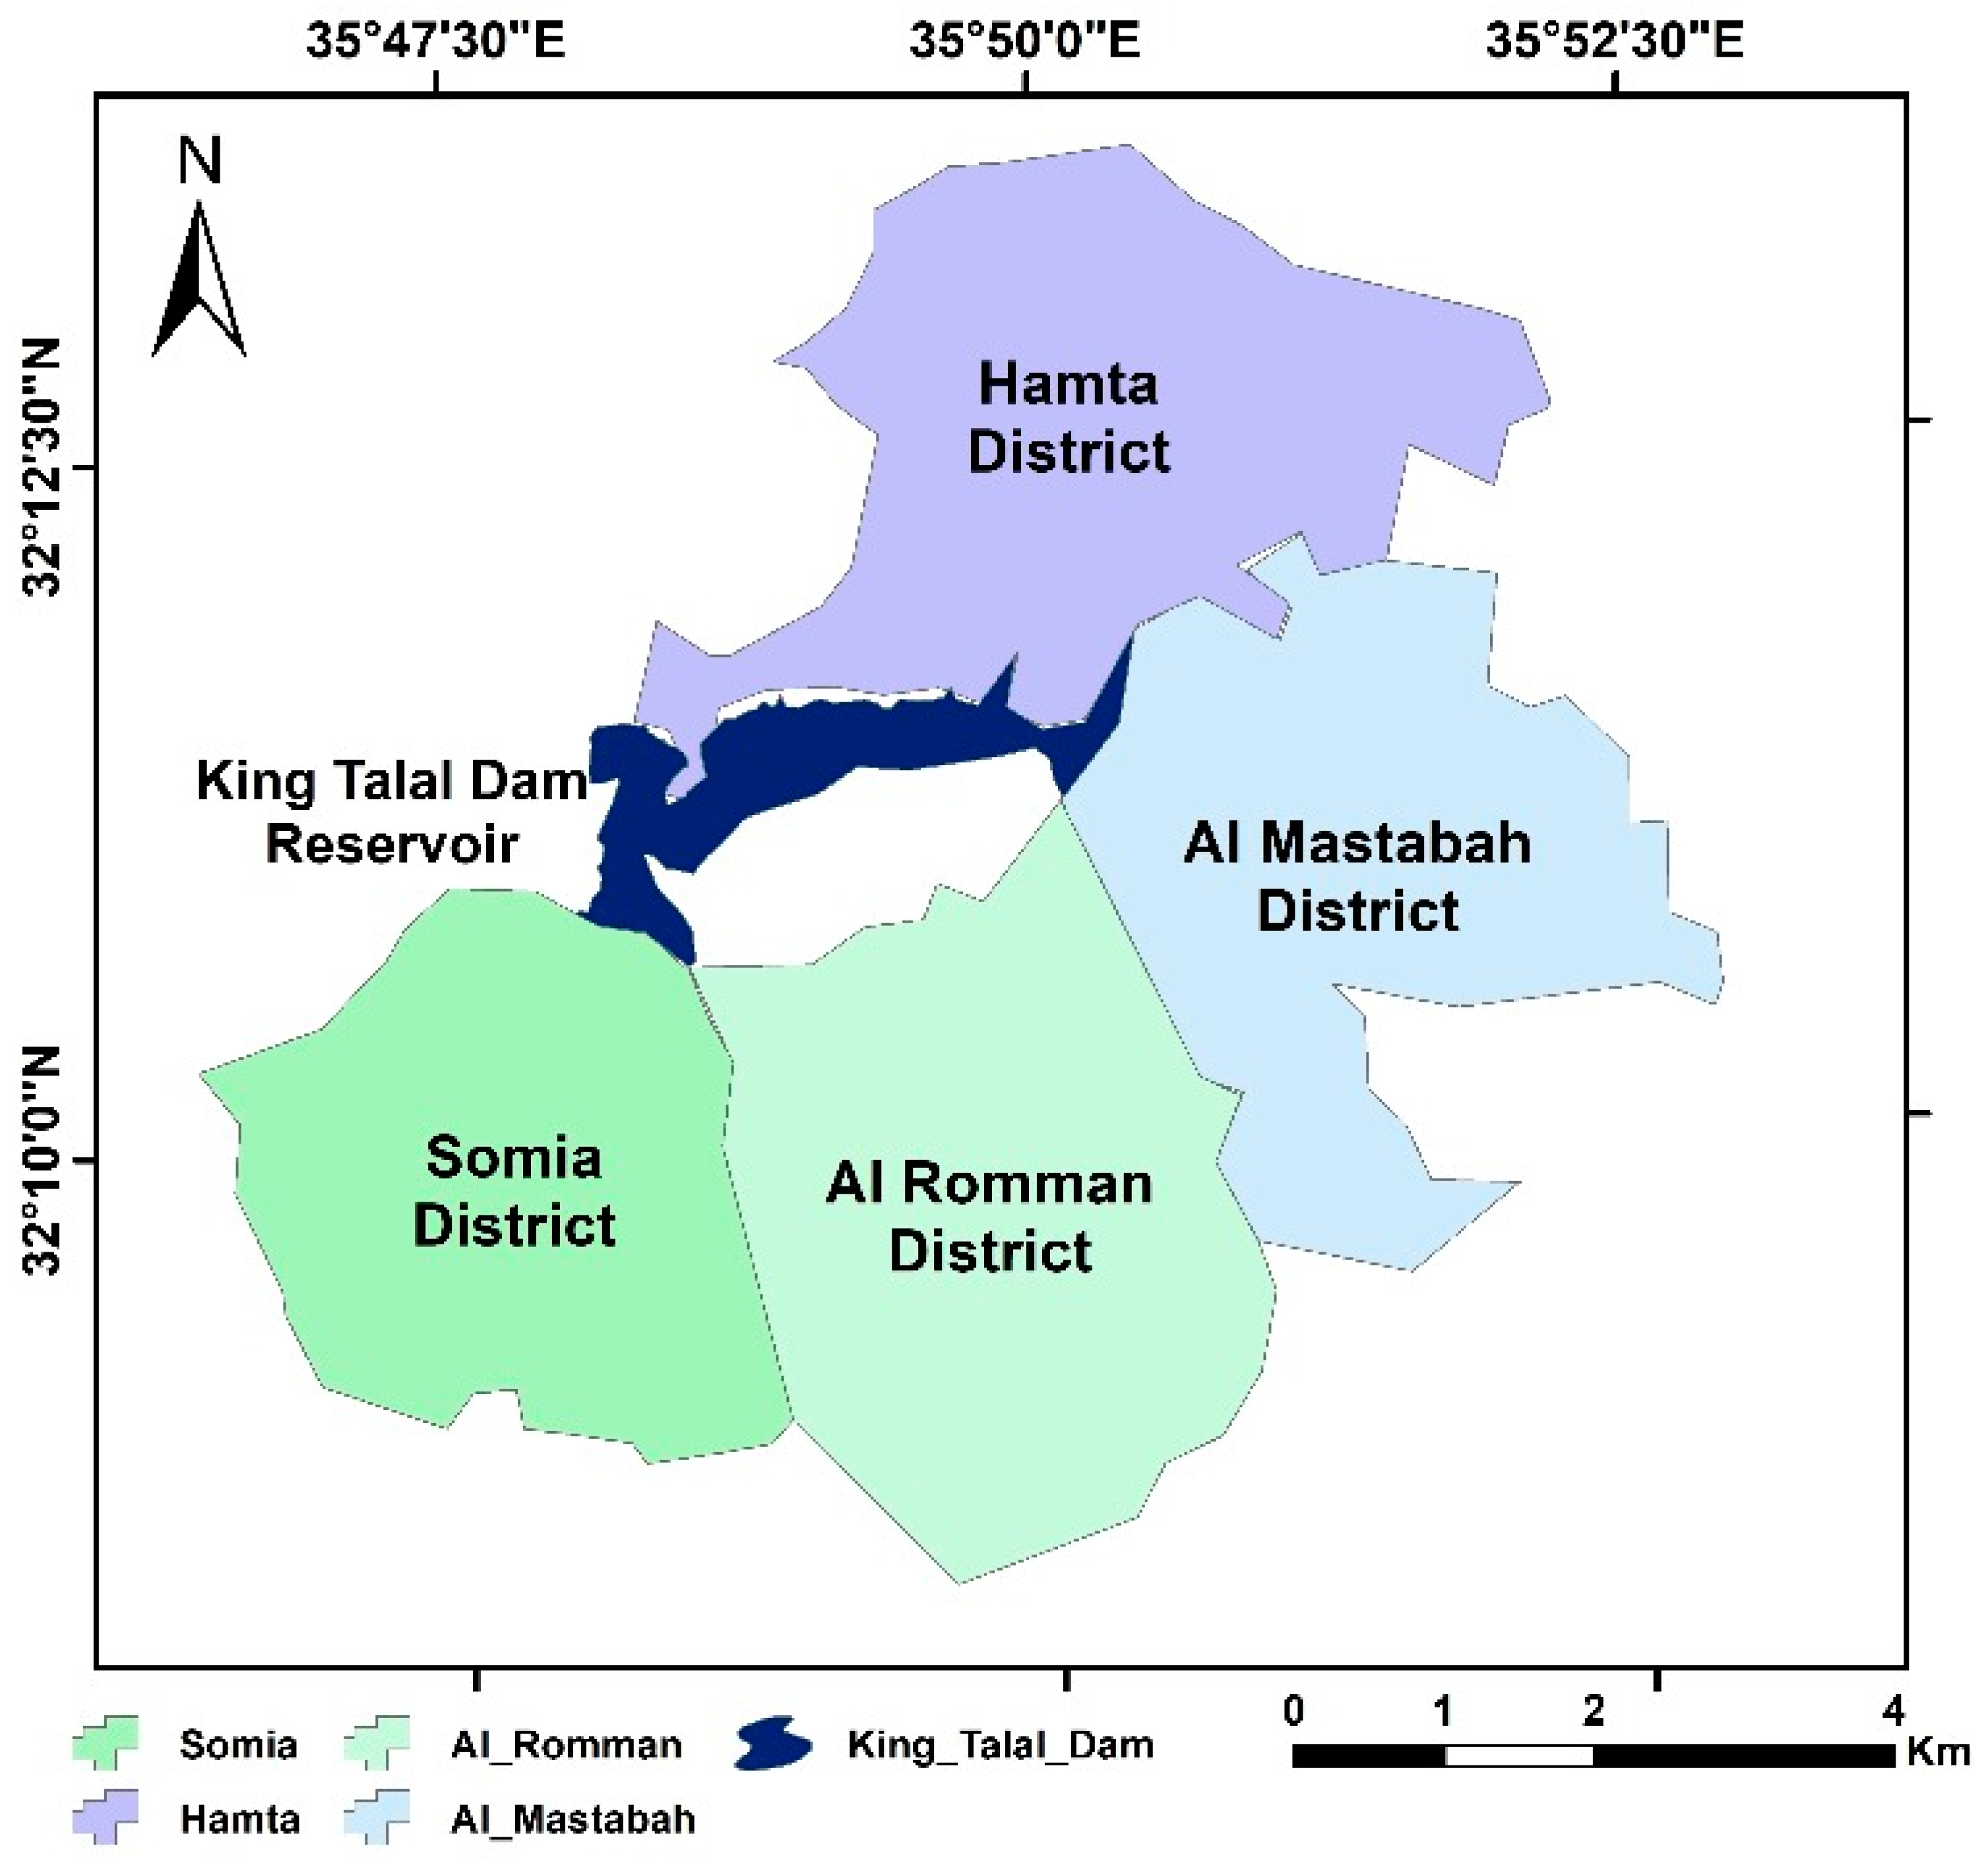
2.1. Study Site Description

The KTD, which is located at Jerash, is a non-homogeneous earthfill dam with a length and height of 350 and 108 m, respectively. It was built in 1978 with a crest width of 11.5 m. In addition, the spillway has a design flow of 4500 m3/s. The reservoir has a capacity of 83 MCM (8 MCM is dead storage) and a watershed area of 4300 km2 [34].

2.2. Wroclaw Taxonomic Method (WTM)

The sustainability index for the KTD was calculated based on data collected from the indicators. This involved using the Wroclaw Taxonomic Method (WTM) to combine the data on the indicators and assign weights based on their relative importance. Several methods have been suggested for aggregating pillars into a composite index [35,36]. The WTM was used in this study. This method was first designed in the early 1950s by Polish mathematicians from the Wroclaw Graduate School of Economics [13]. The resulting composite indicator was based on the sum of the Euclidean distances that separated the dam (unit) from an “ideal dam”, normalized by a measure of the variability of these distances. Thus, the KTD’s performance could be ordered in proportion to the distance from the optimum situation. A composite indicator for each pillar was constructed by applying Wroclaw taxonomy to the variables belonging to that pillar. An overall indicator was later computed by applying the same methodology to the three pillars. For the mathematical formulation, let xjt be the value of the jth indicator (for j ∈ {1, …, n}) at time t ∈ {1, …, N}. In addition, the generic 2-dimensional matrix is denoted by XR j,t representing the distribution of the indicators for the KTD over time. For a fixed year t, the normalized matrix is calculated and denoted as Z ( + z j t for that positively corrected with the indicator and z j t for that negatively corrected with the indicator):
z j t = ± x j t x ¯ j t σ j t
where x ¯ jt and σjt are the mean and the standard deviation of the j th indicator, such that x ¯ j t = 1 N t = 1 N x j t and σ j t = 1 N t = 1 N x j t x ¯ j t 2 . Thus, for all the indicators in each year, the maximum value m j t is computed as a benchmark for the indicator. Then, for each year, the Euclidean distance (et) between all the normalized values and such maximum reads is calculated as:
e t = j = 1 n z j t m j t 2
Thus, with the mean and the standard deviation denoted by e t ¯ = 1 N t = 1 N e t and σ e t ¯ = 1 N t = 1 N e t e t ¯ 2 , respectively, the Wroclaw index at time t is calculated as:
W t = e t e ¯ t 2 σ e t ¯
The index takes a value of 0 if the distance between the KTD and the reference is zero, i.e., if the dam reaches the maximum value in all pillars; whereas, the index increases when the dam is far from the reference. However, this definition of Wt seems counterintuitive because as the index increased, in far-from-optimal situations, the KTD showed better performances. Thus, the complement to the maximum achieved in each year of the indicator is computed as follows:
I S D t = max W t W t

2.3. Granger Causality Test (GCT)

The sustainability indices of the KTD were compared to identify trends and patterns and to identify opportunities for improvement. This involved using the Granger Causality Test (GCT), which determines the causal relationship between the ISD and climate change and dam failure drivers, not the magnitude of the impact [17,37].
Dam failure drivers consisted of the hydrological and hydraulic parameters affected by the age of the dam (DA years), annual sediment yield (ASY tons/ha), and annual dam storage (ADS MCM). In the literature, the sediment yields for most dams in Jordan were estimated [38,39,40,41]. The sediment yield for the KTD estimated by Shaheen [42] was used in this study. However, the sediment yield data for the KTD were verified using the storage curve method [43]. Climate change drivers were the mean maximum temperature (MXT °C), mean minimum temperature (MNT °C), and mean annual precipitation (MAP mm). These drivers were calculated based on data collected from the Ministry of Water and Irrigation in Jordan [44].
In particular, the Granger Causality Test verifies the power of one variable to predict another one [45,46], i.e., to check whether y is Granger-caused by x. In other words, y is regressed on its own lagged values and those of x and it tests whether the set of coefficients associated with x is statistically different from zero [47]. The proposed procedure to test the causality relationship in a panel dataset was suggested by Holtz-Eakin et al. [48]. The Granger Causality Test for panel data is expressed using the following general formula:
y i t = α 0 + j = 1 n α j y i j t + j = 1 n δ j x i j t + f i + u i t
where i = 1, …, m are the observation units and t = 1, …, N represent the time index. The model in differences below allows us to eliminate the fixed effects (fi):
y i t y i 1 t = α 0 + j = 1 n α j y i j t y i j 1 t + j = 1 n δ j x i j t x i j 1 t + u i t u i j 1 t
This specification introduces a simultaneity bias because the error term is correlated with y i t y i 1 t . In this case, it is possible to produce a consistent estimate by applying the Two-Stage Least Squares (2SLS) regression analysis. To verify whether x causes y, it is necessary to test the joint hypothesis H0: δ1 = δ2 = … = δn = 0. If the null hypothesis is rejected, then x Granger causes y. The Granger Causality Test was performed using RStudio (2023.09.0 Build 463 © 2009-2023 Posit Software 4.3.1, PBC).

2.4. Selection and Classification of Indicators

Data from 2011 to 2022 were used to construct the ISD. In particular, the dataset consisted of 14 variables belonging to three pillars: environmental (En), economic (Ec), and social (So). However, four of these variables could be classified as socioeconomic pillars (So-Ec).

2.4.1. Environmental Pillar Accounts for Six Variables

The pH values of dam effluents averaged 8 over the last 12 years. The high TDS levels in dam effluents can be harmful to the environment. Excessive TDS can lead to increased water salinity, which affects aquatic life and agricultural productivity. Managing TDS and BOD is essential for maintaining the water quality and healthy aquatic ecosystem in the downstream ecosystem [22,23]. The TDS values ranged from 1373.8 mg/L in 2011, which was the maximum over the last 12 years, to 1031.3 mg/L in 2022. High BOD levels indicated the presence of organic pollutants that can deplete the dissolved oxygen levels in water. Low oxygen levels can harm aquatic life and lead to “dead zones”. The average BOD over the last 12 years was approximately 6 mg/L. Therefore, the water quality was described by the first three indicators: “Average pH of the dam’s effluent”, “Average TDS of the dam’s effluent”, and “Average BOD of the dam’s effluent” throughout 2011–2022.
The fourth indicator was “Total discharged treated wastewater into the dam”. The total discharge of treated wastewater into dams is a vital aspect of sustainable dam management, particularly concerning its environmental pillar. Four wastewater treatment plants (WWTPs) discharge directly into the KTD (MWI, 2023): Al-Baq’ah WWTP, Khurbeh Al-Samra Mechanical WWTP, Al-Ma’rad WWTP, and Jerash WWTP (Figure 1).
The fifth variable was “Average seismic event magnitude affecting the dam”. The average magnitude of the seismic events affecting dams is a pivotal consideration in the environmental dimension of sustainable dam management. Between 2017 and 2022, approximately 13 earthquakes with an average depth of 6.8 km were recorded approximately 30 km away from the KTD, located at the Jordan Valley and Dead Sea fault zones (Figure 1). Evaluating the seismic hazard in the region is essential for gauging the vulnerability of the dam to earthquakes, which, if not addressed, could pose a severe threat to the integrity of the dam and the environment downstream. The average magnitude of seismic events affecting the KTD has reached 2.4 Hz. Sustainable dam management encompasses structural measures and engineering solutions to fortify a dam’s resilience against seismic forces. This enhances the dam’s ability to withstand earthquakes, thus safeguarding the environment and surrounding ecosystem. Moreover, mitigating the environmental risks associated with potential seismic activity is integral to sustainable dam operation. This reduces the likelihood of dam failure and the resulting ecological and infrastructural consequences [25,27].
The last environmental indicator was “Annual spillway events (days)”. Spillway events are directly related to flood control and safety. These events occur when the dam reaches its full capacity and requires the release of excess water to prevent overtopping. By effectively managing these spillway events, the dam ensures that downstream areas, ecosystems, and communities are protected from the potentially devastating impacts of flooding and dam failure. In the context of the KTD, the number of spillway events was a key parameter for ensuring that the dam’s operation aligned with sustainability goals. The variation in spillway events between years, such as the increase from 7 days in 2019 to 12 days in 2020, possibly reflects changes in precipitation patterns, climate conditions, and water demand. Sustainable dam management accounts for these variations and employs adaptive strategies to balance the dam’s role in water resource management with its environmental responsibility [50].

2.4.2. Social Pillar Accounts for Two Variables

The first social variable was “Population increment rate”. The population increment rate in districts near the KTD was approximately 2.4% [51]. This was a significant factor in the social pillar of sustainable dam management. These districts were the Hamta, Al Mastabah, Al Romman, and Somia districts (Figure 2). Population growth reflected the growth of local communities.
The second social indicator that measured accessibility and mobility was “Intersection density in the area adjacent to the dam”. Intersection density is the ratio of the total number of intersections to the total area adjacent to the KTD. It was a significant component of the social pillar of sustainable dam management. Figure A1 shows how roads and intersections increased over the period of 2011–2022. The intersection density increased from 4.1 intersections/km2 in 2011 to 5.4 intersections/km2 in 2022. This measurement reflected the density and connectivity of road networks within these districts and had several social implications for local communities. A well-connected road network enhances the ease of travel; reduces commuting times; and facilitates access to essential services, employment opportunities, and educational institutions [30].

2.4.3. Economic Pillar Accounts for Two Variables

The first economic variable was “Average daily irrigation use relative to the daily storage”. Daily irrigation uses from the KTD played a crucial role in the economic pillar of sustainable dam management. The maximum ratio occurred in 2022 (1.2%); whereas, the minimum was in 2013 (0.66%). However, it was maintained at approximately 1% over the period of 2011–2022 [44]. This economic dimension encompasses various aspects that were directly influenced by the relationship between irrigation needs and dam storage. A sustainable balance between daily irrigation uses and dam storage was essential for the agricultural sector, which relied heavily on this water source. Efficient irrigation practices ensured that farmers could maintain consistent crop yields, leading to economic stability and livelihoods that depend on agriculture [31,32].
The second economic variable was “KTD Hydroelectric Power Plant Efficiency”. The efficiency of the KTD hydropower plants was a crucial component of the economic pillar of sustainable dam management. The consistent evaluation and optimization of power plant efficiency were essential for economic sustainability and growth. The efficiency figures, with an average of 30% during 2011–2022 and a peak of 40% in 2015 [44], hold significant implications for the economic dimension. The efficiency of a hydroelectric power plant directly affects the amount of electricity generated. A higher efficiency, as witnessed in 2015, resulted in increased power output and revenue for dam operators. Sustainable dam management seeks to maintain or improve efficiency to maximize economic benefits. This leads to cost reductions in the long term, enhancing the economic viability of the dam and contributing to the local economy.

2.4.4. Socioeconomic Pillar Accounts for Four Variables

Working and unemployment issues were related to both social and economic pillars [51]; therefore, four indicators were considered socioeconomic indicators: “Jordanian workers in the agricultural sector aged 15 years and over relative to the number of citizens in the area adjacent to the dam”, “Jordanian female workers in the agricultural sector aged 15 years and over relative to the number of workers in the area adjacent to the dam”, “Unemployed Jordanians aged 15 years and over relative to the number of citizens in the area adjacent to the dam” and “Unemployed Jordanian women aged 15 years and over relative to the number of unemployed people in the area adjacent to the dam”. Jordanian workers in the agricultural sector increased from 3.2% in 2011 to 5.1% in 2022. The same trend was observed in the percentage of female workers in the agricultural sector, ranging from 0.6% to 1%. Unemployment percentages decreased in areas close to the KTD.
The selected indicators used for the ISD construction and causality tests are listed in Table 1.

3. Results and Discussions

3.1. Sustainability Index of the KTD

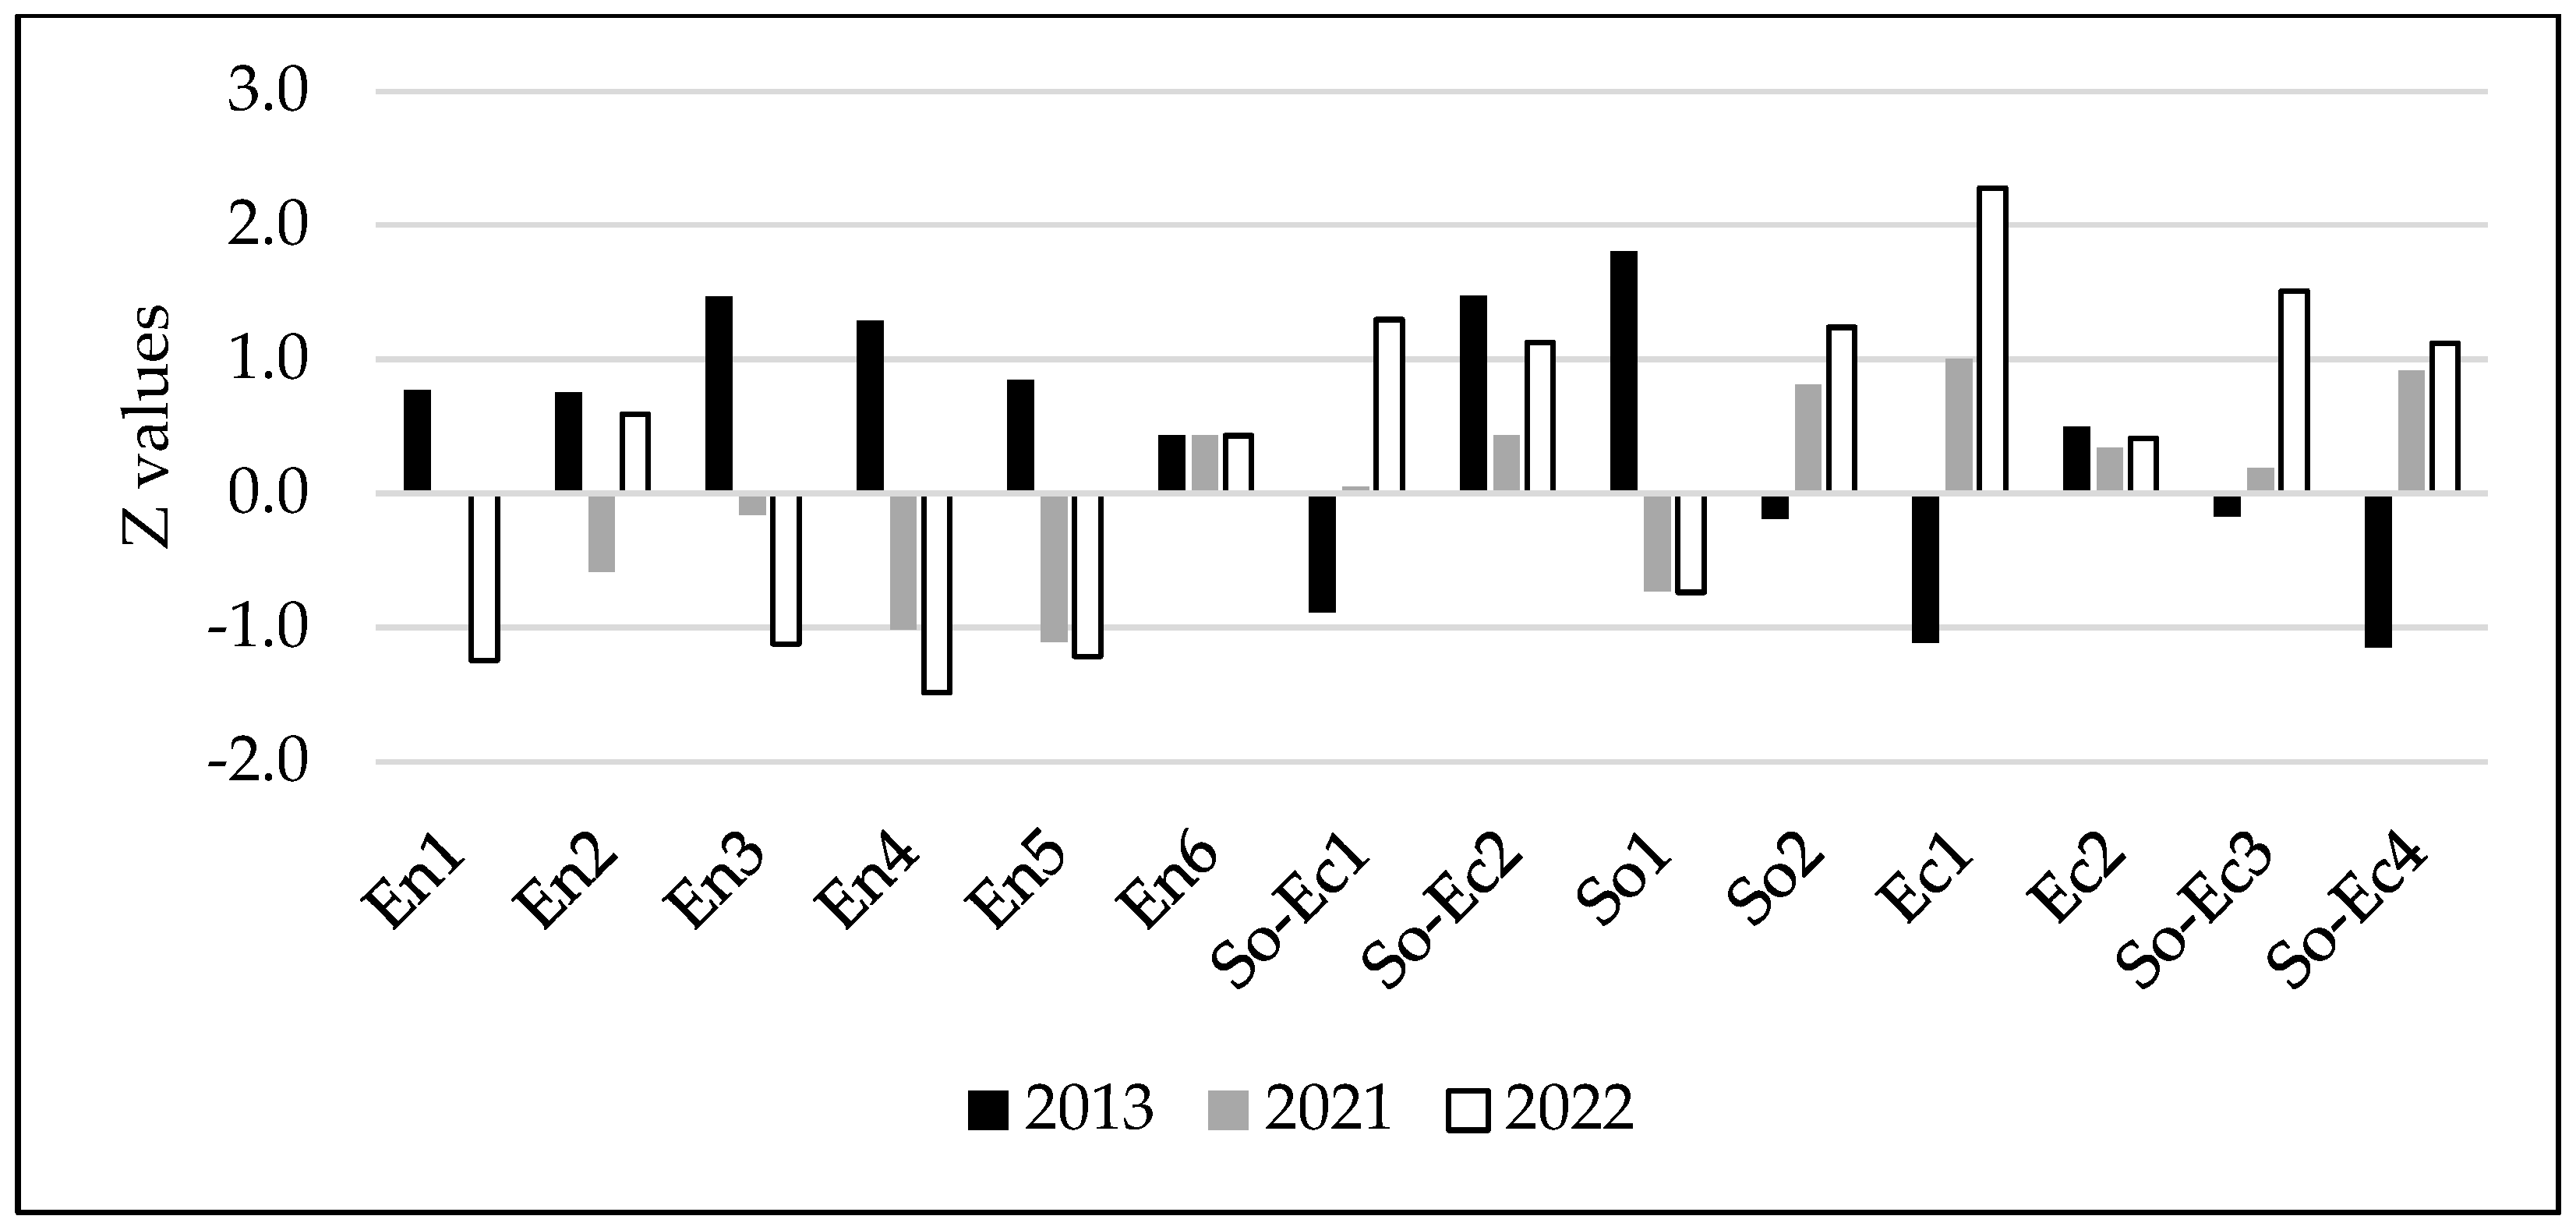
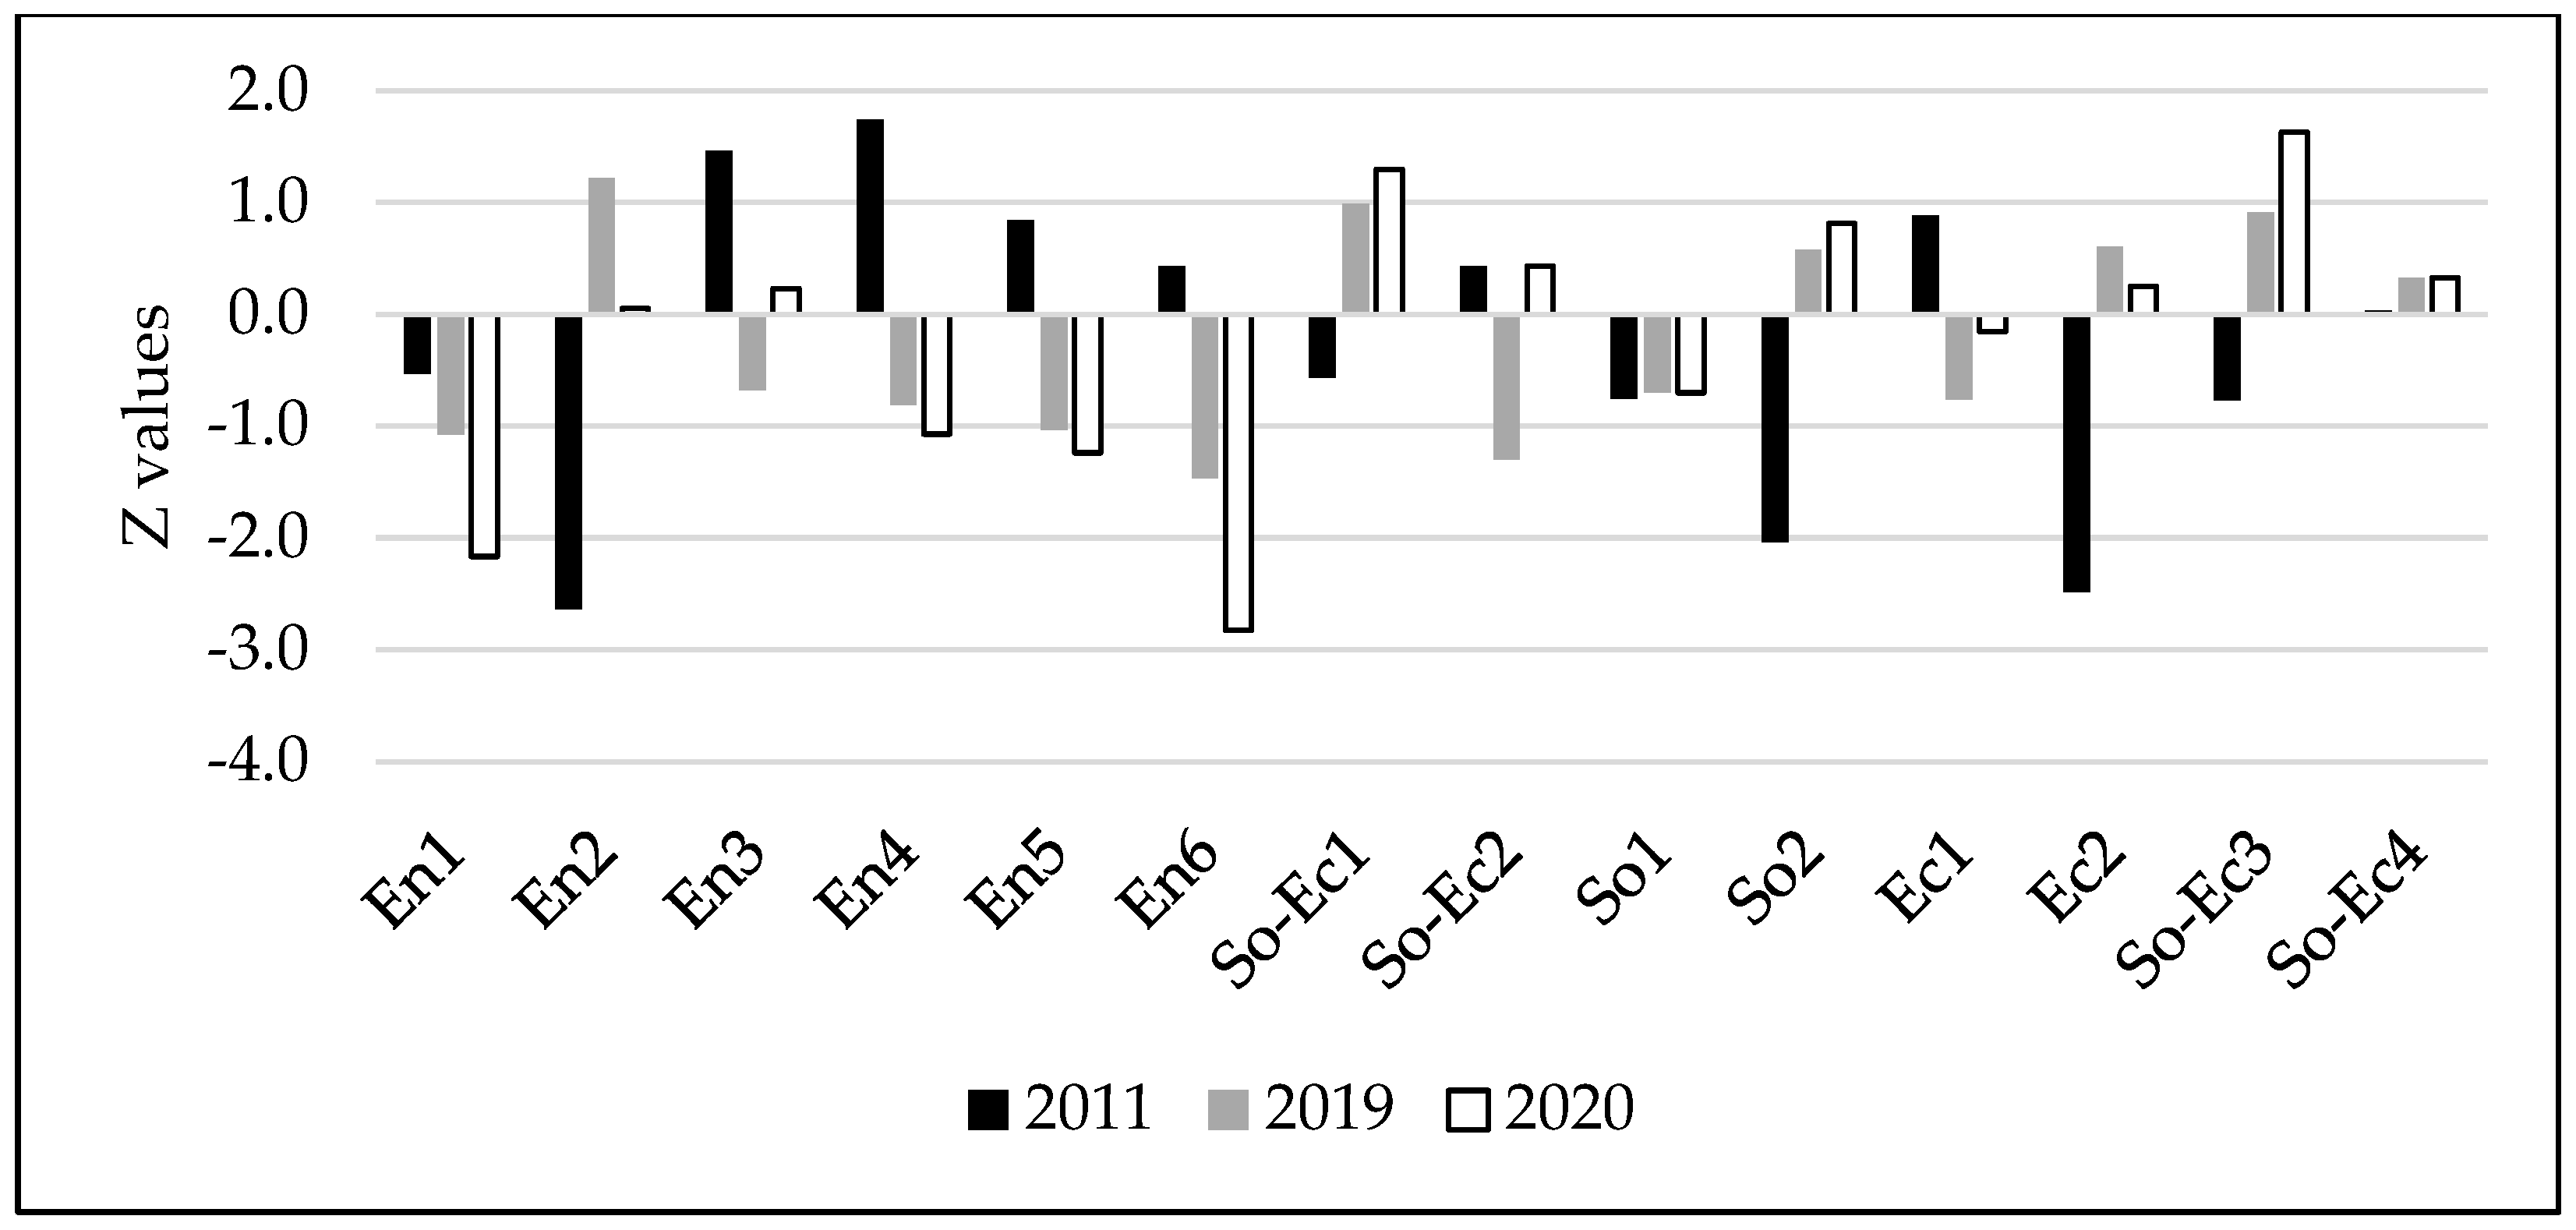
3.1.1. Sustainability Metrics Analysis throughout 2011–2022

According to the statistical analysis of the sustainability variables, the indicators linked to water quality in the environmental pillar (En) were “Average pH of the dam’s effluent” (En1), “Average TDS (mg/L) of the dam’s effluent” (En2), and “Average BOD (mg/L) of the dam’s effluent” (En3). The annual maximum average values (Table 2) of En1, En2, and En3 were 8.42, 1373.78, and 8.42 mg/L, respectively, in 2020, 2011 and 2017. The “Total discharged treated wastewater into the dam (MCM)” (En4) and “Average seismic event magnitude affecting the dam (Hz)” (En5) indicators showed above-average values from 2017 to 2022. The only non-zero values of the indicator “Annual spillway day events (days)” (En6) were 7 days in 2019 and 12 days in 2020. These variables were associated with decreased ISD values of less than 0.25.
Looking at the social pillar (So), the years with high, above-average values of the variables with positive signs were 2012 (6.2%), 2013 (9.2%), 2014 (8.5%), and 2015 (8.3%) for “Population increment rate (%)” (So1). For “Intersection density in the area adjacent to the dam (intersections/km2)” (So2), the years from 2014 to 2022 had above-average values. The highest value was observed in 2022 (5.5 intersections/km2). These variables were associated with an increase in the ISD to more than 0.25.
Five years of the study period were above average regarding the economic pillar (Ec) variables. The “Average daily irrigation uses relative to the daily storage (%)” (Ec1) contributed to increasing the ISD. The Ec1 values were 0.99%, 0.95%, 0.85%, 1%, and 1.21% for 2011, 2012, 2017, 2021, and 2022, respectively. For “KTD Hydroelectric Power Plant Efficiency (%)” (Ec2), the years from 2013 to 2017 and from 2019 to 2022 were associated with values above the average. The highest value was recorded in 2015 (43.2%). These variables were associated with an increase in the ISD to more than 0.25.
Concerning the socioeconomic pillar (So-Ec), the unemployment-related indicators decreased the ISD. The percentages of unemployed Jordanians aged 15 years and over relative to the number of citizens in the area adjacent to the dam for 2011, 2012, 2013 2014, and 2017 were 3.9, 3.8, 4.0, 4.5, and 3.8, respectively. The second indicator of So-Ec, “Unemployed Jordanian women aged 15 years and over relative to the number of unemployed people in the area adjacent to the dam (%)” (So-Ec2), was associated with a decrease in the ISD. Conversely, the years from 2017 to 2022 experienced higher, above-average values for both “Jordanian male and female workers in the agricultural sector aged 15 years (%)” (So-Ec3 and So-Ec4), which were associated with an increase in the ISD to more than 0.25.
Climate variables, the mean maximum temperature (MXT °C), the mean minimum temperature (MNT °C), and the mean annual precipitation (MAP mm) were taken from the Expert Team on Climate Risk and Sector-specific Indices (ETCRSCI) of the World Meteorological Organization (WMO) Commission for Climatology (CCl) [52,53,54,55]. Data on dam failure drivers were approximated from the age of the dam (DA years), annual sediment yield (ASY tons/ha), and annual dam storage (ADS MCM) [56]. The accumulation of sediments causes a decrease in storage, which, accordingly, causes an overtopping failure. At the same time, sediments and the water stored behind the dam create high pressure, which may cause piping dam failure. Moreover, as the dam age increases, the probability of a piping failure in the dam body increases [34]. The variables of the dam failure drivers were higher than those of climate change impacts. In particular, the ADS increased from a minimum of 5.5 MCM of storage to a maximum of 57.9 MCM of storage. Over the years the ASY values underwent major variations, ranging from a minimum yield of 1.2 tons/ha to a maximum yield of 14.5 tons/ha. Regarding the climate change variable, the MNT had the highest variability compared to other climate change variables, ranging from 3 to 18.6 °C. The ISD had an average of 0.25.

3.1.2. The KTD Performance according to the ISD

The first stage of the analysis findings offered an overview of how the KTD performance ranked according to the ISD (Figure 3). Table A1 shows the color scale of the sub-indicators; a lower index suggests a higher performance. To determine simple findings on sustainable dam performance during the previous 12 years, the ISD index was classified into three categories, high (H), medium (M), and low (L), based on the mean ISD ( m I S D ) and the standard deviation of the ISD ( σ I S D ) [21]. The years with values between the minimum (which by definition is 0) and m I S D 0.5 σ I S D were categorized as Low. Years with values in the interval [ m I S D 0.5 σ I S D ,   m I S D + 0.5 σ I S D ) were classified as Medium while years with values in the interval [ m I S D + 0.5 σ I S D ,   I S D m a x ] were classified as High, where I S D m a x is the maximum of the ISD:
  • The high-performance category, with ISD values from 0.3120 to 0.4258, included 2013, 2021, and 2022;
  • The medium-performance category, with ISD values from 0.1921 to 0.3120, included 2012, 2014, 2015, 2016, 2017, and 2018;
  • The low-performance category, with ISD values from 0 to 0.1921, included 2011, 2019, and 2020.
The high performance of the KTD regarding sustainability in the years 2013, 2021, and 2022 was driven mostly by the high performance in the social, economic, and socioeconomic sectors (Figure 4). In 2021, the high performance was driven by the high intersection density (So2), high supply of daily irrigation uses (Ec1), high hydroelectric production efficiency (Ec2), low percentages of unemployed Jordanians aged 15 years and over for both males and females (So-Ec1 and So-Ec2), and high percentages of Jordanian workers in the agricultural sector for both males and females aged 15 years and over (So-Ec3 and So-Ec4). The same trend was observed for the indicators in 2022. However, in the case of 2013, the environmental pillars contributed to the high performance, specifically, the low TDS and BOD as effluent characteristics (En2 and En3), low total discharged treated wastewater into the dam (En4), and low occurrences of either seismic or spillway events (En5 and En6), in addition to the high population increment rate (So1) and high hydroelectric production efficiency (Ec2) as social and economic indicators.
Conversely, the low performance in the third category was due to the low performance of the sustainability pillars of the dam (Figure 5). In 2011, the low performance was driven by the high pH and TDS as effluent characteristics (En1 and En2), a low population increment rate (So1), low intersection density (So2), low hydroelectric production efficiency (Ec2), high percentages of Jordanian unemployment for ages 15 years and over (So-Ec1), and low percentages of Jordanian workers in the agricultural sector aged 15 years and over (So-Ec3). This performance resulted in the lowest ISD, which equaled zero in 2011, i.e., the KTD performance regarding sustainability was the worst for most of the variables, compared to the last 12 years. In 2019 and 2020, the performance worsened due to the high pH and BOD as effluent characteristics (En1 and En3), high total discharged treated wastewater into the dam (En4), high and frequent occurrences of seismic and spillway events (En5 and En6), low population increment rate (So1), low supply of daily irrigation uses (Ec1), and high Jordanian female unemployment percentages for ages 15 years and over (So-Ec2). The low performance in these variables might have been affected by the COVID-19 pandemic, which had a wide range of indirect consequences on numerous sectors of life and infrastructure in several countries, including Jordan. Because of the pandemic, there was an increase in the use of certain cleaning and sanitation products, which, if not properly managed, might have had an impact on water quality. For example, greater disinfectant usage might result in higher levels of certain compounds in wastewater, impacting water quality. Regarding the population increment, during the epidemic, economic uncertainty and health concerns may have impacted people’s decisions regarding family planning and migration. Couples may have delayed having children or opted to have fewer children for economic or health reasons, resulting in a decreased population increment rate. Moreover, greater water consumption and sanitation efforts during the pandemic might have resulted in greater wastewater generation in some locations. Increased house occupancy, regular handwashing, and disinfection can all contribute to an increase in wastewater volume and the strain on wastewater treatment facilities [57]. The pandemic might have had an indirect impact on irrigation water supplies if it affected water resource management and distribution or if agricultural practices changed. Concerning the unemployment issue, the pandemic’s economic disruptions, such as lockdowns, reduced business activity, and travel restrictions, substantially influenced the employment market. High unemployment rates may have arisen from the economic constraints caused by the epidemic, especially in industries that rely on human presence and contact [58].

3.2. Causality and Dependency towards Climate Change and Dam Failure Drivers

Table 3 illustrates the causality relationships between the variables in Table 2 during the second phase of the investigation. Table 4 summarizes the econometric calculation conclusions, highlighting the direction and statistical significance of these correlations (Table A2 shows the p-values of the test). Table 3 and Table 4, in particular, give a detailed summary of the cause-and-effect links, as well as the polarity of these connections, between the ISD and climate change and dam failure drivers.
The ISD had Granger causality relationships with multiple elements, each of which had a specific effect. The dam age, average sediment yield, and storage all had a detrimental influence on the ISD (Table 3). Sedimentation behind the dam diminished its storage capacity, raising water pressure and increasing the danger of an overtopping failure. Furthermore, as the dam ages, the chance of piping failure increases. Furthermore, climate change, notably, a rise in the MAP, had a beneficial impact on the ISD; however, an increase in the MNT had a detrimental impact on the dam’s sustainability. These findings agreed with a study conducted on dam safety in Jordan by Salamah et al. [59]. They concluded that all dams in Jordan are threatened by climate change and sediments and, hence, are reduced in storage.

3.2.1. Dam Failure Drivers’ Interdependency with the ISD

The Granger-induced dam age (DA) was affected by the ADS and MNT. According to the regression analysis, the dam age was negatively influenced by its storage and any increase in the minimum temperature. However, empirical evidence confirmed that the ISD, ASY, MAP, and MXT had no direct effects on the DA.
The DA and ADS affected the Granger-caused average sediment yield (ASY). According to the investigation, sediment production was raised with increased storage capacity and dam age. Nonetheless, an empirical investigation indicated that the ASY was not directly affected by the ISD, MAP, MXT, or MNT.
The DA and MAP had a Granger effect on the average dam storage (ADS). According to the regression study, an older dam and more rainfall had a beneficial impact on average storage. However, empirical evidence indicated that the ISD, MXT, and MNT had no direct effect on the ADS.

3.2.2. Climate Change Drivers’ Interdependency with the ISD

The ADS had a beneficial Granger effect on the mean annual precipitation (MAP). Dams can have an impact on local ecosystems and microclimates; although, these impacts are secondary to their core role of water storage and control. Dams and precipitation have a complicated and often indirect relationship. Water storage helps to regulate humidity in the surrounding environment. Evaporation adds moisture to the atmosphere, creating microclimates with varied humidity levels and influencing local weather patterns, such as cloud formation and precipitation. Furthermore, humidity is a critical component of the atmospheric conditions required for precipitation to occur. When humidity mixes with other elements, such as cooling air, it adds to the rain-making process. Accordingly, the MAP affected the sustainability of the dam.
In addition, the ADS had a beneficial Granger effect on the mean maximum and minimum temperature (MXT and MNT). Temperatures are moderated by the reservoirs behind dams. Water has a high heat capacity, which means it can absorb and store a large quantity of heat. This stored heat is gradually released, assisting in the stabilization of temperatures surrounding the water body. Water cools the air in hot weather and releases stored heat during cold times, therefore mitigating temperature extremes. Moreover, the MNT was Granger-caused by the DA, ASY, MAP, and MXT.
It is worth highlighting that the age of the dam had a bidirectional relationship with the storage and minimum temperature. Additionally, the dam storage had a bidirectional relationship with the amount of precipitation. Accordingly, dam failure and climate change impacted each other in parallel with dam sustainability. These conclusions confirmed the hypotheses proposed in this study and agreed with the published literature [20,21]. The instability of dams due to engineering failures is observed in most of the dams in Jordan [59]. Therefore, developing and implementing rigorous action plans are recommended to minimize the impacts of failure.

4. Conclusions and Recommendations

This research adds to the current literature by offering a broad review of how the KTD performs in terms of the ISD and its pillars, namely, environmental, economic, and social. Furthermore, significant causality relationships among the ISD, climate change, and dam failure are identified. In particular, a negative bidirectional relationship exists between climate change and dam failure. In addition, the causes of dam failure and the impact of climate change have a direct effect on dam sustainability. It should be emphasized that targeted policy changes must be implemented, governing dams to improve their safety and sustainability while avoiding the environmental limits that would exacerbate the dangers posed by dam failure.
The use of the Wroclaw Taxonomic Method in combination with the Granger Causality Test to evaluate dam performance sustainability was beneficial, proving its efficacy. This method may be generalized and used to assess the sustainability of any dam, demonstrating its adaptability and broad applicability across various dam types and circumstances.
The ISD can be affected by social and economic pillars; although, the environmental pillar acts differently. However, in some cases, environmental pillar variables, such as water quality, wastewater usage, and seismic and flood events, can have significant effects on the ISD. Therefore, achieving such sustainability requires a focus on improving water quality through the following approaches. Irrigation water provided by dams may be secured to sustain healthy crops, effective resource use, and minimal environmental impact. As a result, agriculture will become increasingly sustainable and productive. Furthermore, it is critical to adopt rigorous treatment techniques, conduct frequent water quality monitoring, and adhere to environmental and safety standards to minimize the negative effects and maximize the positive effects of discharging treated wastewater into dams. This technique must be carefully managed so that the advantages of increased water supply and resource efficiency do not come at the cost of the environment and public health. From another perspective, the impact of increased seismic occurrences near dams is a complex issue that requires proactive management and safety measures. Structural integrity, emergency readiness, environmental concerns, and community safety must be prioritized for dams in seismically active areas. Enhanced monitoring, infrastructure improvements, and community participation are critical components of a comprehensive approach to addressing these difficulties and ensuring the safe operation of the dam. In terms of the socioeconomic pillars, improving accessibility in the regions surrounding a dam is critical for the well-being of the local community, economic growth, safety, and overall sustainability. Consequently, expanding job possibilities around a dam may have a significant positive influence on the local community and the region’s economy. It will help boost economic growth, reduce poverty, develop workforce skills, and improve general community well-being. To increase work prospects in this area, a multifaceted approach encompassing economic diversification, education, infrastructure development, and government efforts is required.
More research is needed using several variables related to the environmental, social, and economic components. These investigations have the potential to improve dam management practices and enhance long-term performance. It is also suggested that other pillars, notably political and technical variables, be included, depending on the availability and accessibility of relevant data. For instance, while our study primarily focuses on quantitative aspects, a qualitative approach can complement the presented information.

Author Contributions

Conceptualization, Q.A.-A. and M.R.; methodology, Q.A.-A., M.R. and A.A.-A.; software, Q.A.-A., A.A.-A., S.A.-O. and T.A.Q.; validation, Q.A.-A., M.R. and A.A.-A.; formal analysis, Q.A.-A. and S.A.-O.; investigation, M.R., A.A.-A., S.A.-O. and T.A.Q.; resources, M.R. and A.B.; data curation, A.A.-A., A.B. and T.A.Q.; writing—original draft preparation, Q.A.-A. and S.A.-O.; writing—review and editing, Q.A.-A. and M.R.; visualization, Q.A.-A., T.A.Q. and A.A.; supervision, M.R.; project administration, M.R. All authors have read and agreed to the published version of the manuscript.

Funding

This research received no external funding.

Institutional Review Board Statement

Not applicable.

Informed Consent Statement

Not applicable.

Data Availability Statement

Data are contained within the article.

Conflicts of Interest

The authors declare no conflict of interest. The funders had no role in the design of this study; in the collection, analyses, or interpretation of data; in the writing of the manuscript; or in the decision to publish the results.

Appendix A

Table A1. Indices of En, So, Ec, and So-Ec pillars of sustainability calculated by Equation (1), Euclidean distance et and Wroclaw index Wt calculated by Equations (2) and (3) and ISD calculated by Equation (4) (Scale: darker color = lower index = better performance).
YearEn1En2En3En4En5En6So1So2Ec1Ec2So-Ec1So-Ec2So-Ec3So-Ec4etWtISD
20112.8514.80.000.000.000.006.5410.71.9313.13.491.085.754.258.042.350.00
20120.504.340.530.180.000.001.2010.72.506.542.430.483.6810.46.601.590.27
20130.150.210.000.200.000.000.002.0311.40.414.750.003.2310.45.741.200.43
20140.071.980.821.650.000.000.071.656.961.2113.92.996.9610.46.991.780.19
20150.000.402.092.450.000.000.131.6511.80.001.550.4812.010.46.571.570.27
20160.050.860.812.550.000.005.521.6511.10.021.557.666.345.556.611.590.26
20170.192.099.554.334.620.005.870.585.100.662.437.661.444.256.981.780.20
20181.070.038.474.590.000.006.280.586.363.260.397.661.740.006.361.470.31
20194.980.004.606.533.543.616.250.449.220.280.107.660.523.127.131.850.17
202011.01.361.537.924.3410.66.270.185.910.780.001.080.003.127.361.970.13
20211.313.232.647.603.800.006.390.181.630.631.551.082.071.395.791.220.42
20225.740.396.6910.44.240.006.450.000.000.520.000.120.010.955.961.290.39
Max11.014.89.5510.44.6210.66.5410.711.13.113.97.6612.010.4--0.43
Mean2.332.483.144.031.711.184.252.546.182.282.683.163.655.38--0.25
Min0.000.000.000.000.000.000.000.000.000.000.000.000.000.00--0.00
Std3.243.943.243.312.043.012.783.733.953.723.683.263.433.89--0.12
Mean
+0.5 std
3.954.454.765.692.732.695.644.408.164.144.534.795.377.32--0.31
Mean
−0.5 std
0.710.501.532.380.690.002.860.674.210.430.841.531.943.43--0.19
Table A2. Granger Causality Test p-values obtained by Equations (5) and (6) and RStudio codes.
x Granger Causes yx Variables
y VariablesLag OrderISDDAASYADSMAPMXTMNT
ISD1----0.03100.41140.020060.6030.61740.8656
2----00.045990.0018920.032040.011340.7857
3----00.15270.17690.21040.17010.7896
DA10.8721----0.98110.02820.9490.9050.00175
20----00000
30----00000
ASY10.53240.0168----0.02820.85890.94320.6807
20.20070----00.319900.7082
30.28650----00.997300.7666
ADS10.75490.01690.9811----0.90020.90720.2175
20.534800----0.17850.16690.6801
30.813800----0.0366800.7624
MAP10.78180.53130.92580.1054----0.81110.5786
20.555200.68410.02832----0.35590.7246
30.482400.99940.02279----0.99830.7823
MXT10.78790.29310.88710.063290.7564----0.7305
20.4222000.026580.3656----0.7529
30.43640000.9973----0.7983
MNT10.77670.06430.87040.12510.9080.8411----
20.82700.94910.21780.83260.7737----
30.127100.0056780.0061990.056950.04133----
Figure A1. Development of transportation network and increasing construction of roads and intersections within the districts near KTD over the period of 2011–2022 [60].
Sustainability 15 16239 g0a1

References

  1. Kuhlman, T.; Farrington, J. What Is Sustainability? Sustainability 2010, 2, 3436–3448. [Google Scholar] [CrossRef]
  2. Grasso, M.; Tàbara, J.D. Towards a Moral Compass to Guide Sustainability Transformations in a High-End Climate Change World. Sustainability 2019, 11, 2971. [Google Scholar] [CrossRef]
  3. Silva, J.A. Wastewater Treatment and Reuse for Sustainable Water Resources Management: A Systematic Literature Review. Sustainability 2023, 15, 10940. [Google Scholar] [CrossRef]
  4. Karami, S.; Karami, E. Sustainability Assessment of Dams. Environ. Dev. Sustain. 2020, 22, 2919–2940. [Google Scholar] [CrossRef]
  5. Fluixá-Sanmartín, J.; Altarejos-García, L.; Morales-Torres, A.; Escuder-Bueno, I. Review Article: Climate Change Impacts on Dam Safety. Nat. Hazards Earth Syst. Sci. 2018, 18, 2471–2488. [Google Scholar] [CrossRef]
  6. Wu, J.; Wu, T. Sustainability Indicators and Indices: An Overview. In Handbook of Sustainability Management; World Science: Singapore, 2011; pp. 65–86. [Google Scholar]
  7. Al-Weshah, R. The Role of UNESCO in Sustainable Water Resources Management in the Arab World. Desalination 2003, 152, 1–13. [Google Scholar] [CrossRef]
  8. Hadadin, N.A. Dams in Jordan Current and Future Perspective. Can. J. Pure Appl. Sci. 2015, 9, 1–12. [Google Scholar]
  9. Bahmanpouri, F.; Daliri, M.; Khoshkonesh, A.; Montazeri Namin, M.; Buccino, M. Bed Compaction Effect on Dam Break Flow over Erodible Bed; Experimental and Numerical Modeling. J. Hydrol. 2020, 594, 125645. [Google Scholar] [CrossRef]
  10. Al-Weshah, R.A.; Yihdego, Y. Multi-Criteria Decision Approach for Evaluation, Ranking and Selection of Remediation Options: Case of Polluted Groundwater, Kuwait. Environ. Sci. Pollut. Res. 2018, 25, 36039–36045. [Google Scholar] [CrossRef]
  11. Burgherr, P.; Lordan-Perret, R.; Spada, A. A Multi-Criteria Decision Model for the Assessment of Sustainability and Governance Risks of Tailings Dams. In Proceedings of the 32nd European Safety and Reliability Conference (ESREL 2022), Dublin, Ireland, 28 August–1 September 2022; pp. 2621–2628. [Google Scholar]
  12. Karakuş, C.B.; Yıldız, S. Gis-Multi Criteria Decision Analysis-Based Land Suitability Assessment for Dam Site Selection. Int. J. Environ. Sci. Technol. 2022, 19, 12561–12580. [Google Scholar] [CrossRef]
  13. Florek, K.; Łukaszewicz, J.; Perkal, J.; Steinhaus, H.; Zubrzycki, S. Taksonomia Wrocławska. Przegl. Antropol. 1951, 17, 193–211. [Google Scholar]
  14. Senetra, A.; Szarek-Iwaniuk, P. The Implementation of the Wroclaw Taxonomic Method for the Identification and Evaluation of Problem Areas in the Warmia and Mazury Region in Poland—A Case Study. Soc. Econ. Plann. Sci. 2019, 67, 43–57. [Google Scholar] [CrossRef]
  15. Klóska, R.; Ociepa-Kicińska, E.; Czyżycki, R.; Szklarz, P. Regional Development in Poland in Taxonomic Terms. Sustainability 2020, 12, 4780. [Google Scholar] [CrossRef]
  16. Shojaie, A.; Fox, E.B. Granger Causality: A Review and Recent Advances. Annu. Rev. Stat. Appl. 2021, 9, 289–319. [Google Scholar] [CrossRef] [PubMed]
  17. Dietrich, A. Does Growth Cause Structural Change, or Is It the Other Way Around? A Dynamic Panel Data Analysis for Seven OECD Countries. Empir. Econ. 2011, 43, 915–944. [Google Scholar] [CrossRef]
  18. Gunjal, R.; Nayyer, S.S.; Wagh, S.; Stanković, A.M.; Singh, N. Granger Causality for Prediction in Dynamic Mode Decomposition: Application to Power Systems. Electr. Power Syst. Res. 2023, 225, 109865. [Google Scholar] [CrossRef]
  19. Dörgő, G.; Sebestyén, V.; Abonyi, J. Evaluating the Interconnectedness of the Sustainable Development Goals Based on the Causality Analysis of Sustainability Indicators. Sustainability 2018, 10, 3766. [Google Scholar] [CrossRef]
  20. Bildirici, M.; Genç, S.Y.; Boztuna, S. Sustainability, Natural Gas Consumption, and Environmental Pollution in the Period of Industry 4.0 in Turkey: MS-Granger Causality and Fourier Granger Causality Analysis. Sustainability 2023, 15, 10742. [Google Scholar] [CrossRef]
  21. Agovino, M.; Casaccia, M.; Ciommi, M.; Ferrara, M.; Marchesano, K. Agriculture, Climate Change and Sustainability: The Case of EU-28. Ecol. Indic. 2019, 105, 525–543. [Google Scholar] [CrossRef]
  22. Winton, R.S.; Calamita, E.; Wehrli, B. Reviews and Syntheses: Dams, Water Quality and Tropical Reservoir Stratification. Biogeosciences 2019, 16, 1657–1671. [Google Scholar] [CrossRef]
  23. Ta’any, R.A.; Ammari, T.G.; Jiries, A. Revegetation in Arid Zones: Environmental Impact of Treated Wastewater Irrigation in Al-Karak Province, Jordan. Pol. J. Environ. Stud. 2013, 22, 569–575. [Google Scholar]
  24. Abu Ghazaleh, S. Lake Lisan and the Dead Sea: Their Level Changes and the Geomorphology of Their Terraces. Ph.D. Thesis, Technische Universität Darmstadt, Hessen, Germany, 9 February 2011. [Google Scholar]
  25. Qutishat, T. Active Tectonic Movement of The Dead Sea Transform Fault Induced Soft-Sediments Deformation: Instances from The Quaternary Deposits At Wadi Al-Alkharazeh. Master’s Thesis, The University of Jordan, Amman, Jordan, 2022; pp. 1–180. [Google Scholar]
  26. Ambraseys, N. Earthquakes in the Mediterranean and Middle East; Cambridge University Press: Cambridge, UK, 2009. [Google Scholar]
  27. Zardari, M.A.; Mattsson, H.; Knutsson, S.; Khalid, M.S.; Ask, M.V.S.; Lund, B. Numerical Analyses of Earthquake Induced Liquefaction and Deformation Behaviour of an Upstream Tailings Dam. Adv. Mater. Sci. Eng. 2017, 2017, 1–12. [Google Scholar] [CrossRef]
  28. Utete, E.; Maposa, D.; Nare, H. Statistical Investigation of Reservoir-Induced Seismic Events in Mid-Zambezi Basin and Risk Assessment of Seismically Triggered Kariba Dam Failure. J. Seismol. 2022, 26, 1–19. [Google Scholar] [CrossRef]
  29. Pekel, J.-F.; Cottam, A.; Gorelick, N.; Belward, A.S. High-Resolution Mapping of Global Surface Water and Its Long-Term Changes. Nature 2016, 540, 418–422. [Google Scholar] [CrossRef]
  30. Rui, J.; Othengrafen, F. Examining the Role of Innovative Streets in Enhancing Urban Mobility and Livability for Sustainable Urban Transition: A Review. Sustainability 2023, 15, 5709. [Google Scholar] [CrossRef]
  31. Rahbeh, M.; Srinivasan, R.; Mohtar, R. Numerical and Conceptual Evaluation of Preferential Flow in Zarqa River Basin, Jordan. Ecohydrol. Hydrobiol. 2019, 19, 224–237. [Google Scholar] [CrossRef]
  32. Schmitt, R.J.P.; Rosa, L.; Daily, G.C. Global Expansion of Sustainable Irrigation Limited by Water Storage. Proc. Natl. Acad. Sci. USA 2022, 119, e2214291119. [Google Scholar] [CrossRef] [PubMed]
  33. Kumar, K.; Saini, R.P. A Review on Operation and Maintenance of Hydropower Plants. Sustain. Energy Technol. Assess. 2022, 49, 101704. [Google Scholar] [CrossRef]
  34. Al-Omari, S. Dam Break Risk Analysis Using Hec-Ras: A Case of King Talal Dam. Master’s Thesis, The University of Jordan, Amman, Jordan, 2020; pp. 1–90. [Google Scholar]
  35. OECD. Handbook on Constructing Composite Indicators: Methodology and User Guide; Joint Research Centre-European Commission, OECD Publishing: Seville, Spain, 2008. [Google Scholar]
  36. Chudy-Laskowska, K.; Pisula, T.; Liana, M.; Vasa, L. Taxonomic Analysis of the Diversity in the Level of Wind Energy Development in European Union Countries. Energies 2020, 13, 4371. [Google Scholar] [CrossRef]
  37. Olabi, A.G.; Obaideen, K.; Elsaid, K.; Wilberforce, T.; Sayed, E.T.; Maghrabie, H.M.; Abdelkareem, M.A. Assessment of the Pre-Combustion Carbon Capture Contribution into Sustainable Development Goals SDGs Using Novel Indicators. Renew. Sustain. Energy Rev. 2022, 153, 111710. [Google Scholar] [CrossRef]
  38. Al-Afeshat, A. Hydrological Analysis of Wadis Draining to the Gulf of Aqaba Using Hydrological Simulation Models. Master’s Thesis, The University of Jordan, Amman, Jordan, 2019; pp. 1–75. [Google Scholar]
  39. Hadadin, N.A.; Al-Adwan, S.R. Estimation of the Sediment Yield Using Hydrological Assessment Tool Model: A Case of Wadi Al-Arab Dam at the Northern Part of Jordan. Arabian J. Geosci. 2020, 13, 1–16. [Google Scholar] [CrossRef]
  40. Taani, Y. Sediments Transport Mitigation and Management in Wala Dam. Master’s Thesis, The University of Jordan, Amman, Jordan, 2022; pp. 1–70. [Google Scholar]
  41. AlSmadi, K. Sediments Transport Mitigation and Management in Wadi Shu’eib Dam. Master’s Thesis, The University of Jordan, Amman, Jordan, 2022; pp. 1–60. [Google Scholar]
  42. Shaheen, M. Accumulation of Sediments at King Talal Dam. Master’s Thesis, The University of Jordan, Amman, Jordan, 2017; pp. 1–100. [Google Scholar]
  43. Chow, V.T.; Maidment, D.R.; Mays, L.W. Applied Hydrology; McGraw-Hill Education: New York, NY, USA, 1988. [Google Scholar]
  44. MWI Ministry of Water and Irrigation. Available online: https://www.mwi.gov.jo/Ar/List/%D8%A7%D9%84%D8%AA%D9%82%D8%A7%D8%B1%D9%8A%D8%B1_%D8%A7%D9%84%D8%B3%D9%86%D9%88%D9%8A%D8%A9 (accessed on 1 April 2023).
  45. Hamilton, J.D.; Sitzia, B. Econometria Delle Serie Storiche; Monduzzi: Bologna, Spain, 1995. [Google Scholar]
  46. Dumitrescu, E.-I.; Hurlin, C. Testing for Granger Non-Causality in Heterogeneous Panels. Econ. Model. 2012, 29, 1450–1460. [Google Scholar] [CrossRef]
  47. Agovino, M.; Aldieri, L.; Garofalo, A.; Vinci, C.P. Quality and Quantity in the Innovation Process of Firms: A Statistical Approach. Qual. Quant. 2016, 51, 1579–1591. [Google Scholar] [CrossRef]
  48. Saidi, K.; Ben Mbarek, M. Nuclear Energy, Renewable Energy, CO2 Emissions and Economic Growth for Nine Developed Countries: Evidence from Panel Granger Causality Tests. Prog. Nucl. Energy 2016, 88, 364–374. [Google Scholar] [CrossRef]
  49. MEMR Ministry of Energy and Mineral Resources. Available online: https://www.memr.gov.jo/En/List/Open_Data (accessed on 1 May 2023).
  50. White, A.B.; Moore, B.J.; Gottas, D.J.; Neiman, P.J. Winter Storm Conditions Leading to Excessive Runoff above California’s Oroville Dam during January and February 2017. Bull. Am. Meteorol. Soc. 2019, 100, 55–70. [Google Scholar] [CrossRef]
  51. DOS Department of Statistics. Available online: http://www.dos.gov.jo/dos_home_a/main/linked-html/Emp_unEmp.htm (accessed on 1 July 2023).
  52. Filipović, S.; Lior, N.; Radovanović, M. The Green Deal—Just Transition and Sustainable Development Goals Nexus. Renew. Sustain. Energy Rev. 2022, 168, 112759. [Google Scholar] [CrossRef]
  53. McKee, T.B.; Doesken, N.J.; Kleist, J. The Relationship of Drought Frequency and Duration to Time Scales. In Proceedings of the Eighth Conference on Applied Climatology, Anaheim, CA, USA, 17–22 January 1993. [Google Scholar]
  54. Vicente-Serrano, S.M.; Beguería, S.; López-Moreno, J.I. A Multiscalar Drought Index Sensitive to Global Warming: The Standardized Precipitation Evapotranspiration Index. J. Clim. 2010, 23, 1696–1718. [Google Scholar] [CrossRef]
  55. Zwiers, F.W.; Alexander, L.V.; Hegerl, G.C.; Knutson, T.R.; Kossin, J.P.; Naveau, P.; Nicholls, N.; Schär, C.; Seneviratne, S.I.; Zhang, X. Climate Extremes: Challenges in Estimating and Understanding Recent Changes in the Frequency and Intensity of Extreme Climate and Weather Events. In Climate Science for Serving Society; Asrar, G.R., Hurrell, J.W., Eds.; Springer: Dordrecht, The Netherlands, 2013; pp. 339–389. [Google Scholar]
  56. Guimarães, R.N.; Moreira, V.R.; Cruz, J.R.A.; Saliba, A.P.M.; Amaral, M.C.S. History of Tailings Dam Failure: Impacts on Access to Safe Water and Influence on the Legislative Framework. Sci. Total Environ. 2022, 852, 158536. [Google Scholar] [CrossRef] [PubMed]
  57. Alrbaihat, M.R.; Abu-Afifeh, Q. Eco-Friendly Microplastic Removal through Physical and Chemical Techniques: A Review. Ann. Adv. Chem. 2023, 7, 14–24. [Google Scholar]
  58. Mehta, S.; Machado, F.; Kwizera, A.; Papazian, L.; Moss, M.; Azoulay, É.; Herridge, M. COVID-19: A Heavy Toll on Health-Care Workers. Lancet Respir. Med. 2021, 9, 226–228. [Google Scholar] [CrossRef]
  59. Salamah, E.; El-Hasan, T.; Abu-Jamah, M. Dam Safety in Jordan: Factors Affecting Dam Safety, Responsibilities and Required Actions. Engineering 2023, 15, 514–532. [Google Scholar] [CrossRef]
  60. Google Earth. Available online: https://earth.google.com/web/ (accessed on 1 August 2023).
Figure 1. WWTPs and historical seismic events close to KTD [44,49].
Sustainability 15 16239 g001
Figure 2. Districts near the KTD [51].
Sustainability 15 16239 g002
Figure 3. The KTD ranks according to the ISD.
Sustainability 15 16239 g003
Figure 4. The normalized values (Z) from Equation (1) of the high-performance years of the KTD.
Sustainability 15 16239 g004
Figure 5. The normalized values (Z) from Equation (1) of the low-performance years of the KTD.
Sustainability 15 16239 g005
Table 1. List of variables for each pillar that are normalized according to Equation (1) and their signs toward favorable results related to sustainability (Increase: if its increase is associated with an increase in the value of the index; Decrease: if its increase is associated with a decrease in the index).
PillarEffect on ISDDescription of the IndicatorUnitCode
EnDecreaseAverage pH of the dam’s effluent-En1
EnDecreaseAverage TDS of the dam’s effluentmg/LEn2
EnDecreaseAverage BOD of the dam’s effluentmg/LEn3
EnDecreaseTotal discharged treated wastewater into the damMCMEn4
EnDecreaseAverage seismic events’ magnitudes affecting the damHzEn5
EnDecreaseAnnual spillway events (days)daysEn6
SoIncreasePopulation increment rate%So1
SoIncreaseIntersection densities at the areas adjacent to the damintersections/km2So2
EcIncreaseAverage daily irrigation uses relative to the daily storage%Ec1
EcIncreaseKing Talal Dam Hydroelectric Power Plant Efficiency%Ec2
So-EcDecreaseUnemployed Jordanians aged 15 years and over relative to the number of citizens in the area adjacent to the dam%So-Ec1
So-EcDecreaseUnemployed Jordanian women aged 15 years and over relative to the number of unemployed people in the area adjacent to the dam%So-Ec2
So-EcIncreaseJordanian workers in the agricultural sector aged 15 years and over relative to the number of citizens in the area adjacent to the dam%So-Ec3
So-EcIncreaseJordanian female workers in the agricultural sector aged 15 years and over relative to the number of workers in the area adjacent to the dam%So-Ec4
Table 2. Summary statistics of variables used in the analysis throughout 2011–2022.
IndicatorUnitStatistics
MeanStandard DeviationMaximumMinimum
En1Unitless8.020.188.427.81
En2mg/L1093.86106.201373.78964.82
En3mg/L6.151.398.424.11
En4MCM116.2717.73142.5985.39
En5Hz0.941.122.400.00
En6days1.583.6812.000.00
So1%4.302.749.242.23
So2intersections/km24.990.455.544.07
Ec1%0.840.161.210.65
Ec2%33.068.9643.2010.79
So-Ec1%3.720.324.503.30
So-Ec2%4.030.294.403.60
So-Ec3%3.840.835.202.30
So-Ec4%0.590.341.300.20
ISDUnitless0.250.120.430.00
DAyears39.503.4545.003.45
ASYton/ha9.313.2714.501.20
ADSMCM48.815.4857.905.48
MAPmm6.751.439.501.43
MXT°C26.392.3231.092.32
MNT°C14.293.0218.603.02
Table 3. Summary of the Granger Causality Test (x Granger causes y; ✓: dependent; ✗: independent; -: not applicable).
x Variablesy Variables
ISDDAASYADSMAPMXTMNT
ISD-
DA-
ASY-
ADS-
MAP-
MXT-
MNT-
Table 4. Summary of the significant empirical results of the causality test obtained by RStudio. (+ and − are positive and negative significant relationships, respectively; A, B, and C are 1%, 5%, and 10% confidence, respectively; 1, 2, and 3 are the first, second, and third lag order).
y Variablesx Variables
ISDDAASYADSMAPMXTMNT
ISD −B 1−B 2−B 1, −C 2+B 2−B 2
DA −B 1 +C 1
ASY +B 1 +B 1
ADS −B 1 +B 3
MAP +B 2, +B 3
MXT +A 1, +B 2
MNT +A 1+C 3+C 3+A 3+B 3
Disclaimer/Publisher’s Note: The statements, opinions and data contained in all publications are solely those of the individual author(s) and contributor(s) and not of MDPI and/or the editor(s). MDPI and/or the editor(s) disclaim responsibility for any injury to people or property resulting from any ideas, methods, instructions or products referred to in the content.

