Article

Coordination Analysis of Sustainable Agricultural Development in Northeast China from the Perspective of Spatiotemporal Relationships

College of Economics and Management, Northeast Agricultural University, Harbin 150030, China
*
Author to whom correspondence should be addressed.
Sustainability 2023, 15(23), 16354; https://doi.org/10.3390/su152316354
Submission received: 7 October 2023 / Revised: 19 November 2023 / Accepted: 24 November 2023 / Published: 28 November 2023

Abstract

:
The coordination of sustainable agricultural development is essential for optimizing agricultural policies and ensuring food security. However, only a few studies have examined the temporal and spatial aspects of the coordination of sustainable agricultural development systems in Northeast China. This study proposed a theoretical framework based on the dissipative structure theory, which suggests that the coordination among the four subsystems of economy, society, resources, and technology plays a crucial role in determining the level of sustainable agricultural development in Northeast China (SADINC). Then, the present study took socioeconomic statistical data as data sources and integrated administrative division data using the ArcGIS platform, forming spatial data for municipal-level units of SADINC from 2000 to 2020. The entropy weight method was applied to analyze the change in sustainable agricultural development, while the coordination degree model was used to analyze the coordination among different subsystems. The main results showed a general increase in the index of SADINC. The central part of the study area generally exhibits higher urban economic and resource indices, while the southern region exhibits higher urban social and technological indices. The average coordination degree of SADINC decreased from 1.736 to 1.639, representing a decline of 0.097. Moreover, the spatial polarization in most cities’ coordination degrees and subsystem indicators is not pronounced. However, there are characteristics of high-high agglomeration and low-low agglomeration. The high-high aggregation of the coordination degree shows a dispersal pattern from the large-scale agglomeration in the south-east to the central part. The distribution of low-low agglomeration transforms from large-scale agglomeration in the west to small-scale agglomeration in the northeast. The implementation of agricultural policies has dramatically impacted the increase in the index of each subsystem in Northeast China from 2000 to 2022. However, it is crucial to ensure coordination among the subsystems. Therefore, future policies should focus on strengthening the coordination among the economic, social, resource, and technology subsystems to achieve sustainable agricultural development.

1. Introduction

Agricultural sustainability is an increasingly important topic for the global community [1,2], which aims to meet the stable food supply needs of both current and future generations [3]. The coordination of all aspects of agricultural sustainability is essential for the four pillars of food security: availability, accessibility, utilization, and stability [4]. Nevertheless, the initial agricultural development model of high economic growth influences the coordination [5]. This has led to numerous issues, such as water scarcity, soil degradation, loss of biodiversity, and high greenhouse gas emissions [6]. In recent years, the COVID-19 pandemic, armed conflicts, and climate change have further hindered the global production potential [7]. According to the FAO “2023 Food and Agriculture-Related Sustainable Development Goal Indicator Progress Tracking” report, the number of hungry people in the world is projected to reach 6.91–7.83 million in 2022, accounting for 9.2% of the global population. Additionally, at least 100 million hectares of land were degraded annually from 2015 to 2019 [8]. The global food system faces numerous unpredictable and volatile risks both presently and in the future. This is further compounded by the variations in agricultural policies and levels of development across different countries, making the pursuit of sustainable agricultural development challenging yet crucial [9,10]. Consequently, quantifying the degree of sustainable agricultural development in each region based on country-specific characteristics and coordinating the relationships between various agricultural systems will facilitate the adjustment and optimization of agricultural policies to achieve long-term sustainable agricultural development [11,12].
China, as a densely populated developing country, has implemented the “National Plan for Sustainable Agricultural Development (2015–2030)” to effectively steer the coordinated development of the agricultural sustainability system [13]. Remarkably, China has made significant progress in ensuring global food security. China uses 9% of the world’s cultivated land and 6% of its freshwater resources, effectively supporting the livelihoods of nearly 20% of the world’s population [14]. Regional environmental issues have gained increasing prominence, such as the intensive utilization of agricultural resources, excessive reliance on pesticides and fertilizers, the overexploitation of groundwater, and the prevalence of agricultural pollution [15,16]. Meanwhile, the variations in economic development levels, natural resource endowments, and agricultural development conditions across different regions further exacerbated regional imbalance [17,18,19]. The northeastern region of China, commonly referred to as the breadbasket, holds significant importance in ensuring China’s food security. Thus, exploring the development of sustainable agricultural coordination in this region is crucial.
Northeast China boasts favorable agricultural production conditions and tremendous potential [20]. The region, with approximately 621 million acres of cultivated land and 296 million acres of black soil cultivated land, serves as a crucial production and processing base for agricultural products in China [21,22]. It has achieved significant reductions in pesticide and fertilizer usage since 2015, and contributed over one-fourth of China’s total grain output, with one-fourth in terms of commodity volume and one-third in terms of transfer volume by 2022. The region has made remarkable advancements in adopting advanced technologies, implementing efficient agricultural practices, and promoting agricultural innovation, positioning itself at the forefront of agricultural modernization [23]. However, variations in regional agricultural development conditions and socioeconomic changes may impact the stability of the sustainable agricultural development system, subsequently affecting China’s present and future food security [10,11]. This underscores the importance of the coordinated development of sustainable agricultural systems in the Northeast. Nevertheless, the coordinated development of agricultural sustainability in Northeast China is dealt with in only a few studies, in which the analysis of the changes and the coordination of sustainable agricultural development are rarely addressed from the perspective of long-term series in this region. Hence, evaluating the long-term changes and coordination of sustainable agricultural development in Northeast China (SADINC) will facilitate the optimization of regional agricultural policies and ensure the stability of the sustainable agricultural development system.
Scholars have researched agricultural sustainable development from various perspectives [21,22]. Most scholars adhere to sustainability, operability, and systematicness when establishing a sustainable agricultural development system. Mollayosefi et al. emphasized the critical role of the environment in sustainable development. The study evaluated the sustainability of agriculture and natural resources in East Azerbaijan Province, Iran, considering three dimensions: economic, social, and environmental [23]. Guo et al. developed an evaluation system comprising four dimensions: social development, economic benefits, resource investment, and ecological environment. Their study revealed that urbanization level, agricultural mechanization level, investment in scientific and technological development, and cultivated land area are key factors influencing the spatial variations in China’s agricultural green development [24]. Fallah-Alipour et al. aimed to address poverty reduction in developing countries and developed an indicator system encompassing six key aspects: economic, social, environmental, political, institutional, and population [25]. Sulewski et al. assessed the coordination of farm development across three dimensions: economic, social, and environmental. The findings indicated that simultaneously achieving a high level of performance in all three dimensions is challenging [26].
In summary, variations in agricultural productivity across different regions lead to diverse perspectives on sustainable agricultural development, resulting in systematic disparities in sustainable agricultural development. Indeed, when examining sustainable agricultural development, it is crucial to consider a holistic perspective encompassing the economy, society, environment, and resources. In the context of the Northeast region, technology plays a vital role in promoting sustainable agricultural development. Furthermore, the sustainable agricultural development principles emphasize “protecting and enhancing natural resources”. Technology undoubtedly plays a significant role in ensuring sustainable agricultural development [27]. Therefore, the changes of SADINC are influenced by the level of mutual coordination among various subsystems, including the economy, society, resources, and technology. The coordination function plays a crucial role in assessing the level of coordination within the system, considering the distance and degree of dispersion between systems [28,29].
Regarding indicators for sustainable agricultural development, there are two main approaches: objective weighting and subjective empowerment. The objective weighting method is primarily based on the entropy weight method or the improved entropy weight method [30,31,32,33,34,35]. On the other hand, the subjective empowerment method mainly involves using the analytic hierarchy process (AHP) [36,37,38,39,40,41,42]. However, it is essential to note that the experts’ subjectivity can influence the AHP and may introduce randomness into the evaluation process. Therefore, this study asserts that adopting the objective weighting method to assess the significance of agricultural sustainability indicators can effectively address subjective uncertainties. Consequently, the evaluation outcomes of sustainable agricultural development will be more accurate and rational. Regarding coordination degree analysis, scholars have employed the coordination degree model to conduct research. Feng et al. took Zhejiang Province as their research area and analyzed the balance degree of intensive urban land use by assessing the coordination degree of the urban land use PSR system [43]. Gao et al. established China’s ecological construction effectiveness evaluation system and employed the coordination degree model to analyze the coordination between each subsystem and internal factors [44]. Li et al. established a coordination degree evaluation model for cultivated land management based on the coordination degree model. They used exploratory spatial data analysis methods to reveal the evolution characteristics of the cultivated land management pattern in Hunan Province [45]. These research methods provide a solid foundation for this article.
This study examines the changes in the degree of sustainable agricultural development and coordination in Northeast China from 2000 to 2020. The objectives of this study are as follows: (1) establish a theoretical framework for sustainable agricultural development; (2) analyze the spatiotemporal characteristics of regional sustainable agricultural development; and (3) evaluate the coordination of regional sustainable agricultural development systems. To address these objectives, we first established a theoretical framework and evaluation index system based on the dissipative structure theory. Then, we introduced the study area and described the data sources and processing. Furthermore, the study used the evaluation results of sustainable agricultural development to conduct a quantitative analysis of the spatial and temporal characteristics of changes in each system. Additionally, the study employed a coordination degree model to evaluate the spatiotemporal changes in the coordination degree of sustainable agricultural development systems. Following this, the study revealed the spatiotemporal aggregation characteristics of various systems and coordination degrees in Northeast China and suggested optimizing regional sustainable agricultural development policies. Finally, we proposed conclusions and suggestions for future study.

2. Materials and Methods

2.1. Research Methods

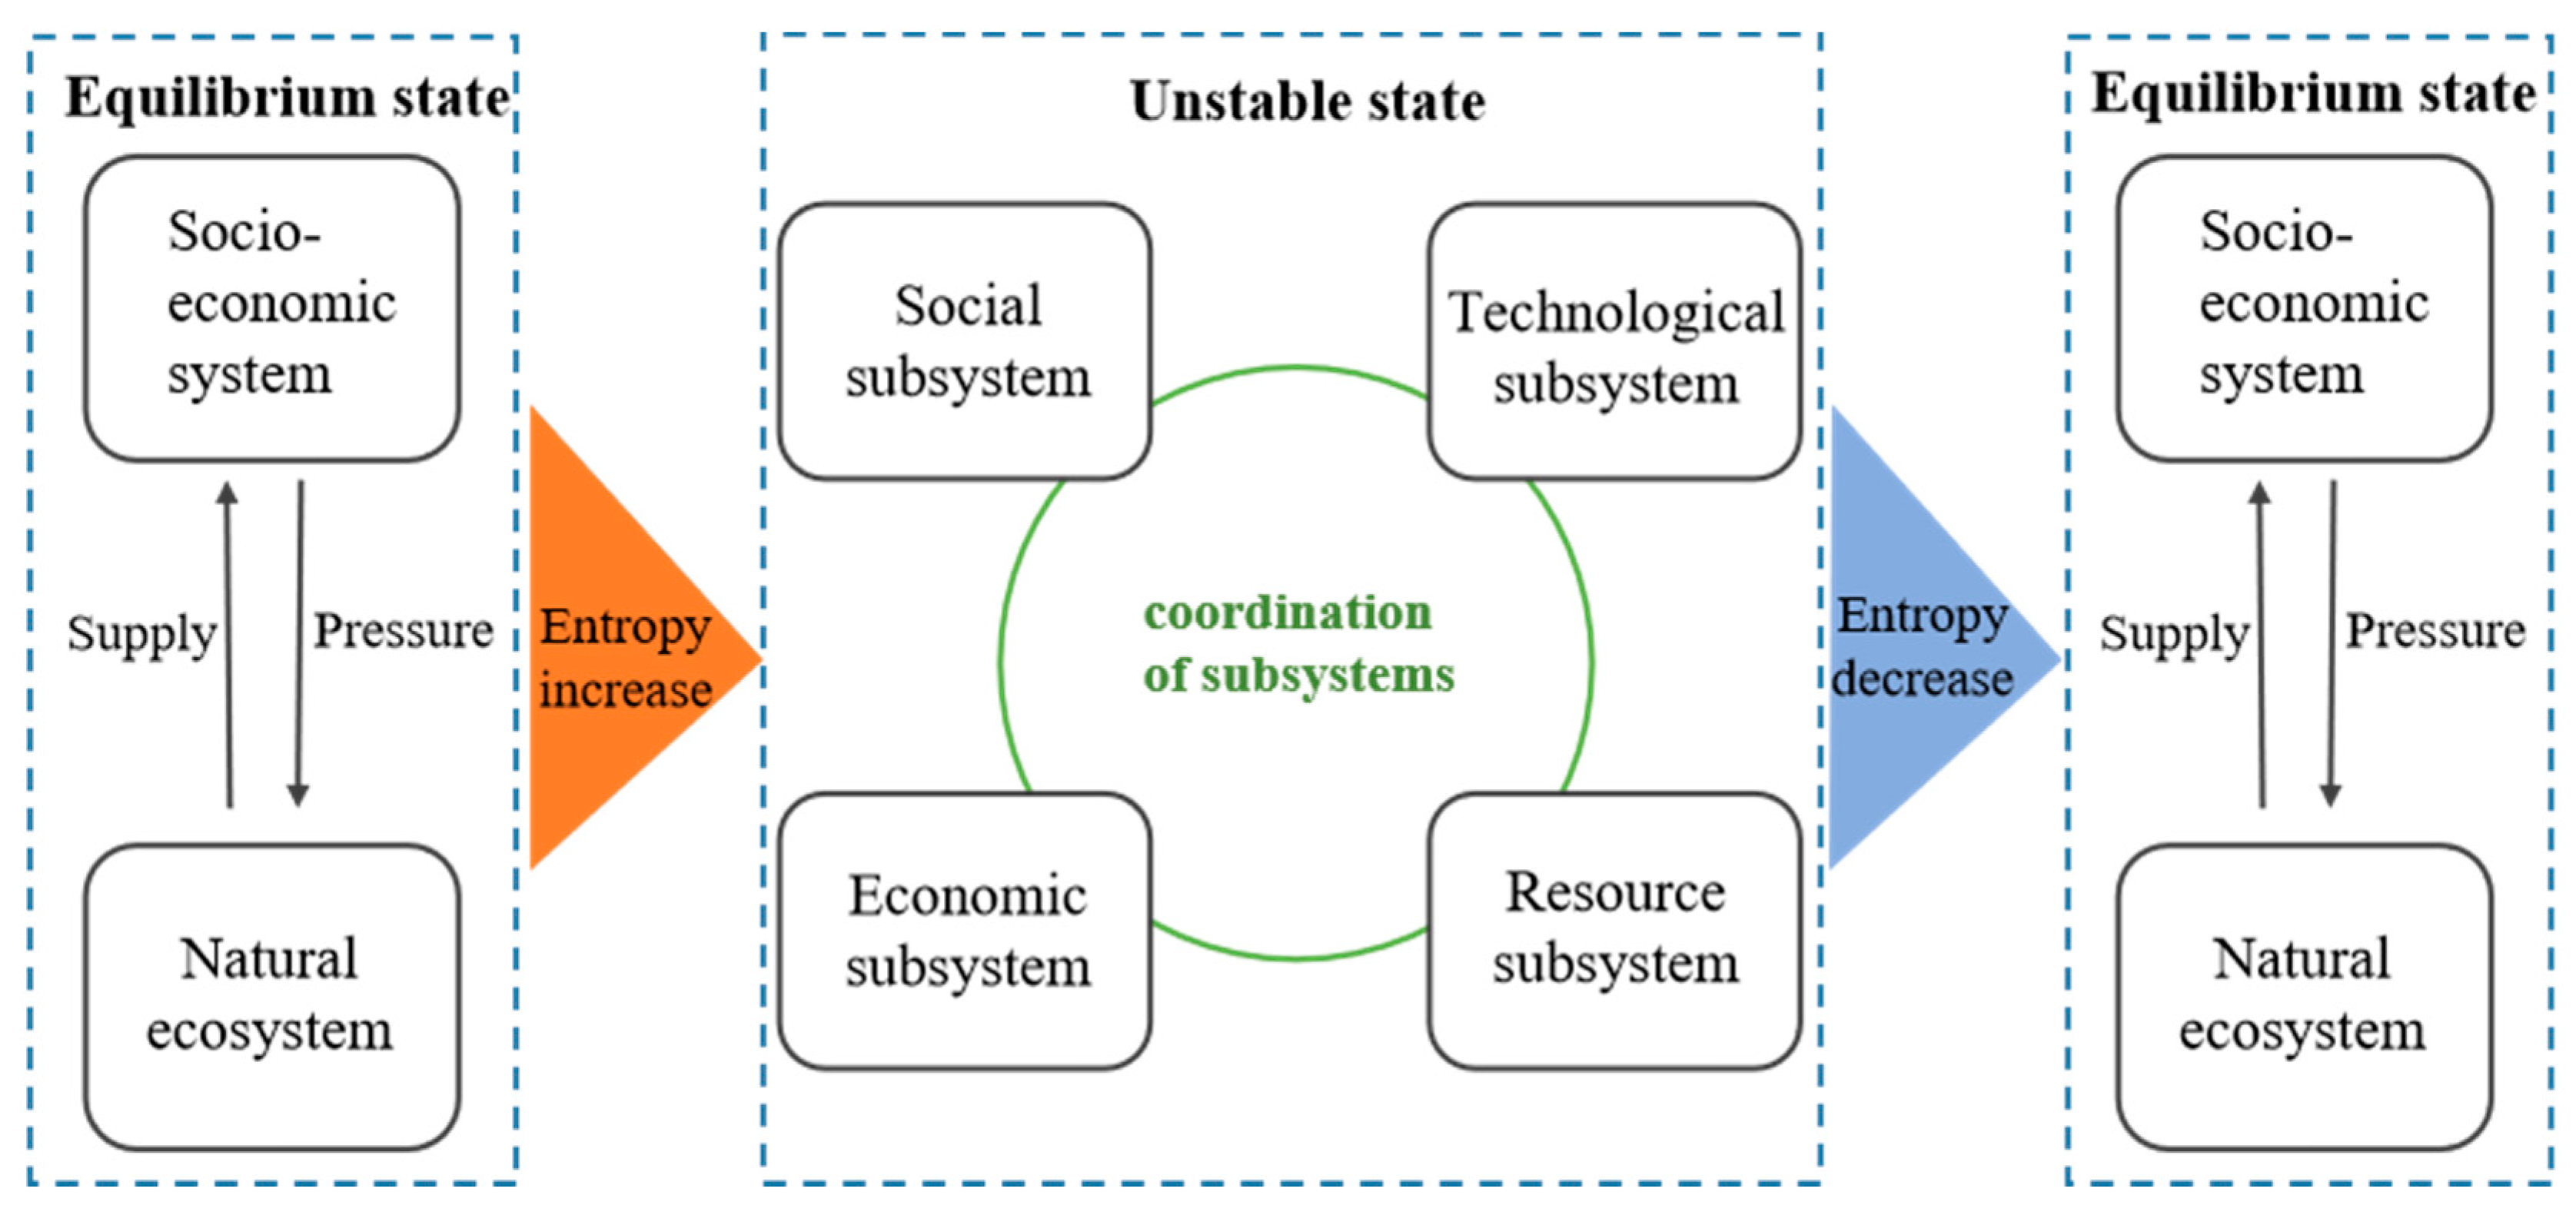
2.1.1. Framework of Sustainable Agricultural Development

The sustainable agricultural development system is an integral part of the overall agricultural system. It aims to achieve orderly and integrated continuous operation between various elements within the system and with the external environment [46,47,48]. It operates at multiple levels, encompassing individual farmers, farms, regional entities, and global considerations. Each level within the system possesses unique characteristics [49,50,51,52]. The core of this system lies in the interaction between natural ecosystems and socio-economic systems [53]. The natural ecosystem belongs to the agricultural ontology system and supplies fundamental societal support. The socio-economic system belongs to the leading agricultural body and exerts pressure on the natural ecosystem. Both of them determine the stability of the agriculture system.
This study establishes a theoretical framework for SADINC by applying the principles of agricultural sustainability and dissipative structure theory (Figure 1). The interaction between human activities and nature leads to an increase in entropy within the sustainable agricultural development system as the two develop at different speeds. This imbalance results in an unstable state within the agricultural system. The study identifies the coordination among subsystems such as economy, society, resources, and technology as the most critical factor influencing the SADIC. Sustainable agricultural development requires coordinating the relationships among these subsystems, enhancing system stability, and achieving the objective of entropy reduction. This will lead to the re-establishment of equilibrium within natural ecosystems and socio-economic systems.

2.1.2. Evaluation Index System Construction and Comprehensive Index Calculation

This study established an indicator system for sustainable agricultural development based on the aforementioned theoretical analysis. The indicator system comprises three layers: target layers, criterion layers, and indicator layers. The target layer encompasses sustainable agricultural development, while the criterion layer consists of four levels: economic, social, resource, and technology. Building upon previous research, a set of 13 indicators has been formulated for the indicator layer in Table 1. To be specific, (1) the agricultural output value reflects agricultural activities’ overall scale and results. The growth of gross agricultural production signifies an increase in agricultural output [54]. (2) The average per capita net income of farmers is a crucial indicator for measuring rural economic development and farmers’ living standards. Farmers are the main body of agricultural production [55]. Increasing their per capita net income can enhance their enthusiasm and investment in agricultural activities, directly impacting economic development [56]. (3) The land productivity reflects the agricultural output value per unit of land area. Increased land productivity implies that higher agricultural output and economic benefits can be achieved under the same land resource conditions, thus promoting rural economic development [57]. (4) The total food production reflects the agricultural production’s overall scale and output level, measuring a region’s agricultural production capacity [58]. Increasing grain production can lead to a higher agricultural output value and facilitate economic growth. (5) The urbanization rate reflects the proportion of permanent residents in urban regions to the total population. This indicator is crucial for assessing an area’s economic and social development [59,60]. An increase in urbanization signifies more people migrating from rural to urban areas, which helps narrow the gap between urban and rural and promotes social equality [61]. (6) The average housing area per capita in rural areas reflects the rural residents’ living conditions and environment. This indicator is closely related to the rural residents’ quality of life, living comfort, and environmental sanitation [62]. An increase in the per capita housing area in rural areas indicates improved living conditions and can enhance confidence in agricultural production. (7) The rural per capita electricity consumption reflects the level of rural electricity consumption and the availability of electricity facilities. Increased per capita electricity consumption in rural areas means that rural residents can improve their living conditions and increase agricultural production efficiency through a stable electricity supply [63]. (8) The land area for cultivation reflects the land size and agricultural production capacity. It is an essential resource for sustainable agricultural development. The stability of arable land resources determines the scale and potential of agricultural production [64]. (9) Effective irrigation reflects the condition of cultivated land with irrigation facilities that can carry out regular irrigation [65,66]. This indicator is crucial for measuring the sustainable utilization of agricultural water resources. Reasonable water resource management and the maintenance of irrigation facilities can improve water resource utilization efficiency and ensure the sustainable development of agricultural production. (10) The number of individuals employed in the agricultural sector reflects the number of people engaged in agricultural production activities. The quantity and quality of agricultural workers affect the utilization and management of agricultural resources [67]. (11) The intensity of fertilizer application reflects the amount and utilization efficiency of chemical fertilizers in agricultural production. An excessive use of chemical fertilizers may indicate poor or unreasonable agricultural production technology [68]. (12) The efficiency level of agricultural machinery reflects the efficiency in the agricultural mechanization production process. Improving the efficiency level of agricultural machinery can further enhance the degree of mechanization in the entire agricultural production process [69]. (13) The intensity of pesticide application reflects the amount and frequency of pesticide application in agricultural production. High-intensity pesticide use may indicate inadequate pest control techniques or imprecise application techniques [70].
This study adopted the entropy method [30] to determine the weight of each indicator. The entropy increase method objectively measures the significance of each indicator in the evaluation system by quantifying the degree of dispersion for each indicator. A higher dispersion indicates a more significant impact on the overall evaluation score, while a lower dispersion suggests a minor influence. Although the entropy weight method has certain limitations, such as its dependence on data quality and its inability to consider subjective feelings and value judgments, this approach ensures that the calculation results are more objective and accurate [71]. Additionally, the process of using the entropy weight method is relatively straightforward and allows for easy repeatability and verification. Then, this study employs the weighted summation method to compute the indices of the individual subsystems of agricultural sustainable development. Furthermore, the equal-weighted arithmetic average method calculates the comprehensive score for agricultural sustainable development. Finally, using the natural breakpoint method, we classified the agricultural sustainable development systems into four levels (Level I to Level IV) based on their indicator values, ranging from low to high. The calculation formula is as follows [72]:
X i = Σ j = 1 m w i j p i j  
F = Σ i = 1 n X i 4
where Xi is the evaluation index of each subsystem of sustainable agricultural development; F is the comprehensive index of the sustainable agricultural development system; wij represents the weight of the j indicator in the i subsystem; pij represents the standard value of the j indicator in the i subsystem; and n is the number of sustainable agricultural development subsystems.

2.1.3. Coupling Coordination Degree Analysis

This study adopted the coordination degree function to quantitatively assess the coordination status among different subsystems of sustainable agricultural development. The coordination degree function evaluates the level of coordination between various subsystems based on the distance and dispersion degree between them. The calculation formula is as follows:
C = Σ i = 1 n X i Σ i = 1 n X i 2
where C is the coordination degree; Xi is the evaluation index of each subsystem of sustainable agricultural development; and n is the number of sustainable agricultural development subsystems. A higher C value, closer to 2, indicates higher coordination among the four subsystems, and vice versa. This study also utilizes the natural breakpoint method to classify the degree of coordination for sustainable agricultural development into four levels: level I, level II, level III, and level IV, ranging from low to high.

2.1.4. Exploratory Spatial Data Analysis Methods
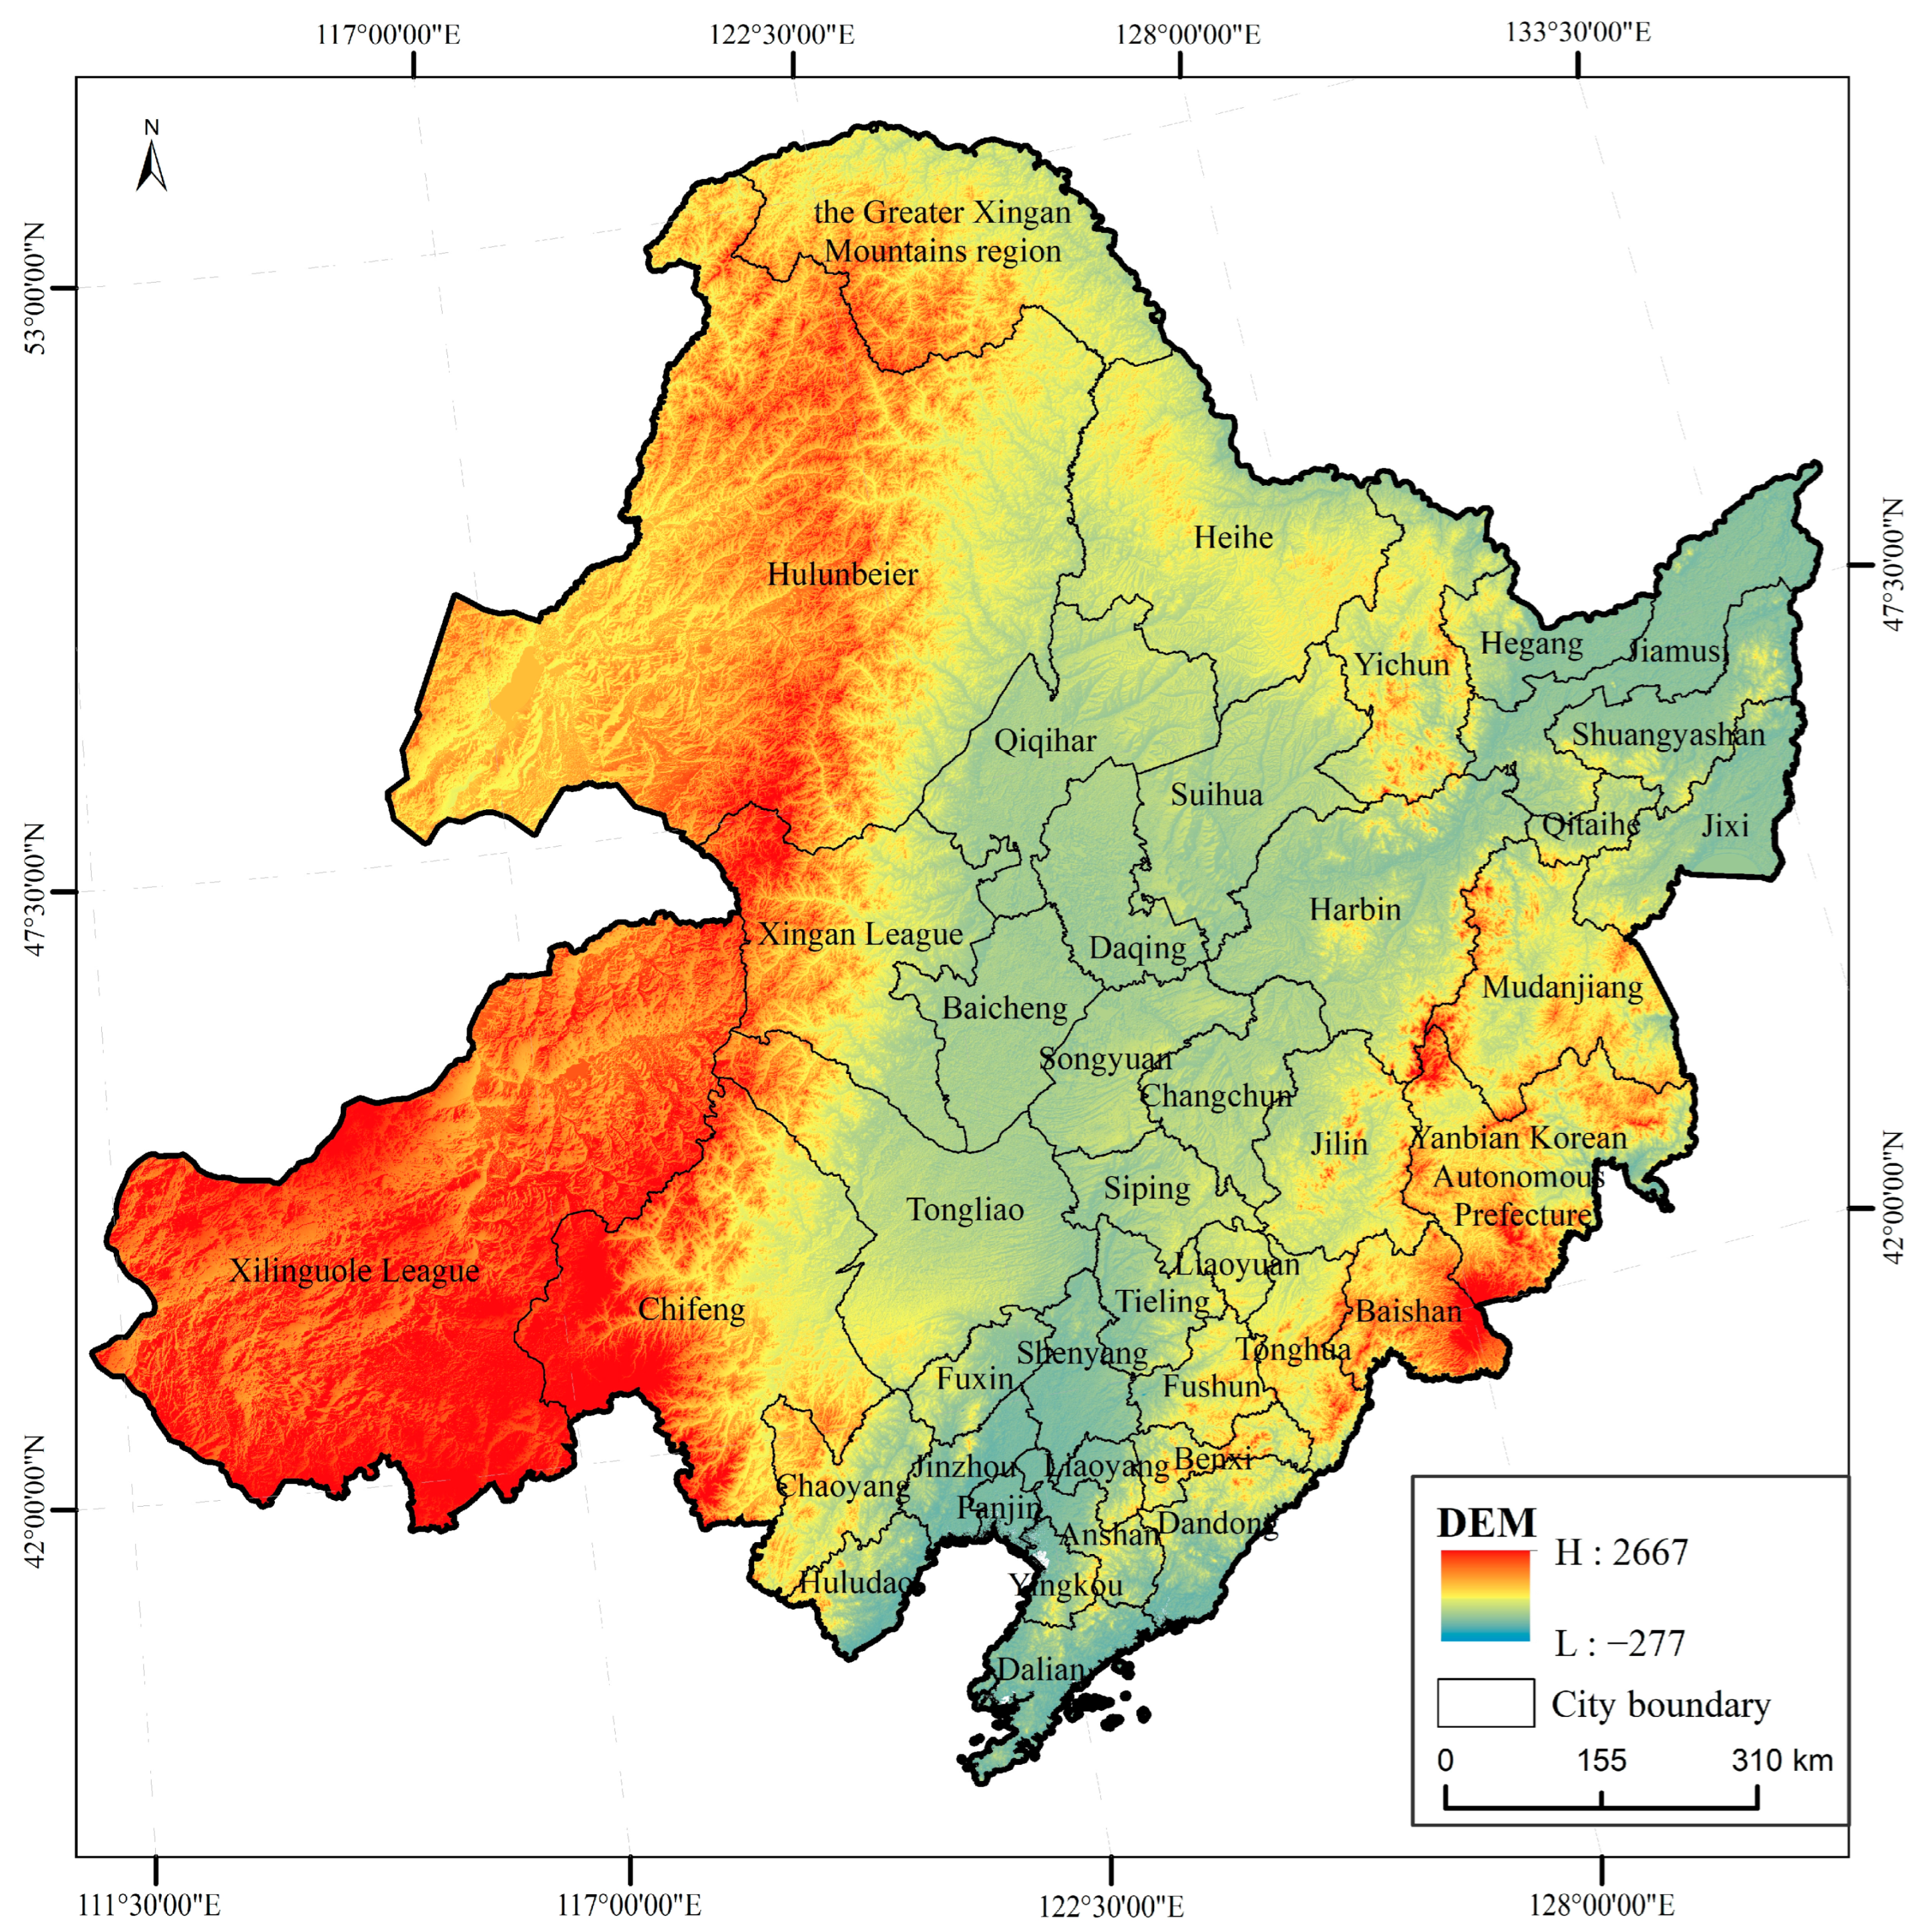
Exploratory spatial data analysis (ESDA) is a vital tool for examining the correlation between attribute values of elements and their adjacent spatial attributes by revealing regional structural characteristics of spatial variables. A positive correlation indicates similar trends among adjacent research units, while a negative correlation indicates opposite trends.
This study focuses on the northeastern region as the research unit, combining ESDA theory with GIS technology to investigate the spatiotemporal evolution characteristics of sustainable agricultural development. The study utilizes Moran’s I index (Global Moran’s I and Local Moran’s I) statistics of the subsystem to analyze spatial differences in the pattern of sustainable agricultural development. Global Moran’s I index measures the overall spatial dependence of a region. In contrast, Local Moran’s I index measures the degree of spatial agglomeration between each region and its surrounding regions. The Z-test method was employed in this study to perform a statistical test on Moran’s I index. The calculation formula is as follows [73]:
G l o b a l   M o r a n s   I = n Σ i = 1 n Σ j = 1 m w i j x i x ¯ x j x ¯ Σ i = 1 n Σ j = 1 m w i j Σ i = 1 n x i x ¯ 2
  L o c a l   M o r a n s   I = x i x ¯ S 2 Σ j = 1 m w i j x j x ¯ = Z i Σ j = 1 m w i j Z j
S = Σ j = 1 m x j x ¯ 2 n 1
Global Moran’s I ∊ [−1, 1], Global Moran’s I > 0 indicates that the area is aggregated. Global Moran’s I < 0 indicates that the area is discretely distributed. Global Moran’s I = 0 means that the area is randomly distributed. A larger absolute value of Local Moran’s I indicates a higher spatial correlation in sub-region i. In the above equations, n is the number of research subjects, and wij is the spatial connection matrix between research objects i and j. Zi and Zj represent the standardized values of a specific attribute for the research unit and adjacent units, respectively.

2.2. Research Area

Northeast China (Figure 2) is located at the confluence of the Northeast China Plain, the Changbai Mountains, the Greater Khingan Mountains, and the Lesser Khingan Mountains, comprising the five league cities in China’s Inner Mongolia Autonomous Region and the 36 municipalities in Liaoning Province, Jilin Province, and Heilongjiang Province. A diverse and complex environment, with a mixture of mountains, plains, plateaus, and river valleys, characterizes the natural geography of Northeast China. These landforms create a unique landscape, with mountains surrounding the region in the east, west, and north, while the central area is relatively low and flat.
Northeast China experiences a climate characterized by long and frigid winters, hot and rainy summers, and relatively short spring and autumn seasons. Precipitation in this region ranges from 400 mm to 800 mm, with rainfall predominantly occurring from July to September. The unique climate, characterized by rain and heat during this period, has given rise to one of the world’s four black soil belts in Northeast China. Due to its favorable climate and soil conditions, this region holds significant agricultural production potential and is considered an ideal area for sustainable agricultural development in China. The predominant planting system in Northeast China is field planting, with a single crop cultivated yearly. The main crops in this region include corn, rice, soybeans, and others [74]. As of 2020, the agricultural sector in Northeast China employed 30.6 million individuals, with a total agricultural output value of 821.3 billion yuan, representing 10% of the national agricultural output value. Furthermore, grain production in Northeast China reached 164 million tons, accounting for approximately 24.6% of the country’s total output. Northeast China plays a crucial role in ensuring the country’s food security.

2.3. Data Sources

This study focuses on the comprehensive assessment of SADINC from 2000 to 2020, utilizing 13 specific indicators. These indicators include the comprehensive sustainable agricultural development index, four subsystem indexes, and the coordination index. The primary data sources for the indicator system are “Longjiang Sixty Years (1949–2009)”, “Take-off Inner Mongolia (1949–2009)”, “Ningcheng Statistical Yearbook”, “China Regional Economic Development Statistical Yearbook”, “Nanning Statistical Yearbook”, “China Cities Statistical Yearbook”, as well as the provincial (municipal and autonomous region) “National Economic and Social Development Statistical Bulletin” and respective statistical yearbooks. The China Economic and Social Big Data Research Platform (https://data.cnki.net/home, accessed on 2 October 2023) was also used as a data source. Spatial data, including administrative division and DEM data, were obtained from the geospatial data cloud platform (https://www.gscloud.cn/home, accessed on 4 September 2023). The following process was conducted to attain data harmonization and ensure comparability across diverse data sources.
Firstly, the linear interpolation method was utilized to fill in missing values. The descriptive statistics are presented in Table 2. Secondly, this study integrated the statistical yearbook data with the administrative division data using the ArcGIS platform, assigning spatial attributes to each municipal administrative unit. Figure 3 illustrates the fluctuations of indicators in SADINC at five-year intervals from 2000 to 2020. The use of pesticides and chemical fertilizers in Northeast China is declining. The number of individuals employed in the agricultural sector has little change, and other economic, social, resource, and technical indicators show an upward trend. This is in line with the characteristics of agricultural sustainability [75].

3. Results

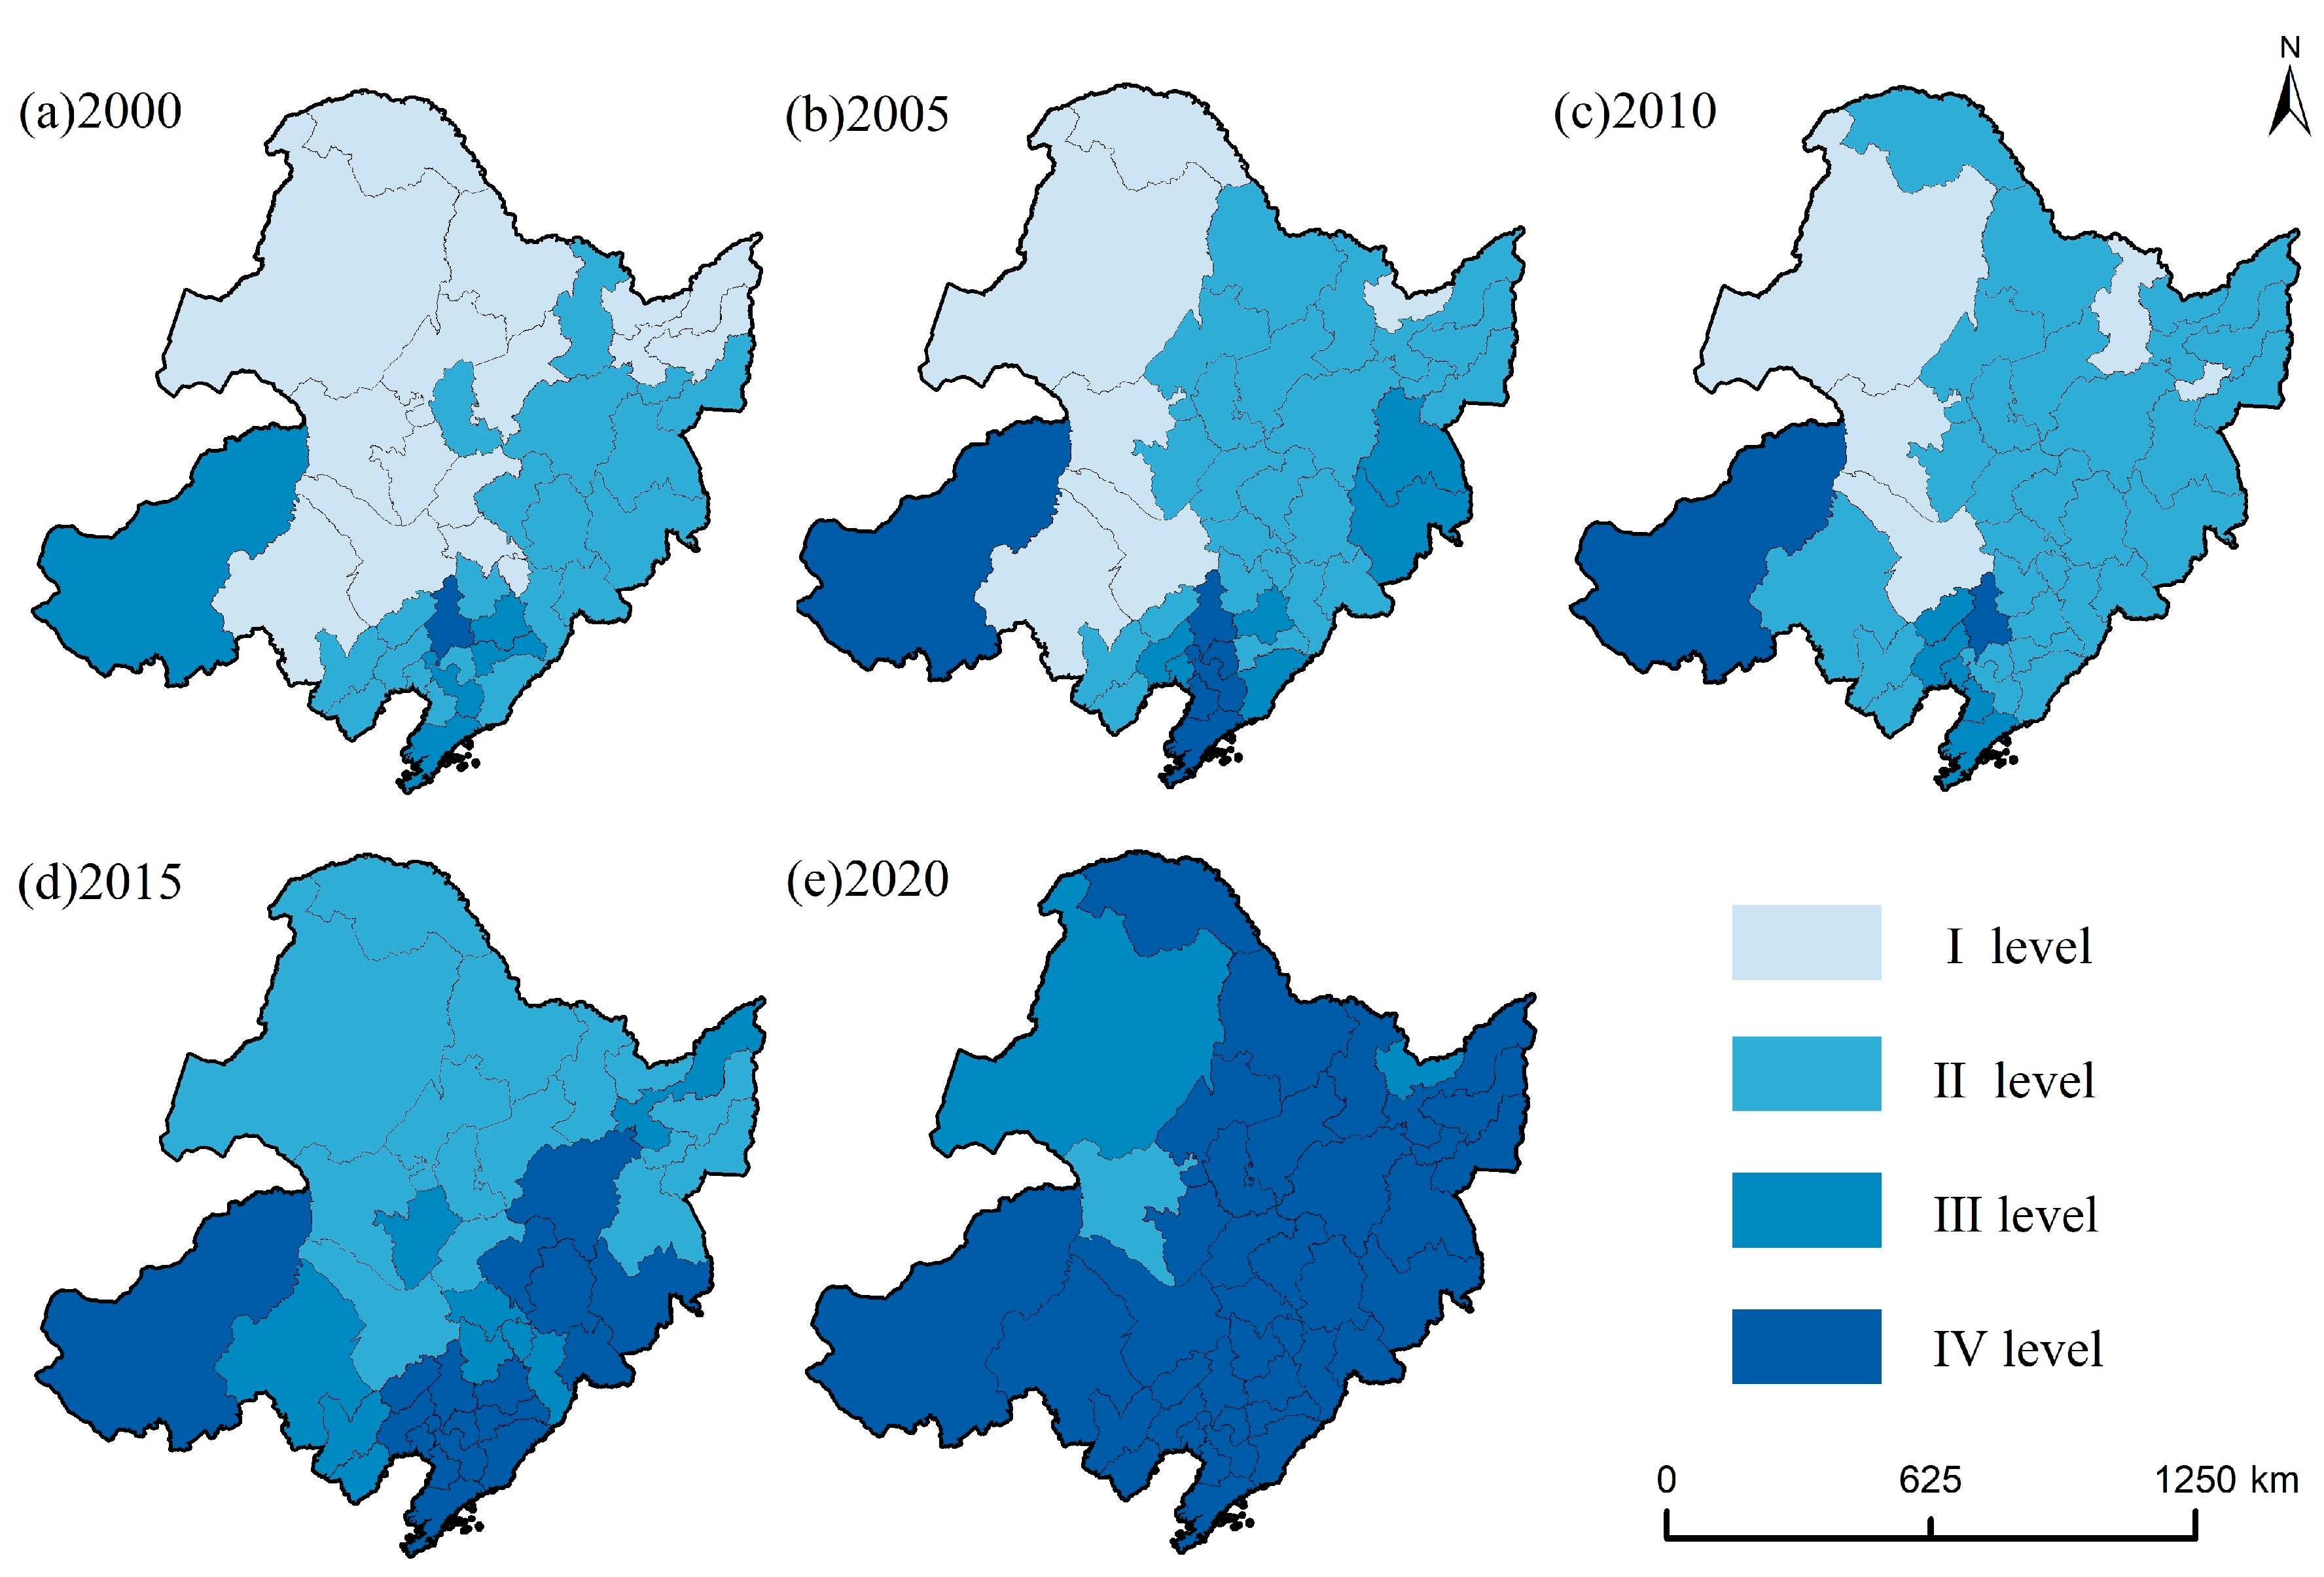
3.1. Evolutionary Characteristics of Agricultural Sustainable Pattern

3.1.1. Agricultural Sustainable Development System

From 2000 to 2020, the urban sustainable agricultural development index varied between 0.001 and 0.016 in Northeast China. The average values were 0.002, 0.004, 0.004, 0.006, and 0.008 for 2000, 2005, 2010, 2015, and 2020, respectively. Over the past two decades, the sustainable agricultural development index of 41 cities in Northeast China has exhibited a general upward trend. Specifically, the sustainable agricultural development index of 37 cities has been consistently increasing. Four cities, mainly in Liaoning Province and some in the western part of Jilin Province, have shown a fluctuating trend characterized by initial decline followed by subsequent growth. On the whole, Northeast China demonstrates a relatively high level of sustainable agricultural development.
Figure 4 shows the notable regional differentiation characteristics of SADINC. Level III and Level IV are primarily concentrated in regions with high agricultural sustainability, such as the Northeast Plain and the black soil belt in Northeast China. The agricultural sustainability level in the Eastern Five Leagues, namely, Xilinguole League, Xingan League, Hulunbeier City, Chifeng City, and Tongliao City in the Inner Mongolia Autonomous Region, has significantly improved since 2010. The increased cultivated land area and grain production in these regions have greatly improved the sustainable agricultural development index. On the other hand, Level I and II areas with low sustainable agricultural development are mainly found in the Greater and Lesser Khingan Mountains in the northwest and the Changbai Mountains in the east. Mountainous and hilly terrains characterize these regions.
Over the past two decades, Level III and IV cities have increased by 7 and 28, respectively. In contrast, the number of cities in Level I and II has decreased by 31 and 4, respectively. Overall, there has been a shift from an agglomeration of low-level sustainable agricultural development to high-level sustainable agricultural development. Generally, areas with favorable geographical conditions, well-developed agricultural infrastructure, and a robust implementation of cultivated land protection systems have demonstrated higher agricultural production efficiency, resource utilization rate, social equity, and technology utilization rate during sustainable agricultural development. These areas exhibit a relatively high level of sustainable agricultural development.

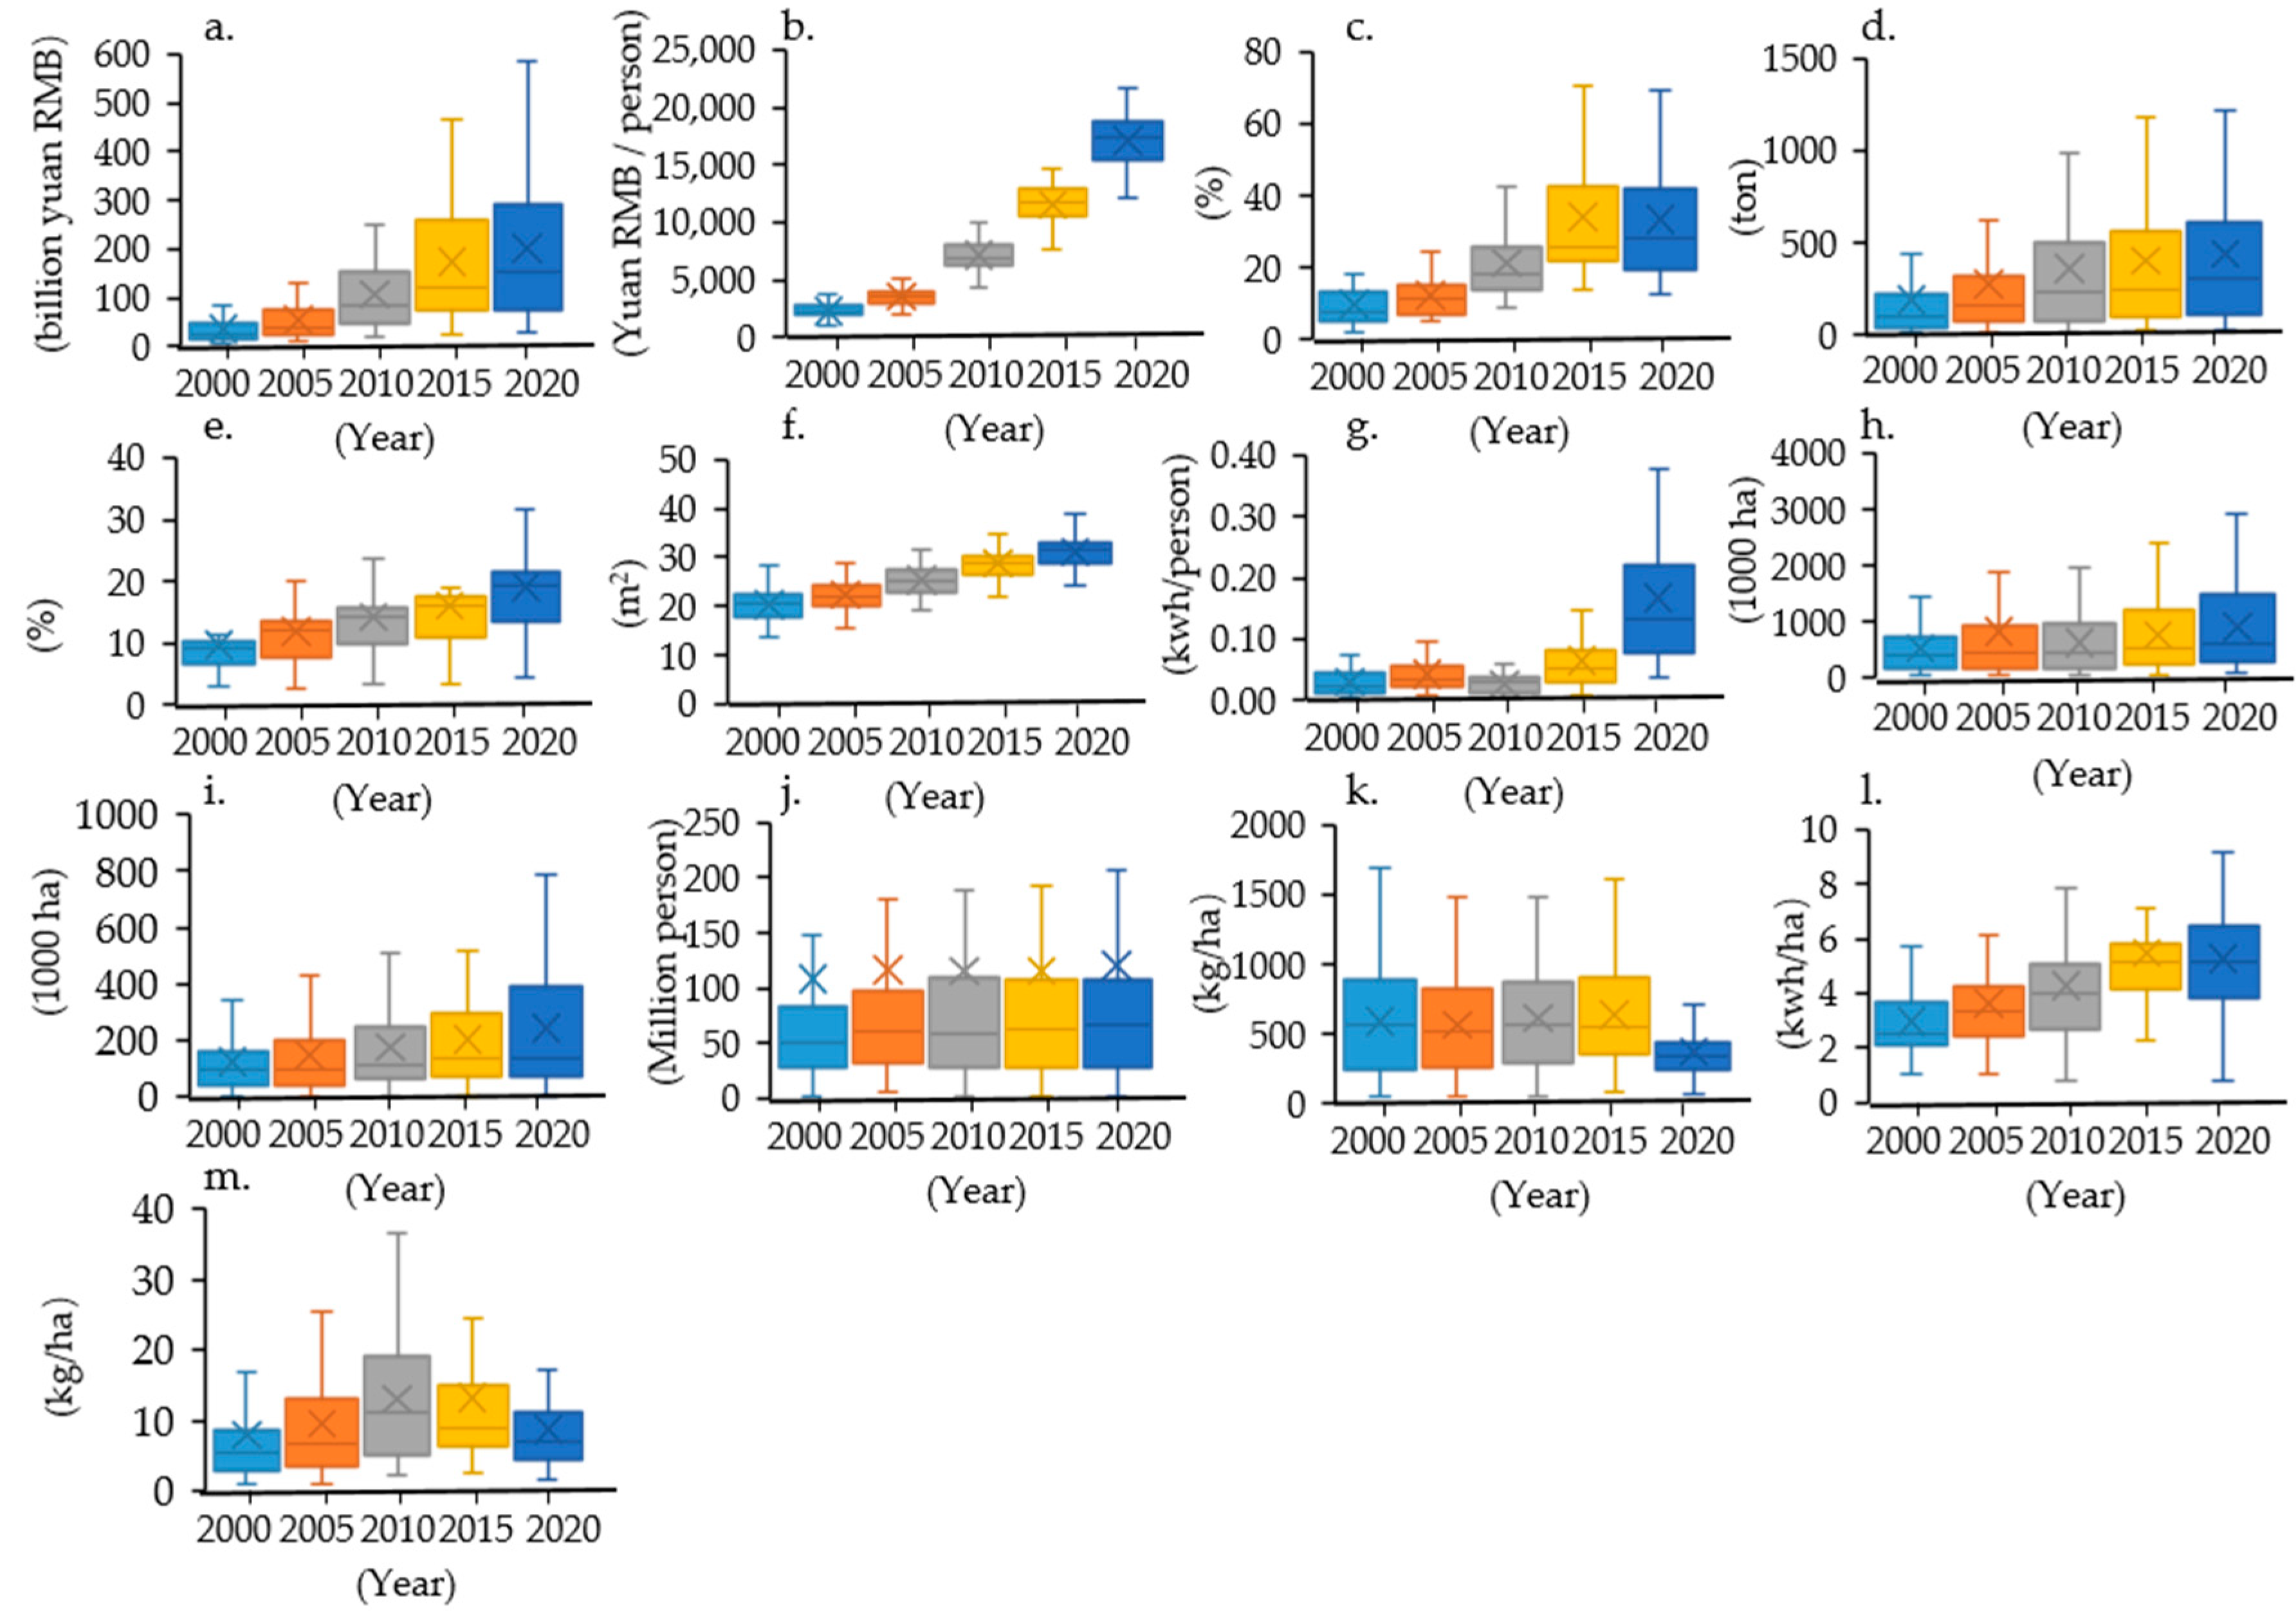
3.1.2. Economic Subsystem

From 2000 to 2020, the urban sustainable agricultural development economic index ranged from 0.000 to 0.009 in Northeast China. The average index was highest in 2020 and lowest in 2005. The sustainable agricultural development economic index was 0.004 and 0.001, respectively. Over the past 20 years, the sustainable agricultural development economic index of 41 cities has shown an upward trend. However, ten cities experienced a decline in the index in 2005, 2015, and 2020, with the most significant number of cities declining in 2020. More than half of the cities with a declining sustainable agricultural development economic index were in Jilin Province. Overall, the economy of SADINC has generally increased.
Figure 5 shows that the urban sustainable agricultural development economic index at level IV is primarily concentrated in the black soil region of the Northeast Plain. The number of urban areas with sustainable agricultural development economic index was 0, 0, 3, 11, and 16 in 2000, 2005, 2010, 2015 and 2020, respectively. In 2020, there was a noteworthy rise in the number of level II and level III cities compared to 2000, with an increase of 6 and 14, respectively. However, there was a significant decline in the number of level I cities, dropping from 37 in 2000 to just 1. Overall, grain output in the northeastern black soil area has significantly increased thanks to favorable farming conditions, which have played a crucial role in promoting the advancement of sustainable agricultural economic development.

3.1.3. Social Subsystem

From 2000 to 2020, the urban sustainable agricultural development social index ranged from 0.000 to 0.007 in Northeast China. The average index was highest in 2020 and lowest in 2000. The sustainable agricultural development social index was 0.002 and 0.001, respectively. Over the past two decades, the sustainable agricultural development social index of 41 cities in Northeast China has shown a consistent upward trend. However, there were significant changes between 2005 and 2010. Some cities experienced a decline in the eastern part of Northeast China. Nevertheless, these cities have experienced varying degrees of recovery in the following ten years. Overall, the society of sustainable agricultural development in Northeast China has been generally improving despite some fluctuations.
Figure 6 shows apparent variations in the spatial distribution of changes in agricultural social sustainability. Specifically, the number of cities in Level IV has increased by 37 from 2000 to 2020. The sustainable agricultural development social index has experienced a significant enhancement in the east and south regions. In contrast, the number of cities in Level I has decreased by 15 during the same period. Overall, social and economic development has dramatically improved rural social welfare equity in Northeast China, resulting in a higher level of sustainable development in rural society.

3.1.4. Resource Subsystem

From 2000 to 2020, the urban sustainable agricultural development resource index ranged from 0.000 to 0.011 in Northeast China. The average index was highest in 2020 and lowest in 2000. The sustainable agricultural development resource index was 0.006 and 0.001, respectively. Over the past two decades, the sustainable agricultural development resource index has increased among 38 cities. Specifically, 13 cities witnessed a significant increase of more than 0.001. However, three cities experienced negative growth in Liaoning Province: Benxi City, Yingkou City, and Liaoyang City. The expansion of urbanization and soil erosion have significantly impacted the cultivated land area and effective irrigation area in these three cities. As a result, there has been a decrease in these areas, while the number of agricultural employees has continued to rise. This situation has resulted in a low level of resource utilization efficiency in these areas and a decline in the sustainable agricultural development resource index. Overall, the resource of SADINC has generally been improving.
Figure 7 shows that the sustainable agricultural development resource index in level IV cities primarily concentrated in the central and western regions of the study area, indicating an agglomeration distribution from 2000 to 2020. The sustainable agricultural development resource index in the urban areas of Level IV was 2, 5, 7, 8, and 14 in 2000, 2005, 2010, 2015, and 2020, respectively. Over the past 20 years, there has been a significant increase in the number of cities in Level IV, with a growth of 12. The number of cities in Levels I, II, and III decreased by 6, 2, and 4, respectively. Overall, the construction of high-standard farmland has positively impacted the utilization efficiency of cultivated land and population resources in the Northeast Plains and the western region of the Greater Khingan Mountains, resulting in a significant enhancement of the sustainable level of agricultural resources.

3.1.5. Technology Subsystem

From 2000 to 2020, the urban sustainable agricultural development technology index ranged from 0.000 to 0.001 in Northeast China. The average index was highest in 2020 and lowest in 2000. The sustainable agricultural development technology index was 0.0004 and 0.0002, respectively. Over the past 20 years, the sustainable agricultural development technology index of 40 cities has increased, with 28 cities experiencing an increase more significant than 0.0001. However, Huludao City in Liaoning Province has experienced negative growth. The negative trend can be attributed to the planting structure adjustment, particularly the shift towards the large-scale cultivation of vegetables and other cash crops. This change has led to a decrease in the utilization of agricultural machinery power, resulting in a decline in the sustainable agricultural development technology index. Despite this, it is essential to note that the overall technology of SADINC has been generally on the rise.
Figure 8 shows the significant differentiation in sustainable agricultural technology development from 2000 to 2020. In comparison to 2000, there was a decrease of 25 in the number of level I cities in 2020, while the number of level II cities remained unchanged. Additionally, there was an increase of 13 in the level III cities and 12 in the level IV cities. Notably, some cities in Jilin Province and Liaoning Province in the southeast, as well as Xilinguole League and Tongliao City in the west, have significantly improved their technological sustainability capabilities. Overall, implementing the black soil conservation farming action has indeed led to an enhancement in the overall level of agricultural mechanization in Northeast China, a reduction in the use of chemical fertilizers and pesticides, and an improvement in the sustainability of agricultural technology. The southeastern and western regions have particularly shown prominent advancements in this regard.

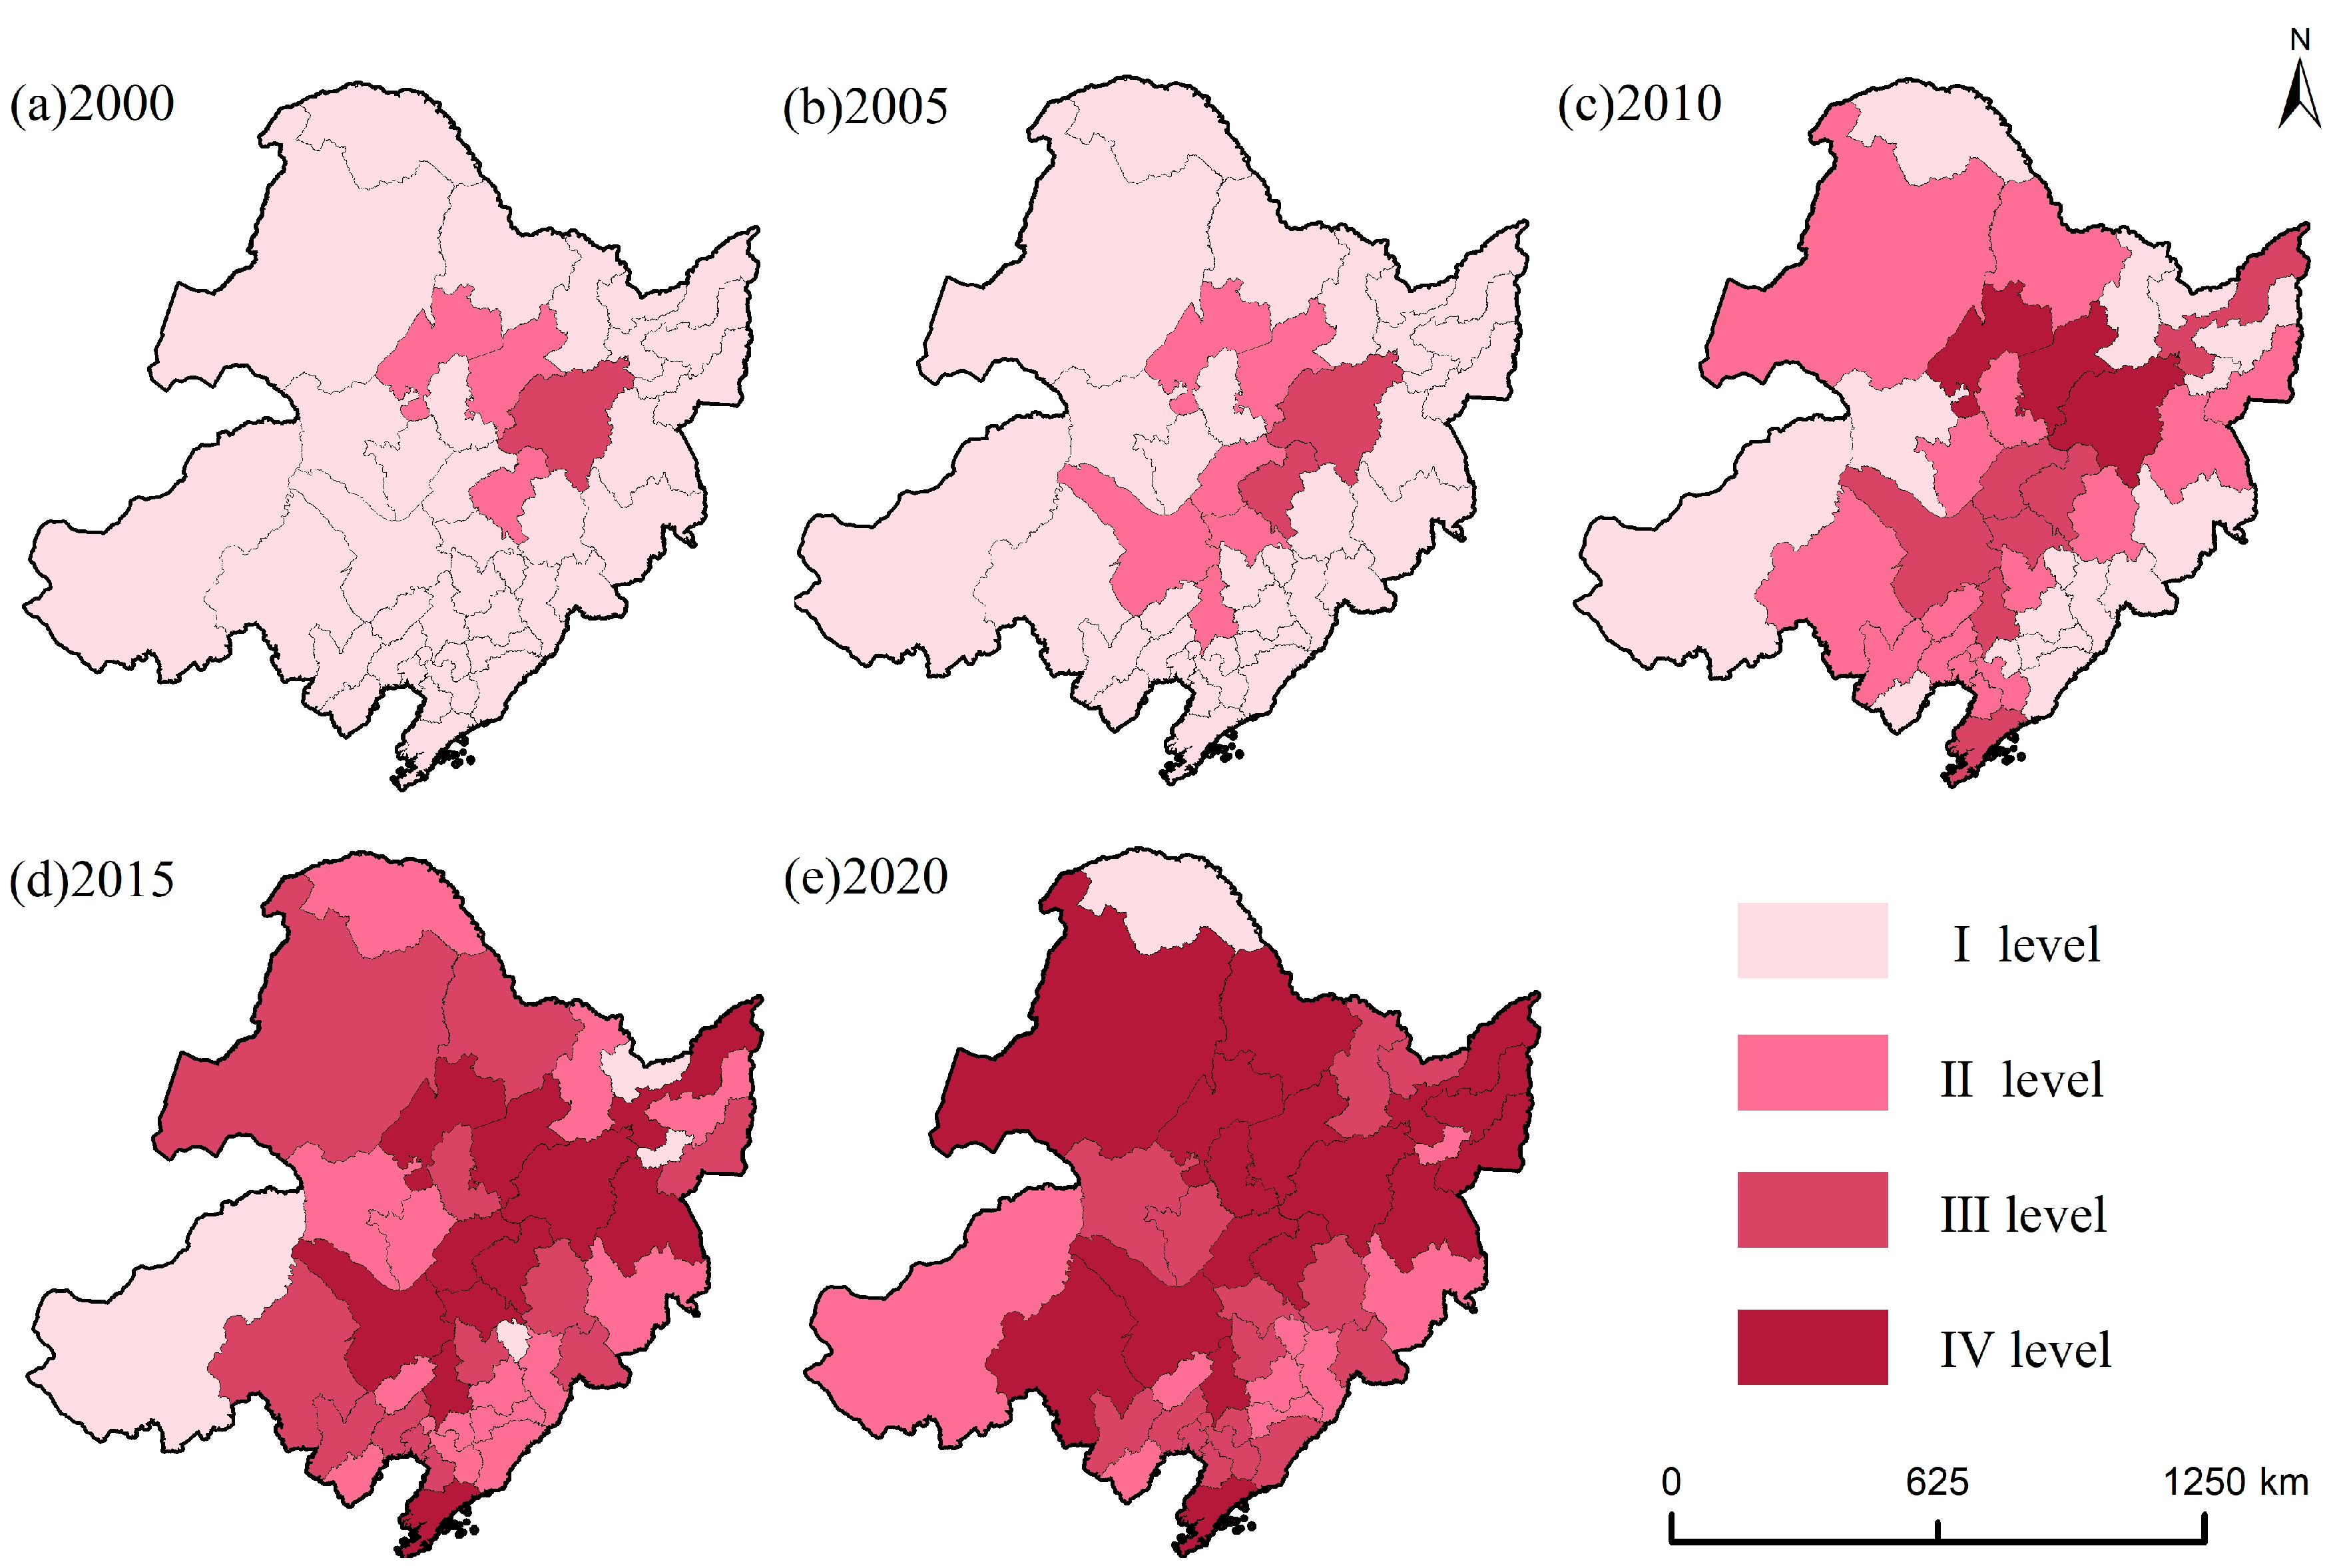
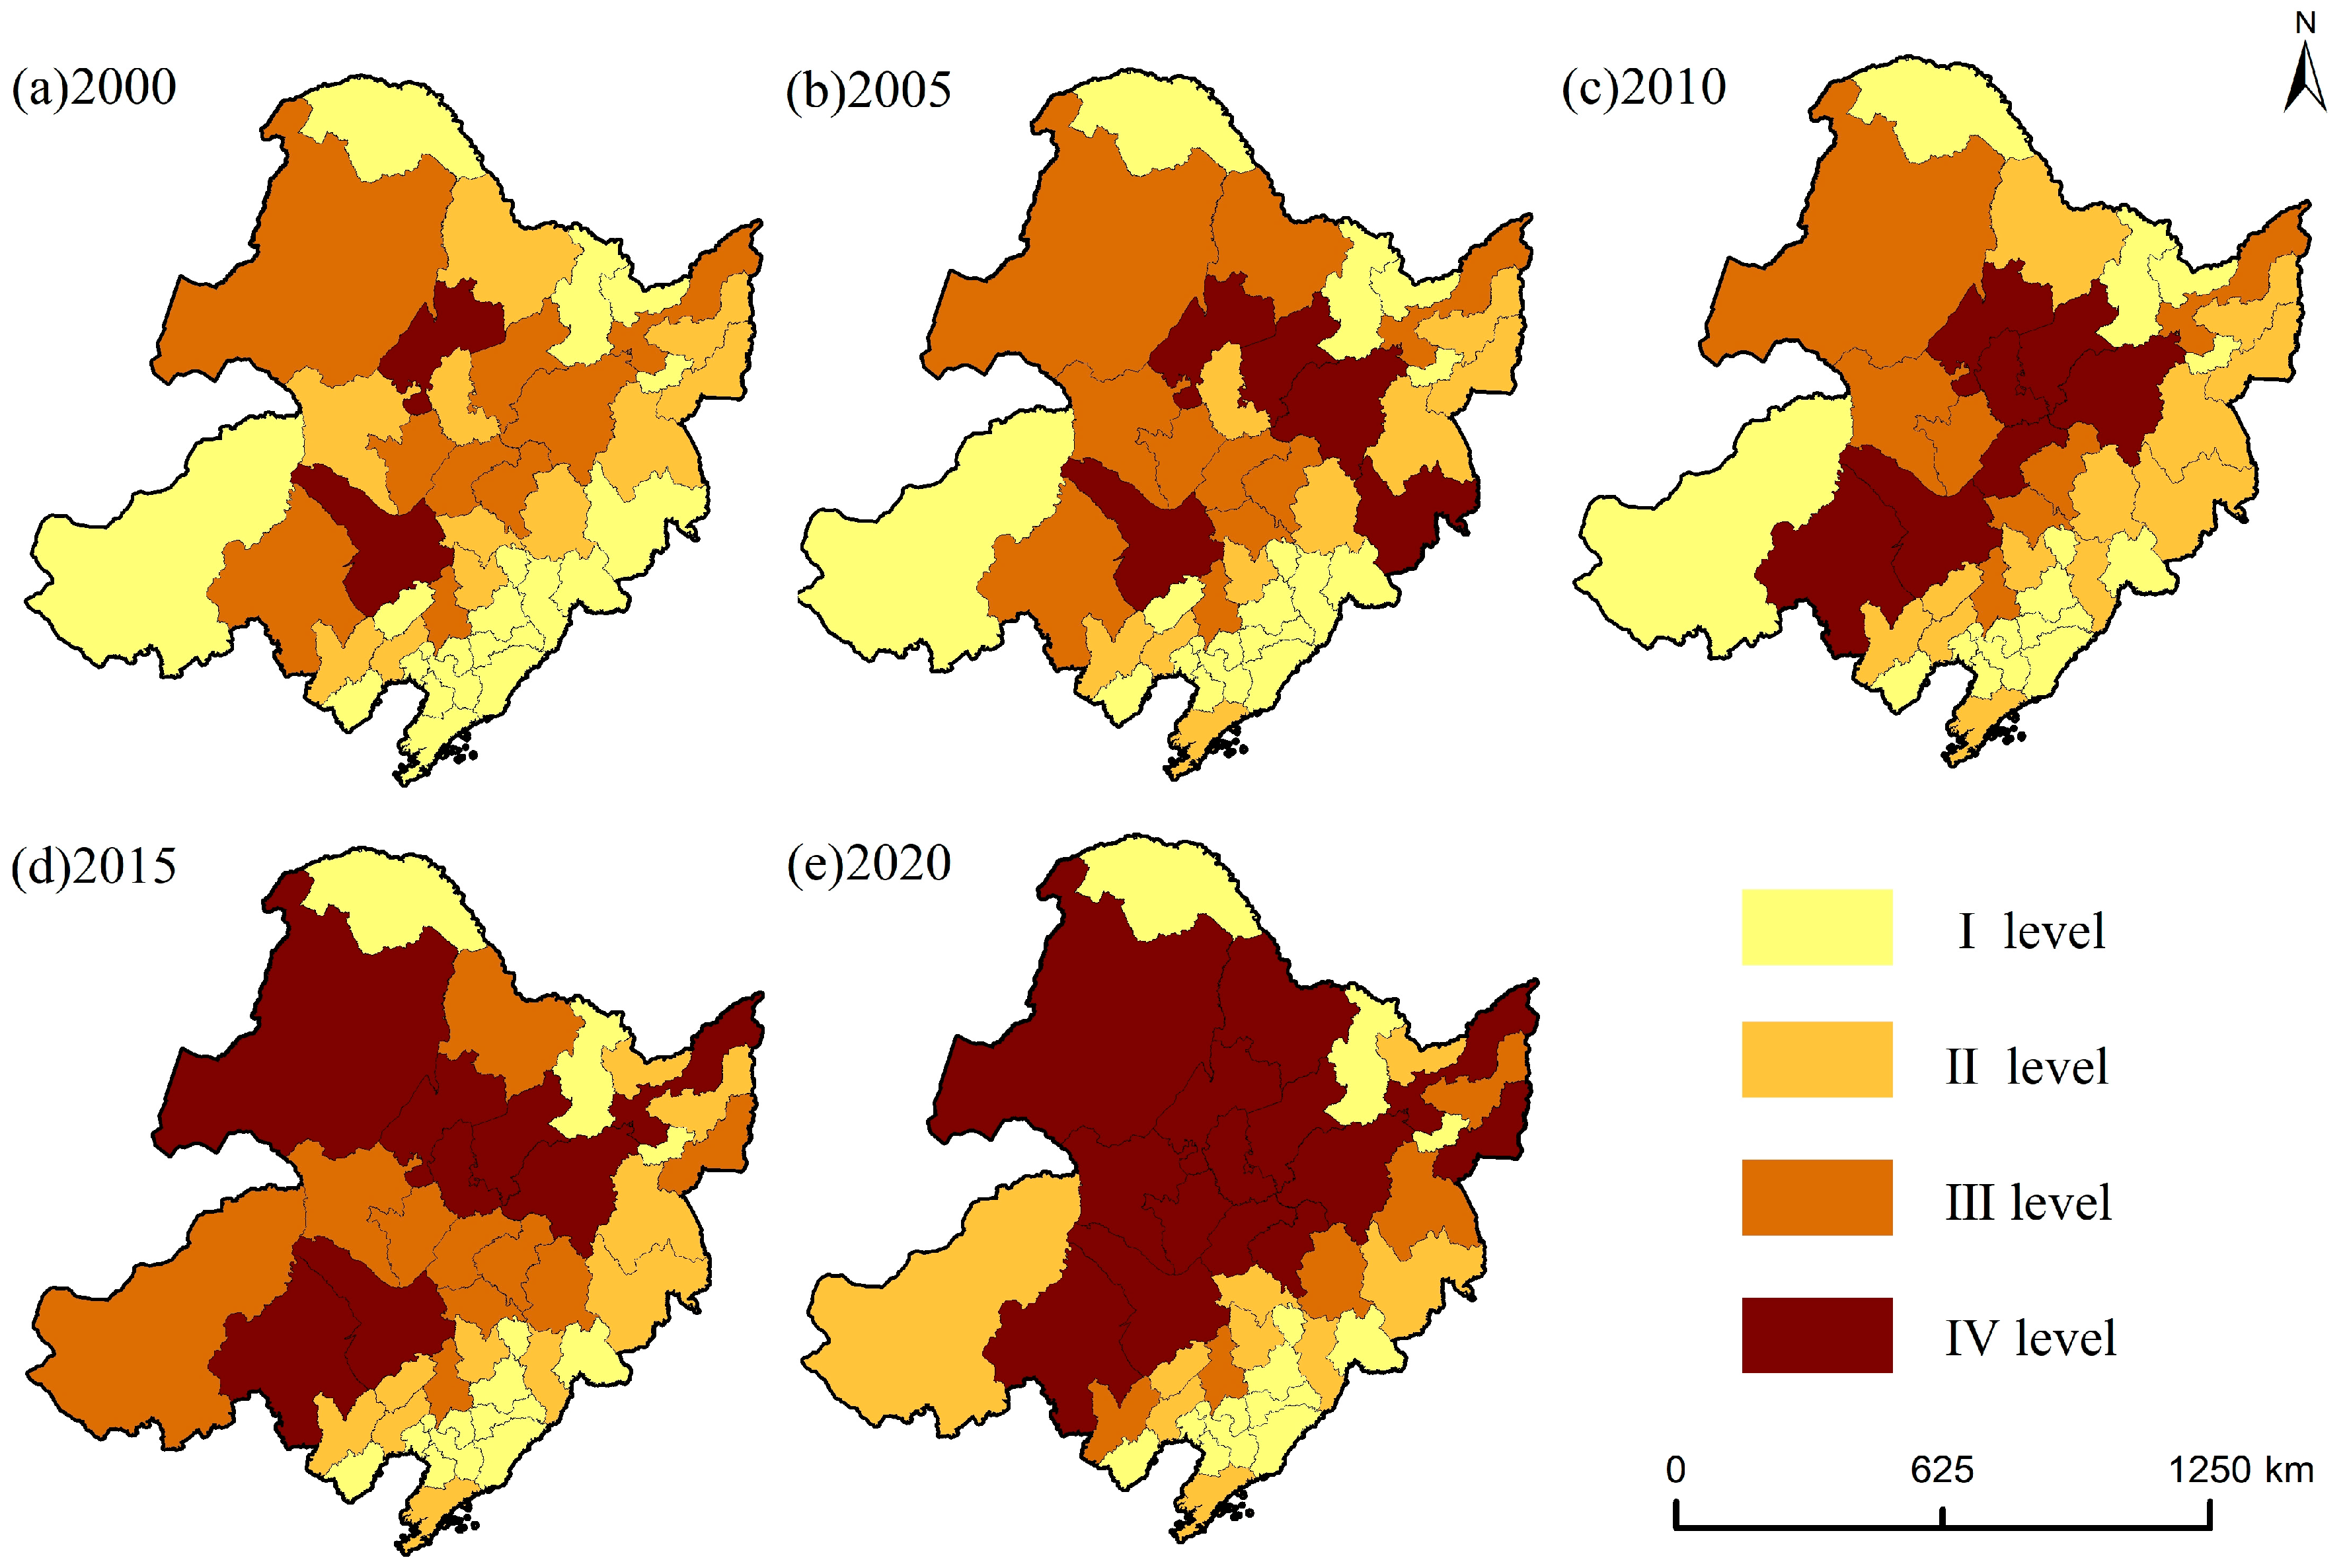
3.2. Coordination Degree of Sustainable Agricultural Development System

From 2000 to 2020, the average coordination degree decreased from 1.736 to 1.639, indicating an overall downward trend (Figure 9). The coordination degree in the urban of level I and II was 12, 14, 14, 20, and 22 in 2000, 2005, 2010, 2015, and 2020, respectively. The coordination degree in the urban areas of level III was 3, 0, 8, 9, and 11 in 2000, 2005, 2010, 2015, and 2020, respectively. The coordination degree in the urban areas of level IV was 26, 27, 19, 12, and 8 in 2000, 2005, 2010, 2015, and 2020, respectively. Overall, the coordination degree has remained mainly at a high level from 2000 to 2020. However, the number of cities in level IV decreased by 18, while that number in levels I and II increased by 10.
The distribution of coordination degree shows that cities in level III and level IV have transitioned from a concentrated distribution in the east to a dispersed distribution in the central and western regions. The cities in level I and II are concentrated from the southwest to the southeast. These changes may be attributed to the relatively low-performance index of the four subsystems (economy, technology, resources, and technology) in the eastern region 20 years ago, which exhibited a high level of coordination degree. With the advancement of social technology and the implementation of black land protection measures, the index of the four subsystems in the central region increases simultaneously, enabling the efficient transfer of the urban area to the central region with a high coordination degree. Additionally, over the past 20 years, the rigorous implementation of the cultivated land protection system in Northeast China has significantly enhanced grain production, resulting in a rapid increase in the economic and resource index compared to the social and technical index. This led to the cities exhibiting low spatial coordination in the northeast region. Hence, while the sustainable agricultural development index in Northeast China is high, there is still a need to enhance the coordination degree among subsystems.

3.3. Spatiotemporal Agglomeration Characteristics of Sustainable Agricultural Development

3.3.1. Global Autocorrelation Analysis

Moran’s I value of the global autocorrelation coefficient was calculated to analyze the spatiotemporal evolution trend of SADINC. Table 3 indicates the presence of spatial agglomeration among the subsystems of sustainable agricultural development. However, the overall spatial correlation of sustainable agricultural development is weak, showing no clear patterns of aggregation or dispersion.
In the economic subsystem, Moran’s I values range from 0.065 to 0.120 from 2000 to 2020, all passing the Z value significance test. There is a gradual increasing trend in Moran’s I values over time, indicating an increasing spatial correlation in the economic subsystem. The value suggests that economic activities are becoming more spatially clustered.
In the social subsystem, Moran’s I values ranged from 0.218 to 0.317 from 2000 to 2020, all passing the Z value significance test. Moran’s I values in the social subsystem are larger compared to the economic subsystem. The value indicates a stronger spatial correlation in the social subsystem than in the economic subsystem, suggesting an agglomeration tendency.
In the resource subsystem, Moran’s I values ranged from 0.045 to 0.300 between 2000 and 2020, all passing the Z value significance test. Despite fluctuations at different time points, the overall trend of Moran’s I value is positive. The value suggests a certain degree of spatial correlation aggregation in the resource subsystem.
In the technology subsystem, Moran’s I values ranged from 0.101 to 0.268 between 2000 and 2020, all passing the Z value significance test. Positive Moran’s I values were observed at all time points, indicating a gradual increase in the spatial correlation of the technology subsystem. The value suggests a tendency for technology to cluster in spatial distribution.
In the overall system of sustainable agricultural development, Moran’s I values from 2000 to 2020 are consistently small and close to 0. The Z values in 2000, 2005, and 2020 indicate low significance. The value suggests that the spatial correlation within the sustainable agricultural development system is weak, and there is no apparent aggregation or discrete trend.

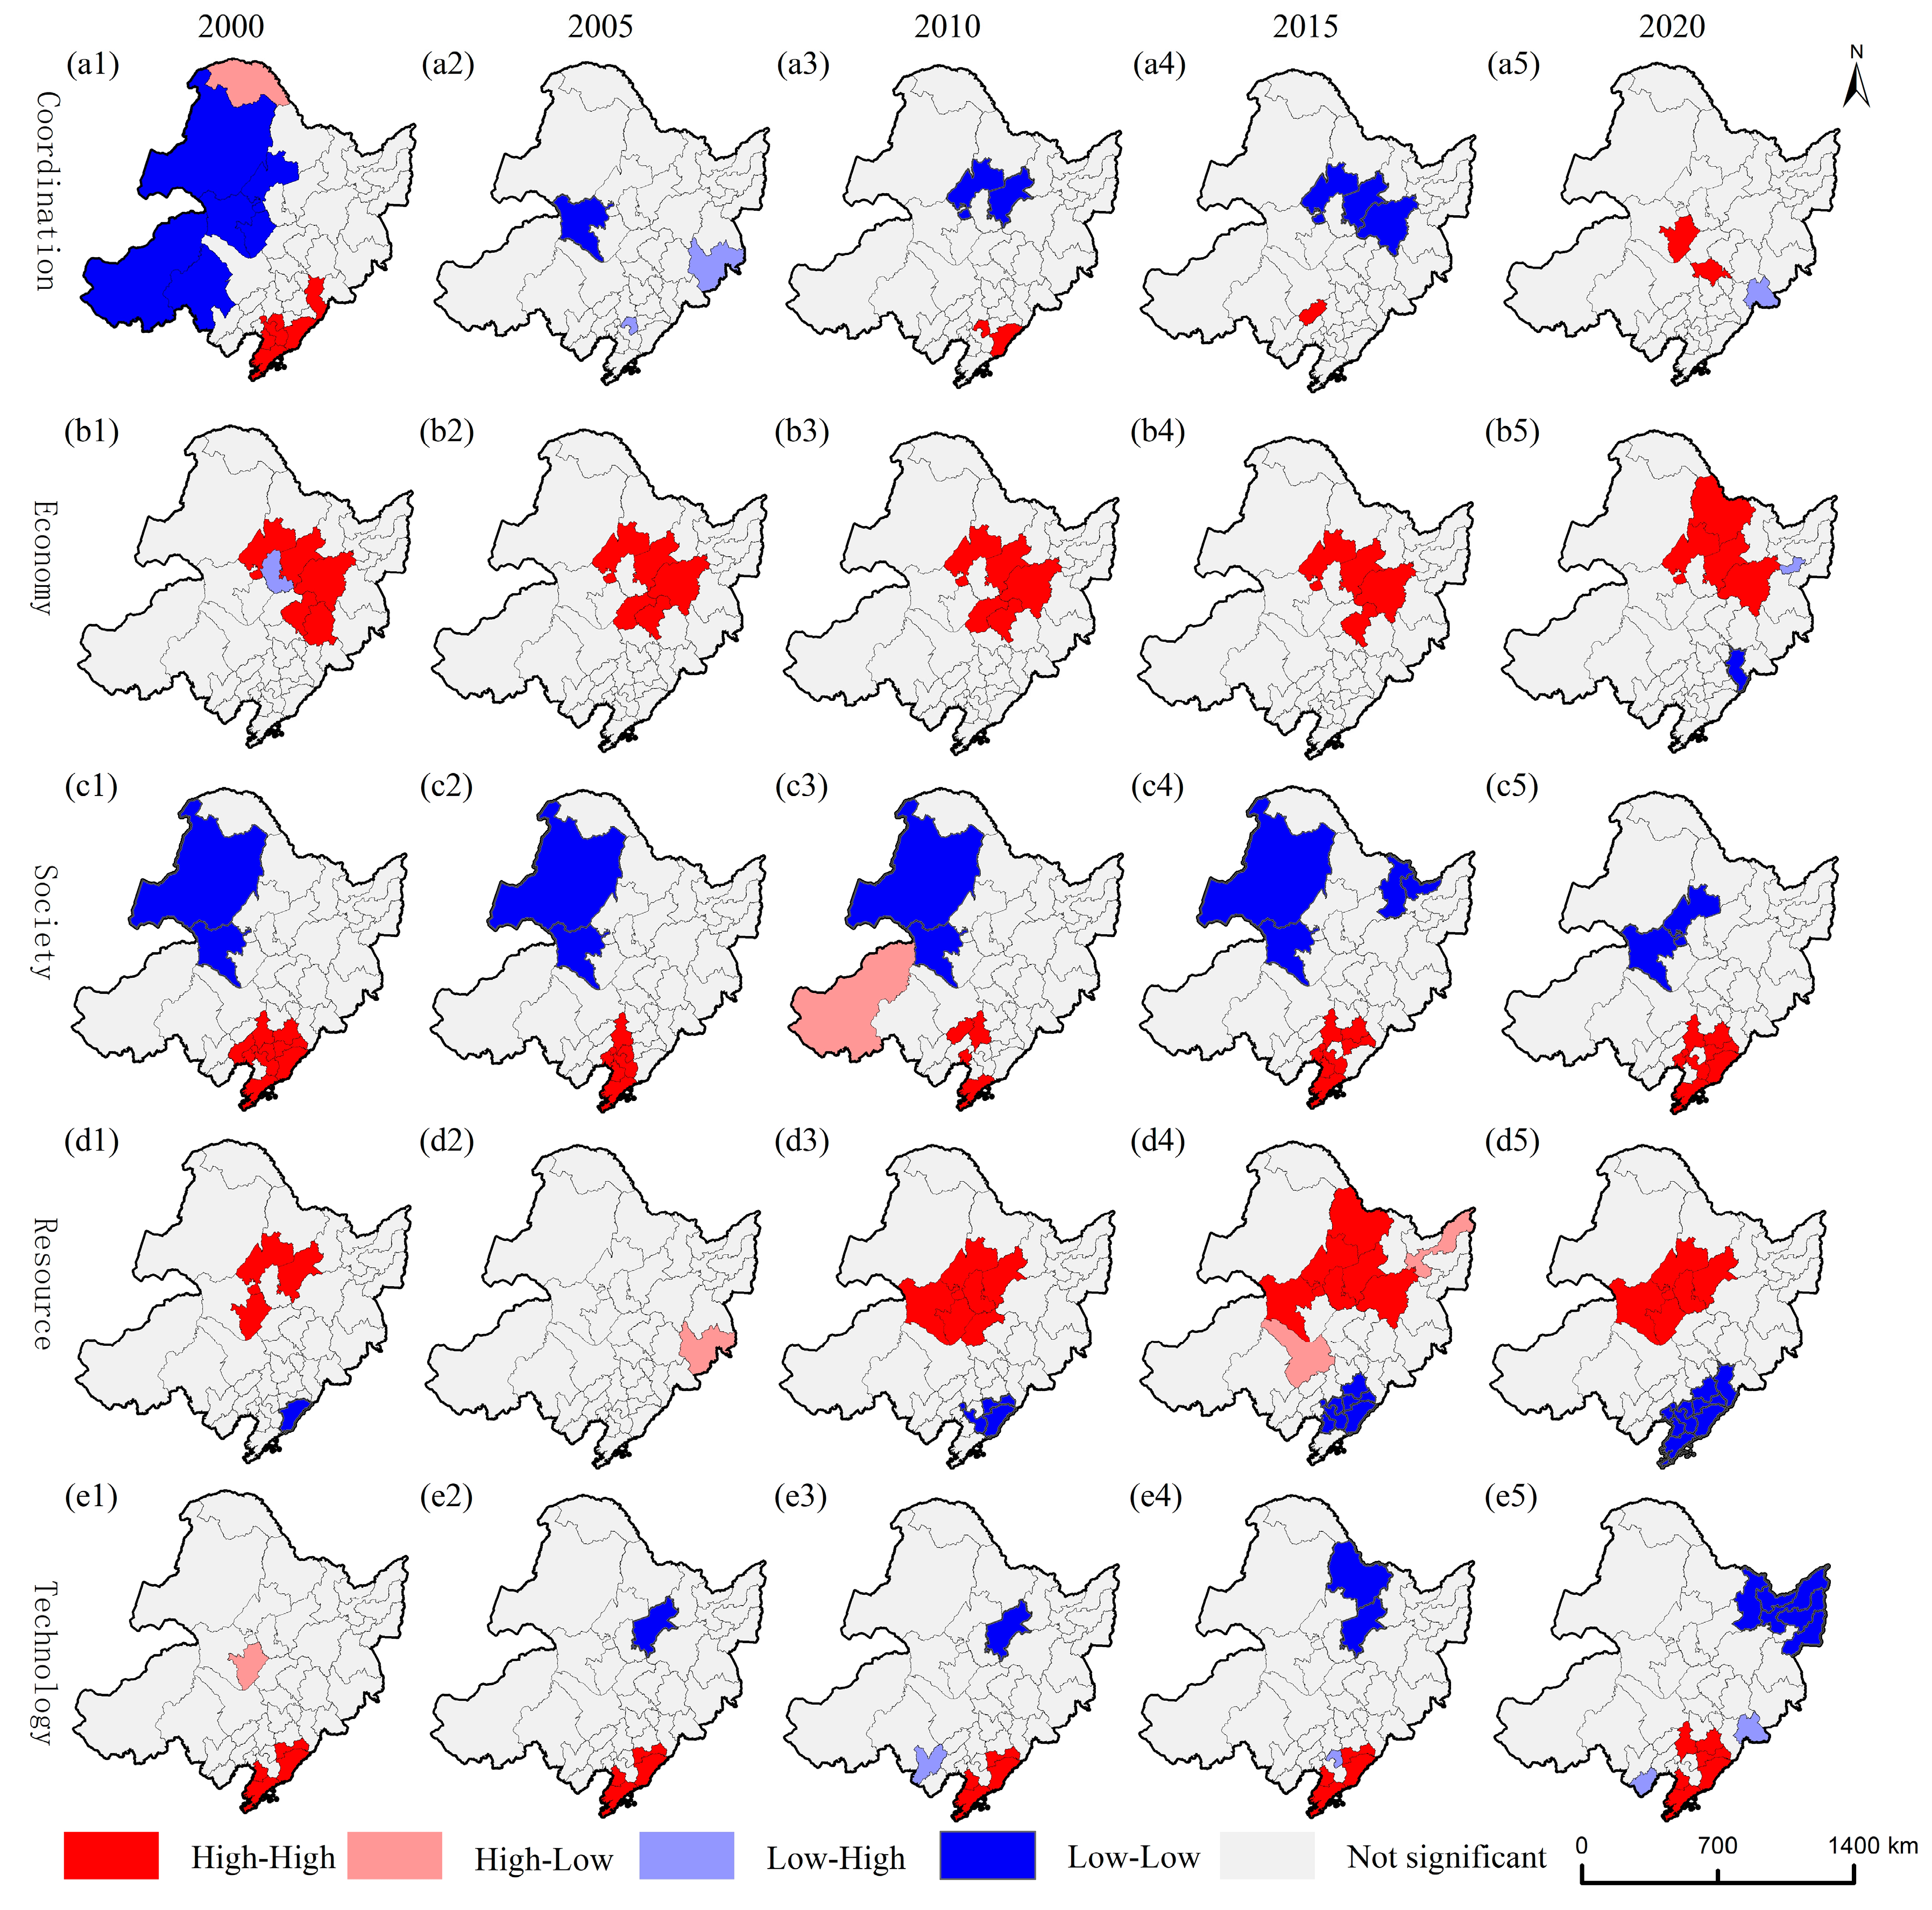
3.3.2. Local Autocorrelation Analysis

The LISA (local indicators of spatial association) agglomeration diagram reveals the similarity (positive correlation) or dissimilarity (negative correlation) significance between the attributes of the research unit and the surrounding units. Based on this diagram, it is evident that the subsystems of sustainable agricultural development exhibit distinct spatial agglomeration characteristics in terms of coordination degree, economic index, social index, resource index, and technology index from 2000 to 2020 (Figure 10).
Figure 10(a1)–(a5) show notable variations in the spatial agglomeration patterns of the coordination degree among different subsystems. The high-high agglomeration is shifting from a large-scale agglomeration distribution in the southeast to a more dispersed distribution in the central region. Specifically, the high-high agglomeration cities are transitioning from “Dalian–Anshan–Dandong–Yingkou–Liaoyang–Tonghua” to Baicheng. On the other hand, the low-low agglomeration cities are shifting from a large-scale agglomeration in the west to a small-scale agglomeration in the northeast, specifically “Chifeng–Hulunbeier–Xingan League–Baicheng–Qiqihar–Xilinguole” to “Harbin–Qiqihar–Suihua”. As of 2020, there is no significant spatial polarization in the coordination degree among the subsystems of sustainable agricultural development, indicating a state of balance.
Figure 10(b1)–(b5) show a decrease in the number of high-high agglomeration units for the economic index. The high-high agglomeration characteristics have shifted from the central region to the northern part of the central region. The high-high agglomeration city has also changed from “Changchun–Jilin–Songyuan–Harbin–Qiqihar–Suihua” to “Harbin–Qiqihar–Heihe–Suihua”.
Figure 10(c1)–(c5) show a decrease in the number of high-high agglomeration units of the social index, while the number of low-low agglomeration units of the social index remains unchanged. However, the high-high agglomeration characteristics are still concentrated in the southern part of Northeast China, specifically in cities such as “Shenyang–Dalian–Anshan–Fushun–Benxi–Dandong–Panjin”. On the other hand, the low-low agglomeration characteristics shift from the west to the central region. The low-low agglomeration city has transformed from “Hulunbeier–Xingan League” to “Xingan League–Qiqihar”.
Figure 10(d1)–(d5) show an increase in the resource index’s high-high agglomeration and low-low agglomeration units. The high-high agglomeration characteristics are still concentrated in the central part of Northeast China, specifically in the three cities of “Baicheng–Qiqihar–Suihua” and their surrounding areas. On the other hand, the low-low agglomeration characteristics have shifted from a single distribution to an agglomeration in “Dalian–Anshan–Fushun–Benxi–Dandong–Yingkou–Liaoyang–Panjin–Tonghua”.
Figure 10(e1)–(e5) show an increase in the number of high-high agglomeration and low-low agglomeration units of the technology index. The high-high agglomeration characteristics shift from the southern region to the central and southern parts of Northeast China. The high-high-agglomeration city transforms from “Dalian–Benxi–Dandong–Yingkou” to “Shenyang–Dalian–Fushun–Benxi–Dandong–Yingkou”. On the other hand, the low-low agglomeration characteristics are not spatially evident in the eastern part of the northeast region, specifically in the “Jixi–Hegang–Shuangyashan–Yichun–Jiamusi” area.

4. Discussion

4.1. Interpretation of the Findings of Sustainable Agricultural Development

This study incorporated the dissipative structure theory into the theoretical framework of SADINC to analyze the evolution process of the sustainable agricultural development system (Figure 1). The variation of parameters in the economic subsystem, social subsystem, resource subsystem, and technology subsystem affects the coordination degree among the subsystems. When the level of variation exceeds a certain threshold, it leads to changes in the dissipative structure function of the sustainable agricultural development system [76,77]. Consequently, the system undergoes optimization during this dynamic change.
This paper found that changes in the level of SADINC mainly depend on differences in the resource subsystem driven by changes in cultivated land area. The growth of cultivated land area promotes the benefit output of the economic subsystem, indirectly affecting rural social welfare fairness. Additionally, increased cultivated land prompts agricultural operators to adopt more efficient machinery and advanced technologies. Therefore, the expansion of cultivated land acts as a mutation factor, gradually evolving the sustainable agricultural development system away from the equilibrium state in 2000. However, the expansion of cultivated land resources is limited. When the growth rate of the resource subsystem slows down, the exponential growth of other subsystems promotes the coordination of sustainable agricultural development until the next system mutation occurs.
Currently, the spatial heterogeneity of the coordination degree of SADINC is evident. Regions with a high degree of coordination are typically areas where all systems are simultaneously high or low—economy, society, resources, and technology [78]. However, this study found that between 2000 and 2020, each subsystem’s index increased to varying degrees in every region. Although the overall coordination index in 2020 decreased compared to 2000, a high degree of coordination in 2020 was achieved when all systems simultaneously reached a high index. The economic, social, resource, and technological development of various regions in 2020 was improved compared to 2000. Black soil areas with excellent cultivated land resources usually experience rapid economic, social, and technological development [79]. The characteristics of coordination degree agglomeration from 2000 to 2020 are that the high-high aggregation area of the coordination degree transforms from the south to the middle. This change indicates that cities in the central black soil belt will reach a state of system equilibrium earlier, with each system growing at the same rate. On the other hand, the low-low aggregation area of the coordination degree has shifted eastward. This indicates that although the Sanjiang Plain cities experience rapid economic growth, other systems are still developing slowly. The region is still in the early stages of instability.

4.2. Comparison with Previous Studies

Achieving sustainable agriculture is crucial for ensuring global food security and alleviating hunger [80]. However, the focus of sustainable agricultural development varies depending on the specific circumstances of each country. Ahmad Bathaei et al. discovered that surveys on sustainable agricultural development in developed countries primarily concentrate on environmental concerns [81]. S. Ajibade et al. found that most developing regions, including Africa, place a greater emphasis on research regarding sustainable intensification of agriculture [82]. Typically, residents prioritize food safety and nutrition due to high agricultural productivity and the abundant supply of agricultural products in developed countries. The primary focus of sustainable agricultural development in these countries revolves around resource and environmental protection. Conversely, for many developing countries, the primary objective of agricultural development is to meet the basic food requirements of the population. Consequently, agricultural development in these countries focuses on increasing food production and environmental preservation. As the largest developing country in the world, China faces challenges stemming from a weak agricultural foundation and outdated science and technology [83,84]. These factors have hindered improvements in agricultural productivity and profitability. This study further proves this point from a regional perspective. Investment in infrastructure and technology input in Northeast China is the focus of sustainable agricultural development in the region. The core of sustainable agricultural development is to improve efficiency and increase benefits.
Judging from the evaluation index and coordination degree, the agricultural development among cities is unbalanced. Studies have shown that an agricultural development model solely pursuing economic growth is unsustainable [85,86,87]. This model often causes social and environmental damage, resulting in uncoordinated development among various urban sustainable agricultural development subsystems [88,89,90]. The implementation of the black soil protection policy has had a positive impact on improving the indices of the various subsystems of SADINC [91,92]. However, according to our study, in the past 20 years, though the economic index, social index, resource index, and technology index have been growing, the growth rate of the economic index and resource index has been higher than that of the social index and technology index. As a result, the average coordination degree of sustainable agricultural development has decreased, aligning with the findings of Jikun Huang et al. [93]. Furthermore, the economic index, social index, resource index, and technology index of various cities in Northeast China have transitioned from low-index coordination in 2000 to high-index coordination in 2020. This transformation is still in progress, resulting in the 2020 coordination degree being lower than 2000. This finding is consistent with the research study conducted by Qingqing Zhang et al. [94].

4.3. Agricultural Policy Optimization

Agricultural policies are crucial in promoting sustainable agricultural development [95,96,97]. The SADINC has been divided into three regions: western, central, and eastern [13]. Key optimization policies have been implemented in each region. The western region focuses on protecting black soil, utilizing water resources effectively, and promoting agriculture and animal husbandry integration. The central black soil belt prioritizes soil erosion control and protective farming. The eastern region emphasizes controlling the area of paddy fields and limiting groundwater exploitation, focusing on increasing the proportion of canal irrigation. These regional policies have significantly enhanced the comprehensive agricultural production capacity and progressively improved the level of sustainable agricultural development. However, providing key optimization policies for areas with uncoordinated sustainable agricultural development is crucial.
According to our study, the lessons from policies of SADINC indicate that the technology index is the primary constraint in cities experiencing low coordinated development, although deviations exist across different regions. This finding aligns with the research study conducted by Liang Cheng [98]. This study proposes specific agricultural optimization policies that are based on the development goals and specific constraints of different regions in order to achieve sustainable agricultural development. In the western region, represented by cities like Tongliao and Hulunbeier in the Inner Mongolia Autonomous Region, technological constraints and social welfare fairness are critical factors influencing the coordination degree of sustainable agricultural development. To address these challenges, future efforts should focus on ecological management in agriculture and animal husbandry. This includes implementing soil-based formula fertilization, integrated water and fertilizer management, and other environmental protection technologies to enhance the technical system. Additionally, housing renovation in agricultural and pastoral areas should be promoted, and equal social welfare should be realized in rural areas. The central region, represented by cities like Harbin and Shenyang, faces constraints related to technology, society, and resources. To address these issues, it is important to strictly implement the cultivated land protection system to ensure an adequate quantity of cultivated land resources. Furthermore, the construction of high-standard farmland and effective soil erosion control measures are crucial for ensuring the quality of cultivated land resources. In the eastern regions, such as Benxi, Yingkou, and Liaoyang, technological and resource challenges are present. To overcome these challenges, the focus should be on controlling soil erosion, the strict control of non-grain land conversion, and the appropriate adjustment of grain planting structure. In these areas, agricultural intensification should be accelerated while ensuring the maintenance of cultivated land.

5. Conclusions

This study presents a theoretical framework and evaluation index system for sustainable agricultural development based on the dissipative structure theory. It analyzes the changes and coordination degree of each subsystem in SADINC from 2000 to 2020, using the evaluation results. The findings indicate a generally high level of SADINC during this period. The economic, social, resource, and technology indices have shown continuous growth. Specifically, in 2020, the economic, social, resource, and technology indices of sustainable agricultural development increased by 16, 37, 12, and 12, respectively, in the cities of Level IV districts. The central part of the study area generally exhibits higher urban economic and resource indices, while the southern region exhibits higher urban social and technological indices. The implementation of policies is identified as a critical factor influencing changes in each subsystem’s index.
During the study period, noticeable disparities were observed in the coordination degree among different subsystems of SADINC. While some cities maintained a high degree of coordination, the number of cities with coordinated agricultural subsystems decreased. By 2020, the number of cities in Northeast China with level III and level IV coordination levels had been reduced by 10 compared to 2000. The average coordination degree also decreased by 0.097. The regression results suggest that the spatial polarization in most cities’ coordination degrees and subsystem indicators is not pronounced. However, there are characteristics of high-high agglomeration and low-low agglomeration. The high-high aggregation of the coordination shows a dispersal pattern from the large-scale agglomeration in the southeast to the central part. The distribution of low-low agglomeration transforms from large-scale agglomeration in the west to small-scale agglomeration in the northeast. Specifically, the low-low agglomeration city has shifted from “Chifeng–Hulunbeier–Xingan League–Baicheng–Qiqihar–Xilinguole” to “Harbin–Qiqihar–Suihua”. Regarding the spatial aggregation characteristics of economic, social, resource, and technological subsystems, cities in high-high areas are predominantly located in the central or southeastern part of Northeast China. In contrast, cities in low-low areas are mainly distributed in the northwest and northeast regions. This demonstrates that even though the indices of each subsystem in Northeast China continued to grow from 2000 to 2022, the interrelationships between the subsystems should also be coordinated.
This study can serve as a valuable source of policy and data support for SADINC. However, the research still has some limitations. Most of the data utilized are from statistical yearbooks, which may be subject to statistical errors and discrepancies between yearbooks. Additionally, this study focuses on cross-sectional data from 2000, 2005, 2010, 2015, and 2020 for spatial comparison instead of using panel data for overall regression analysis to determine the constraints to sustainable agricultural development. Future research should examine the long-term spatiotemporal changes in coordination of sustainable agricultural development and employ appropriate spatial regression models to explore the influencing mechanisms of SADINC.

Author Contributions

Conceptualization, H.Y. methodology, G.Y.; formal analysis, Q.L.; investigation, G.Y.; resources, G.Y.; data curation, G.Y.; writing—original draft preparation, G.Y.; writing—review and editing, G.Y. and H.Y.; visualization, Q.L.; supervision, Q.L. and H.Y.; project administration, H.Y.; funding acquisition, H.Y. All authors have read and agreed to the published version of the manuscript.

Funding

This research was funded by the National Social Science Foundation of China, grant number 23AGL027.

Institutional Review Board Statement

Not applicable.

Informed Consent Statement

Informed consent was obtained from all subjects involved in the study.

Data Availability Statement

The datasets used in this research are available upon request.

Conflicts of Interest

The authors declare no conflict of interest.

References

  1. Verburg, P.H.; Crossman, N.; Ellis, E.C.; Heinimann, A.; Hostert, P.; Mertz, O.; Nagendra, H.; Sikor, T.; Erb, K.-H.; Golubiewski, N.; et al. Land System Science and Sustainable Development of the Earth System: A Global Land Project Perspective. Anthropocene 2015, 12, 29–41. [Google Scholar] [CrossRef]
  2. Ehrensperger, A.; de Bremond, A.; Providoli, I.; Messerli, P. Land System Science and the 2030 Agenda: Exploring Knowledge That Supports Sustainability Transformation. Curr. Opin. Environ. Sustain. 2019, 38, 68–76. [Google Scholar] [CrossRef]
  3. Caron, P.; Ferrero y de Loma-Osorio, G.; Nabarro, D.; Hainzelin, E.; Guillou, M.; Andersen, I.; Arnold, T.; Astralaga, M.; Beukeboom, M.; Bickersteth, S.; et al. Food Systems for Sustainable Development: Proposals for a Profound Four-Part Transformation. Agron. Sustain. Dev. 2018, 38, 41. [Google Scholar] [CrossRef]
  4. Sustainable Food and Agriculture. Available online: http://www.fao.org/sustainability/en/ (accessed on 2 October 2023).
  5. Byerlee, D.; De Janvry, A.; Sadoulet, E. Agriculture for Development: Toward a New Paradigm. Annu. Rev. Resour. Econ. 2009, 1, 15–31. [Google Scholar] [CrossRef]
  6. Reganold, J.P.; Jackson-Smith, D.; Batie, S.S.; Harwood, R.R.; Kornegay, J.L.; Bucks, D.; Flora, C.B.; Hanson, J.C.; Jury, W.A.; Meyer, D.; et al. Transforming U.S. Agriculture. Science 2011, 332, 670–671. [Google Scholar] [CrossRef] [PubMed]
  7. Khojasteh, D.; Davani, E.; Shamsipour, A.; Haghani, M.; Glamore, W. Climate Change and COVID-19: Interdisciplinary Perspectives from Two Global Crises. Sci. Total Environ. 2022, 844, 157142. [Google Scholar] [CrossRef] [PubMed]
  8. Tracking Progress on Food and Agriculture-SDG Indicators 2023. Available online: https://www.fao.org/3/cc7088en/online/cc7088en.html (accessed on 27 September 2023).
  9. Ding, Y.-X.; Zhang, S.; Xu, R.; Gao, Y.; Ding, H.; Sun, P.; Liu, W. The Coupling Coordination Measurement, Spatio-Temporal Differentiation and Driving Mechanism of Urban and Rural Water Poverty in Northwest China. Int. J. Environ. Res. Public Health 2023, 20, 2043. [Google Scholar] [CrossRef] [PubMed]
  10. Wei, X.; Liu, L.; Yuan, C.; Xia, Z. Determining Urban–rural Coordinated Development in Major Grain-Producing Areas Based on Urbanization and Cultivated Land Use Efficiency Coordination Level: A Case Study in Hunan Province, China. Front. Environ. Sci. 2023, 10, 1091898. [Google Scholar] [CrossRef]
  11. Zhang, Y.; Wei, T.; Tian, W.; Zhao, K. Spatiotemporal Differentiation and Driving Mechanism of Coupling Coordination between New-Type Urbanization and Ecological Environment in China. Sustainability 2022, 14, 11780. [Google Scholar] [CrossRef]
  12. Liu, J.; Mooney, H.; Hull, V.; Davis, S.; Gaskell, J.; Hertel, T.; Lubchenco, J.; Seto, K.; Gleick, P.; Kremen, C.; et al. Systems Integration for Global Sustainability. Science 2015, 347, 1258832. [Google Scholar] [CrossRef] [PubMed]
  13. Full Transcript of Policy Briefing of the State Council on March 20, 2015. Available online: http://english.www.gov.cn/news/policy_briefings/2015/03/20/content_281475074650908.htm (accessed on 28 September 2023).
  14. Cheng, H.; Wang, X.; Chen, D. Research on Spatial-Temporal Variations of Cultivated Land in China Based on GlobeLand30. Front. Environ. Sci. 2022, 10, 929760. [Google Scholar] [CrossRef]
  15. Bai, Y.; Zhai, Y.; Ji, C.; Zhang, T.; Chen, W.; Shen, X.; Hong, J. Environmental Sustainability Challenges of China’s Edible Vegetable Oil Industry: From Farm to Factory. Resour. Conserv. Recycl. 2021, 170, 105606. [Google Scholar] [CrossRef]
  16. Jiang, L.; Li, Z. Urbanization and the Change of Fertilizer Use Intensity for Agricultural Production in Henan Province. Sustainability 2016, 8, 186. [Google Scholar] [CrossRef]
  17. Wu, S.; Li, L.; Li, S. Natural Resource Abundance, Natural Resource-Oriented Industry Dependence, and Economic Growth: Evidence from the Provincial Level in China. Resour. Conserv. Recycl. 2018, 139, 163–171. [Google Scholar] [CrossRef]
  18. Sun, F.; Wang, L.; Cao, S.; Zhang, Y. How Farmland Circulation Affects Household Financial Vulnerability in China: The Chain Mediation Effect of Labor Transfer and Financial Literacy. Front. Sustain. Food Syst. 2023, 7, 1102189. [Google Scholar] [CrossRef]
  19. Wang, M.; Xu, X.; Zheng, L.; Xu, X.; Zhang, Y. Analysis of the Relationship between Economic Development and Water Resources–Ecological Management Capacity in China Based on Nighttime Lighting Data. Int. J. Environ. Res. Public Health 2023, 20, 1818. [Google Scholar] [CrossRef] [PubMed]
  20. Kuang, B.; Lu, X.; Zhou, M.; Chen, D. Provincial Cultivated Land Use Efficiency in China: Empirical Analysis Based on the SBM-DEA Model with Carbon Emissions Considered. Technol. Forecast. Soc. Chang. 2020, 151, 119874. [Google Scholar] [CrossRef]
  21. Aznar-Sánchez, J.A.; Piquer-Rodríguez, M.; Velasco-Muñoz, J.F.; Manzano-Agugliaro, F. Worldwide Research Trends on Sustainable Land Use in Agriculture. Land Use Policy 2019, 87, 104069. [Google Scholar] [CrossRef]
  22. Yu, S.; Mu, Y. Sustainable Agricultural Development Assessment: A Comprehensive Review and Bibliometric Analysis. Sustainability 2022, 14, 11824. [Google Scholar] [CrossRef]
  23. Selecting Weighting Methodologies for Evaluating Agricultural Sustainability in Iran|Proceedings of the Institution of Civil Engineers—Engineering Sustainability. Available online: https://www.icevirtuallibrary.com/doi/10.1680/jensu.18.00004 (accessed on 30 September 2023).
  24. Guo, H.; Xu, S.; Pan, C. Measurement of the Spatial Complexity and Its Influencing Factors of Agricultural Green Development in China. Sustainability 2020, 12, 9259. [Google Scholar] [CrossRef]
  25. Fallah-Alipour, S.; Mehrabi Boshrabadi, H.; Zare Mehrjerdi, M.R.; Hayati, D. A Framework for Empirical Assessment of Agricultural Sustainability: The Case of Iran. Sustainability 2018, 10, 4823. [Google Scholar] [CrossRef]
  26. Sulewski, P.; Kłoczko-Gajewska, A.; Sroka, W. Relations between Agri-Environmental, Economic and Social Dimensions of Farms’ Sustainability. Sustainability 2018, 10, 4629. [Google Scholar] [CrossRef]
  27. Food and Agriculture Organization of the United Nations. Available online: http://www.fao.org/sustainability/background/en/?key=5 (accessed on 30 September 2023).
  28. Liu, X.; Xin, Y. Exploring the Characteristics and Driving Factors of Coupling Coordination of Regional Sustainable Development: Evidence from China’s 31 Provinces. Environ. Sci. Pollut. Res. 2022, 29, 71075–71099. [Google Scholar] [CrossRef] [PubMed]
  29. Ge, Y.; Hu, S.; Song, Y.; Zheng, H.; Liu, Y.; Ye, X.; Ma, T.; Liu, M.; Zhou, C. Sustainable Poverty Reduction Models for the Coordinated Development of the Social Economy and Environment in China. Sci. Bull. 2023, 68, 2236–2246. [Google Scholar] [CrossRef]
  30. Liang, X.; Si, D.; Zhang, X. Regional Sustainable Development Analysis Based on Information Entropy—Sichuan Province as an Example. Int. J. Environ. Res. Public Health 2017, 14, 1219. [Google Scholar] [CrossRef] [PubMed]
  31. Sabaghi, M.; Mascle, C.; Baptiste, P.; Rostamzadeh, R. Sustainability Assessment Using Fuzzy-Inference Technique (SAFT): A Methodology toward Green Products. Expert. Syst. Appl. 2016, 56, 69–79. [Google Scholar] [CrossRef]
  32. Li, B.; Feng, Y.; Xia, X.; Feng, M. Evaluation of China’s Circular Agriculture Performance and Analysis of the Driving Factors. Sustainability 2021, 13, 1643. [Google Scholar] [CrossRef]
  33. Chen, Z.; Li, X.; Xia, X. Measurement and Spatial Convergence Analysis of China’s Agricultural Green Development Index. Environ. Sci. Pollut. Res. 2021, 28, 19694–19709. [Google Scholar] [CrossRef]
  34. Li, M.; Wang, J.; Chen, Y. Evaluation and Influencing Factors of Sustainable Development Capability of Agriculture in Countries along the Belt and Road Route. Sustainability 2019, 11, 2004. [Google Scholar] [CrossRef]
  35. Liu, Y.; Sun, D.; Wang, H.; Wang, X.; Yu, G.; Zhao, X. An Evaluation of China’s Agricultural Green Production: 1978–2017. J. Clean. Prod. 2020, 243, 118483. [Google Scholar] [CrossRef]
  36. Aguilar-Rivera, N. A Framework for the Analysis of Socioeconomic and Geographic Sugarcane Agro Industry Sustainability. Socio-Econ. Plan. Sci. 2019, 66, 149–160. [Google Scholar] [CrossRef]
  37. Lin, C.-N. A Fuzzy Analytic Hierarchy Process-Based Analysis of the Dynamic Sustainable Management Index in Leisure Agriculture. Sustainability 2020, 12, 5395. [Google Scholar] [CrossRef]
  38. Tzouramani, I.; Mantziaris, S.; Karanikolas, P. Assessing Sustainability Performance at the Farm Level: Examples from Greek Agricultural Systems. Sustainability 2020, 12, 2929. [Google Scholar] [CrossRef]
  39. Sajadian, M.; Khoshbakht, K.; Liaghati, H.; Veisi, H.; Mahdavi Damghani, A. Developing and Quantifying Indicators of Organic Farming Using Analytic Hierarchy Process. Ecol. Indic. 2017, 83, 103–111. [Google Scholar] [CrossRef]
  40. Wang, Y.; Cai, Y.; Liu, G.; Zhang, P.; Li, B.; Li, B.; Jia, Q.; Huang, Y.; Shu, T. Evaluation of Sustainable Crop Production from an Ecological Perspective Based Emergy Analysis: A Case of China’s Provinces. J. Clean. Prod. 2021, 313, 127912. [Google Scholar] [CrossRef]
  41. Suresh, A.; Krishnan, P.; Jha, G.K.; Reddy, A.A. Agricultural Sustainability and Its Trends in India: A Macro-Level Index-Based Empirical Evaluation. Sustainability 2022, 14, 2540. [Google Scholar] [CrossRef]
  42. Wang, H.; Wang, J.; Shi, B. Model and Application of Green Industry Evaluation Based on Fuzzy Control. J. Intell. Fuzzy Syst. 2015, 29, 2489–2494. [Google Scholar] [CrossRef]
  43. Feng, K.; Zheng, J.; Wei, S.; Zheng, W.; Liu, Y. Spatial Difference of Urban Land Intensive Use Based on the GIS and PSR Model-a Case Study of Zhejiang Province. Econ. Geogr. 2007, 27, 5. [Google Scholar] [CrossRef]
  44. Gao, S.; Huang, X. Performance Evaluation of Eco-Construction Based on PSR Model in China from 1953 to 2008. J. Nat. Resour. 2010, 25, 341–350. [Google Scholar] [CrossRef]
  45. Li, Q.; Hu, S.; Qu, S. Evolution and Coordination of Spatial Pattern of Cultivated Land Management in Hunan Province. Resour. Sci. 2019, 41, 233–246. [Google Scholar] [CrossRef]
  46. Shi, L.; Han, L.; Yang, F.; Gao, L. The Evolution of Sustainable Development Theory: Types, Goals, and Research Prospects. Sustainability 2019, 11, 7158. [Google Scholar] [CrossRef]
  47. Hendrickson, J.; Hanson, J.; Tanaka, D.; Sassenrath, G. Principles of Integrated Agricultural Systems: Introduction to Processes and Definition. Renew. Agric. Food Syst. 2008, 23, 265–271. [Google Scholar] [CrossRef]
  48. Bagheri, A.; Hjorth, P. Planning for Sustainable Development: A Paradigm Shift towards a Process-Based Approach. Sustain. Dev. 2007, 15, 83–96. [Google Scholar] [CrossRef]
  49. Saifi, B.; Drake, L. A Coevolutionary Model for Promoting Agricultural Sustainability. Ecol. Econ. 2008, 65, 24–34. [Google Scholar] [CrossRef]
  50. Laurett, R.; Paço, A.; Mainardes, E. Antecedents and Consequences of Sustainable Development in Agriculture and the Moderator Role of the Barriers: Proposal and Test of a Structural Model. J. Rural Stud. 2021, 86, 270–281. [Google Scholar] [CrossRef]
  51. Laurett, R.; Paço, A.; Mainardes, E. Sustainable Development in Agriculture and Its Antecedents, Barriers and Consequences—An Exploratory Study. Sustain. Prod. Consum. 2020, 27, 298–311. [Google Scholar] [CrossRef]
  52. Fess, T.L.; Benedito, V. Organic versus Conventional Cropping Sustainability: A Comparative System Analysis. Sustainability 2018, 10, 272. [Google Scholar] [CrossRef]
  53. Trigo, A.; Marta-Costa, A.; Fragoso, R. Principles of Sustainable Agriculture: Defining Standardized Reference Points. Sustainability 2021, 13, 4086. [Google Scholar] [CrossRef]
  54. Zsarnóczai, J.S.; Zéman, Z. Output Value and Productivity of Agricultural Industry in Central-East Europe. Agric. Econ. 2019, 65, 185–193. [Google Scholar] [CrossRef]
  55. Phasinam, K.; Kassanuk, T.; Shabaz, M. Applicability of Internet of Things in Smart Farming. J. Food Qual. 2022, 2022, 7692922. [Google Scholar] [CrossRef]
  56. Lakshmi, G.J.; Hilmi, S.A.N.; Obaid, A.J. Artificial Intelligence Agriculture Recommendation Model (AIARM). Int. J. Health Sci. 2022, 6, 1782–1808. [Google Scholar] [CrossRef]
  57. Yang, P.; Zhao, Q.; Cai, X. Machine Learning Based Estimation of Land Productivity in the Contiguous US Using Biophysical Predictors. Environ. Res. Lett. 2020, 15, 074013. [Google Scholar] [CrossRef]
  58. Coelli, T.; Rao, D. Total Factor Productivity Growth in Agriculture: A Malmquist Index Analysis of 93 Countries, 1980–2000 *. Agric. Econ. 2003, 32, 115–134. [Google Scholar] [CrossRef]
  59. Huang, G.; Jiang, Y. Urbanization and Socioeconomic Development in Inner Mongolia in 2000 and 2010: A GIS Analysis. Sustainability 2017, 9, 235. [Google Scholar] [CrossRef]
  60. Jones, G.W.; Visaria, P. Urbanization in Large Developing Countries: China, Indonesia, Brazil and India. Popul. Dev. Rev. 1998, 24, 648–649. [Google Scholar] [CrossRef]
  61. Young, A. Inequality, the Urban-Rural Gap, and Migration*. Q. J. Econ. 2013, 128, 1727–1785. [Google Scholar] [CrossRef]
  62. Wan, J.; Su, Y.; Zan, H.; Zhao, Y.; Zhang, L.; Zhang, S.; Dong, X.; Deng, W. Land Functions, Rural Space Governance, and Farmers’ Environmental Perceptions: A Case Study from the Huanjiang Karst Mountain Area, China. Land 2020, 9, 134. [Google Scholar] [CrossRef]
  63. Feng, K.; Li, Q.; Huang, B.; Yan, H. Research on the Domain and Potential for Further Electrification of Rural Domestic Energy Consumption. IOP Conf. Ser. Mater. Sci. Eng. 2020, 768, 062055. [Google Scholar] [CrossRef]
  64. Yan, X.; Wang, Y.; Yang, G.; Liao, N.; Li, F. Research on the Scale of Agricultural Land Moderate Management and Countermeasures Based on Farm Household Analysis. Sustainability 2021, 13, 10591. [Google Scholar] [CrossRef]
  65. Rosa, L. Adapting Agriculture to Climate Change via Sustainable Irrigation: Biophysical Potentials and Feedbacks. Environ. Res. Lett. 2022, 17, 063008. [Google Scholar] [CrossRef]
  66. Toriman, M.; Mokhtar, M. Irrigation: Types, Sources and Problems in Malaysia. In Irrigation Systems and Practices in Challenging Environments; IntechOpen: London, UK, 2012. [Google Scholar] [CrossRef]
  67. Li, Q.; Dong, Z.; Du, G.; Yang, A. Spatial Differentiation of Cultivated Land Use Intensification in Village Settings: A Survey of Typical Chinese Villages. Land 2021, 10, 249. [Google Scholar] [CrossRef]
  68. Bisht, N.; Chauhan, P. Excessive and Disproportionate Use of Chemicals Cause Soil Contamination and Nutritional Stress. In Soil Contamination—Threats and Sustainable Solutions; IntechOpen: London, UK, 2020. [Google Scholar] [CrossRef]
  69. Gusniar, I.N.; Putra, A.S. Perhitungan Beban Statik Pada Rangka Mesin Pengering Padi Menggunakan Baja AISI 1020. J. Tek. Mesin 2021, 14, 53–58. [Google Scholar] [CrossRef]
  70. Umamaheswari, S.; Jain, A.V. Encoder–Decoder Architecture for Crop-Weed Classification Using Pixel-Wise Labelling. In Proceedings of the 2020 International Conference on Artificial Intelligence and Signal Processing (AISP), Amaravati, India, 10–12 January 2020; pp. 1–6. [Google Scholar] [CrossRef]
  71. Zhang, Y.; Xue, W.; Wen, Y.; Wang, X. Sustainability Assessment of Water Resources Use in 31 Provinces in China: A Combination Method of Entropy Weight and Cloud Model. Int. J. Environ. Res. Public Health 2022, 19, 12870. [Google Scholar] [CrossRef] [PubMed]
  72. Jin, W.; Bian, Z.; Wei, Z.; Wang, S. Multi-Functional Evaluation of Cultivated Land in Peri-Urban Areas of Shenyang City. Chin. J. Agric. Resour. Reg. Plan. 2019, 40, 8. [Google Scholar] [CrossRef]
  73. Yang, L.; Lin, Y.; Zhu, J.; Yang, K. Dynamic Coupling Coordination and Spatial–Temporal Analysis of Digital Economy and Carbon Environment Governance from Provinces in China. Ecol. Indic. 2023, 156, 111091. [Google Scholar] [CrossRef]
  74. Dynamic Variation of Ecosystem Services Value under Land Use/Cover Change in the Black Soil Region of Northeastern China. Available online: https://www.citexs.com/Detail?pmid=35742781&title=dynamic%20variation%20of%20ecosystem%20services%20value%20under%20land%20use%2Fcover%20change%20in%20the%20black%20soil%20region%20of%20northeastern%20china (accessed on 4 November 2023).
  75. Fan, P.; Mishra, A.K.; Feng, S.; Su, M. The Effect of Agricultural Subsidies on Chemical Fertilizer Use: Evidence from a New Policy in China. J. Environ. Manag. 2023, 344, 118423. [Google Scholar] [CrossRef]
  76. Xiao, S.; He, Z.; Zhang, W.; Qin, X. The Agricultural Green Production Following the Technological Progress: Evidence from China. Int. J. Environ. Res. Public Health 2022, 19, 9876. [Google Scholar] [CrossRef]
  77. Deng, F.; Liu, C.; Liang, X. Measurement of Regional Agricultural Sustainable Development System Based on Dissipative Structure Theory: A Case Study in Sichuan Province, China. Sustainability 2017, 9, 2047. [Google Scholar] [CrossRef]
  78. Li, Z. Study on Coordination Development of Science&technology-Economy System in Western Provinces. J. Guangxi Econ. Manag. Cadre Coll. 2014, 28–34. [Google Scholar]
  79. Niu, J.; Tang, H.; Liu, Q.; Cheng, F.; Zhang, L.; Sang, L.; Huang, Y.; Shen, C.; Gao, B.; Niu, Z. Determinants of Soil Bacterial Diversity in a Black Soil Region in a Large-Scale Area. Land 2022, 11, 731. [Google Scholar] [CrossRef]
  80. Mockshell, J.; Kamanda, J. Beyond the Agroecological and Sustainable Agricultural Intensification Debate: Is Blended Sustainability the Way Forward? Int. J. Agric. Sustain. 2018, 16, 127–149. [Google Scholar] [CrossRef]
  81. Bathaei, A.; Štreimikienė, D. A Systematic Review of Agricultural Sustainability Indicators. Agriculture 2023, 13, 241. [Google Scholar] [CrossRef]
  82. Ajibade, S.; Simon, B.; Gulyas, M.; Balint, C. Sustainable Intensification of Agriculture as a Tool to Promote Food Security: A Bibliometric Analysis. Front. Sustain. Food Syst. 2023, 7, 1101528. [Google Scholar] [CrossRef]
  83. Pawlak, K.; Kołodziejczak, M. The Role of Agriculture in Ensuring Food Security in Developing Countries: Considerations in the Context of the Problem of Sustainable Food Production. Sustainability 2020, 12, 5488. [Google Scholar] [CrossRef]
  84. Sun, B.; Luo, Y.; Yang, D.; Yang, J.; Zhao, Y.; Zhang, J. Coordinative Management of Soil Resources and Agricultural Farmland Environment for Food Security and Sustainable Development in China. Int. J. Environ. Res. Public Health 2023, 20, 3233. [Google Scholar] [CrossRef]
  85. Järnberg, L.; Kautsky, E.; Dagerskog, L.; Olsson, P. Green Niche Actors Navigating an Opaque Opportunity Context: Prospects for a Sustainable Transformation of Ethiopian Agriculture. Land Use Policy 2018, 71, 409–421. [Google Scholar] [CrossRef]
  86. Taoumi, H.; Lahrech, K. Economic, Environmental and Social Efficiency and Effectiveness Development in the Sustainable Crop Agricultural Sector: A Systematic in-Depth Analysis Review. Sci. Total Environ. 2023, 901, 165761. [Google Scholar] [CrossRef]
  87. Hou, X.; Yin, Y.; Zhou, X.; Zhao, M.; Yao, L.; Zhang, D.; Wang, X.; Xia, C. Does Economic Agglomeration Affect the Sustainable Intensification of Cultivated Land Use? Evidence from China. Ecol. Indic. 2023, 154, 110808. [Google Scholar] [CrossRef]
  88. Arvor, D.; Daugeard, M.; Tritsch, I.; Mello-Théry, N.A.; Théry, H.; Dubreuil, V. Combining Socioeconomic Development with Environmental Governance in the Brazilian Amazon: The Mato Grosso Agricultural Frontier at a Tipping Point. Environ. Dev. Sustain. 2018, 20, 1–22. [Google Scholar] [CrossRef]
  89. Rezaei-Moghaddam, K.; Karami, E. A Multiple Criteria Evaluation of Sustainable Agricultural Development Models Using AHP. Environ. Dev. Sustain. 2008, 10, 407–426. [Google Scholar] [CrossRef]
  90. Cheng, J.; Xu, Z.; Liang, Z.; Li, F.; Cong, W.-F.; Zhang, C.; Song, L.; Wang, C.; Zhang, F.; Richter, A.; et al. Farmers Perceive Diminishing Ecosystem Services, but Overlook Dis-Services in Intensively Used Agricultural Landscapes in the North China Plain. J. Environ. Manag. 2023, 347, 119060. [Google Scholar] [CrossRef] [PubMed]
  91. Guo, H.; Zhao, W.; Pan, C.; Qiu, G.; Xu, S.; Liu, S. Study on the Influencing Factors of Farmers’ Adoption of Conservation Tillage Technology in Black Soil Region in China: A Logistic-ISM Model Approach. Int. J. Environ. Res. Public Health 2022, 19, 7762. [Google Scholar] [CrossRef]
  92. Qu, Y.; Pan, C.; Guo, H. Factors Affecting the Promotion of Conservation Tillage in Black Soil—The Case of Northeast China. Sustainability 2021, 13, 9563. [Google Scholar] [CrossRef]
  93. Huang, J.; Yang, G. Understanding Recent Challenges and New Food Policy in China. Glob. Food Secur. 2017, 12, 119–126. [Google Scholar] [CrossRef]
  94. Zhang, Q.; Qu, Y.; Zhan, L. Great Transition and New Pattern: Agriculture and Rural Area Green Development and Its Coordinated Relationship with Economic Growth in China. J. Environ. Manag. 2023, 344, 118563. [Google Scholar] [CrossRef] [PubMed]
  95. Khan, M.A.; Tahir, A.; Khurshid, N.; Husnain, M.; Ahmed, M.; Boughanmi, H. Economic Effects of Climate Change-Induced Loss of Agricultural Production by 2050: A Case Study of Pakistan. Sustainability 2020, 12, 1216. [Google Scholar] [CrossRef]
  96. Roy, R.; Chan, N.W.; Xenarios, S. Sustainability of Rice Production Systems: An Empirical Evaluation to Improve Policy. Environ. Dev. Sustain. 2016, 18, 257–278. [Google Scholar] [CrossRef]
  97. Wang, C. China’s Energy Policy and Sustainable Energy Transition for Sustainable Development: Green Investment in Renewable Technological Paradigm. Environ. Sci. Pollut. Res. 2023, 30, 51491–51503. [Google Scholar] [CrossRef]
  98. Cheng, L.; Gao, Y.; Dai, X. Spatio-Temporal Comprehensive Measurement of China’s Agricultural Green Development Level and Associated Influencing Factors. PLoS ONE 2023, 18, e0288599. [Google Scholar] [CrossRef]
Figure 1. The theoretical framework of sustainable agricultural development.
Sustainability 15 16354 g001
Figure 2. Location of study area in Northeast China.
Sustainability 15 16354 g002
Figure 3. Changes in indicators of SADINC from 2000 to 2020. (a) Agricultural output value; (b) average per capita net income of farmers; (c) land productivity; (d) total food production; (e) urbanization rate; (f) average housing area per capita in rural areas; (g) rural per capita electricity consumption; (h) land area for cultivation; (i) effective irrigation area; (j) number of individuals employed in the agricultural sector; (k) intensity of fertilizer application; (l) efficiency level of agricultural machinery; (m) intensity of pesticide application.
Sustainability 15 16354 g003
Figure 4. The index of urban SADINC from 2000 to 2020. Note: level I: (0–0.0288]; level II: (0.0288–0.0446]; level III: (0.0446–0.0685]; level IV: (0.0685–0.2237].
Sustainability 15 16354 g004
Figure 5. The economic index of urban SADINC from 2000 to 2020. Note: level I: (0–0.0588]; level II: (0.0588–0.0992]; level III: (0.0992–0.1456]; level IV: (0.1456–0.3488].
Sustainability 15 16354 g005
Figure 6. The social index of urban SADINC from 2000 to 2020. Note: level I: (0–0.0168]; level II: (0.0168–0.0.0348]; level III: (0.0348–0.0452]; level IV: (0.0452–0.2756].
Sustainability 15 16354 g006
Figure 7. The resource index of urban SADINC from 2000 to 2020. Note: level I: (0–0.0240]; level II: (0.0240–0.0516]; level III: (0.0516–0.0944]; level IV: (0.0944–0.2412].
Sustainability 15 16354 g007
Figure 8. The technology index of urban SADINC from 2000 to 2020. Note: level I: (0–0.0092]; level II: (0.0092–0.0128]; level III: (0.0128–0.0172]; level IV: (0.0172–0.0292].
Sustainability 15 16354 g008
Figure 9. The coordination degree of SADINC from 2000 to 2020. Note: level I: (1.1681–1.5591]; level II: (1.5591–1.6389]; level III: (1.6389–1.7069]; level IV: (1.7069–1.9417].
Sustainability 15 16354 g009
Figure 10. Local spatiotemporal correlation LISA map of SADINC from 2000 to 2020. (a1a5) Agglomeration characteristics of coordination 2000–2020; (b1b5) aggregation characteristics of economic subsystems 2000–2020; (c1c5) aggregation characteristics of social subsystems 2000–2020; (d1d5) aggregation characteristics of resource subsystems 2000–2020; (e1e5) aggregation characteristics of technology subsystems 2000–2020.
Sustainability 15 16354 g010
Table 1. Indicator system of sustainable agricultural development.
Target LayersCriterion LayersIndex LayersTarget DirectionsFormulae and UnitsIndex WeightsConnotation
Sustainable Agricultural Developmenteconomic subsystemAgricultural output value+(billion yuan RMB)0.1283This index reflects the state of the agricultural economy.
Average per capita net income of farmers+(yuan RMB/person)0.0829This index reflects the average income level of rural residents.
Land productivity+Agricultural output/crop sowing area (%)0.0823This index comprehensively reflects the level of land productivity.
Total food production+(ton)0.1323This index reflects the level of food supply.
social subsystemUrbanization rate+(%)0.0649This index reflects the degree of regional urbanization.
Average housing area per capita in rural areas+(m2)0.0287This index reflects the living security situation of rural residents.
Rural per capita electricity consumption+Electricity consumption in rural areas/rural population (kwh/person)0.1384This index reflects the living standards of rural residents.
resource subsystemLand area for cultivation+(1000 ha)0.1413This index reflects the abundance of regional cultivated land resources.
Effective irrigation area+(1000 ha)0.1202This index reflects the ability of agriculture to resist natural disasters.
Number of individuals employed in the agricultural sector(million person)0.0160This index reflects the intensification of cultivated land use.
technology subsystemIntensity of fertilizer applicationFertilizer application rate/crop sowing area (kg/ha)0.0155This index reflects the level of fertilizer application.
Efficiency level of agricultural machinery+Total power of agricultural machinery/crop sowing area (kwh/ha)0.0457This index reflects the degree of rural mechanization.
Intensity of pesticide application.Pesticide application rate/crop sowing area (kg/ha)0.0035This index reflects the level of pesticide application.
Table 2. Descriptive statistics.
Data TypeObsMeanMaxMinStd. Dev.
Agricultural output value (billion yuan RMB)205114.050745.5005.000120.320
Average per capita net income of farmers(yuan RMB/person))2058354.22021,729.0001008.0005665.020
Land productivity (%)20522.310110.2602.23017.070
Total food production (ton)205293.5201449.3908.190310.720
Urbanization rate (%)20514.28073.8802.7209.150
Average housing area per capita in rural areas (m2)20525.61040.60013.8005.340
Rural per capita electricity consumption (kwh/person)2050.0700.5400.0030.080
Land area for cultivation (1000 ha)205738.34010,990.00048.000939.822
Effective irrigation area (1000 ha)205178.570955.5000.810180.648
Number of individuals employed in the agricultural sector
(million person)
20569.150223.6201.76048.93
Intensity of fertilizer application (kg/ha)205558.5601688.06045.000351.32
Efficiency level of agricultural machinery (kwh/ha)2054.33012.1100.7572.11
Intensity of pesticide application (kg/ha)20510.53080.4600.8909.82
Table 3. Moran’s I values of SADINC from 2000 to 2020.
TimeTypeEconomic SubsystemSocial SubsystemResource SubsystemTechnology SubsystemSustainable Agricultural Development System
2000Moran’s I0.0650.3170.1730.1010.030
P0.0690.0000.0000.0120.278
Z1.8186.7733.8622.5101.085
2005Moran’s I0.1090.2840.0450.2200.030
P0.0080.0000.0700.0000.229
Z2.6556.1051.8094.8400.030
2010Moran’s I0.1000.2180.2830.1900.147
P0.0610.0000.0000.0000.001
Z1.8704.9305.9624.2203.377
2015Moran’s I0.1080.2960.2490.2050.076
P0.0080.0000.0000.0000.044
Z2.6716.3215.3284.5462.014
2020Moran’s I0.1200.3060.3000.2680.004
P0.0040.0000.0000.0000.569
Z2.8476.5576.3235.6850.569
Disclaimer/Publisher’s Note: The statements, opinions and data contained in all publications are solely those of the individual author(s) and contributor(s) and not of MDPI and/or the editor(s). MDPI and/or the editor(s) disclaim responsibility for any injury to people or property resulting from any ideas, methods, instructions or products referred to in the content.

