Article

Effects of Replacing Fishmeal with Algal Biomass (Pavlova sp. 459) on Membrane Lipid Composition of Atlantic Salmon (Salmo salar) Parr Muscle and Liver Tissues

1
Department of Ocean Sciences, Memorial University of Newfoundland, St. John’s, NL A1C 5S7, Canada
2
Department of Animal Science and Aquaculture, Dalhousie University, Truro, NS B2N 5E3, Canada
3
Colectivo de Academicos Sudcalifornianos, La Paz 23000, Baja California Sur, Mexico
4
Aquatic and Crop Resource Development Research Centre, National Research Council of Canada, Halifax, NS B3H 3Z1, Canada
*
Authors to whom correspondence should be addressed.
Sustainability 2023, 15(24), 16599; https://doi.org/10.3390/su152416599
Submission received: 28 October 2023 / Revised: 30 November 2023 / Accepted: 1 December 2023 / Published: 6 December 2023

Abstract

:
A 12-week feeding trial examined the dietary impact of replacing fishmeal (FM) with algal biomass (AB) derived from Pavlova sp. strain CCMP459 (Pav459) in Atlantic salmon diets. Three distinct diets were formulated: a control diet featuring 20% FM and 7% fish oil (FO), an experimental diet incorporating a 50:50 blend of FM and AB Pav459 and reduced FO (10% FM; 4.5% FO; 10% AB), and a second experimental diet with full replacement of FM with AB Pav459 and further reduction in FO (1.75% FO; 20% AB). Replacing FM with AB Pav459 showed no significant effects on the growth performance of Atlantic salmon. Fish across all diets exhibited growth exceeding 200% from their initial weight. Analysis of total lipid content after the 12-week trial revealed no significant differences among the diets. However, individual proportions of omega-3 (ω3) and omega-6 (ω6) fatty acids varied. Fatty acid profiling in muscle and liver tissues showed distinct compositions reflective of dietary treatments. Linoleic acid (LA) and α-linolenic acid (ALA) exhibited higher proportions in total fatty acids than in membrane lipids. Docosahexaenoic acid (DHA) emerged as the predominant fatty acid in the membranes of both liver and muscle tissues. Furthermore, an analysis of sterol composition in Pavlova and salmon muscle tissue showed the presence of important sterols, including conventionally animal-associated cholesterol. This emphasizes the suitability of microorganisms, such as Pav459, for synthesizing diverse nutrients. Stable isotope analysis demonstrated direct incorporation of eicosapentaenoic acid (EPA) and DHA from diets into salmon tissues. Notably, minimal biosynthesis from the precursor ALA was observed, reaffirming the utility of Pav459-derived fatty acids. The EPA+DHA proportions in the fillet consistently met daily human consumption requirements across all dietary conditions, supporting the use of Pav459 algal biomass as an alternative to FM.

1. Introduction

The consumption of fish is crucial for obtaining omega-3 (ω3) long-chain polyunsaturated fatty acids (LC-PUFA) in human diets. As aquaculture now supplies almost half of the fish and seafood consumed by humans, it plays a vital role in the global food system, the environment, and human health [1,2]. However, carnivorous fish like Atlantic salmon still rely on some inclusion of fish oil (FO) and fish meal (FM) for essential nutrients necessary for their growth and healthy development. The sustainability issues associated with conventional marine capture fisheries, variable climatic events, and rising prices of FM and FO significantly impact their production [3]. To meet the increasing demand for aquaculture and overcome the limited resources of FM and FO, there is a pressing need for more reliable and sustainable alternative protein and lipid sources. The search for nutritionally suitable substitutes for FM and FO in aquaculture feeds has been a subject of intense research [4], with studies exploring alternatives such as terrestrial plants [5,6], insect meal [7,8], animal by-products [9,10], microalgae [11,12], single-cell protein [13], bioflocs [14], and other protein and lipid sources.
Currently, the inclusion of FM and FO in aquafeeds is optimized to meet the essential amino and fatty acid requirements for fish growth and flesh quality [7]. However, the increasing substitution of ω3 fatty acid-rich marine ingredients with ω6 fatty acid-rich terrestrial ingredients has led to chronically low ω3/ω6 ratios in modern farmed salmonid feeds [15]. This imbalance negatively affects the health of the fish and diminishes the well-established human health benefits associated with the consumption of fatty fish [16]. In this context, the development of novel, low-trophic feedstocks from microalgae has gained attention as potentially ecologically sustainable sources of essential dietary nutrients for aquaculture feeds, provided they can be produced economically [16]. Marine microalgae, including single-cell microbes, are the primary producers of ω3 LC-PUFA in the aquatic environment, continuously supplying eicosapentaenoic acid (EPA, 20:5ω3) and docosahexaenoic acid (DHA, 22:6ω3) that are concentrated through the trophic food chain, as there is limited capacity for synthesizing these beneficial fatty acids by higher trophic organisms [17].
Pavlova sp. strain CCMP459 (referred to as Pav459) is a microalga from the phylum Haptista, class Haptophyta, order Pavlovales, family Pavlovaceae, and genus Pavlova [18]. Previous studies showed the macronutrient digestibility of intact-cell Pavlova sp. 459 meal is high [19] and that Pav459 lipid is rich in polyunsaturated fatty acids (PUFA), with over 60% of fatty acids being PUFA, approximately 50% of which are ω3 fatty acids and only around 10% being ω6 fatty acids. Moreover, LC-PUFA, EPA (3% of the biomass), and DHA (1–2% of the biomass) constitute more than 70% of ω3 PUFA with demonstrated high digestibility (>98%) when fed to Atlantic salmon [16,19].
In addition to their significant fatty acid content, microalgae, particularly Pav459, have been recognized for their unique sterol composition. Several 4α-methyl sterols, including novel 3,4-dihydroxy-4α-methylsterols known as pavlovols, have been identified in dinoflagellates and microalgae from the genus Pavlova. These pavlovols contain an additional hydroxyl group at C-4, a methyl group at C-4, and no nuclear double bonds, with common representatives like 24-methylpavlovol and 24-ethylpavlovol [20].
This study aimed to investigate the effects of replacing FM with Pav459 in the diets of farmed Atlantic salmon, specifically focusing on the membrane lipid composition in the liver and muscle tissues. Our main hypothesis was that the substitution of FM with Pav459 would induce changes in the proportions of fatty acids present in the salmon tissues and membrane lipids. To test this hypothesis, we conducted a comprehensive 12-week feeding trial, formulating various diets with distinct levels of FM and Pav459 and quantifying the total fatty acid and phospholipid fatty acid (PLFA) compositions of the fish liver and muscle tissues. Additionally, we analyzed the sterol composition in Pavlova and salmon muscle tissue and utilized bulk carbon stable isotope analysis of Pav459 and compound-specific stable isotope analysis (CSIA) to determine the relative contribution of dietary Pav459 to the levels of LC-PUFA (EPA, DHA, and ARA) in fish fed the focal diets (FM and AB). This research seeks to expand the understanding of the dietary substitution of traditional marine ingredients with microalgae-based alternatives in aquaculture feeds, particularly focusing on the effects on membrane lipids in Atlantic salmon muscle and liver tissues, which have remained relatively unexplored in previous studies.

2. Materials and Methods

Diet manufacture and feeding trials were done at Dalhousie University, Truro, Nova Scotia.

2.1. Experimental Diets

Experimental diets were formulated by researchers at the National Research Council of Canada and Dalhousie University to assess the impact of substituting fish meal (FM) with algal biomass (AB) Pav459 on the lipid composition of Atlantic salmon. Our study employed three distinct dietary treatments: a control diet (FM) containing 7% fish oil (FO), 20% FM, and devoid of AB; a test diet (FM/AB) featuring reduced FO levels and a 50:50 blend of FM and AB Pav459 (4.5% FO; 10% FM; 10% AB); and a second test diet, which completely replaced FM with AB Pav459 while further reducing FO (1.75% FO; 0% FM; 20% AB). Dietary lipids were additionally sourced from poultry fat and canola oil. All diets were carefully formulated to be isonitrogenous (48% crude protein), isolipidic (23% crude lipid), and isocaloric (23 MJ/kg gross energy) and meet the nutritional requirements of Atlantic salmon as outlined by the National Research Council (NRC) guidelines (2011) [21]. The experimental diets were produced by extrusion at the Chute Animal Nutrition Lab at Dalhousie University Faculty of Agriculture (Truro, Nova Scotia, Canada). The ingredients were provided by Northeast Nutrition (Truro, Nova Scotia, Canada). Further details on production methods of these experimental diets can be found in Wei et al. (2022) [22]. The AB Pav459 used in the study was produced at the National Research Council of Canada’s Marine Research Station in Ketch Harbour, NS, Canada. Detailed information on the culture production methods can be found in Tibbetts et al. (2020) [16], Wei et al. (2022) [22], and Tibbetts and Patelakis (2022) [19]. For specific details on diet formulations, please refer to Wei et al. (2022) [22] and Table A1 in Appendix A.

2.2. Experimental Fish and Set-Up

Atlantic salmon post-smolts were received from Dartek (Merigomish, NS, Canada). A total of 153 fish were randomly distributed into nine tanks (200 L) in a flow-through freshwater system at Dalhousie University Agricultural Campus (Bible Hill, NS, Canada). Employing a completely randomized design, each tank served as an independent experimental unit, with three replicate tanks per dietary treatment. Atlantic salmon post-smolts (170.1 ± 23.9 g) (mean ± SD) were fed commercial feed (3 mm) twice a day for two weeks for acclimation after the transfer. The system maintained a constant water flow rate of 2–3 L/min, providing the fish with freshwater at a temperature of 13 °C and oxygen saturation levels of 100%. Temperature and oxygen levels were measured and recorded daily. Fish were hand-fed the experimental test diets for 12 weeks after the initial sampling (week 0) twice a day at 9:00 and 15:00 until the fish were satiated. The hand-feeding was performed carefully to ensure a minimum amount of feed was wasted. Feed consumption was recorded weekly for each tank. The system was exposed to a natural photoperiod (16 h light: 8 h dark). Tanks were purged daily to remove fecal material. Mortalities were checked twice daily.

2.3. Tissue Sampling

To ensure accurate weighing, feed was withheld from the fish for one day prior to the designated sampling day. At week 0 (before the initiation of experimental diets) and at the end of the 12-week trial, five randomly chosen fish per tank were sampled. The ethical treatment of the fish strictly followed the guidelines set forth by the Canadian Council of Animal Care under the approved protocol #2017-84 by the Dalhousie University Faculty of Agriculture Institutional Animal Care Committee. Individual fish were rapidly netted and euthanized with an overdose of anesthetic using tricaine methane sulfonate (TMS222, administered at 150 mg/L) (Sigma Chemicals, St. Louis, MO, USA) buffered using sodium bicarbonate (150 mg/L) (Sigma Chemicals, St. Louis, MO, USA), and clinical signs of death were ensured prior to sampling. The skin was removed from the left side, and subsamples of white dorsal muscle were collected for subsequent analysis. The skinless dorsal muscle tissue, as well as liver samples, were taken for protein, energy, lipid class, and fatty acid composition analysis. The samples were flash-frozen in liquid nitrogen immediately after sampling and stored at −80 °C. The sampled tissues were then placed in lipid-clean glass vials with chloroform. The air space was filled with nitrogen before capping the vials and sealing them with Teflon tape. The samples were then stored in a −20 °C freezer until extraction.

2.4. Ethical Approval

The ethical treatment of fish in this study strictly followed the regulations set forth by the Canadian Council of Animal Care. The research was conducted at the Dalhousie University Faculty of Agriculture, with approved Institutional Animal Care Committee Protocol number #2017-84, prioritizing the welfare and ethical treatment of the fish.

2.5. Lipid Extraction

Lipid samples were extracted following the method described by Parrish (1999) [23]. Samples were homogenized in a 2:1 mixture of ice-cold chloroform:methanol using a Tissue Master 125 homogenizer (Omni International, Kennesaw, GA, USA). To achieve a chloroform:methanol:water ratio of 8:4:3, chloroform-extracted water was added. The sample was then sonicated for 4 min in an ice bath and centrifuged at 5000 rpm for 3 min. The bottom, organic layer was removed using a double pipetting technique, placing a long, lipid-clean Pasteur pipette inside a short one to remove the organic layer without disturbing the top aqueous layer. Chloroform (EMD Millipore Corporation, Burlington, MA, USA) was then added back to the extraction test tube, and the entire procedure was repeated three more times. All organic layers were pooled into a lipid-clean vial.

2.6. Fatty Acid Methyl Ester (FAME) Derivatization

To form fatty acid methyl esters (FAME), an aliquot of lipid extract was transferred to a lipid-clean 7 mL vial and evaporated under nitrogen gas to dryness. Then 1.5 mL of methylene chloride (EMD Millipore Corporation, Burlington, MA, USA) and 3 mL Hilditch reagent were added. The Hilditch reagent was prepared by dissolving 1.5 mL of concentrated sulfuric acid (VWR International, Mississauga, ON, Canada) in 100 mL of methanol (EMD Millipore Corporation, Burlington, MA, USA) that had been dried over anhydrous sodium sulfate (Fisher Scientific Company, Ottawa, ON, Canada). The vial was capped under a nitrogen atmosphere, vortexed, and sonicated for 4 min before being heated at 100 °C for 1 hr. The mixture was allowed to cool to room temperature, and then approximately 0.5 mL saturated sodium bicarbonate solution (Fisher Scientific Company, Ottawa, ON, Canada) was added, followed by 1.5 mL hexane (EMD Millipore Corporation, Burlington, MA, USA). The mixture was shaken, and the upper, organic layer was transferred to a lipid-clean 2 mL vial. The upper, organic layer was then evaporated under a constant stream of nitrogen gas until dry, and the residue was reconstituted with approximately 0.5 mL of hexane. The vial was capped under a nitrogen atmosphere, sealed with Teflon tape, and sonicated for an additional 4 min to ensure proper resuspension of the fatty acids.

2.7. Neutral Lipid/Polar Lipid Separation

The separation of neutral lipids and polar lipids was performed using Strata SI-1 silica tubes (Phenomenex, Torrance, CA, USA) in a vacuum chamber. The silica tube was initially rinsed with 6 mL of methanol, 6 mL of chloroform, and 3 mL of a solvent mixture containing 98:1:0.5 chloroform:methanol:formic acid (Fisher Scientific Company, Ottawa, ON, Canada) through the column into a waste vial. Then the sample extract was applied directly to the silica using a long pipette, and the sample vial was rinsed with a small amount of chloroform. The waste vial was replaced with a lipid-clean 15 mL vial, and 8 mL of the solvent mixture (98:1:0.5 chloroform:methanol:formic acid) was eluted through the column to collect all the neutral lipid-containing eluent. To recover the acetone-mobile polar lipid (AMPL), a second 15 mL vial was inserted, and the silica gel was rinsed with 6 mL (2 × 3 mL) of acetone (EMD Millipore Corporation, Burlington, MA, USA). The vial containing the AMPL fraction was then replaced with a larger 40 mL vial, and 3 mL of chloroform was passed through the column to remove any remaining acetone. For the elution of phospholipids (PL), two volumes (6 mL) of methanol were used, followed by 9 mL of a mixture of chloroform:methanol:water (5:4:1). The PL fraction was transferred to a 50 mL round-bottom flask and completely dried in a flash evaporator. The dried lipids were washed into a 15 mL vial using methanol and chloroform. The phospholipid fatty acid (PLFA) was derivatized using the same procedure as the total fatty acid methyl esters (FAME) described in Section 2.6.

2.8. Sterol Derivatization and Analysis

Sterols were derivatized by silylation with N, O-bis-trimethylsilyl trifluoroacetamide (BSTFA) containing 1% trimethylchlorosilane (TMCS) (Supelco Inc., Bellefonte, PA, USA) to form their corresponding trimethylsilyl (TMS)-ethers [24]. Lipid extracts were evaporated until dry under a stream of nitrogen gas. BSTFA (100 μL) containing 1% TMCS was added to the lipid extract, which was heated at 85 °C for 15 min. Samples were then cooled to room temperature, and excess reagent was evaporated under nitrogen. Hexane/dichloromethane (500 μL, 1:1, by vol) (Sigma Chemicals, St. Louis, MO, USA) was added before analysis by gas chromatography-mass spectrometry (GC-MS).

2.9. Quantitative Lipid Analysis

Lipid classes were determined using thin-layer chromatography with flame ionization detection (TLC-FID) in a Mark VI Iatroscan (Mitsubishi Kagaku Iatron, Inc., Tokyo, Japan). Silica-coated Chromarods were employed, and a three-step development method was followed, as described by Parrish (1999) [23].
Each lipid extract was spotted on an individual rod using a 20 μL Hamilton syringe, and a narrow band was obtained by focusing the sample with a 100% acetone solution. The first development system consisted of a hexane/ethyl ether/formic acid mixture (99:1:0.05). The rods were developed for 25 min, followed by drying in a constant humidity chamber for 5 min, before being developed again in the same solution for 20 min. After the first development, the rods were scanned in the Iatroscan (covering 75% of the rod), which detects the hydrocarbon (HC), steryl ester (SE), and ketone (KET) lipid classes.
Upon completion of the first scan, the rods were dried in a constant humidity chamber for 5 min before proceeding with the second development for 40 min. The second development system comprised a hexane:ethyl ether:formic acid mixture (79:20:1). Following the second development, the rods were scanned in the Iatroscan (covering 89% of the rod) to identify the triacylglycerol (TAG), free fatty acids (FFA), alcohol (ALC), and sterol (ST) lipid classes.
For the third and final separation, the rods were subjected to two rounds of development in 100% acetone for 15 min, dried for 5 min in a constant humidity chamber, and then developed twice for 10 min in a mixture of chloroform:methanol:chloroform-extracted water (50:40:10). After the third development, the rods were scanned in the Iatroscan (covering 100% of the rod) to determine the AMPL and PL lipid classes. The data were collected using Peak Simple software (ver. 3.67, SRI Inc., Torrance, CA, USA), and the Chromarods were calibrated using standards obtained from Sigma Chemicals (Sigma Chemicals, St. Louis, MO, USA).
The fatty acid methyl esters (FAME) samples were analyzed using an HP 6890 gas chromatography (GC)-FID equipped with a 7683 autosampler. A ZB-WAXplus column (Phenomenex) with a length of 30 m and an internal diameter of 0.32 mm was employed. The column temperature was initially set at 65 °C and held for 0.5 min. It was then ramped to 195 °C at a rate of 40 °C/min, held for 15 min, and further ramped to a final temperature of 220 °C at a rate of 2 °C/min. The carrier gas used was hydrogen at a flow rate of 2 mL/min. The injector temperature started at 150 °C and ramped to a final temperature of 250 °C at a rate of 120 °C/min. The detector temperature remained constant at 260 °C. Retention times from standards purchased from Supelco (Supelco Inc., Bellefonte, PA, USA) were used for peak identification. Chromatograms were integrated using Agilent OpenLAB Data Analysis—Build 2.203.0.573 (Agilent Technologies, Inc., Santa Clara, CA, USA). The GC column was periodically checked using a quantitative standard purchased from Nu-Chek Prep, Inc. (product number GLC490) to ensure expected areas were obtained approximately every 300 samples or once a month.

2.10. Compound-Specific Stable Isotope Analysis (CSIA)

The δ13C (13C/12C) values of identified FAME were measured and analyzed using an Agilent 6890N gas chromatograph coupled via a GC Combustion III interface to a Delta V Plus isotope ratio mass spectrometer (Thermo Fisher Scientific, Mississauga, ON, Canada) at the Core Research Equipment and Instrument Training Network (CREAIT Network) of Memorial University. The analysis included FAME samples from two focal diets (FM, AB; n = 3), FAME samples from muscle total fatty acids (FM, AB; n = 9), six randomly selected FAME samples from muscle PLFA (FM, AB; n = 3), FAME samples from liver PLFA (FM, AB; n = 9), and six randomly selected FAME samples from liver total fatty acids (FM, AB; n = 3). All δ13C values were calculated relative to the Vienna Pee Dee Belemnite (VPDB) standard using the following equation:
δ 13 C = R s a m p l e R s t a n d a r d 1 × 1000
where R is the ratio of 13C/12C. An aliquot of the methanol used during the FAME derivatization of fatty acids was collected and analyzed for δ13C composition at the University of Ottawa (Ottawa, ON, Canada) to correct for the additional methyl group added to fatty acids during transesterification. The correction for the methyl group was applied to all fatty acids using the equation:
δ 13 C = n + 1 δ 13 C F A M E n δ 13 C F F A
where n is the number of carbon atoms in the fatty acid.
Finally, a two-end-member mixing model was used to determine the relative contributions to liver and muscle EPA, DHA, and ARA in the two dietary treatments:
δ 13 C   T i s s u e , k = X k δ 13 C p r e + 1 X k δ 13 C L C P U F A
where Xk is the proportion of precursor carbon contribution to k, the fatty acid of interest (i.e., EPA or DHA). δ13Cpre is the isotopic signature of precursor, while δ13CLC-PUFA is the isotopic signature of EPA or DHA in each of the two diets.
The bulk carbon stable isotopes were analyzed in an Elemental Analyzer (EA) system (NA1500; Carlo-Erba) consisting of an autosampler, an oxidation reactor (oven), a reduction reactor, a water trap, a GC column, and a thermal conductivity meter (TCD). Additional details on instrumentation and bulk stable isotope results are included in Appendix C.

2.11. Statistical Analysis

The resulting data are reported as mean ± standard deviation. All statistical analyses were conducted using general linear models in Minitab (version 18; Minitab Inc., State College, PA, USA). The model was designed to assess the effects of diet (fixed factor) and nested tank (fixed factor within diet) on different lipid classes and fatty acids (response variables). The conditions, selection, and care of the tanks were purposely maintained identical and only applied to this experiment, hence the selection of tank as a fixed factor. Significant difference was set at fixed α = 5% criterion (p < 0.05). Pairwise comparison was performed using Tukey post hoc test for multiple comparisons to detect differences between diets. Normality testing was performed using the Anderson–Darling test.
Principal coordinate analysis (PCO) was employed to describe the resemblance and variation in fatty acid composition in muscle and liver tissue. A correlation matrix was plotted on two PCO axes (PCO1 and PCO2) using PRIMER (Plymouth Routines in Multivariate Ecological Research; PRIMER-E Ltd., version 6.1.15, Ivybridge, UK). The similarity of percentages analysis (SIMPER) was utilized to quantify differences among treatments in the fatty acid data. In all cases, the non-parametric Bray-Curtis similarity index was employed.

3. Results

3.1. Pavlova sp. 459 Oil and Experimental Diets Composition

The lipid analysis of Pav459 resulted in a total lipid content of 109.6 mg/g w/w (Table 1). The predominant lipid class was TAG, comprising 24.7% of the total lipids, followed by AMPL at 22.9%, FFA at 18.5%, PL at 16.6%, and ST at 10.9%. The fatty acid composition of Pav459 was primarily composed of PUFA at 64.5%, with saturated fatty acids (SFA) accounting for 23.0% and monounsaturated fatty acids (MUFA) at 11.2% (Table 1). Notably, EPA was the most abundant PUFA at 26.8%, followed by DHA at 13.6%, with arachidonic acid (ARA, 20:4ω6) present in trace amounts at 0.5%. The precursor fatty acids, linoleic acid (LA) and alpha-linolenic acid (ALA), were approximately equal at 3.5% and 3.6%, respectively. The total omega-3 (ω3) fatty acids were four times more prevalent than ω6 fatty acids, resulting in a ω3/ω6 ratio of 4.3.
An analysis of lipid extracted from Pav459 resulted in a total of 11 sterols identified by mass spectrometry and shown in order of retention time in Table 2. The major sterols identified were cholesterol, campesterol, stigmasterol, stigmasta-22-en-3-β-ol, 23,24-dimethylcholest-5-en-3β-ol, 4α-methylporiferast-22-enol, and 24-ethylpavlovol. The 11 GC-MS-determined sterols from the total lipid extract summed to 9.8%, which compares well with the Iatroscan-determined free sterol content.
Specific to the Pavlova genus, 24-methylpavlovol and 24-ethylpavlovol, recognized as pavlovols, are 3,4-dihydroxy-4α-methyl sterols with unique features, including an additional hydroxyl group at C-4, a methyl group at C-4, and no nuclear double bonds [20].
The biochemical composition of Pav459 resulted in a well-balanced nutritional profile, with a dry matter content of 95%, a protein content of 60.87%, and a crude lipid content of 12.25%, of which 10.68% is esterifiable lipid (Table A2 in Appendix A). The mineral analysis resulted in significant levels of essential elements, including calcium (0.36%), magnesium (0.4%), phosphorous (1.2%), potassium (1.4%), and sodium (1.2%). These minerals are crucial for supporting various physiological functions in aquatic organisms. The carotenoid analysis revealed key compounds with potential immunological benefits, such as astaxanthin, known for its antioxidant properties. In aquaculture, microalgal astaxanthin can enhance immune responses, boost disease resistance, and improve survival rates in aquatic animals. This is achieved through its antioxidative properties, induction of antioxidant enzymes, and modulation of key immunological biomarkers [25]. Astaxanthin content was 9.09 mg/100 g; canthaxanthin was 40.6 mg/100 g; chlorophyll a and b were 2259.69 mg/100 g and 62.1 mg/100 g; and β-carotene was 65.87 mg/100 g. For full details on biochemical composition, please refer to Wei et al. (2022) [22] and Table A2 in Appendix A.
Total lipid content varied among diets, with FM/AB having the highest at 200.0 mg/g w/w and FM the lowest at 144.2 mg/g w/w (Table 3). TAG was the major lipid class in the diets, comprising 72.7% to 75.1% of total lipids, followed by FFA at 8.5% to 9.1%, PL at 3.1% to 6.3%, AMPL at 5.0% to 8.0%, and ST at 3.5% to 7.5%. Although the PL proportion in the FM/AB diet was twice as low as in other diets, it was not statistically significant. Significant differences were observed for the ST and AMPL lipid classes. The fatty acid composition was predominantly MUFA at 44.8% to 47.1%, followed by PUFA at 31.0% to 32.3%, and SFA at 20.8% to 22.3%. While the EPA and DHA proportions were lower in the AB diet compared with the FM and FM/AB diets, LA and ALA precursors were higher in the AB diet. Despite lower EPA and DHA proportions in the AB diet (~1%), the combined EPA+DHA exceeded the NRC’s (2011) [21] recommended minimum levels (0.5–0.8%). ARA proportions were similar across diets, and ω6 fatty acids prevailed over ω3 fatty acids, resulting in a ω3/ω6 ratio less than 1 across all treatments.

3.2. Growth Performance

After a 12-week feeding period, the experimental diets had no negative effects on fish growth. The average weight gain across the diets was approximately 263%, with the salmon showing substantial growth from their initial weight of approximately 170.1 ± 23.9 g. The mean weights of salmon fed the FM, FM/AB, and AB diets reached 451.0 g, 449.7 g, and 440.0 g, respectively, compared with their initial weight of 170.1 g. This growth translated to weight gains of 279.6 g, 276.3 g, and 271.3 g, respectively, with specific growth rates of 1.2% per day. Further details on growth performance, including additional parameters, have been previously published by Wei et al. (2022) [22], and key results are provided in Appendix A.

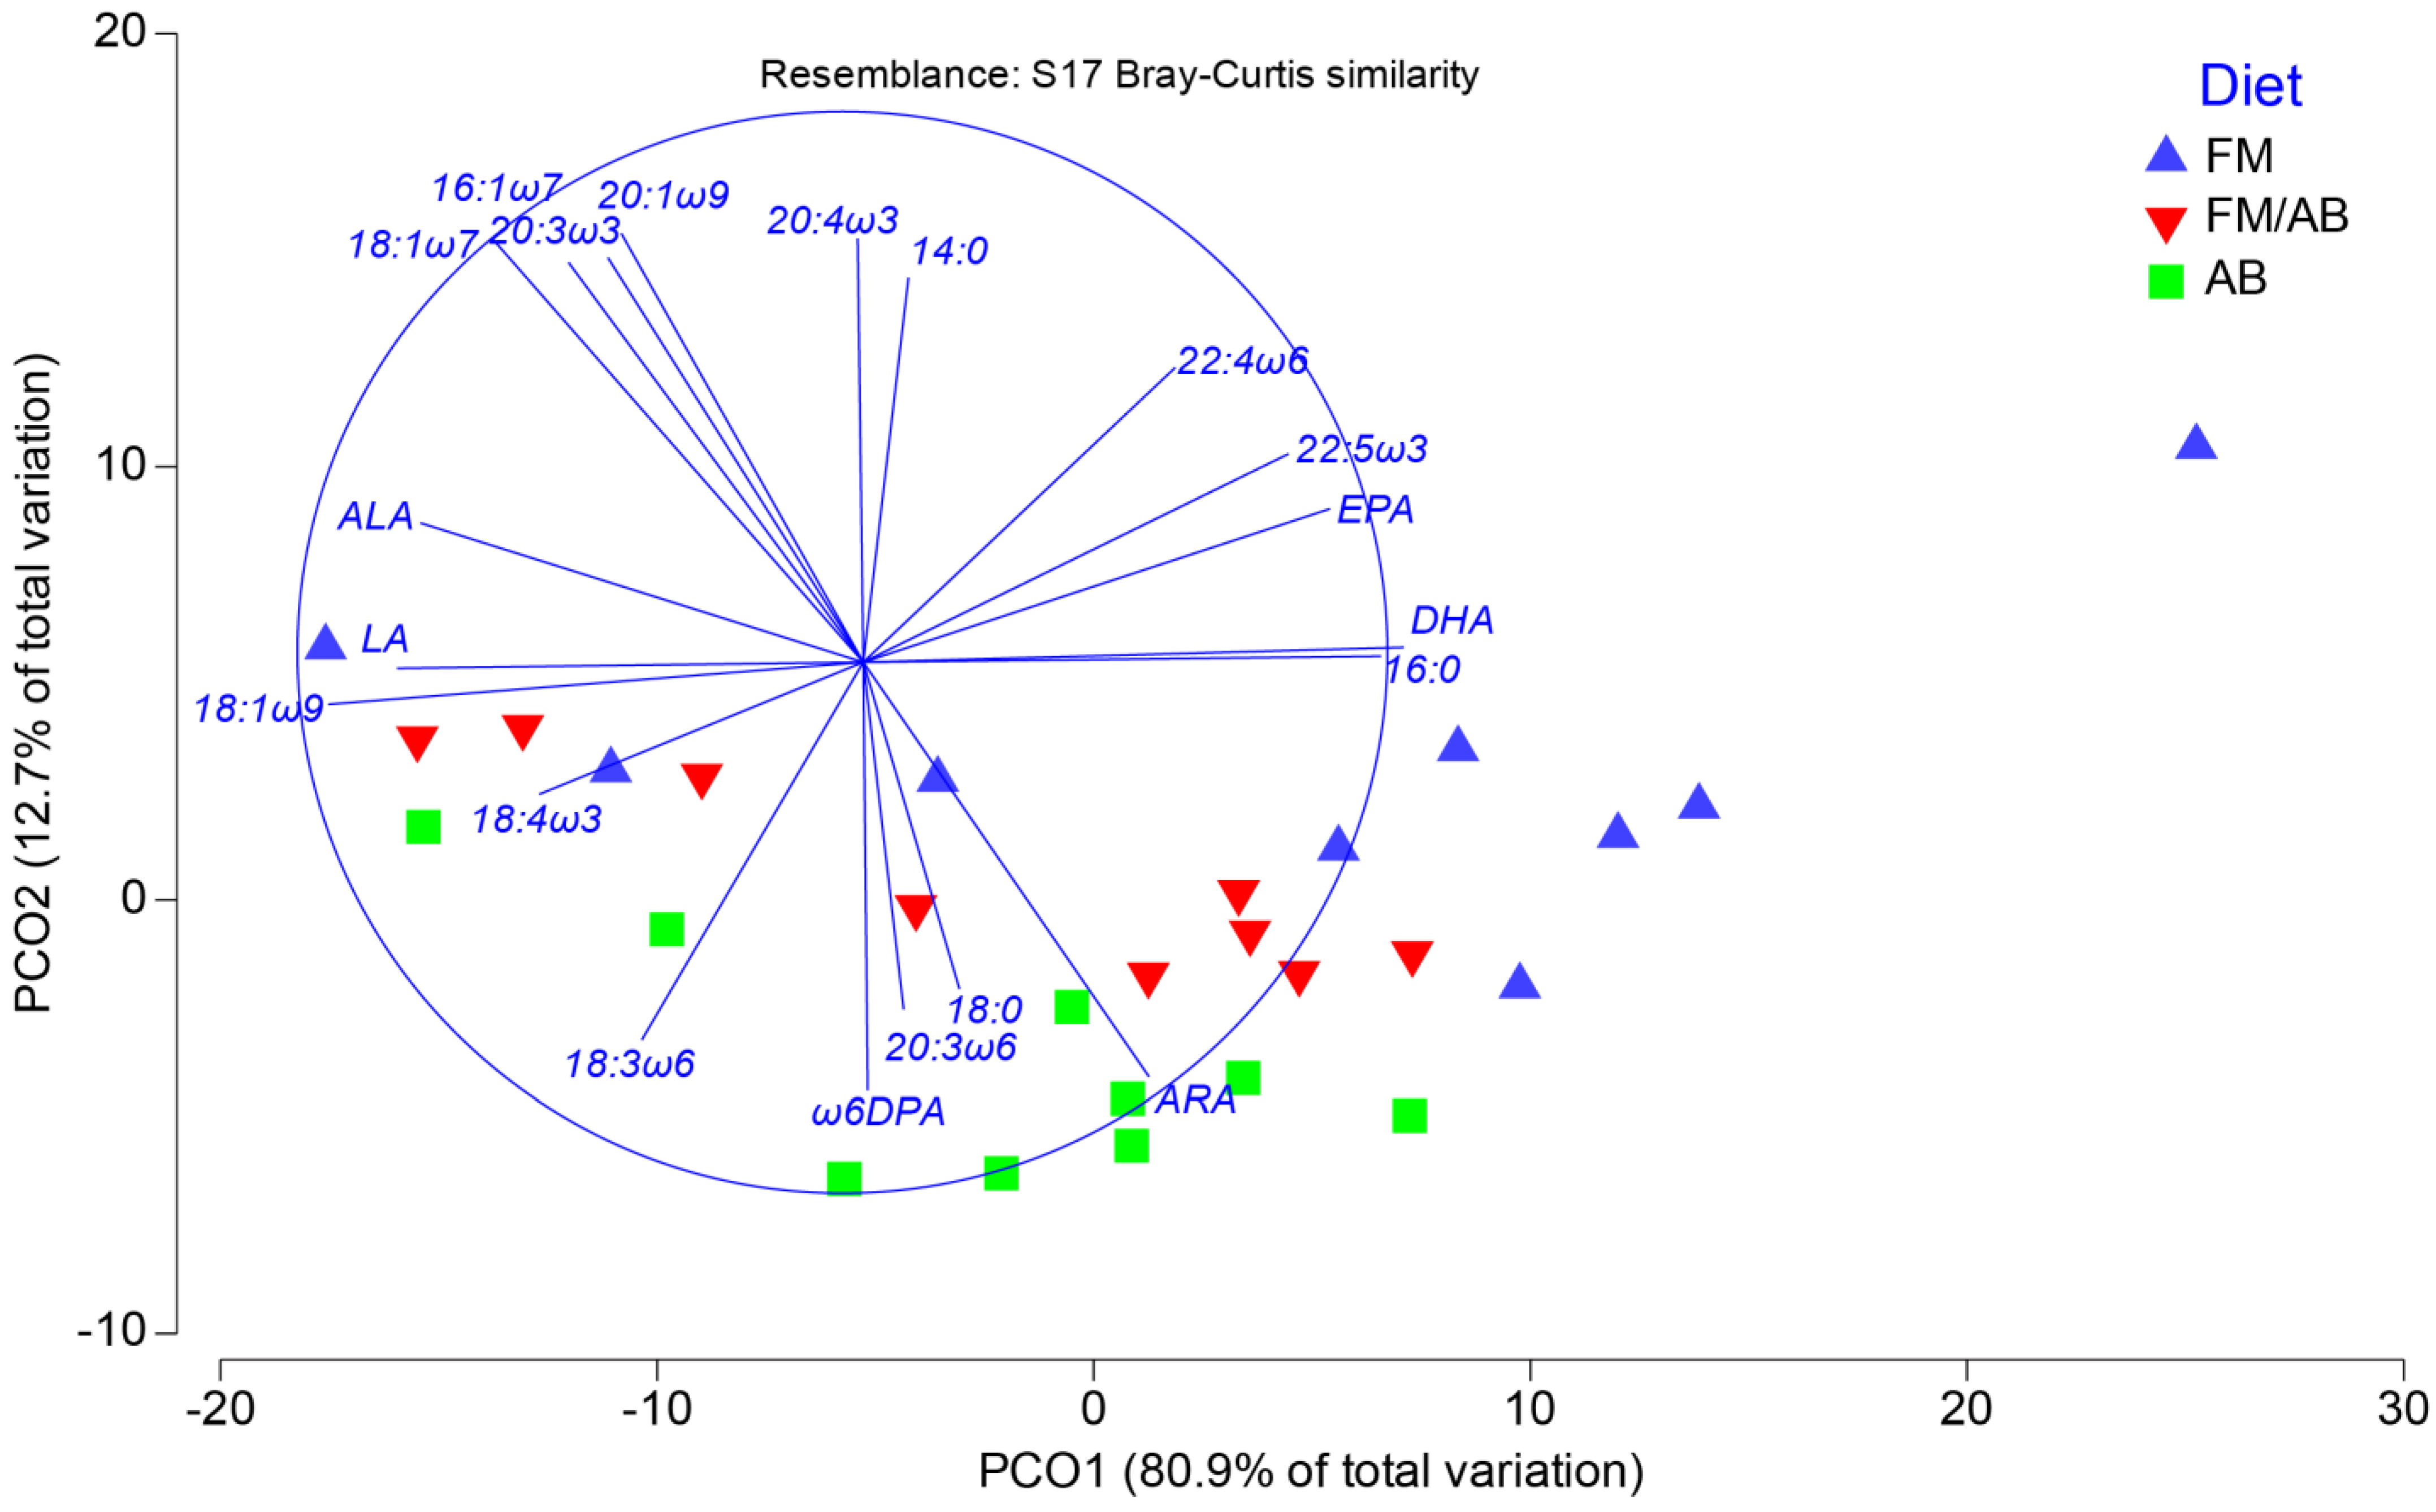
3.3. Liver Tissue Lipid Classes and Fatty Acid Composition

The initial total lipid content in liver tissue was 18.3 mg/g w/w, primarily comprised of neutral lipids (Table 4). Following a 12-week feeding period, total lipid concentration increased uniformly across all dietary treatments (24.4–28.3 mg/g w/w), with neutral lipid remaining the dominant component (62.1–65.1%). The major lipid classes included FFA (25.4–30.2%), PL (23.4–25.4%), ST (20.4–23.9%), and TAG (6.8–12.4%). No significant differences were observed for any lipid classes among the dietary treatments.
After 12 weeks of feeding, the fatty acid profile of liver tissue reflected the diet (Table 4). While the differences in total fatty acid proportions were generally small, they were statistically significant across the dietary treatments. Most notably, significant differences were observed between salmon fed the AB diet and those fed the FM diet, with occasional distinctions between salmon fed the FM/AB and FM diets. The predominant fatty acid composition was PUFA, ranging from 45.4% to 48.3%, followed by MUFA (32.9% to 37.7%) and SFA (16.6% to 18.4%). Compared with the fatty acid proportions at the start of the experiment, most individual fatty acid proportions decreased, except for 18:1ω9, MUFA, LA, ALA, and total ω6 fatty acids in all dietary treatments. DHA emerged as the dominant PUFA in liver tissue, ranging from 19.6% to 23.7%, followed by LA (7.7% to 9.5%), EPA (3.5% to 5.5%), ARA (2.5% to 3.7%), and low levels of ALA (0.9% to 1.1%). The sum of ω3 fatty acids was approximately twice as prevalent as ω6 fatty acids in the livers of salmon fed the FM and FM/AB diets and 1.3 times more prevalent in the livers of salmon fed the AB diet, resulting in a ω3/ω6 ratio exceeding 1 across all dietary treatments.
PCO of week-12 liver tissue total fatty acid composition showed that PCO1 and PCO2 accounted for 80.9% and 12.7% of the variability, respectively (Figure 1). The PCO biplot revealed the highest variation between salmon fed the FM and AB diets. SIMPER analysis (Table A4 in Appendix B) indicated 82.6% similarity within salmon fed the FM diet, 89.1% within salmon fed the FM/AB diet, and 90.4% within salmon fed the AB diet. The greatest dissimilarities were observed between salmon fed the FM and AB diets (16.8%), followed by FM and FM/AB diets (15.4%), and FM/AB and AB diets (10.7%). Primary contributors to similarities and dissimilarities were 18:1ω9, DHA, 16:0, and LA.

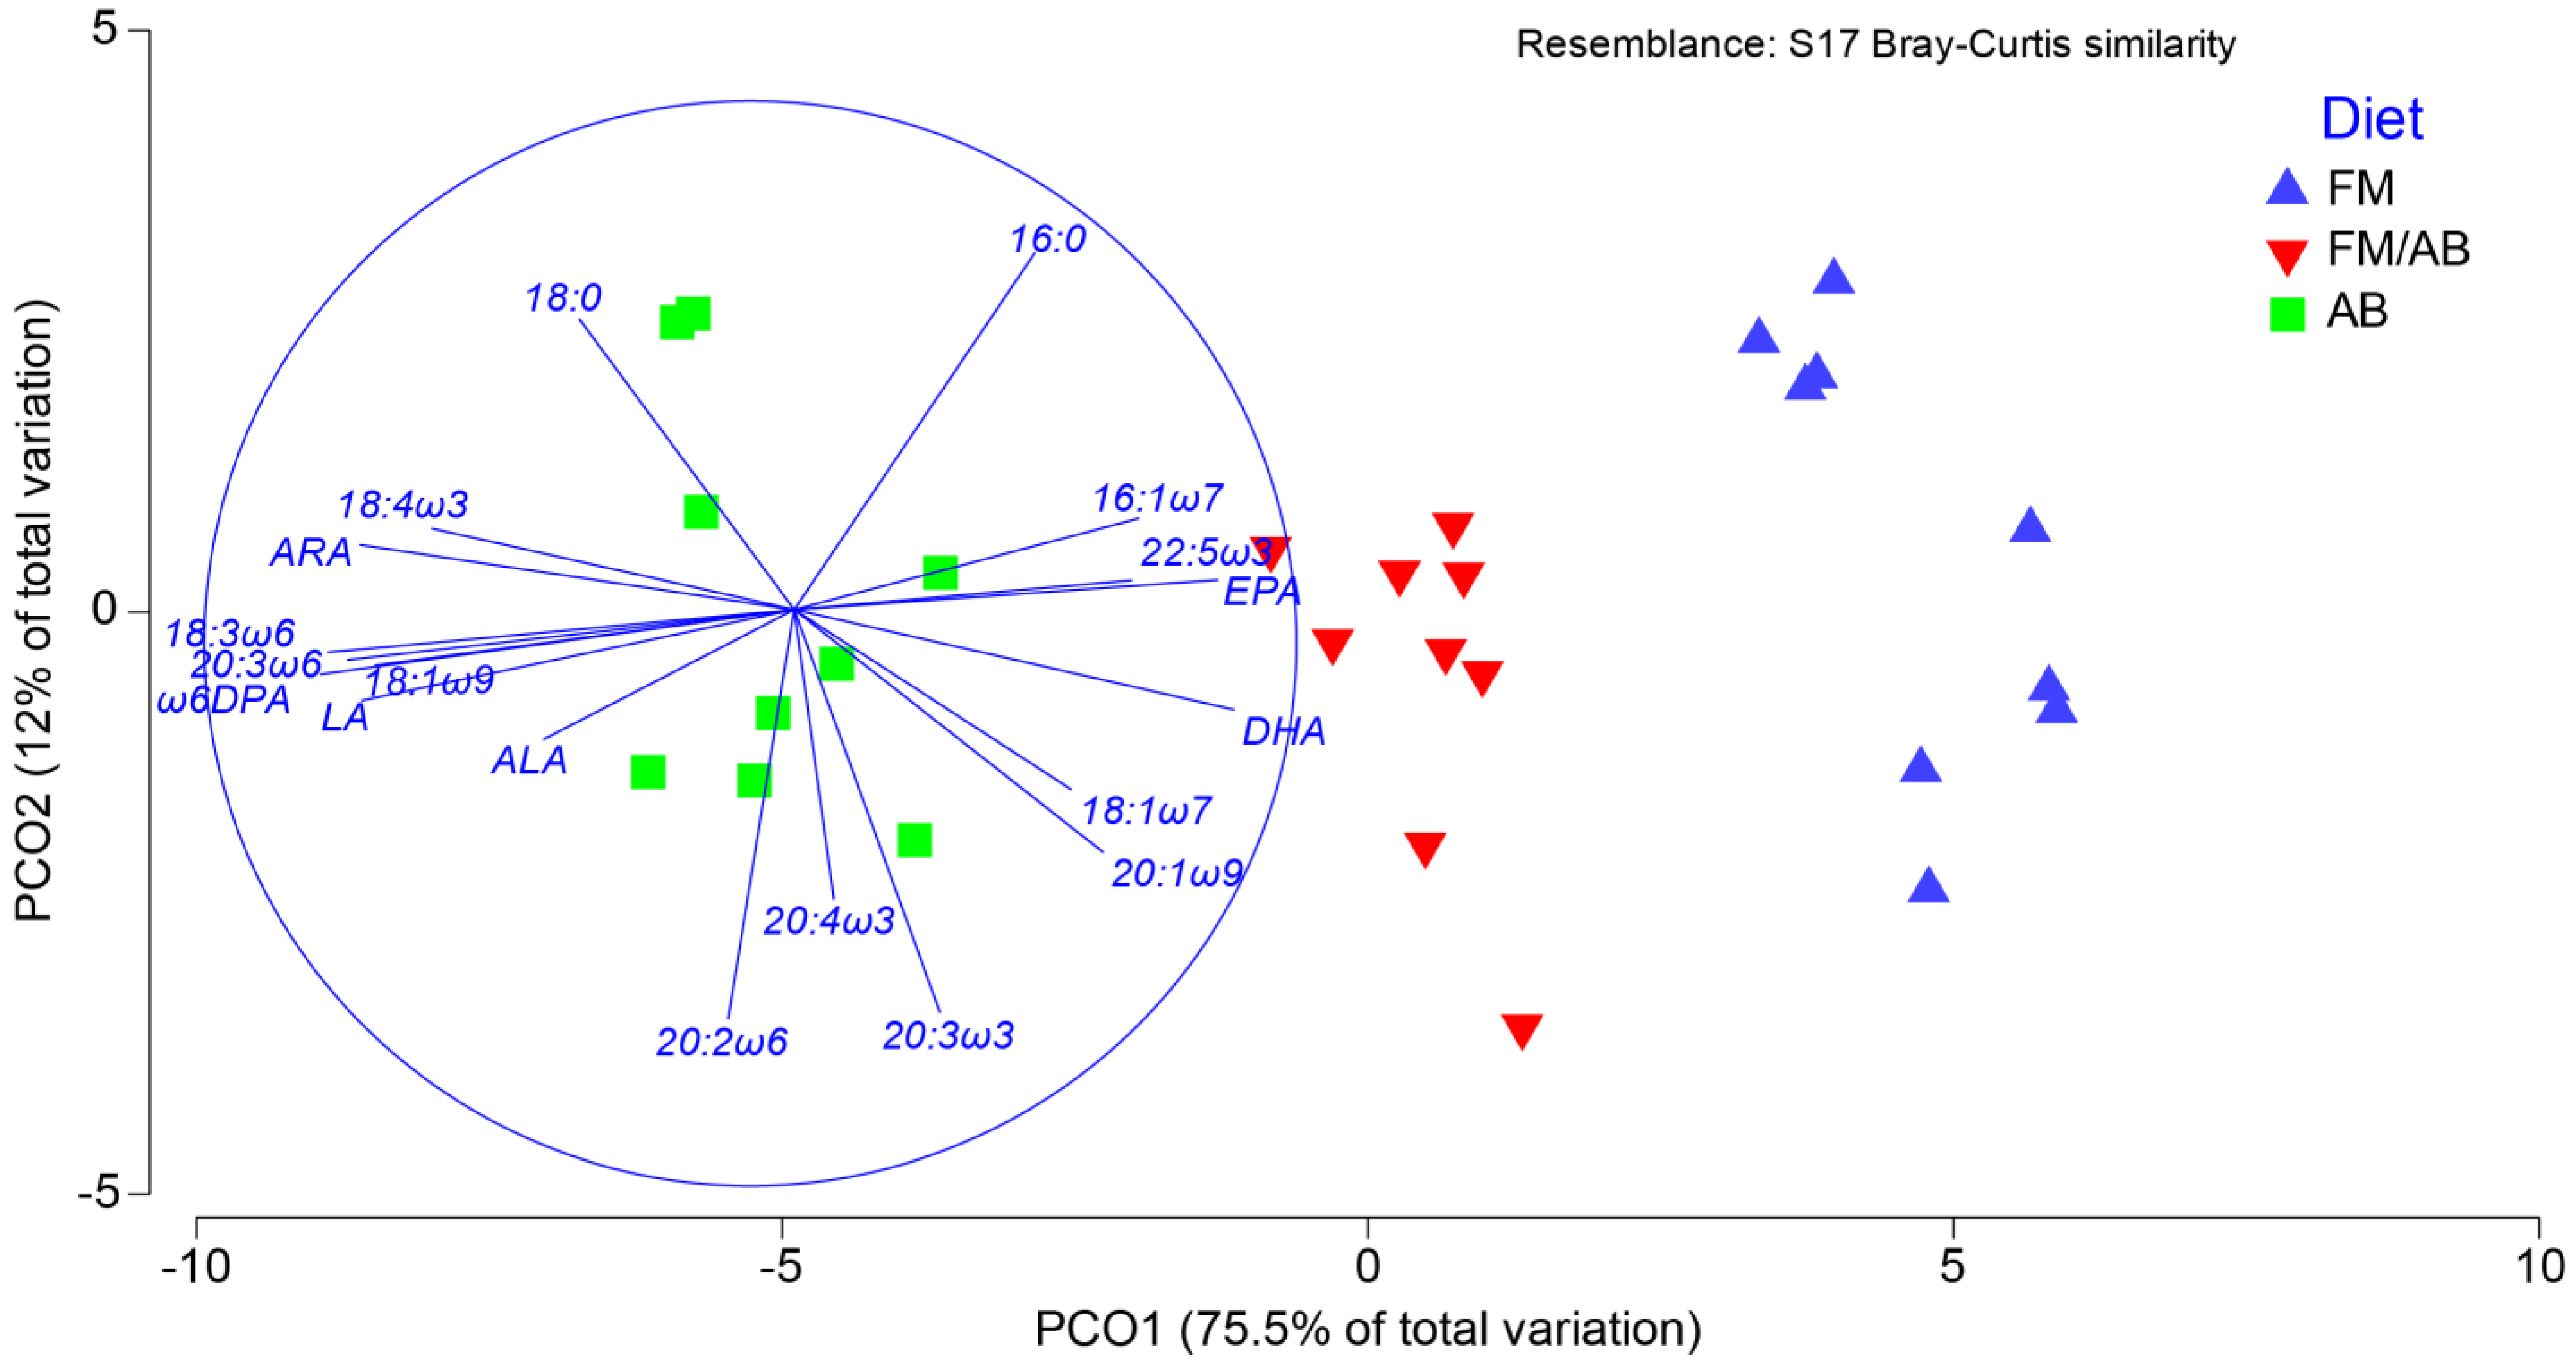
3.4. Liver Tissue Phospholipid Fatty Acid Composition

Liver tissue PLFA profiles also reflected the diets (Table 5). Although the differences in PLFA proportions among the diets were relatively small, they were statistically significant, particularly between salmon fed the AB diet and salmon fed the FM diet. The liver tissue PLFA profile primarily comprised PUFA (58.5–59.3%), followed by SFA (23.2–24.1%) and MUFA (17.0–17.4%). DHA emerged as the dominant PUFA in membrane phospholipids, followed by EPA, LA, and ARA. The proportions of EPA and DHA were higher and significantly different in salmon fed the FM and FM/AB diets compared with those fed the AB diet, while the proportion of ARA was higher and significantly different in salmon fed the AB diet compared with those fed the FM and FM/AB diets. Precursors LA and ALA showed higher proportions in storage and lower proportions in the membrane. The total sum of ω3 fatty acids was approximately 3-fold more prevalent than ω6 fatty acids in salmon fed the FM and FM/AB diets, and approximately 2-fold more prevalent than ω6 fatty acids in salmon fed the AB diet, resulting in a ω3/ω6 ratio greater than 2 across all dietary treatments. The DHA/EPA ratio was higher and significantly different in salmon fed the AB diet (7.0%) than those fed the FM diet (5.1%). The EPA/ARA ratio was higher and significantly different in salmon fed the FM diet (2.1%) than those fed the AB diet (0.8%). The DHA/ARA ratio was higher and significantly different in salmon fed the FM diet (10.7%) than those fed the AB diet (5.9%).
PCO of liver PLFA at week 12 revealed that PCO1 and PCO2 accounted for 75.5% and 12.0% of the variability, respectively (Figure 2). The PCO biplot exhibited clear separation between salmon fed different diets, with significant dissimilarity observed between salmon fed the AB and FM diets. Further analysis using SIMPER (Table A5 in Appendix B) showed a 96.1% similarity within salmon fed the FM diet, a 97.0% similarity within salmon fed the FM/AB diet, and a 96.6% similarity within salmon fed the AB diet. The greatest dissimilarities were observed between salmon fed the FM and AB diets (10.3%), followed by salmon fed the FM/AB and AB diets (6.4%), and salmon fed the FM and FM/AB diets (5.5%). The main contributors to the similarities were DHA, 16:0, and 18:1 ω9 across all dietary treatments, while EPA, DHA, 22:5ω6, and ARA were the primary drivers of dissimilarities. The specific order and contribution percentages of these fatty acids to the similarities and dissimilarities varied among the dietary treatments.

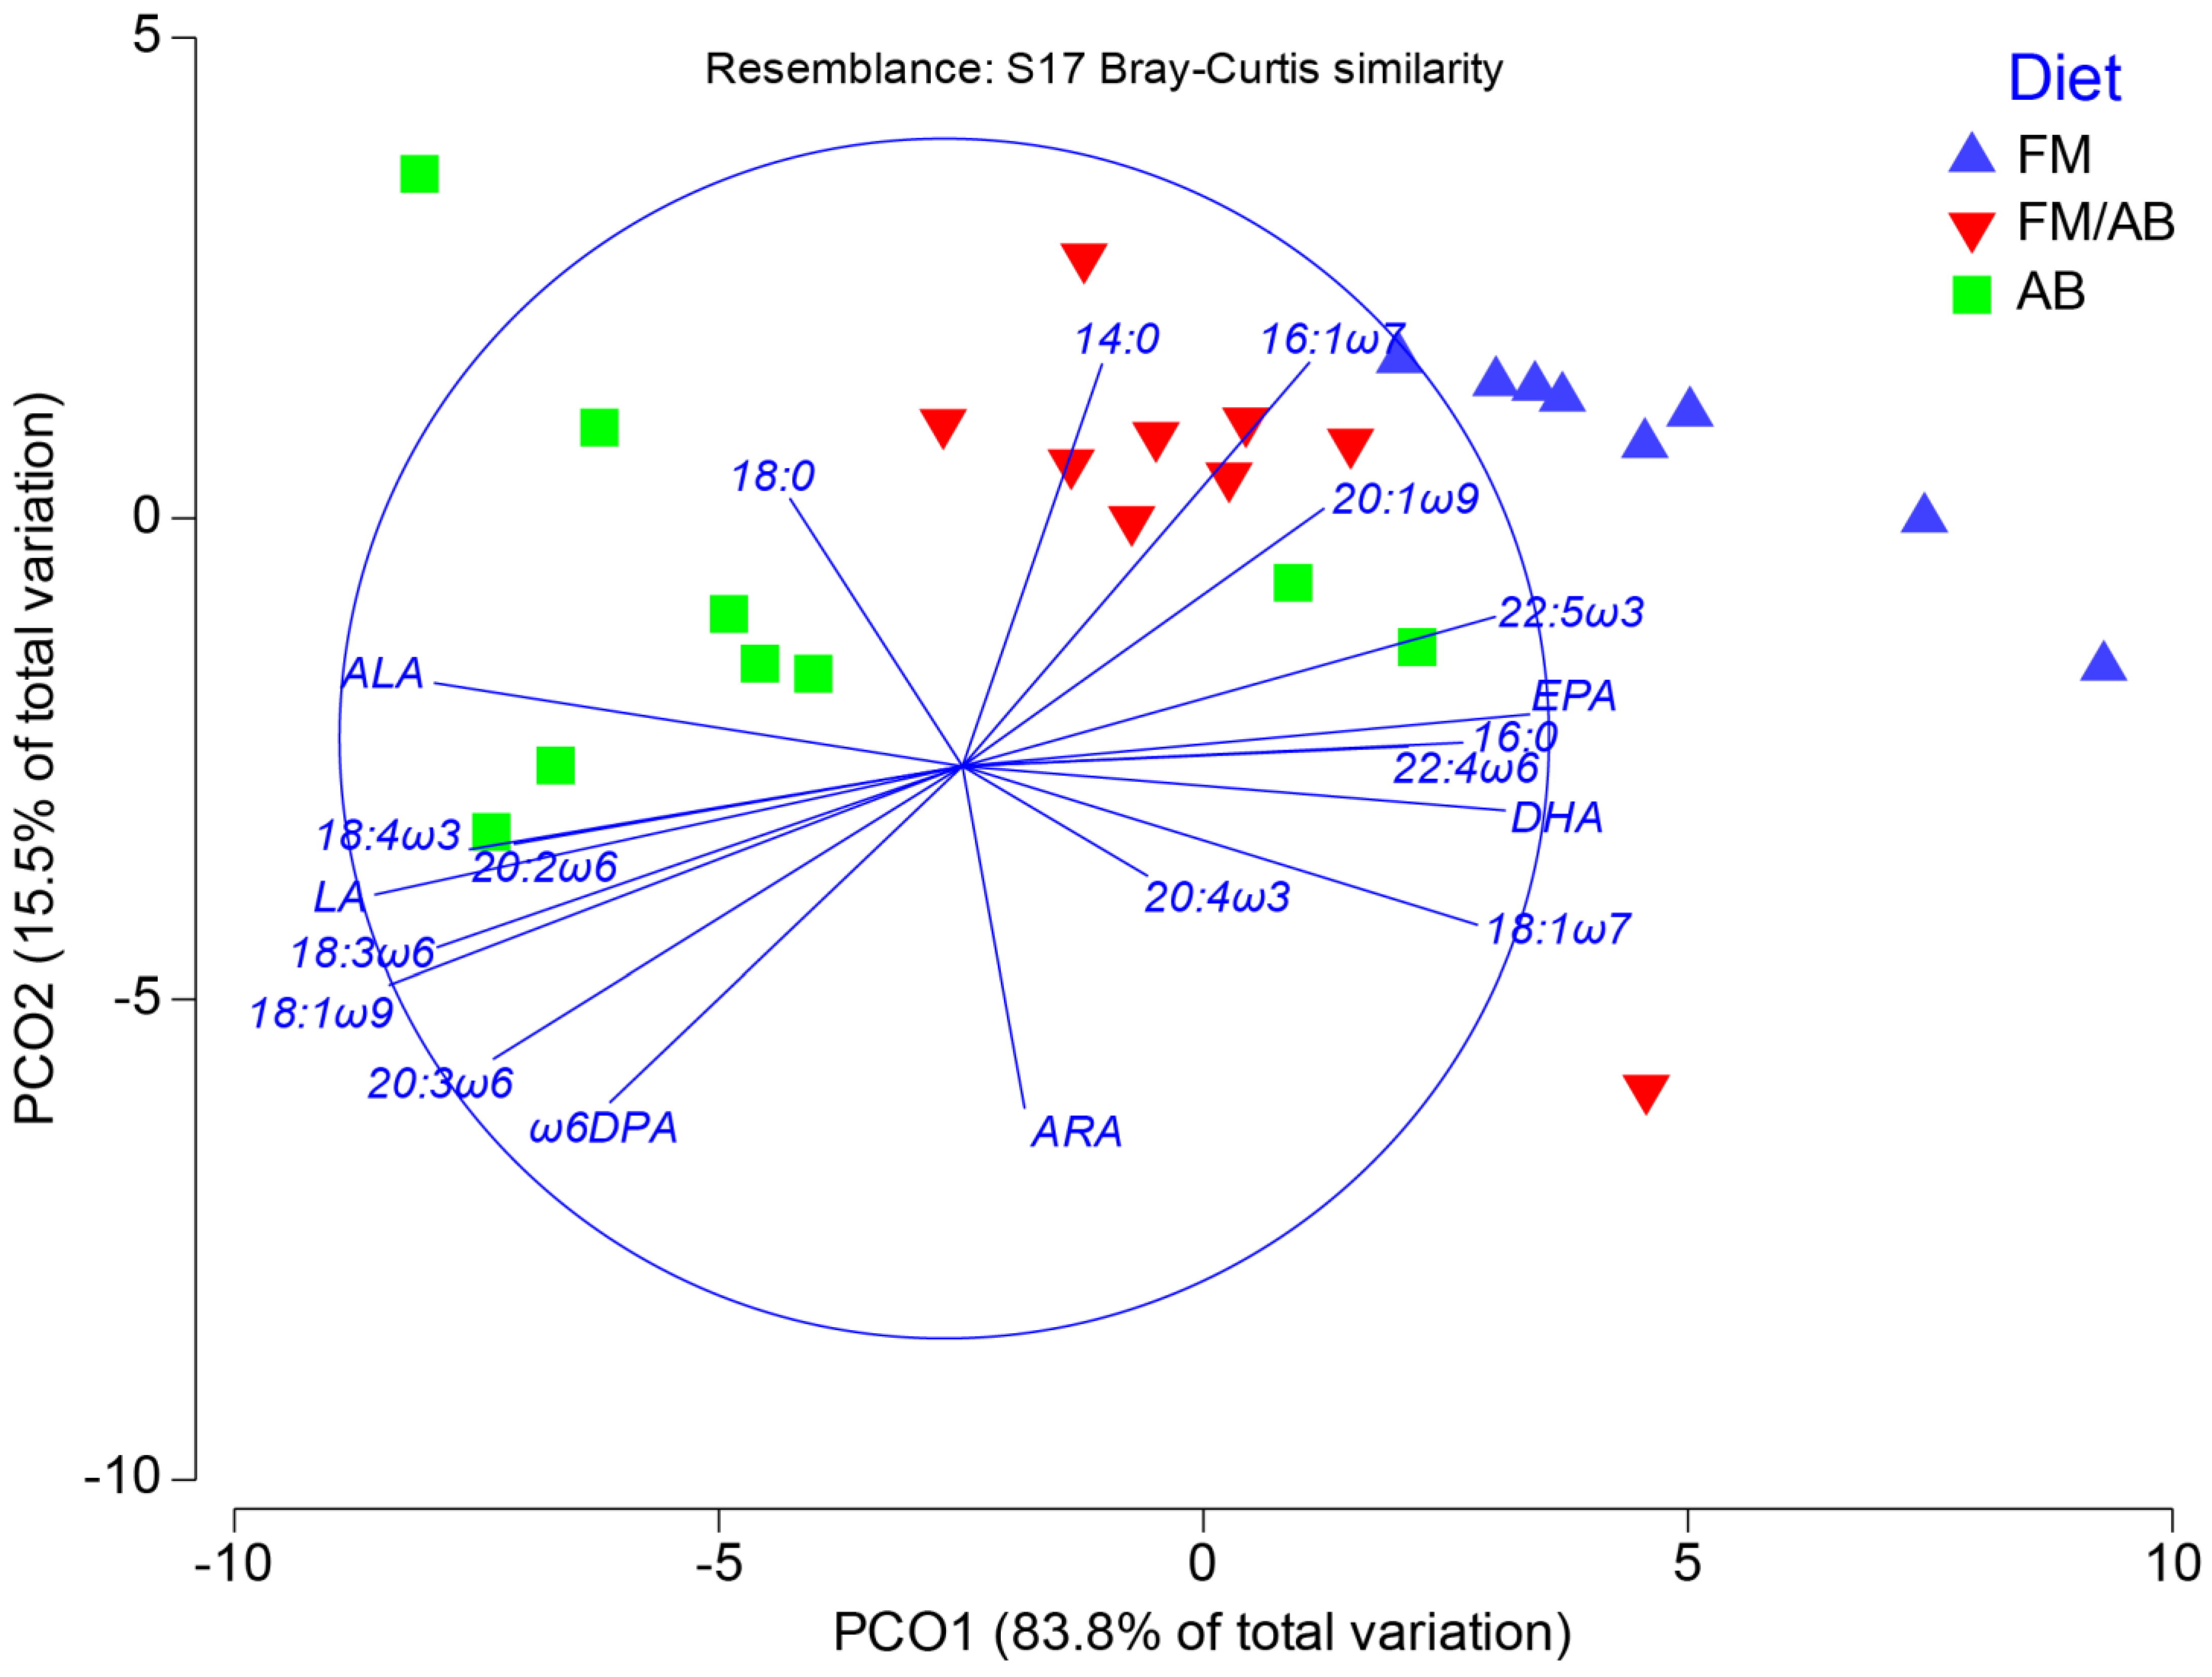
3.5. Muscle Tissue Lipid Class and Fatty Acid Composition

The initial total lipid content in muscle tissue at week 0 was 15.8 mg/g w/w, primarily consisting of neutral lipids (Table 6). Following 12 weeks of feeding, there was a substantial increase in total lipid concentration in salmon fed the FM diet (70.4 mg/g w/w), approximately 4.5 times higher than the initial level. Similarly, salmon fed the FM/AB diet (64.5 mg/g w/w) and AB diet (63.4 mg/g w/w) exhibited an average 4-fold increase in total lipid concentration (Table 6). However, there were no significant differences in total lipid concentration among the dietary treatments. The composition of muscle tissue lipids was predominantly neutral (61.4–75.5%) across all dietary treatments. Among the lipid classes, TAG was the most abundant at 43.9–54.8%, followed by PL (8.1–20.3%), ST (6.2–11.9%), and FFA (4.1–7.5%). Notably, the proportion of PL in salmon fed the FM/AB diet was significantly lower than the proportion of ST, while the FFA proportion was higher and significantly different compared with salmon fed the FM and AB diets. The ST proportion in salmon fed the AB diet was significantly lower compared with salmon fed the FM and FM/AB diets.
The fatty acid profile of muscle tissue after the 12-week feeding trial also reflected the diets (Table 6). Although the differences in total fatty acid proportions were relatively small, they were statistically significant across the dietary treatments. Significant differences were observed between salmon fed the AB diet and those fed the FM diet, with occasional significant differences between salmon fed the FM/AB diet and the FM diet. The predominant fatty acid composition in muscle tissue was MUFA (42.1–43.7%), followed by PUFA (35.4–36.4%) and SFA (19.5–21.1%). Similar to liver tissue, most individual fatty acids decreased compared with the initial levels, except for 18:1ω9, MUFA, LA, ALA, and total ω6 fatty acids across all dietary treatments. The dominant PUFA in muscle tissue was the precursor LA (12.8–15.4%), followed by DHA (7.6–9.8%), EPA (2.7–3.9%), and ALA (2.3–2.7%), while ARA was present in very low proportions (0.6%). The total sum of ω3 fatty acids was approximately equal to or slightly higher than the sum of ω6 fatty acids in salmon fed the FM and FM/AB diets and slightly lower than the sum of ω6 fatty acids in salmon fed the AB diet, resulting in a ω3/ω6 ratio equal to or greater than 1 in salmon fed the FM and FM/AB diets and a ω3/ω6 ratio slightly less than 1 in salmon fed the AB diet.
PCO of muscle total fatty acids at week 12 revealed that PCO1 and PCO2 accounted for 83.8% and 15.5% of the variability, respectively (Figure 3). Unlike liver PLFA, the PCO biplot for muscle total fatty acids did not show clear differentiation between the dietary treatments, although the highest variation was observed between salmon fed the FM and AB diets. SIMPER analysis (Table A6 in Appendix B) demonstrated a 90.7% similarity within salmon fed the FM diet, a 95.3% similarity within salmon fed the FM/AB diet, and a 92.8% similarity within salmon fed the AB diet. The dietary treatments with the highest dissimilarities were between salmon fed the FM and AB diets (13.6%), followed by salmon fed the FM and FM/AB diets (8.8%), and salmon fed the FM/AB and AB diets (7.9%). The main drivers of similarities and dissimilarities were 18:1ω9, 16:0, DHA, and LA. The specific order and contribution percentages of these fatty acids to the similarities and dissimilarities varied among the dietary treatments.

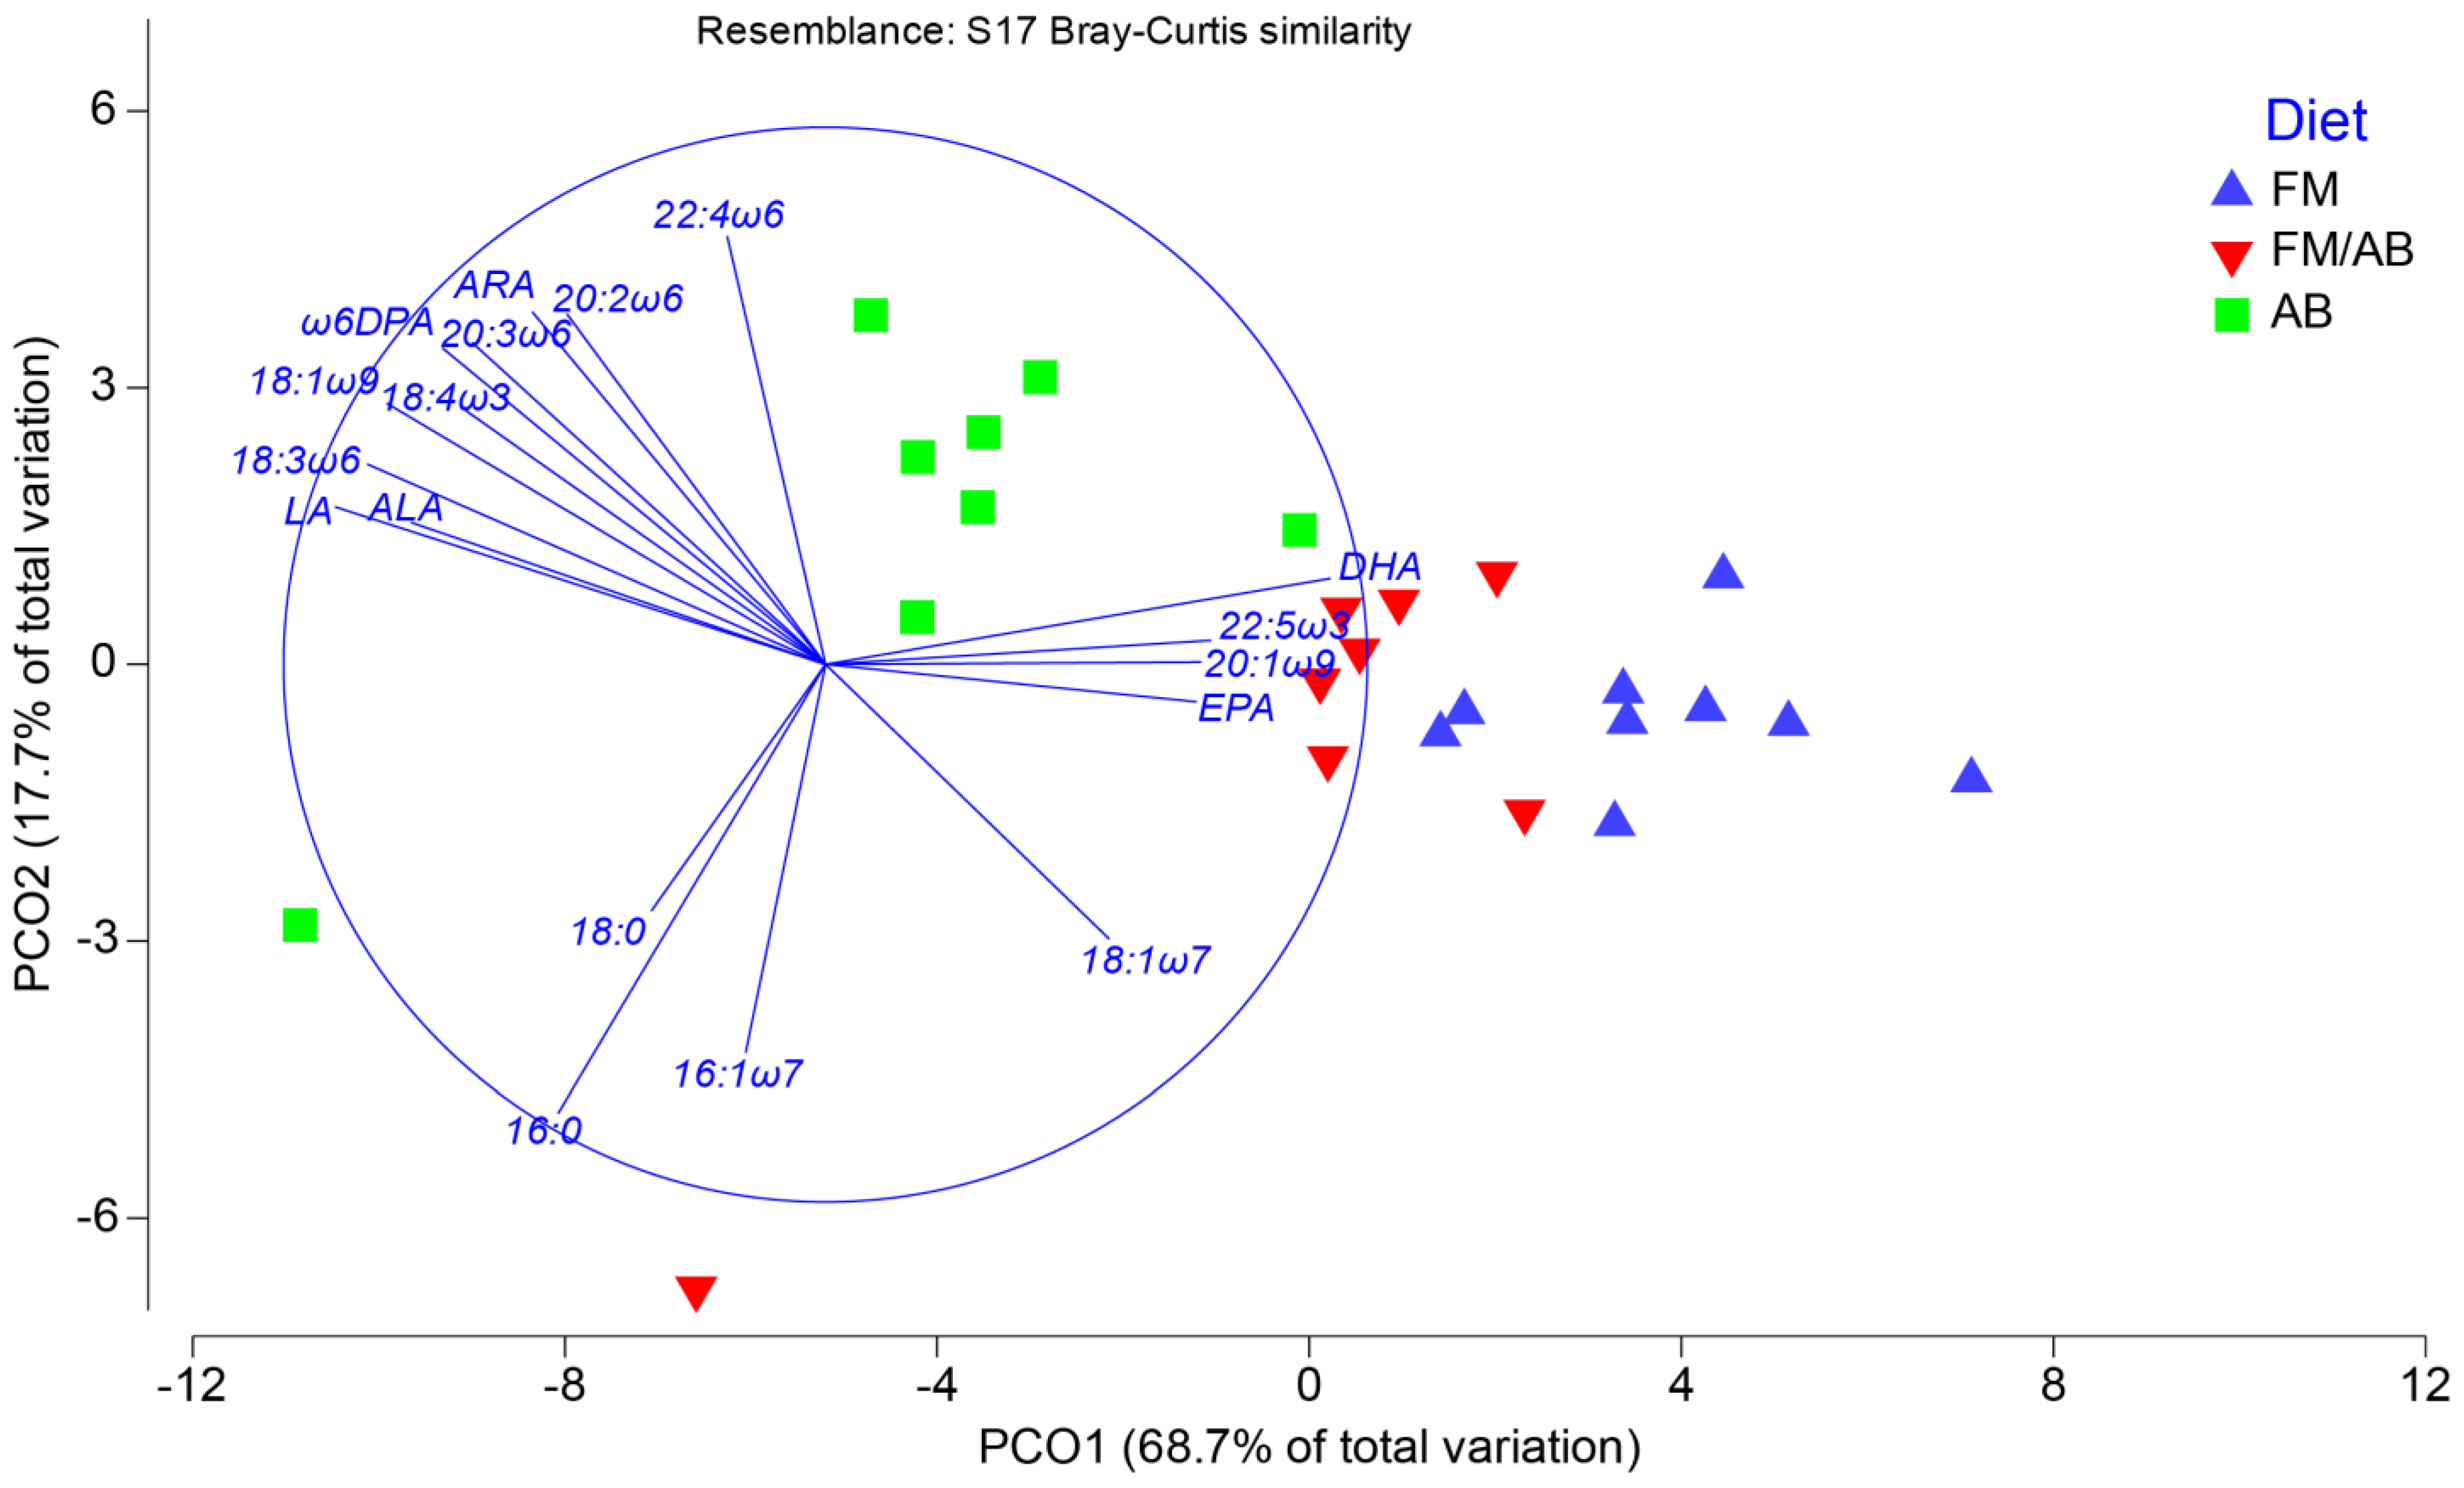
3.6. Muscle Tissue Phospholipid Fatty Acid Composition

The muscle tissue PLFA profiles also reflected the dietary treatments (Table 7). Although the differences were minimal, they were statistically significant across the dietary treatments, particularly between salmon fed the FM diet and those fed the AB diet. The predominant composition of muscle tissue PLFA was PUFA (59.2–60.4%), followed by SFA (24.2–25.1%) and MUFA (14.0–15.0%). In contrast to the overall muscle tissue fatty acid composition, the dominant PUFA in the membrane was DHA (33.3–38.2%), followed by EPA (6.7–8.7%), LA (4.1–5.6%), 22:5ω3 (1.7–2.3%), ARA (1.3–1.9%), and ALA (1.1–1.4%). No significant differences were observed in the proportion of DHA among the dietary treatments. However, EPA was significantly higher in salmon fed the FM diet compared with those fed the FM/AB and AB diets, while ARA was significantly higher in salmon fed the AB diet compared with those fed the FM and FM/AB diets. Similarly, the precursors LA and ALA were significantly higher in salmon fed the AB diet compared with those fed the FM and FM/AB diets. The total sum of ω3 fatty acids was approximately 7-fold higher than the sum of ω6 fatty acids in salmon fed the FM diet, approximately 5-fold higher in salmon fed the FM/AB diet, and approximately 4-fold higher in salmon fed the AB diet. As a result, there was a ω3/ω6 ratio greater than 3 across the dietary treatments. Differences in the DHA/EPA ratio, EPA/ARA ratio, and DHA/ARA ratio were mostly minimal but significant across the dietary treatments.
PCO of muscle PLFA at week 12 indicated that PCO1 and PCO2 accounted for 68.7% and 17.7% of the variability, respectively (Figure 4). The muscle PLFA PCO biplot revealed that the main variation was between salmon fed the FM and AB diets. SIMPER analysis (Table A7 in Appendix B) demonstrated a 96.5% similarity within salmon fed the FM diet, an 87.0% similarity within salmon fed the FM/AB diet, and a 94.8% similarity within salmon fed the AB diet. The highest dissimilarity was between salmon fed the FM/AB and AB diets (10.8%), followed by salmon fed the FM and FM/AB diets (9.9%), and salmon fed the FM and AB diets (9.1%). The main drivers for similarities in muscle PLFA were DHA, 16:0, and 18:1ω9 across all dietary treatments, while the main drivers for dissimilarities were DHA, 16:0, 18:1ω9, EPA, and 22:5ω6. The specific order and contribution percentages of these fatty acids to similarities and dissimilarities varied among the dietary treatments.

3.7. Muscle Tissue Sterol Composition

The sterols identified in the neutral lipid fraction of Atlantic salmon muscle tissue from a fish fed an AB diet were cholesterol, cholestanol, lathosterol, campesterol, 5α-cholest-8(14)-en-3β-ol, and 23,24-dimethylcholest-5-en-3β-ol (Table 8). Other Pavlova sterols were notably absent. The 6 GC-MS-determined sterols from the Atlantic salmon muscle tissue fed an AB diet summed to 4.44%.

3.8. Compound-Specific Stable Isotope Analysis

The δ13C values for EPA and DHA in the two focal dietary treatments (FM and AB) were significantly different from each other (Table 9). Unfortunately, the δ13C values for ARA in the diets were not detectable; therefore, the relative contribution (RC) in the tissues was undetermined. There was a significant difference for ALA between the two dietary treatments, but there was no significant difference for LA. There were significant differences for EPA, DHA, and ARA in both liver total fatty acids (TFA) (Table 9) and liver PL (Table 10) between salmon fed the FM diet and salmon fed the AB diet. Similarly, in the muscle tissue, there were also significant differences for EPA, DHA, and ARA in both muscle TFA (Table 11) and muscle PL (Table 12). As for the precursors LA and ALA, there was a significant difference for LA in the liver PL and a significant difference for ALA in muscle TFA between salmon fed the FM diet and salmon fed the AB diet. The δ13C value for ALA was not detectable in the liver tissue. The tissue δ13C values for EPA and DHA in the AB treatment were substantially more negative than any ALA measurement, which suggests ALA is unlikely to be a significant contributor; therefore, the two-end-member mixing model was based on Pav459 bulk stable isotope data (−55.7 ± 0.4‰), in the absence of CSIA data for Pav459.

4. Discussion

The study evaluated the effects of replacing FM and reduced FO with the AB of Pav459 in the feeds of Atlantic salmon. The results showed that replacing FM with Pav459 did not have a significant impact on the growth parameters of the salmon. The experimental feeds had a crude protein content of approximately 49%, which met the minimal 44% digestible protein requirement suggested by the NRC (2011) [21] for salmon weighing 20–200 g, assuming an average protein digestibility of 91.2% measured in salmon fed highly similar Pav459 test diets [19].
Although the growth performance of the fish was not significantly affected by replacing FM with Pav459, it is important to note that the total oil contribution of Pav459 in the diets was 1.2% in the FM/AB diet and 2.4% in the AB diet. The major oil contributors in the experimental diets were canola oil (6.8% for FM/AB; 7.9% for AB), poultry fat (5.9% for FM/AB; 6.9% for AB), and herring oil (4.5% for FM/AB; 1.8% for AB). Generally, canola oil in aquafeed is 95–98% TAG, where 5–7% is SFA, 55–72% is MUFA, 19–23% is ω6 PUFA, and 6–12% is ω3 PUFA [26]. Poultry fat is generally composed of 85–90% total lipid and is rich in MUFA and poor in PUFA with ω6 > ω3 [27,28]. Herring oil is rich in TAG, generally contributing in excess of 90% of the total fatty acid composition. FO is best known and highly regarded for the high proportions of ω3 LC-PUFA, with levels of EPA and DHA ranging from 3.9–15.2% and from 2.0–7.8%, respectively [29]. Although the oil contribution of Pav459 was low, its fatty acid composition was rich in PUFA (64.5%), where the ω3 LC-PUFAs EPA+DHA accounted for 40.4% of total FAME. Additionally, we identified a few fatty acid biomarkers for Pav459, which were 16:1ω5, 16:2ω4, stearidonic acid (SDA, 18:4ω3) and 22:5ω6. These biomarkers were found in the tissues and also embedded in the membrane, especially 22:5ω6 (particularly concentrated in the phospholipid fractions), which was present in higher proportions in salmon fed the AB diet than in salmon fed the FO diet.
Overall, the fish grew approximately 263% from their initial weight of 170.1 g across the diets, with fish fed all diets achieving a specific growth rate of 1.2%/day and a feed conversion ratio of 0.9 g feed/g gain. This demonstrates that Pav459 could be included in the feeds of Atlantic salmon at up to 20% of the diet without compromising growth and feed utilization parameters. The results of the present study are similar to other feeding trial studies in which the authors did not detect any significant effects on growth parameters when FM was partially replaced by different strains of AB in Atlantic salmon diets [30,31], hybrid striped bass diets [32], European seabass [33], and shrimp diets [34], just to mention a few. Although immunology, lipid oxidation, goblet cells, mucus production, and the microbiome were not a focus of this study, other studies that included microalgal biomass in feeds in aquaculture revealed positive results in enhancing immune response [35,36], decreasing nitric oxide [37], increasing goblet cell density in the anterior intestine [38], modulating mucosal immune function, and increasing microbiome diversity indices for microbial communities in the gut of fish fed diets with PUFA-rich microalgae compared with controls [36]. This further supports the potential of marine microalgae as an alternative food source in aquafeeds, either as oil or as biomass.

4.1. Liver Tissue

The liver plays an important role in LC-PUFA biosynthesis and overall body lipid homeostasis in Atlantic salmon [39]. In this study, there were no significant differences in the total lipid composition or the neutral and polar lipid composition of the liver tissue across the dietary treatments. The liver tissue mainly consisted of neutral lipids, with FFA being the dominant lipid class, followed by PL, ST, and TAG (Table 4). Salmon fed the FM diet had higher proportions of TAG and FFA in the liver tissue, while salmon fed the FM/AB diet had higher proportions of PL and ST. The proportion of TAG increased across the dietary treatments but did not show a significant difference at the end. The presence of increased TAG suggests storage of fat in the liver tissue, even though salmon primarily store excess fat in muscle tissue [40].
PL was the second most dominant lipid class in the liver tissue across the dietary treatment, followed by ST. This indicates the importance of membrane material in liver tissue, as both PL and ST play a role in maintaining membrane structure. Cholesterol, a common sterol, modulates the physical properties of membranes [41], and the fluidity of the lipid bilayer depends on the degree of order in the packing of phospholipids [42]. For achieving (or evaluating) fluidity, homeostasis, and plasticity of cellular membranes, we have to look at significant differences in the tissue PL/ST ratio (Table 4) and the membrane P/S fatty acid ratio (Table 5); however, since there were no differences in the tissue PL/ST ratio or membrane P/S fatty acid ratio, adjustments in membrane fluidity likely did not occur in this experiment. The total fatty acid composition of the liver tissue generally reflected the diet composition (Table 4). The dominant fatty acids in liver tissues were 16:0, 18:1ω9, LA, and DHA, with each accounting for more than 4% among all dietary treatments. PLFA composition (Table 5) shared the same dominant fatty acids along with EPA. SIMPER analysis indicated that the dominant fatty acids mentioned above were responsible for the dissimilarities observed in both total fatty acid and PLFA profiles (Table A4 and Table A5 in Appendix B). While there were similarities between the total fatty acid profile and PLFA profile, PCO analysis showed that in the liver tissue there was more variation within salmon fed the same diet (80.9% variation) than salmon fed different diets (12.7% variation) (Figure 1). In contrast, for PLFA, there was more variation between salmon fed different diets (75.5% variation) than within the same diet (12.0% variation) (Figure 2).
The proportion of PUFA in liver PL was higher than that in the diet, while MUFA was lower. This suggests a possible preferential β-oxidation of MUFA when they are present in high concentrations in the diet [43,44], and possible elongation and desaturation of 18:3ω3 to maintain cellular function homeostasis [45]. There was no significant change in the proportion of SFA in liver PL. Although Pav459 was rich in PUFA, its contribution to the overall oil content in the diets was low (1–2%). Canola oil and poultry fat, the main oil contributors in the diets, are rich in MUFA, which likely influenced the higher proportion of MUFA observed in the diets and reflected in the liver tissue. The proportion of EPA in liver PL did not show a significant variation compared with the diet. However, it is worth noting that the proportion of DHA in liver PL was 8-fold higher in salmon fed the FM diet, 11-fold higher in salmon fed the FM/AB diet, and 17-fold higher in salmon fed the AB diet than that of the diet. This emphasizes the importance of DHA over EPA in the membrane, even though the initial proportion of DHA across the dietary treatments was lower than that of EPA. The proportion of ALA was lower than that in the diet, indicating a possible desaturation and elongation process for the biosynthesis of DHA, as the intermediate step between EPA and DHA, 22:5ω3, doubled in the liver tissue compared with the diet. The lower proportion of ALA could also suggest no incorporation in liver PL.
After 12 weeks of feeding, the DHA:EPA ratio shifted from being less than 1 in the diet to being greater than 1 in the liver tissue, suggesting a higher requirement for DHA than EPA. The levels of ARA in the liver tissue and PL were significantly higher than those in the diet. This could be due to the high proportion of LA in the diet, which decreased after 12 weeks of feeding, indicating a possible desaturation and elongation process for the biosynthesis of ARA. The increase in ARA proportions might suggest the production of pro-inflammatory eicosanoids, but the ω3/ω6 ratio remained greater than 1 across all dietary treatments. EPA and ARA both serve as precursors for the production of eicosanoids, but eicosanoids formed from EPA are considered to be less biologically active than those formed from ARA [46,47]. The direct competition between EPA and ARA leads to inhibition of the formation of eicosanoids from the other [48]. Replacing FM with Pav459 resulted in an EPA:ARA ratio less than 1 only in salmon fed the AB diet, which had the highest canola oil content, favoring a more pro-inflammatory eicosanoid production. However, the ω3/ω6 ratio remained greater than 1 across all dietary treatments.

4.2. Muscle Tissue

In this study, there were no significant differences in the total lipid composition of the muscle tissue across the dietary treatments (Table 6). The muscle tissue was predominantly composed of neutral lipids, with TAG being the main lipid class, followed by PL and ST. The proportion of neutral lipids in the muscle tissue was similar between salmon fed the FM and AB diets but significantly higher in salmon fed the FM/AB diet. This may be due to the equal contribution of FM and AB in the diet. The proportion of PL in the muscle tissue was lower in salmon fed the FM/AB diet, but it was the second most dominant lipid class for salmon fed the FM and AB diets.
The fatty acid composition of the muscle tissue reflected the diet (Table 7). The dominant fatty acids in both total fatty acids and PLFA were 16:0, 18:1ω9, LA, and DHA, with each accounting for more than 5% among all dietary treatments. The presence of these fatty acids was the main driver for the dissimilarities observed in both total fatty acids and PLFA, as indicated by SIMPER.
Muscle tissue PL had no significant variation in the proportion of SFA, MUFA, and PUFA among the dietary treatments. The level of DHA in the muscle PL was higher than that in the diet, while EPA was lower. This suggests a preference for DHA over EPA in the muscle membrane and a possible storage of DHA [43]. EPA is a better substrate for β-oxidation by mitochondria than DHA due to the fact that insertion and removal of the Δ4 double bond in DHA require a special mechanism [43]. It is also worth noting that there was no noticeable variation in the proportion of ARA in the muscle PL, resulting in an EPA:ARA ratio greater than 1 across all dietary treatments. However, only salmon fed the FM and FM/AB diets maintained a ω3/ω6 ratio greater than 1 in the muscle tissue, suggesting the potential production of anti-inflammatory eicosanoids. Further investigation is needed to draw more definitive conclusions.
Modern diets for farmed salmonids, which are rich in terrestrial plant-based proteins and oils, have posed a challenge by significantly reducing the dietary supply of cholesterol. Traditional fish oils used in salmonid feeds contain approximately 0.5–0.8% cholesterol, while plant oils such as soy, corn, and canola are completely devoid of cholesterol. This dietary shift has led nutritionists to reconsider the conditionally essential nature of dietary cholesterol in fish nutrition [16].
In our analysis of the sterol composition of Pavlova and muscle tissue in salmon fed the AB diet, several significant sterols were identified (Table 2 and Table 8). The sterols identified in Pavlova were cholesterol, cholestanol, brassicasterol, campesterol, stigmasterol, stigmasta-22-en-3-β-ol, 23,24-dimethylcholest-5-en-3β-ol, 4α-methylporiferast-22-enol, 4-desmethyl-22-dehydropavlovol, 24-methylpavlovol, and 24-ethylpavlovol.
While some of these sterols are typically associated with terrestrial plant oils, their presence in microalgae, such as Pav459, underscores the adaptability of microorganisms in synthesizing diverse sterols. Particularly noteworthy is the identification of cholesterol, conventionally considered exclusive to animal sources but surprisingly common in microalgae [49,50]. This reveals intricate sterol dynamics within microalgae and their potential significance in providing essential sterols for aquatic organisms. Out of six sterols identified in the muscle tissue, cholestanol, campesterol, and 23,24-dimethylcholest-5-en-3β-ol are also found in Pavlova lutheri [50,51,52]. However, other sterols were notably absent, suggesting either non-transfer or metabolism upon ingestion. On the other hand, lathosterol was not observed in Pavlova, suggesting an alternative source in fish muscle.
Prior research has demonstrated that, in addition to being rich in DHA and EPA, the lipid fraction of Pav459 microalgae contains approximately 13% sterols, with around 3% of it being cholesterol [49]. This characteristic is somewhat unusual in most plants and phytoplankton, but it is not an isolated finding. Related microalgal species, such as P. lutheri, have been reported to accumulate up to 3% of their dry biomass as sterols [52]. Furthermore, research by Volkman et al. (1992) [53] and Vernon et al. (1998) [54] has indicated that cholesterol can comprise up to 75% of the total sterols in certain marine microalgae, a finding recently confirmed by Martin-Creuzburg and Merkel (2016) [55] in a species of Nannochloropsis.
From a human health perspective, the muscle tissue of Atlantic salmon, particularly the ω3 LC-PUFA content (such as EPA and DHA), is highly beneficial to human health for the prevention of cardiovascular diseases and many other health benefits [56,57,58]. By replacing FM with Pav459, the EPA+DHA proportion in the fillet was 6.00 mg/g in salmon fed the FM diet, 5.37 mg/g in salmon fed the FM/AB diet, and 4.63 mg/g in salmon fed the AB diet. Typical recommendations are 300 to 500 mg/day of EPA and DHA provided by two servings of fatty fish/week (one serving is 112 g cooked) [56]. Our data shows DHA + EPA/112 g (uncooked) would provide per serving 672 mg from salmon fed the FM diet, 601.4 mg from salmon fed the FM/AB diet, and 518.6 mg from salmon fed the AB diet, which falls within the daily recommendation. However, changes in PL proportion were observed in the muscle tissue from one dietary treatment to another, which may provide added benefits to human health since there is evidence that PLs ω3 PUFAs (such as EPA and DHA) are more efficiently incorporated into tissue membranes and at much lower doses than TAGs ω3 PUFAs [59,60,61].
It is important to note that the nutritional composition of the fillet can be influenced by cooking methods. Frying, for example, can significantly alter the lipid content and fatty acid composition of the fish. Baking and grilling are considered cooking methods that result in fewer changes in the fat content and fatty acid composition of the fillet [62].

5. Compound-Specific Stable Isotope Analysis Reveals Pav459 Contribution to EPA and DHA in Atlantic Salmon Muscle and Liver tissues

The study investigated the RC of different sources of LC-PUFA in salmon fed focal diets (FM and AB). While the δ13C values for ARA could not be detected, EPA and DHA were the only detectable LC-PUFA. The sources of EPA and DHA in the diets included (1) the precursor ALA in the diet, FO (herring oil) present in the diet, and Pav459 oil in the diet. A two-end-member mixing model was used to determine the relative contributions of Pav459 to liver and muscle EPA and DHA. Notably, the AB diet exhibited highly negative δ13C values for EPA and DHA compared with other measurements, indicating minimal diet-tissue discrimination. Terrestrial plants have a lighter δ13C value than those of marine origin [63]. The lighter δ13C values of terrestrial plants compared with marine sources suggested that ALA is unlikely to be a significant contributor. The Pav459 used in the study was cultivated with CO2-enriched air, which may explain its highly negative bulk stable isotope value [16]. Atmospheric carbon dioxide contains approximately 1.1% of the non-radioactive isotope carbon-13 and 98.9% of carbon-12 [64]. A more negative δ13C means more 12C or lighter in mass; a more positive δ13C means more 13C or heavier [64]. The highly negative bulk stable isotope value for Pavlova could be related to the CO2 enrichment used in the culture.
As mentioned above, in the second paragraph of the discussion, the total oil contribution of Pav459 from the 20% algal biomass in the AB diet was 2.4%, and the total oil contribution of FO (herring oil) in the AB diet was 1.75%. The levels of EPA and DHA in herring oil range from 3.9–15.2% and from 2.0–7.8%, respectively [29]. Therefore, the range of levels of EPA and DHA derived from FO in the AB diet will be equal to 0.068–0.266% and 0.035–0.137%, respectively. As for Pav459, there was 26.8% EPA and 13.6% DHA in the AB diet, which results in the levels of EPA and DHA derived from Pav459 in the diet being equal to 0.129% and 0.065%, respectively. To simplify calculations, a mean of the range of levels of EPA and DHA derived from FO in the AB diet was used to calculate the total proportion of EPA and DHA supplied in the diet. Therefore, the average total proportion of EPA and DHA supplied in the diet from Pav459 was 43.6% and 43.0%, respectively.
In the liver TFA (Table 9), Pav459 showed an RC of 42.7% for EPA and 56.9% for DHA. Since the average total proportion of EPA supplied in the diet from Pav459 was 43.6%, this implies an almost complete (42.7/43.6 = 97.9%) incorporation of Pav459-derived EPA into liver lipids. As for DHA, the average total proportion supplied in the diet by Pav459 was 43.0%, which is lower than the RC of Pav459 for DHA in the liver TFA. This implies a 132.3% incorporation of Pav459-derived DHA into liver lipids. It is worth noting that the 43.0% contribution represents an average total proportion. Therefore, the implication is that nearly all the DHA derived from Pav459 was incorporated into liver lipids. The same observation holds true for liver PL (Table 10). For liver PL, the RC of Pav459 to EPA and DHA was 41.3% and 54.0%, respectively, with nearly all Pav459-derived DHA incorporated. It is noteworthy that the incorporation of DHA consistently exceeded that of EPA and generally surpassed the calculated mean supply of 43.0%, underscoring its greater essentiality.
Although similarities to liver tissue were present, muscle TFA exhibited a lower proportion of EPA and DHA incorporation from Pav459. The RC of Pav459 to muscle EPA and DHA was 36.6% and 43.1%, respectively, suggesting incorporation of 83.9% and 100.2% of Pav459-derived EPA and DHA into muscle lipids, respectively. For muscle PL (Table 12), the RC of Pav459 for EPA and DHA was 38.1% and 42.0%, respectively, indicating significant contributions of 87.4% and 97.7% from Pav459, respectively.
Overall, the study revealed that Pav459, the marine microalgae used in the diets, made a significant contribution to EPA and DHA content in both the liver and muscle tissues of the salmon. Incorporation of Pav459-derived EPA and DHA is estimated to range from 94–132% in the liver and liver phospholipids, while muscle tissue also exhibited high, but moderately lower, proportions (83–87%) of Pav459-derived EPA but near complete (98–100%) incorporation of Pav459-derived DHA. Calculated values of above 100% contribution of Pav459-derived DHA as was found in the liver suggest a preferential incorporation of DHA from Pav459 over that supplied by the fish oil.

6. Conclusions

This study demonstrated the successful total replacement of FM with Pav459 in diets for farmed Atlantic salmon, combined with the reduction of FO to just 1.75%. Overall, the growth performance of the salmon was not significantly affected by the substitutions.
Analyzing the lipid composition of salmon membranes provided an enhanced understanding of the dietary impact. The fatty acid profiles in liver and muscle tissues mirrored the dietary treatments, emphasizing the influence of Pav459 on the incorporation of essential fatty acids, particularly DHA. Sterol analysis revealed the presence of important sterols, like cholesterol, challenging conventional notions and highlighting the applicability of microorganisms like Pav459. Stable isotope analysis demonstrated direct incorporation of EPA and DHA from the diets into salmon tissues, with Pav459 contributing substantially. This finding, coupled with minimal biosynthesis from the precursor ALA even when it accounted for >1/3 of dietary ω3 FAs, indicates distinct nutritional advantages offered by Pav459 algal biomass. The recommended daily intake of DHA+EPA (500 mg/g) was fulfilled across all dietary treatments, reinforcing the potential of Pav459 as a sustainable and nutritionally rich alternative to traditional fishmeal sources. This study contributes to the growing body of research on sustainable aquafeeds, highlighting algal biomass as a feed ingredient.

Author Contributions

Conceptualization, N.G., C.C.P., S.M.T. and S.M.C.; methodology, N.G. and C.C.P.; formal analysis, N.G.; investigation, N.G. and M.W.; sterol analysis J.A.D.Á.-R.; data curation N.G.; writing—original draft preparation, N.G.; writing—review and editing, N.G., C.C.P., M.W., J.P., S.M.T., M.E. and S.M.C.; visualization, N.G. All authors have read and agreed to the published version of the manuscript.

Funding

Research funding was provided by the Ocean Frontier Institute through an award from the Canada First Research Excellence Fund.

Institutional Review Board Statement

The animal study protocol was approved by the Institutional Review Board (or Ethics Committee) of Dalhousie University Faculty of Agriculture Institutional Animal Care (protocol code #2017-84).

Informed Consent Statement

Not applicable.

Data Availability Statement

Data are available upon request.

Acknowledgments

The authors would like to thank Matthew Rise for an informal review of our manuscript. We also thank Jeanette Wells for her support in running some fatty acid analyses.

Conflicts of Interest

The authors declare no conflict of interest.

Appendix A

Table A1. Formulation of diets used in the study (g/kg, as-fed basis) fed to Atlantic salmon.
Ingredient (g/kg) 1FMFM/ABAB
Pav459 algal biomass 20100200
Fish meal2001000
Fish (herring) oil704517.5
Ground wheat149117.787.8
Soy protein concentrate84107127.5
Corn protein concentrate140140140
Poultry fat5567.578.75
Canola oil5567.578.75
Poultry by-product meal150150150
Blood meal404040
Vitamin/mineral mix 3222
Special pre-mix 4202020
Dicalcium phosphate222530
L-lysine0.538.5
L-methionine12.83.9
Choline chloride10.510.510.5
L-tryptophan123
Threonine001.8
TOTAL100010001000
1 All ingredients were donated by Northeast Nutrition (Truro, NS, Canada), except soy protein concentrate (President’s Choice), which was purchased from Atlantic Superstore (Truro, NS, Canada). 2 Produced at National Research Council of Canada’s Marine Research Station (Ketch Harbour, NS, Canada). 3 Vitamin/ mineral mix contains (/kg): zinc, 77.5 mg; manganese, 125 mg; iron, 84 mg; copper, 2.5 mg; iodine, 7.5 mg; vitamin A, 5000 IU; vitamin D, 4000 IU; vitamin K, 2 mg; vitamin B12, 4 μg; thiamine, 8 mg; riboflavin, 18 mg; pantothenic acid, 40 mg; niacin, 100 mg; folic acid, 4 mg; biotin, 0.6 mg; pyridoxine, 15 mg; inositol, 100 mg; ethoxyquin, 42 mg; wheat shorts, 1372 mg. 4 Special premix contains (/kg): selenium, 0.220 mg; vitamin E, 250 IU; vitamin C, 200 mg; astaxanthin, 60 mg; wheat shorts, 1988 mg.
Table A2. Biochemical composition of the AB Pav459 used in the study.
Proximate Composition (%)
Dry matter95.23
Ash9.80
Crude protein, N 6.25 × (%)60.87
Esterifiable lipid10.68
Crude lipid12.25
Minerals (%)
Calcium0.36
Magnesium0.41
Phosphorous1.20
Potassium1.40
Sodium1.23
Carotenoids (mg/100 g)
Astaxanthin9.09
Canthaxanthin40.61
Chlorophyll a2259.69
Chlorophyll b62.10
α-carotene5.39
β-carotene65.87
Fucoxanthin630.07
Lutein266.50
Neoxanthin6.87
Zeaxanthi 106.25
Table A3. Nutritional composition of diets 1.
FMFM/ABAB
Proximate Composition (%)
Dry matter94.4 ± 0.3 a93.7 ± 0.0 b91.5 ± 0.1 c
Crude protein48.0 ± 0.348.5 ± 0.449.0 ± 0.3
Crude fat22.9 ± 0.422.9 ± 0.223.0 ± 0.1
Ash8.2 ± 0.1 a7.6 ± 0.2 b6.7 ± 0.1 c
Minerals 1
Calcium (%)2.1 ± 0.06 a1.7 ± 0.0 b1.3 ± 0.0 c
Potassium (%)0.5 ± 0.00.6 ± 0.00.6 ± 0.0
Magnesium (%)0.3 ± 0.0 b0.1 ± 0.0 a0.1 ± 0.0 a
Phosphorus (%)1.6 ± 0.0 a1.5 ± 0.2 b1.3 ± 0.0 c
Sodium (%)0.4 ± 0.0 b0.4 ± 0.2 ab0.5 ± 0.0 a
Copper (ppm)11.7 ± 3.12.5 ± 0.518.0 ± 0.8
Iron (ppm)489.5 ± 6.0 c880.5 ± 10.2 b1318.6 ± 0.2 a
Manganese (ppm)27.2 ± 2.0 c33.9 ± 0.5 b43.0 ± 0.0 a
Zinc (ppm)179.4 ± 8.4 a150.1 ± 1.3 b120.8 ± 3.4 c
1 Data expressed as % diet (wet weight), values are means (n = 3 per treatment) ± standard deviation. Means with different superscripts indicate significant differences among treatment diets based on Tukey’s posthoc test following a one-way ANOVA. Means with different superscripts indicate significant differences based on Tukey’s posthoc test following a GLM; FM = fish meal (control); FM/AB = fish meal/Algal biomass Pav459; AB = Algal biomass Pav459.

Appendix B

Table A4. Liver total fatty acids SIMPER results 1.
FMFM/ABAB
Average Similarity: 82.6Average Similarity: 89.1Average Similarity: 90.4
FAsContributionFAsContributionFAsContribution
DHA23.8518:1ω928.9518:1ω928.62
18:1ω921.94DHA20.58DHA20.09
16:014.3316:011.7516:011.93
LA8.52LA10.08LA 10.03
EPA6.15----
FM & FM/ABFM &ABFM/AB &AB
Average dissimilarity = 15.4Average dissimilarity = 16.8Average dissimilarity = 10.7
FAsContributionFAsContributionFAsContribution
18:1ω931.3018:1ω927.3318:1ω926.28
DHA 26.68DHA24.57DHA21.92
16:08.4716:07.2016:08.48
LA6.91LA6.99LA 5.86
--EPA6.59ARA5.76
----EPA4.89
1 SIMPER data expressed as %.
Table A5. Liver phospholipid fatty acids SIMPER results 1.
FMFM/ABAB
Average Similarity: 96.1Average Similarity: 97.0Average Similarity: 96.6
FAsContributionFAsContributionFAsContribution
DHA37.96DHA 36.72DHA33.58
16:018.2316:017.3816:016.79
18:1ω912.0118:1ω912.8218:1ω913.41
EPA7.28EPA 5.71LA6.16
----18:05.64
FM & FM/ABFM & ABFM/AB & AB
Average dissimilarity = 5.5Average dissimilarity = 10.3Average dissimilarity = 6.4
FAsContributionFAsContributionFAsContribution
EPA13.64DHA20.19DHA 25.35
DHA 12.38EPA 12.59ω6DPA10.89
ω6DPA10.23ω6DPA12.18ARA10.34
16:08.94ARA 10.30EPA 9.31
LA 8.68LA7.4516:07.59
ARA 8.5818:1ω97.0620:3ω66.95
18:1ω97.5220:3ω66.75--
18:07.38----
1 SIMPER data expressed as %.
Table A6. Muscle total fatty acids SIMPER results 1.
FMFM/ABAB
Average Similarity: 90.7Average Similarity: 95.3Average Similarity: 92.8
FAsContributionFAsContributionFAsContribution
18:1ω931.1318:1ω935.0018:1ω938.49
16:017.2016:015.20LA17.12
LA14.05LA14.8316:011.40
DHA9.08DHA 9.04DHA7.31
FM & FM/ABFM & ABFM/AB & AB
Average dissimilarity = 8.8Average dissimilarity = 13.6Average dissimilarity = 7.9
FAsContributionFAsContributionFAsContribution
18:1ω928.1918:1ω925.8618:1ω921.66
DHA15.1416:013.83DHA17.41
LA9.78DHA11.8416:016.11
16:08.35LA11.53LA10.94
14:07.1816:1ω76.3918:05.88
16:1ω76.5314:04.91--
1 SIMPER data expressed as %.
Table A7. Muscle phospholipid fatty acids SIMPER results 1.
FMFM/ABAB
Average Similarity: 96.5Average Similarity: 87.0Average Similarity: 94.8
FAsContributionFAsContributionFAsContribution
DHA40.08DHA34.69DHA34.82
16:020.5016:023.5416:021.25
18:1ω910.0018:1ω911.7918:1ω912.09
----EPA6.89
FM & FM/ABFM & ABFM/AB & AB
Average similarity: 96.0Average dissimilarity = 9.9Average dissimilarity = 9.1
FAsContributionFAsContributionFAsContribution
DHA31.05DHA28.61DHA35.42
16:020.3318:1ω911.4416:018.61
EPA12.11ω6DPA11.2818:1ω910.32
18:1ω99.17EPA11.15ω6DPA6.03
--LA8.31--
1 SIMPER data expressed as %.

Appendix C

The entire EA was flushed continuously with helium gas (He) at a rate of 90 to 110 mL min−1. Each tin capsule with its content was individually dropped onto the oxidation reactor at a temperature of 1050 °C, with a simultaneous injection of oxygen and quick flushing with He. This sequence triggered flash combustion at 1800 °C between the tin capsule and oxygen, creating combustion gases that were pushed through an oxidation catalyst (chromium trioxide, CrO3) to ensure complete oxidation of the sample and silvered cobaltous/cobaltic oxide, which removes halides and SO2. The resulting gas mixture passed through the reduction reactor (reduced copper) at 650 °C, which reduced nitrogen oxides to nitrogen gas and absorbed oxygen. The gases then passed through a magnesium perchlorate (Mg(ClO4)2) water trap, after which the remaining gases (N2, CO2) entered a 3 m stainless steel GC column (QS 50/80; Poropak) at 40 to 100 °C. The individual gases were separated as they moved through the GC column. Upon reaching the TCD, they were detected as separate gas peaks: first N2, then CO2. From the TCD, He carried the gases to a ConFloIII interface (Finnigan, Thermo Electron Corporation), which has split tubes open to the atmosphere, which allows a portion of the He and combustion gases to enter directly into the ion source of the mass spectrometer (MS) (DeltaVPlus; Thermo Scientific) via fused glass capillaries. During operation, He from the EA flowed continuously into the MS. All gases exiting the EA also entered the ion source, but the instrument only recorded signals for the gases of interest, as defined through the software by instrument configuration. Internal and external reference material was used to calibrate MS data. EDTA #2 and D-Fructose were used for carbon isotope calibration and IAEA-N-1 ((NH4)2SO4) and IAEA-N-2 ((NH4)2SO4) for nitrogen isotope calibration. NBS-18 (CaCO3), B2150 (high organic sediment), B2151 (high organic sediment), and B2105 (Cystine) were used to aide data interpretation of carbon isotope analyses, and sorghum flour, B2153 (low organic soil), USGS-25 ((NH4)2SO4), USGS-26 ((NH4)2SO4), sulfanilamide, and BBOT were used to aide data interpretation of nitrogen isotope analyses. L-glutamic acid and B2155 (protein) were used for both carbon and nitrogen elemental calibration.
Table A8. Pav459 bulk stable isotope analysis.
Sample IDAmount (mg)Mean δ13CVPDB/‰ of All Analyses 1St. Dev. of δ13CVPDB/‰ of All Analyses 2
L-glutamic acid1.124−26.670.07
L-glutamic acid1.201−26.670.07
L-glutamic acid1.186−26.670.07
L-glutamic acid1.143−26.670.07
Blank capsule0.000
Blank capsule0.000
Blank capsule0.000
EDTA #21.285−40.380.08
EDTA #21.159−40.380.08
D-Fructose1.197−10.530.08
D-Fructose1.121−10.530.08
L-glutamic acid1.697−26.670.07
L-glutamic acid1.566−26.670.07
L-glutamic acid0.958−26.670.07
L-glutamic acid0.658−26.670.07
L-glutamic acid0.415−26.670.07
Pav 459-11.258−56.17
EDTA #21.280−40.380.08
D-Fructose1.175−10.530.08
Pav 459-21.215−55.60
Pav 459-31.273−55.30
L-glutamic acid1.152−26.670.07
EDTA #21.246−40.380.08
D-Fructose1.188−10.530.08
L-glutamic acid1.159−26.670.07
δ13CVPDB/‰ of Peak is the isotope ratio determined from the valid peak for the individual sample analysis. 1 Is the average isotope ratio of all valid analyses of a sample within a run. If this cell is empty, the individual result is considered to be invalid. 2 If a sample has more than one valid analysis in a run, this number will be the standard deviation of all of the valid analyses.

References

  1. Fry, J.P.; Love, D.C.; MacDonald, G.K.; West, P.C.; Engstrom, P.M.; Nachman, K.E.; Lawrence, R.S. Environmental health impacts of feeding crops to farmed fish. Environ. Int. 2016, 91, 201–214. [Google Scholar] [CrossRef] [PubMed]
  2. FAO. The State of World Fisheries and Aquaculture 2022. Towards Blue Transformation; FAO: Rome, Italy, 2022. [Google Scholar] [CrossRef]
  3. Bandara, T. Alternative feed ingredients in aquaculture: Opportunities and challenges. J. Entomol. Zool. Stud. 2018, 6, 3087–3094. [Google Scholar]
  4. Stenberg, O.K.; Holen, E.; Piemontese, L.; Liland, N.S.; Lock, E.J.; Espe, M.; Belghit, I. Effect of dietary replacement of fish meal with insect meal on in vitro bacterial and viral induced gene response in Atlantic salmon (Salmo salar) head kidney leukocytes. Fish Shellfish Immunol. 2019, 91, 223–232. [Google Scholar] [CrossRef] [PubMed]
  5. Burr, G.S.; Wolters, W.R.; Barrows, F.T.; Hardy, R.W. Replacing fishmeal with blends of alternative proteins on growth performance of rainbow trout (Oncorhynchus mykiss), and early or late stage juvenile Atlantic salmon (Salmo salar). Aquaculture 2012, 334, 110–116. [Google Scholar] [CrossRef]
  6. Turchini, G.M.; Francis, D.S.; Senadheera, S.P.S.D.; Thanuthong, T.; De Silva, S.S. Fish oil replacement with different vegetable oils in Murray cod: Evidence of an “omega-3 sparing effect” by other dietary fatty acids. Aquaculture 2011, 315, 250–259. [Google Scholar] [CrossRef]
  7. Henry, M.; Gasco, L.; Piccolo, G.; Fountoulaki, E. Review on the use of insects in the diet of farmed fish: Past and future. Anim. Feed Sci. Technol. 2015, 203, 1–22. [Google Scholar] [CrossRef]
  8. Belghit, I.; Liland, N.S.; Gjesdal, P.; Biancarosa, I.; Menchetti, E.; Li, Y.; Waagbø, R.; Krogdahl, Å.; Lock, E.J. Black soldier fly larvae meal can replace fish meal in diets of sea-water phase Atlantic salmon (Salmo salar). Aquaculture 2019, 503, 609–619. [Google Scholar] [CrossRef]
  9. Fowler, L.G. Poultry by-product meal as a dietary protein source in fall chinook salmon diets. Aquaculture 1991, 99, 309–321. [Google Scholar] [CrossRef]
  10. Galkanda-Arachchige, H.S.; Wilson, A.E.; Davis, D.A. Success of fishmeal replacement through poultry by-product meal in aquaculture feed formulations: A meta-analysis. Rev. Aquac. 2020, 12, 1624–1636. [Google Scholar] [CrossRef]
  11. Kiron, V.; Sørensen, M.; Huntley, M.; Vasanth, G.K.; Gong, Y.; Dahle, D.; Palihawadana, A.M. Defatted biomass of the microalga, Desmodesmus sp., can replace fishmeal in the feeds for Atlantic salmon. Front. Mar. Sci. 2016, 3, 67. [Google Scholar] [CrossRef]
  12. Zatti, K.M.; Ceballos, M.J.; Vega, V.V.; Denstadli, V. Full replacement of fish oil with algae oil in farmed Atlantic salmon (Salmo salar)–Debottlenecking omega 3. Aquaculture 2023, 574, 739653. [Google Scholar] [CrossRef]
  13. Jones, S.W.; Karpol, A.; Friedman, S.; Maru, B.T.; Tracy, B.P. Recent advances in single cell protein use as a feed ingredient in aquaculture. Curr. Opin. Biotechnol. 2020, 61, 189–197. [Google Scholar] [CrossRef] [PubMed]
  14. Khanjani, M.H.; Mozanzadeh, M.T.; Sharifinia, M.; Emerenciano, M.G.C. Biofloc: A sustainable dietary supplement, nutritional value and functional properties. Aquaculture 2023, 562, 738757. [Google Scholar] [CrossRef]
  15. Sprague, M.; Dick, J.R.; Tocher, D.R. Impact of sustainable feeds on omega-3 long chain fatty acid levels in farmed Atlantic salmon, 2006–2015. Sci. Rep. 2016, 6, 21892. [Google Scholar] [CrossRef] [PubMed]
  16. Tibbetts, S.M.; Patelakis, S.J.; Whitney-Lalonde, C.G.; Garrison, L.L.; Wall, C.L.; MacQuarrie, S.P. Nutrient composition and protein quality of microalgae meals produced from the marine prymnesiophyte Pavlova sp. 459 mass-cultivated in enclosed photobioreactors for potential use in salmonid aquafeeds. J. Appl. Phycol. 2020, 32, 299–318. [Google Scholar] [CrossRef]
  17. Sprague, M.; Betancor, M.B.; Tocher, D.R. Microbial and genetically engineered oils as replacements for fish oil in aquaculture feeds. Biotechnol. Lett. 2017, 39, 1599–1609. [Google Scholar] [CrossRef] [PubMed]
  18. Schoch, C.L.; Ciufo, S.; Domrachev, M.; Hotton, C.L.; Kannan, S.; Khovanskaya, R.; Leipe, D.; Mcveigh, R.; O’Neill, K.; Robbertse, B.; et al. NCBI Taxonomy: A comprehensive update on curation, resources and tools. Database 2020, 2020, baaa062. [Google Scholar] [CrossRef]
  19. Tibbetts, S.M.; Patelakis, S.J.J. Apparent digestibility coefficients (ADCs) of intact-cell marine microalgae meal (Pavlova sp. 459) for juvenile Atlantic salmon (Salmo salar L.). Aquaculture 2022, 546, 737236. [Google Scholar] [CrossRef]
  20. Volkman, J.K. Sterols in microorganisms. Appl. Microbiol. Biotechnol. 2003, 60, 495–506. [Google Scholar] [CrossRef]
  21. National Research Council. Nutrient Requirements of Fish and Shrimp; National Academies Press: Washington, DC, USA, 2011. [Google Scholar]
  22. Wei, M.; Parrish, C.C.; Guerra, N.I.; Tibbetts, S.M.; Colombo, S.M. Dietary inclusion of a marine microalgae meal for Atlantic salmon (Salmo salar): Impact of Pavlova sp. 459 on growth performance and tissue lipid composition. Aquaculture 2022, 553, 738084. [Google Scholar] [CrossRef]
  23. Parrish, C.C. Determination of total lipid, lipid classes, and fatty acids in aquatic samples. In Lipids in Freshwater Ecosystems; Springer: New York, NY, USA, 1999; pp. 4–20. [Google Scholar]
  24. Hailat, I.; Helleur, R.J. Direct analysis of sterols by derivatization matrix-assisted laser desorption/ionization time-of-flight mass spectrometry and tandem mass spectrometry. Rapid Commun. Mass Spectrom. 2014, 28, 149–158. [Google Scholar] [CrossRef] [PubMed]
  25. Chen, F.; Leng, Y.; Lu, Q.; Zhou, W. The application of microalgae biomass and bio-products as aquafeed for aquaculture. Algal Res. 2021, 60, 102541. [Google Scholar] [CrossRef]
  26. Turchini, G.; Mailer, R.J. Rapeseed (canola) oil and other monounsaturated fatty acid-rich vegetable oils. In Fish Oil Replacement and Alternative Lipid Sources in Aquaculture Feeds; CRC Press: Boca Raton, FL, USA, 2011; pp. 161–208. [Google Scholar]
  27. Bureau, D.P.; Meeker, D.L. Terrestrial animal fats. In Fish Oil Replacement and Alternative Lipid Sources in Aquaculture Feeds; CRC Press: Boca Raton, FL, USA, 2010; pp. 245–266. [Google Scholar]
  28. Campos, I.; Matos, E.; Maia, M.R.; Marques, A.; Valente, L.M. Partial and total replacement of fish oil by poultry fat in diets for European seabass (Dicentrarchus labrax) juveniles: Effects on nutrient utilization, growth performance, tissue composition and lipid metabolism. Aquaculture 2019, 502, 107–120. [Google Scholar] [CrossRef]
  29. De Silva, S.; Francis, D.S.; Tacon, A.G. Fish oil in aquaculture: In retrospect. In Fish Oil Replacement and Alternative Lipid Sources in Aquaculture Feeds; CRC Press: Boca Raton, FL, USA, 2011; pp. 1–20. [Google Scholar]
  30. Peterson, B.C.; Burr, G.S.; Barrows, F.T.; Block, S.; Bowzer, J.; Buentello, A. Growth performance of Atlantic salmon smolts fed diets containing heterotrophic algal biomass as replacement of fish oil. N. Am. J. Aquac. 2019, 81, 364–371. [Google Scholar] [CrossRef]
  31. Sørensen, M.; Berge, G.M.; Reitan, K.I.; Ruyter, B. Microalga Phaeodactylum tricornutum in feed for Atlantic salmon (Salmo salar)—Effect on nutrient digestibility, growth and utilization of feed. Aquaculture 2016, 460, 116–123. [Google Scholar] [CrossRef]
  32. Perez-Velazquez, M.; Gatlin III, D.M.; González-Félix, M.L.; García-Ortega, A.; de Cruz, C.R.; Juárez-Gómez, M.L.; Chen, K. Effect of fishmeal and fish oil replacement by algal meals on biological performance and fatty acid profile of hybrid striped bass (Morone crhysops♀× M. saxatilis♂). Aquaculture 2019, 507, 83–90. [Google Scholar] [CrossRef]
  33. Haas, S.; Bauer, J.L.; Adakli, A.; Meyer, S.; Lippemeier, S.; Schwarz, K.; Schulz, C. Marine microalgae Pavlova viridis and Nannochloropsis sp. as n-3 PUFA source in diets for juvenile European sea bass (Dicentrarchus labrax L.). J. Appl. Phycol. 2016, 28, 1011–1021. [Google Scholar] [CrossRef]
  34. Pakravan, S.; Akbarzadeh, A.; Sajjadi, M.M.; Hajimoradloo, A.; Noori, F. Partial and total replacement of fish meal by marine microalga Spirulina platensis in the diet of Pacific white shrimp Litopenaeus vannamei: Growth, digestive enzyme activities, fatty acid composition and responses to ammonia and hypoxia stress. Aquac. Res. 2017, 48, 5576–5586. [Google Scholar] [CrossRef]
  35. Nayak, S.; Khozin-Goldberg, I.; Cohen, G.; Zilberg, D. Dietary supplementation with ω6 LC-PUFA-rich algae modulates zebrafish immune function and improves resistance to streptococcal infection. Front. Immunol. 2018, 9, 1960. [Google Scholar] [CrossRef]
  36. Nayak, S.; Al Ashhab, A.; Zilberg, D.; Khozin-Goldberg, I. Dietary supplementation with omega-6 LC-PUFA-rich microalgae regulates mucosal immune response and promotes microbial diversity in the zebrafish gut. Biology 2020, 9, 119. [Google Scholar] [CrossRef]
  37. Long, X.; Wu, X.; Zhao, L.; Liu, J.; Cheng, Y. Effects of dietary supplementation with Haematococcus pluvialis cell powder on coloration, ovarian development and antioxidation capacity of adult female Chinese mitten crab, Eriocheir sinensis. Aquaculture 2017, 473, 545–553. [Google Scholar] [CrossRef]
  38. Skalli, A.; Firmino, J.P.; Andree, K.B.; Salomón, R.; Estévez, A.; Puig, P.; Sabater-Martínez, M.; Hechavarria, T.; Gisbert, E. The inclusion of the microalga Scenedesmus sp. in diets for rainbow trout, Onchorhynchus mykiss, juveniles. Animals 2020, 10, 1656. [Google Scholar] [CrossRef] [PubMed]
  39. Betancor, M.B.; Howarth, F.J.; Glencross, B.D.; Tocher, D.R. Influence of dietary docosahexaenoic acid in combination with other long-chain polyunsaturated fatty acids on expression of biosynthesis genes and phospholipid fatty acid compositions in tissues of post-smolt Atlantic salmon (Salmo salar). Comp. Biochem. Physiol. Part B Biochem. Mol. Biol. 2014, 172, 74–89. [Google Scholar] [CrossRef] [PubMed]
  40. Zhol, S.; Ackman, R.G.; Morrison, C. Storage of lipids in the myosepta of Atlantic salmon (Salmo salar). Fish Physiol. Biochem. 1995, 14, 171–178. [Google Scholar] [CrossRef]
  41. Stillwell, W.; Wassall, S.R. Docosahexaenoic acid: Membrane properties of a unique fatty acid. Chem. Phys. Lipids 2003, 126, 1–27. [Google Scholar] [CrossRef]
  42. Lund, E.K.; Harvey, L.J.; Ladha, S.; Clark, D.C.; Johnson, I.T. Effects of dietary fish oil supplementation on the phospholipid composition and fluidity of cell membranes from human volunteers. Ann. Nutr. Metab. 1999, 43, 290–300. [Google Scholar] [CrossRef] [PubMed]
  43. Sargent, J.R.; Tocher, D.R.; Bell, J.G. The lipids. In Fish Nutrition; Academic Press: Cambridge, MA, USA, 2003; pp. 181–257. [Google Scholar]
  44. Stubhaug, I.; Lie, Ø.; Torstensen, B.E. Fatty acid productive value and β-oxidation capacity in Atlantic salmon (Salmo salar L.) fed on different lipid sources along the whole growth period. Aquac. Nutr. 2007, 13, 145–155. [Google Scholar] [CrossRef]
  45. Tocher, D.R. Metabolism and functions of lipids and fatty acids in teleost fish. Rev. Fish. Sci. 2003, 11, 107–184. [Google Scholar] [CrossRef]
  46. Calder, P.C. n−3 polyunsaturated fatty acids, inflammation, and inflammatory diseases. Am. J. Clin. Nutr. 2006, 83, 1505S–1519S. [Google Scholar] [CrossRef]
  47. Arts, M.T.; Kohler, C.C. Health and condition in fish: The influence of lipids on membrane competency and immune response. In Lipids in Aquatic Ecosystems; Springer: New York, NY, USA, 2009; pp. 237–256. [Google Scholar]
  48. Sargent, J.; McEvoy, L.; Estevez, A.; Bell, G.; Bell, M.; Henderson, J.; Tocher, D. Lipid nutrition of marine fish during early development: Current status and future directions. Aquaculture 1999, 179, 217–229. [Google Scholar] [CrossRef]
  49. Milke, L.M.; Bricelj, V.M.; Parrish, C.C. Biochemical characterization and nutritional value of three Pavlova spp. in unialgal and mixed diets with Chaetoceros muelleri for postlarval sea scallops, Placopecten magellanicus. Aquaculture 2008, 276, 130–142. [Google Scholar] [CrossRef]
  50. Parrish, C.C.; Milke, L.M.; Bricelj, V.M. Characterisation of 4α-methyl sterols in Pavlova spp. and postlarval sea scallops, Placopecten magellanicus. Aquaculture 2011, 311, 261–262. [Google Scholar] [CrossRef]
  51. Volkman, J.K.; Kearney, P.; Jeffrey, S.W. A new source of 4-methyl sterols and 5α (H)-stanols in sediments: Prymnesiophyte microalgae of the genus Pavlova. Org. Geochem. 1990, 15, 489–497. [Google Scholar] [CrossRef]
  52. Ahmed, F.; Zhou, W.; Schenk, P.M. Pavlova lutheri is a high-level producer of phytosterols. Algal Res. 2015, 10, 210–217. [Google Scholar] [CrossRef]
  53. Volkman, J.K.; Barrett, S.M.; Blackburn, S.I. Eustigmatophyte microalgae are potential sources of C29 sterols, C22–C28 n-alcohols and C28–C32 n-alkyl diols in freshwater environments. Org. Geochem. 1999, 30, 307–318. [Google Scholar] [CrossRef]
  54. Véron, B.; Dauguet, J.C.; Billard, C. Sterolic biomarkers in marine phytoplankton. I. Free and conjugated sterols of Pavlova lutheri (Haptophyta). Eur. J. Phycol. 1996, 31, 211–215. [Google Scholar] [CrossRef]
  55. Martin-Creuzburg, D.; Merkel, P. Sterols of freshwater microalgae: Potential implications for zooplankton nutrition. J. Plankton Res. 2016, 38, 865–877. [Google Scholar] [CrossRef]
  56. Kris-Etherton, P.M.; Harris, W.S.; Appel, L.J. Fish consumption, fish oil, omega-3 fatty acids, and cardiovascular disease. Circulation 2002, 106, 2747–2757. [Google Scholar] [CrossRef] [PubMed]
  57. Ruxton, C.H.S.; Calder, P.C.; Reed, S.C.; Simpson, M.J.A. The impact of long-chain n-3 polyunsaturated fatty acids on human health. Nutr. Res. Rev. 2005, 18, 113–129. [Google Scholar] [CrossRef]
  58. Rimm, E.B.; Appel, L.J.; Chiuve, S.E.; Djoussé, L.; Engler, M.B.; Kris-Etherton, P.M.; Mozaffarian, D.; Siscovick, D.S.; Lichtenstein, A.H. Seafood long-chain n-3 polyunsaturated fatty acids and cardiovascular disease: A science advisory from the American Heart Association. Circulation 2018, 138, e35–e47. [Google Scholar] [CrossRef]
  59. Küllenberg, D.; Taylor, L.A.; Schneider, M.; Massing, U. Health effects of dietary phospholipids. Lipids Health Dis. 2012, 11, 3. [Google Scholar] [CrossRef] [PubMed]
  60. Murru, E.; Banni, S.; Carta, G. Nutritional properties of dietary omega-3-enriched phospholipids. BioMed Res. Int. 2013, 2013, 965417. [Google Scholar] [CrossRef] [PubMed]
  61. Lordan, R.; Tsoupras, A.; Zabetakis, I. Phospholipids of animal and marine origin: Structure, function, and anti-inflammatory properties. Molecules 2017, 22, 1964. [Google Scholar] [CrossRef] [PubMed]
  62. Moradi, Y.; Bakar, J.; Motalebi, A.A.; Syed Muhamad, S.H.; Che Man, Y. A review on fish lipid: Composition and changes during cooking methods. J. Aquat. Food Prod. Technol. 2011, 20, 379–390. [Google Scholar] [CrossRef]
  63. Phillips, D.L.; Newsome, S.D.; Gregg, J.W. Combining sources in stable isotope mixing models: Alternative methods. Oecologia 2005, 144, 520–527. [Google Scholar] [CrossRef]
  64. O’Leary, M.H. Carbon isotopes in photosynthesis. Bioscience 1988, 38, 328–336. [Google Scholar] [CrossRef]
Figure 1. PCO of Atlantic salmon liver tissue total fatty acid composition (%) after 12 weeks of feeding experimental diets.
Sustainability 15 16599 g001
Figure 2. PCO of Atlantic salmon liver tissue phospholipid fatty acid composition (%) after 12 weeks of feeding experimental diets.
Sustainability 15 16599 g002
Figure 3. PCO of Atlantic salmon muscle tissue total fatty acid composition (%) after 12 weeks of feeding experimental diets.
Sustainability 15 16599 g003
Figure 4. PCO of Atlantic salmon muscle tissue phospholipid fatty acid composition (%) after 12 weeks of feeding experimental diets.
Sustainability 15 16599 g004
Table 1. Lipid composition and fatty acid profile of Pav459, used in the study 1.
Lipid Class Composition (%)
Total lipid (mg/g)109.6 ± 10.4
TAG24.7 ± 0.4
FFA18.5 ± 1.1
ST10.9 ± 1.0
AMPL22.9 ± 1.7
PL16.6 ± 1.4
Fatty acid composition (%)
14:015.6 ± 0.1
15:00.2 ± 0.0
16:07.3 ± 0.2
Total SFA 223.0 ± 0.2
16:1ω76.4 ± 0.0
16:1ω53.7 ± 0.0
18:1ω90.2 ± 0.0
18:1ω70.1 ± 0.0
Total MUFA 311.2 ± 0.2
16:2ω42.2 ± 0.0
18:2ω6 (LA)3.5 ± 0.1
18:3ω60.4 ± 0.0
20:4ω6 (ARA)0.5 ± 0.5
22:5ω6 (ω6DPA)7.2 ± 0.1
18:3ω3 (ALA)3.6 ± 0.1
18:4ω36.3 ± 0.1
20:5ω3 (EPA)26.8 ± 0.1
22:5ω30.0 ± 0.0
22:6ω3 (DHA)13.6 ± 0.2
Total PUFA 464.5 ± 0.3
Total ω350.3 ± 0.3
Total ω611.7 ± 0.4
ω3/ω6 ratio4.3 ± 0.2
EPA+DHA40.4 ± 0.3
1 Data expressed as percent lipid or fatty acid methyl ester (FAME); values are means ± standard deviation (n = 3 per treatment). 2 Saturated fatty acid. 3 Monounsaturated fatty acid. 4 Polyunsaturated fatty acid.
Table 2. Sterol composition of Pavlova sp. 459 lipid extract.
SterolCommon NameFormulaMW + TMSSterol Content (µg mg−1) of Lipids
Cholest-5-en-3β-olCholesterol27:1Δ54588.7
5α-cholestan-3β-olCholestanol27:0, 5αΔ04600.5
24-methylcholesta-5,22E-dien-3β-olBrassicasterol28:2, Δ5,22Me244700.7
24-methylcholest-5-en-3β-olCampesterol28:1Δ5Me244723.8
24-ethylcholesta-5,22E-dien-3β-olStigmasterol29:2, Δ5,22Et2448441.7
24-ethyl-5α-cholest-22E-en-3β-ol *Stigmasta-22-en-3-β-ol29:1, 5αΔ22Et2448621.6
23,24-dimethylcholest-5-en-3β-ol 29:1Δ5 Me23,244866.4
4α-methyl-24-ethyl-5α-cholest-22E-en-3β-ol4α-Methylporiferast-22-enol30:1, 5αΔ22Me4Et2450012.3
24-ethyl-5α-cholest-22E-en-3β,4β-diol4-Desmethyl-22-dehydropavlovol29:0, 5αΔ22Et24OH5020.2
5α-cholestan-3β,4β-diol24-Methylpavlovol30:0, 5αΔ°Me4,24OH5040.5
4α-methyl-24-ethyl-5α-cholestan-3β,4β-diol24-Ethylpavlovol30:0, 5αΔ°Me4Et24OH5182.0
Total 9.83%
* or 23, 24-dimethyl-5α-cholesta-22E-en-3β-ol (29:1, 5αΔ22Me23,24).
Table 3. Lipid composition and fatty acid profile of diets 1.
FMFM/ABAB
Total lipid (mg/g)144.2 ± 23.6200.0 ± 38.2174.5 ± 34.8
TAG74.1 ± 1.875.1 ± 1.172.7 ± 2.2
FFA9.0 ± 1.19.1 ± 0.38.5 ± 0.9
ST3.5 ± 0.4 b7.5 ± 0.7 a4.7 ± 1.7 b
AMPL5.7 ± 0.8 b5.0 ± 0.7 b8.0 ± 1.0 a
Phospholipid6.3 ± 1.73.1 ± 0.56.1 ± 2.2
Fatty acid composition (%)
14:02.3 ± 0.41.9 ± 0.52.2 ± 0.1
16:014.9 ± 0.713.9 ± 0.814.0 ± 0.1
18:04.0 ± 0.24.3 ± 0.63.7 ± 0.0
Total SFA 222.3 ± 0.921.4 ± 0.620.8 ± 0.1
16:1ω74.7 ± 0.2 a3.9 ± 0.5 ab3.8 ± 0.0 b
16:1ω50.1 ± 0.0 c0.2 ± 0.0 b0.4 ± 0.0 a
18:1ω931.6 ± 0.3 c36.2 ± 1.2 b38.7 ± 0.3 a
18:1ω72.6 ± 0.0 a2.5 ± 0.0 b2.3 ± 0.0 c
20:1ω92.0 ± 0.1 a1.5 ± 0.3 b0.6 ± 0.1 c
Total MUFA 344.8 ± 0.647.1 ± 1.646.8 ± 0.2
16:2ω40.4 ± 0.0 a0.3 ± 0.0 b0.3 ± 0.0 b
18:2ω6 (LA)14.6 ± 0.2 c16.0 ± 0.7 b18.8 ± 0.0 a
18:3ω60.2 ± 0.0 a0.2 ± 0.0 a0.1 ± 0.0 b
20:3ω60.1 ± 0.00.1 ± 0.00.1 ± 0.0
20:4ω6 (ARA)0.4 ± 0.0 a0.4 ± 0.0 b0.3 ± 0.0 b
22:5ω6 (ω6DPA)0.1 ± 0.0 c0.4 ± 0.0 b0.6 ± 0.0 a
18:3ω3 (ALA)2.8 ± 0.1 b3.2 ± 0.3 b3.9 ± 0.0 a
18:4ω30.9 ± 0.0 b0.9 ± 0.1 b1.2 ± 0.0 a
20:4ω30.3 ± 0.0 a0.2 ± 0.0 b0.1 ± 0.0 c
20:5ω3 (EPA)5.3 ± 0.2 a4.4 ± 0.3 b3.8 ± 0.0 c
22:5ω30.7 ± 0.0 a0.4 ± 0.0 b0.2 ± 0.0 c
22:6ω3 (DHA)4.4 ± 0.2 a3.2 ± 0.2 b1.9 ± 0.1 c
Total PUFA 432.3 ± 0.831.0 ± 1.332.0 ± 0.2
Total ω314.8 ± 0.5 a12.4 ± 0.7 b11.1 ± 0.1 c
Total ω616.1 ± 0.2 c17.5 ± 0.7 b20.4 ± 0.1 a
ω3/ω6 ratio0.9 ± 0.0 a0.7 ± 0.0 b0.5 ± 0.0 c
EPA+DHA9.7 ± 0.4 a7.5 ± 0.4 b5.6 ± 0.1 c
DHA/EPA ratio0.8 ± 0.0 a0.7 ± 0.1 b0.5 ± 0.0 c
EPA/ARA ratio12.5 ± 0.412.3 ± 1.011.7 ± 0.9
DHA/ARA ratio10.4 ± 0.2 a8.8 ± 0.1 b5.7 ± 0.4 c
1 Data expressed as % lipid or fatty acid methyl ester (FAME). Values are means ± standard deviation (n = 3 per treatment). Means with different superscripts indicate significant differences (p < 0.05) based on Tukey’s posthoc test following a general linear model. FM = fish meal (control); FM/AB = fish meal/algal biomass Pav459; AB = algal biomass Pav459. 2 Saturated fatty acid. 3 Monounsaturated fatty acid. 4 Polyunsaturated fatty acid.
Table 4. Lipid class and total fatty acid composition of Atlantic salmon liver tissue, prior to feeding experimental diets (initial) and after 12 weeks of feeding experimental diets 1.
InitialFMFM/ABAB
Total lipid (mg/g)18.3 ± 4.528.3 ± 4.924.4 ± 4.526.3 ± 8.3
Neutral Lipid60.7 ± 4.665.1 ± 5.862.1 ± 6.562.1 ± 4.7
Polar Lipid39.3 ± 4.634.9 ± 5.837.9 ± 6.537.9 ± 4.7
Lipid class composition (%)
TAG1.5 ± 1.212.4 ± 16.310.1 ± 10.66.8 ± 7.0
FFA30.8 ± 2.530.2 ± 8.825.4 ± 6.328.7 ± 5.3
ST26.9 ± 3.920.4 ± 4.123.9 ± 3.521.9 ± 3.6
PL26.7 ± 3.223.4 ± 5.425.4 ± 5.324.1 ± 4.3
PL/ST ratio 21.0 ± 0.21.2 ± 0.11.1 ± 0.21.1 ± 0.1
Fatty acid composition (%)
14:01.5 ± 0.11.2 ± 0.2 a1.1 ± 0.1 ab1.0 ± 0.1 b
16:018.0 ± 1.312.6 ± 2.311.1 ± 1.811.2 ± 1.4
18:05.6 ± 0.54.2 ± 0.53.9 ± 0.44.4 ± 0.8
Total SFA 325.7 ± 0.918.4 ± 2.316.6 ± 2.217.1 ± 1.9
16:1ω72.4 ± 0.22.5 ± 0.5 a2.4 ± 0.3 ab2.0 ± 0.2 b
16:1ω50.1 ± 0.00.1 ± 0.0 c0.2 ± 0.0 b0.3 ± 0.1 a
18:1ω911.4 ± 1.623.0 ± 9.928.0 ± 5.627.5 ± 4.4
18:1ω72.5 ± 0.22.7 ± 0.32.6 ± 0.32.4 ± 0.4
Total MUFA 417.6 ± 2.332.9 ± 11.237.7 ± 7.036.0 ± 5.5
18:2ω6 (LA)4.3 ± 0.37.7 ± 1.7 b9.2 ± 1.0 ab9.5 ± 1.2 a
18:3ω60.2 ± 0.00.2 ± 0.0 c0.3 ± 0.0 b0.4 ± 0.1 a
20:3ω60.9 ± 0.21.2 ± 0.3 b1.4 ± 0.1 b2.2 ± 0.3 a
20:4ω6 (ARA)4.6 ± 0.62.5 ± 0.8 b2.7 ± 0.8 b3.7 ± 0.7 a
22:5ω6 (ω6DPA)0.9 ± 0.10.4 ± 0.1 c1.0 ± 0.2 b1.8 ± 0.3 a
18:3ω3 (ALA)0.5 ± 0.10.9 ± 0.31.1 ± 0.21.0 ± 0.2
18:4ω30.2 ± 0.10.2 ± 0.10.2 ± 0.00.2 ± 0.1
20:4ω30.5 ± 0.10.7 ± 0.2 a0.6 ± 0.1 ab0.5 ± 0.1 b
20:5ω3 (EPA)7.4 ± 1.25.5 ± 1.2 a4.0 ± 0.9 b3.5 ± 0.8 b
22:5ω32.7 ± 0.51.3 ± 0.2 a0.9 ± 0.1 b0.8 ± 0.2 b
22:6ω3 (DHA)32.5 ± 1.823.7 ± 8.220.3 ± 4.519.6 ± 3.6
Total PUFA 556.7 ± 1.748.3 ± 9.045.4 ± 5.146.7 ± 3.9
Total ω343.9 ± 1.832.6 ± 9.227.6 ± 5.226.0 ± 4.2
Total ω611.6 ± 0.914.1 ± 1.2 c16.5 ± 0.5 b19.7 ± 0.5 a
ω3/ω6 ratio3.8 ± 0.42.3 ± 0.7 a1.7 ± 0.3 b1.3 ± 0.2 b
EPA+DHA39.9 ± 1.729.2 ± 9.3 a24.3 ± 5.4 b23.1 ± 4.3 b
DHA/EPA ratio4.5 ± 0.94.2 ± 0.7 b5.1 ± 0.5 a5.7 ± 0.5 a
EPA/ARA ratio1.6 ± 0.22.3 ±0.5 a1.5 ± 0.3 b0.9 ± 0.2 c
DHA/ARA ratio7.2 ± 1.19.5 ± 1.2 a7.7 ± 1.0 b5.3 ± 0.5 c
1 Data expressed as % lipid or fatty acid methyl ester (FAME). Values are means ± standard deviation (n = 9 per treatment). Means with different superscripts indicate significant differences (p < 0.05) based on Tukey’s posthoc test following a general linear model. FM = fish meal (control); FM/AB = fish meal/algal biomass Pav459; AB = algal biomass Pav459. 2 Phospholipid/sterol ratio. 3 Saturated fatty acid. 4 Monounsaturated fatty acid. 5 Polyunsaturated fatty acid.
Table 5. Phospholipid fatty acid composition of Atlantic salmon liver tissue after 12 weeks of feeding experimental diets 1.
FMFM/ABAB
14:00.9 ± 0.10.9 ± 0.10.8 ± 0.1
16:017.4 ± 0.8 a16.8 ± 0.7 ab16.3 ± 0.8 b
18:05.2 ± 0.95.0 ± 0.35.7 ± 0.6
Total SFA 224.1 ± 1.323.2 ± 1.023.3 ± 1.1
16:1ω71.4 ± 0.2 a1.2 ± 0.1 b1.0 ± 0.1 c
16:1ω50.1 ± 0.0 c0.1 ± 0.0 b0.2 ± 0.0 a
18:1ω911.5 ± 0.4 c12.2 ± 0.3 b12.9 ± 0.5 a
18:1ω71.5 ± 0.4 a12.2 ± 0.3 ab12.9 ± 0.5 b
20:1ω91.6 ± 0.3 a1.4 ± 0.3 ab1.2 ± 0.2 b
Total MUFA 317.0 ± 0.617.2 ± 0.717.4 ± 0.5
18:2ω6 (LA)4.5 ± 0.2 c5.4 ± 0.3 b6.0 ± 0.3 a
18:3ω60.1 ± 0.0 c0.2 ± 0.0 b0.3 ± 0.0 a
20:2ω61.5 ± 0.31.6 ± 0.21.6 ± 0.3
20:3ω61.3 ± 0.2 c1.8 ± 0.2 b2.7 ± 0.3 a
20:4ω6 (ARA)3.4 ± 0.4 c4.2 ± 0.6 b5.5 ± 0.6 a
22:4ω60.2 ± 0.1 a0.1 ± 0.0 b0.2 ± 0.1 a
22:5ω6 (ω6DPA)0.6 ± 0.0 c1.7 ± 0.1 b3.1 ± 0.1 a
18:3ω3 (ALA)0.4 ± 0.0 b0.5 ± 0.0 a0.5 ± 0.0 a
18:4ω30.0 ± 0.0 b0.1 ± 0.0 b0.1 ± 0.0 a
20:3ω30.1 ± 0.00.1 ± 0.00.1 ± 0.0
20:4ω30.4 ± 0.10.5 ± 0.10.4 ± 0.1
20:5ω3 (EPA)7.2 ± 0.7 a5.7 ± 0.6 b4.6 ± 0.6 c
22:5ω31.6 ± 0.2 a1.2 ± 0.1 b1.1 ± 0.2 b
22:6ω3 (DHA)36.1 ± 1.1 a35.2 ± 1.0 a32.0 ± 0.7 b
Total PUFA 458.5 ± 1.259.3 ± 0.959.1 ± 1.0
P/S ratio 52.4 ± 0.22.6 ± 0.12.5 ± 0.2
Total ω345.9 ± 1.2 a43.3 ± 1.0 b39.0 ± 0.8 c
Total ω611.7 ± 0.3 c15.1 ± 0.5 b19.4 ± 0.5 a
ω3/ω6 ratio3.9 ± 0.2 a2.9 ± 0.1 b2.0 ± 0.1 c
EPA+DHA43.2 ± 1.0 a40.9 ± 1.0 b36.7 ± 0.8 c
DHA/EPA ratio5.1 ± 0.5 b6.2 ± 0.7 a7.0 ± 0.8 a
EPA/ARA ratio2.1 ± 0.4 a1.4 ± 0.3 b0.8 ± 0.1 c
DHA/ARA ratio10.7 ± 1.6 a8.5 ± 1.3 b5.9 ± 0.6 c
1 Data expressed as % lipid or fatty acid methyl ester (FAME). Values are means ± standard deviation (n = 9 per treatment). Means with different superscripts indicate significant differences (p < 0.05) based on Tukey’s posthoc test following a general linear model. FM = fish meal (control); FM/AB = fish meal/algal biomass Pav459; AB = algal biomass Pav459. 2 Saturated fatty acid. 3 Monounsaturated fatty acid. 4 Polyunsaturated fatty acid. 5 PUFA/SFA ratio.
Table 6. Lipid class and total fatty acid composition of Atlantic salmon muscle tissue, prior to feeding experimental diets (initial) and after 12 weeks of feeding experimental diets 1.
InitialFMFM/ABAB
Total lipid (mg/g)15.8 ± 6.770.4 ± 15.964.5 ± 12.763.4 ± 12.5
Neutral lipid78.9 ± 7.161.4 ± 9.0 b75.5 ± 7.7 a62.8 ± 10.2 b
Polar lipid5.6 ± 5.538.6 ± 9.0 a24.5 ± 7.7 b37.2 ± 10.2 a
TAG56.0 ± 11.643.9 ± 10.354.8 ± 4.949.2 ± 8.6
FFA5.4 ± 3.44.1 ± 1.0 b7.5 ± 2.2 a4.2 ± 0.7 b
ST16.2 ± 7.911.0 ± 2.2 a11.9 ± 3.8 a6.2 ± 4.3 b
PL15.6 ± 8.220.3 ± 5.1 a8.1 ± 5.2 b18.4 ± 7.4 a
PL/ST ratio 21.1 ± 0.62.0 ± 0.1 b0.8 ± 0.7 b4.5 ± 2.7 a
14:03.6 ± 2.22.3 ± 0.12.2 ± 0.22.1 ± 0.1
16:016.0 ± 2.514.7± 0.4 a14.0 ± 0.6 ab13.3 ± 0.5 b
18:03.7 ± 0.23.3 ± 0.13.5 ± 0.33.5 ± 0.6
Total SFA 324.2 ± 4.721.1 ± 0.4 a20.4 ± 0.5 ab19.5 ± 0.8 b
16:1ω76.1 ± 2.04.6 ± 0.3 a4.4 ± 0.3 ab3.5 ± 0.1 b
16:1ω50.1 ± 0.00.1 ± 0.0 c0.2 ± 0.0 b0.3 ± 0.1 a
18:1ω918.5 ± 2.130.1 ± 1.4 b33.2 ± 0.8 a35.0 ± 2.4 a
18:1ω73.4 ± 0.62.2 ± 0.32.0 ± 0.31.7 ± 0.4
Total MUFA 433.6 ± 2.842.1 ± 1.643.7 ± 0.643.4 ± 2.3
18:2ω6 (LA)8.1 ± 0.612.8 ± 0.6 a14.1 ± 0.4 b15.4 ± 0.7 c
18:3ω60.2 ± 0.00.4 ± 0.1 c0.6 ± 0.1 b0.7 ± 0.1 a
20:3ω60.3 ± 0.00.4 ± 0.0 c0.5 ± 0.1 b0.7 ± 0.1 a
20:4ω6 (ARA)1.0 ± 0.20.6 ± 0.1 b0.6 ± 0.0 ab0.6 ± 0.1 a
22:5ω6 (ω6DPA)0.5 ± 0.30.2 ± 0.1 c0.4 ± 0.0 b0.8 ± 0.1 a
18:3ω3 (ALA)1.5 ± 0.12.3 ± 0.1 b2.4 ± 0.2 b2.7 ± 0.1 a
18:4ω31.0 ± 0.20.9 ± 0.1 c1.1 ± 0.1 b1.2 ± 0.1 a
20:4ω30.8 ± 0.10.5 ± 0.00.5 ± 0.00.5 ± 0.1
20:5ω3 (EPA)4.8 ± 1.03.9 ± 0.4 a2.9 ± 0.1 ab2.7 ± 0.5 b
22:5ω32.0 ± 0.41.3 ± 0.1 a1.0 ± 0.1 b0.9 ± 0.2 b
22:6ω3 (DHA)17.4 ± 4.99.8 ± 1.68.3 ± 0.57.6 ± 2.1
Total PUFA 541.3 ± 6.036.3 ± 1.635.4 ± 0.336.4 ± 2.3
Total ω328.0 ± 6.219.2 ± 2.016.8 ± 0.515.9 ± 2.7
Total ω610.8 ± 0.715.2 ± 0.5 c16.8 ± 0.8 b19.2 ± 0.7 a
ω3/ω6 ratio2.6 ± 0.61.3 ± 0.2 a1.0 ± 0.1 a0.8 ± 0.2 b
EPA+DHA22.2 ± 5.913.7 ± 2.0 a11.2 ± 0.5 b10.3 ± 2.6 b
EPA+DHA (mg/g)2.38 ± 0.966.00 ± 2.045.37 ± 0.944.63 ± 1.08
DHA/EPA ratio3.6 ± 0.52.5 ± 0.3 b2.9 ± 0.1 a2.8 ± 0.3 a
EPA/ARA ratio4.8 ± 0.37.0 ± 0.7 a5.2 ± 0.3 b4.2 ± 0.4 c
DHA/ARA ratio17.1 ± 2.117.3 ± 1.1 a14.9 ± 0.7 a11.6 ± 1.6 b
DHA + EPA/112 g266.6672.0601.4518.6
1 Data expressed as % lipid or fatty acid methyl ester (FAME). Values are means ± standard deviation (n = 9 per treatment). Means with different superscripts indicate significant differences (p < 0.05) based on Tukey’s posthoc test following a general linear model. FM = fish meal (control); FM/AB = fish meal/algal biomass Pav459; AB = algal biomass Pav459. 2 Phospholipid/sterol ratio. 3 Saturated fatty acid. 4 Monounsaturated fatty acid. 5 Polyunsaturated fatty acid.
Table 7. Phospholipid fatty acid composition of Atlantic salmon muscle tissue after 16 weeks of feeding experimental diets 1.
FMFM/ABAB
14:00.9 ± 0.10.9 ± 0.10.8 ± 0.1
16:019.7 ± 0.620.4 ± 2.320.0 ± 1.2
18:03.3 ± 0.23.4 ± 0.73.3 ± 0.3
Total SFA 224.2 ± 1.325.1 ± 2.824.2 ± 0.9
16:1ω71.5 ± 0.2 ab1.4 ± 0.3 a1.3 ± 0.1 b
16:1ω50.1 ± 0.0 c0.1 ± 0.0 b0.2 ± 0.0 a
18:1ω99.6 ± 0.610.1 ± 0.711.2 ± 0.5
18:1ω71.8 ± 0.11.6 ± 0.11.5 ± 0.1
20:1ω90.4 ± 0.0 a0.3 ± 0.1 ab0.3 ± 0.0 b
Total MUFA 314.0 ± 0.914.2 ± 1.015.0 ± 0.7
18:2ω6 (LA)4.1 ± 0.3 c4.7 ± 0.3 b5.6 ± 0.4 a
18:3ω60.1 ± 0.0 c0.2 ± 0.0 b0.2 ± 0.0 a
20:2ω60.5 ± 0.1 b0.5 ± 0.1 ab0.6 ± 0.0 a
20:3ω60.5 ± 0.1 c0.8 ± 0.1 b1.1 ± 0.2 a
20:4ω6 (ARA)1.3 ± 0.1 b1.5 ± 0.2 b1.9 ± 0.1 a
22:4ω60.2 ± 0.0 ab0.2 ± 0.0 b0.2 ± 0.0 a
22:5ω6 (ω6DPA)0.7 ± 0.1 c1.6 ± 0.2 b2.7 ± 0.4 a
18:3ω3 (ALA)1.1 ± 0.1 b1.3 ± 0.1 ab1.4 ± 0.1 a
18:4ω30.3 ± 0.0 b0.4 ± 0.1 b0.5 ± 0.1 a
20:3ω30.1 ± 0.00.1 ± 0.00.1 ± 0.0
20:4ω30.6 ± 0.10.7 ± 0.10.7 ± 0.1
20:5ω3 (EPA)8.7 ± 0.5 a7.0 ± 0.2 b6.7 ± 0.7 b
22:5ω32.3 ± 0.2 a1.8 ± 0.2 b1.7 ± 0.2 b
22:6ω3 (DHA)38.2 ± 1.936.9 ± 3.433.3 ± 3.1
Total PUFA 460.4 ± 1.559.2 ± 3.659.3 ± 1.0
P/S ratio 52.4 ± 0.12.4 ± 0.32.5 ± 0.1
Total ω351.7 ± 1.6 c48.6 ± 3.4 b45.9 ± 1.4 a
Total ω67.4 ± 0.49.4 ± 0.512.3 ± 0.7
ω3/ω6 ratio7.0 ± 0.5 a5.2 ± 0.4 b3.7 ± 0.3 c
DHA/EPA ratio4.4 ± 0.4 b5.3 ± 0.5 a5.0 ± 0.7 ab
EPA/ARA ratio6.5 ± 0.8 a4.6 ± 0.5 b3.5 ± 0.4 b
DHA/ARA ratio28.5 ± 2.3 a24.4 ± 1.8 b17.5 ± 1.4 c
1 Data expressed as % lipid or fatty acid methyl ester (FAME). Values are means ± standard deviation (n = 9 per treatment). Means with different superscripts indicate significant differences (p < 0.05) based on Tukey’s posthoc test following a general linear model. FM = fish meal (control); FM/AB = fish meal/algal biomass Pav459; AB = algal biomass Pav459. 2 Saturated fatty acid. 3 Monounsaturated fatty acid. 4 Polyunsaturated fatty acid. 5 PUFA/SFA ratio.
Table 8. Sterol composition of the neutral lipid fraction of Atlantic salmon muscle tissue from a fish fed an AB diet.
SterolCommon NameFormulaMWRT
(min)
Sterol Content (µg mg−1) of Lipids
Cholest-5-en-3β-olCholesterol27:1Δ545847.04343.9
5α-cholestan-3β-ol *Cholestanol27:0, 5αΔ°46047.265tr
5α-cholest-7-en-3β-olLathosterol27:1Δ745848.2560.1
24-methylcholest-5-en-3β-ol *Campesterol28:1Δ5Me2447249.1250.2
5α-cholest-8(14)-en-3β-ol 27:1Δ8(14)45849.5920.2
23,24-dimethylcholest-5-en-3β-ol * 29:1Δ5 Me23,2448650.9020.1
Total 4.44%
* Also found in Pavlova lutheri. Supercripts indicate positions of double bonds when present.
Table 9. δ13C values (‰) of essential fatty acids for FM and AB diets, liver total fatty acids of fish fed two focal diets (FM and AB), and relative percent contribution (RC) of the AB diet to tissue fatty acids.
Fatty Acids (‰)FM 1AB 1p-ValueLiver TFA (FM) 1Liver TFA (AB) 1p-ValueRC (%) 2
LA−26.1 ± 0.4−25.8 ± 0.00.322−25.6 ± 0.1−25.9 ± 0.20.127
ALA−31.8 ± 0.2−30.9 ± 0.1<0.05NDND
ARANDND −23.5 ± 0.5−28.4 ± 0.4<0.05
EPA−24.8 ± 0.7−39.6 ± 0.1<0.05−24.8 ± 0.3−38.0 ± 1.2<0.0542.7%
DHA−24.4 ± 0.1−36.0 ± 0.2<0.05−24.4 ± 0.2−35.6 ± 0.6<0.0556.9%
ND = not detectable. 1 Values expressed as mean ± standard deviation (n = 3). 2 Relative contribution of Pav459 EPA and DHA.
Table 10. δ13C values (‰) of essential fatty acids for FM and AB diets, liver phospholipids of fish fed two focal diets (FM and AB), and relative percent contribution (RC) of the AB diet to tissue fatty acids.
Fatty Acids (‰)FM 1AB 1p-ValueLiver PL (FM) 2Liver PL (AB) 2p-ValueRC (%) 3
LA−26.1 ± 0.4−25.8 ± 0.00.322−25.1 ± 0.4−26.0 ± 0.4<0.05
ALA−31.8 ± 0.2−30.9 ± 0.1<0.05NDND
ARANDND −24.1 ± 0.7−28.3 ± 1.0<0.05
EPA−24.8 ± 0.7−39.6 ± 0.1<0.05−24.8 ± 1.1−37.6 ± 0.2<0.0541.3%
DHA−24.4 ± 0.1−36.0 ± 0.2<0.05−24.2 ± 1.0−35.0 ± 1.5<0.0554.0%
ND = not detectable. 1 Values expressed as mean ± standard deviation (n = 3). 2 Values expressed as mean ± standard deviation (n = 9). 3 Relative contribution of Pav459 EPA and DHA.
Table 11. δ13C values (‰) of essential fatty acids for FM and AB diets, muscle total fatty acids of fish fed two focal diets (FM and AB), and relative percent contribution (RC) of the AB diet to tissue fatty acids.
Fatty Acids (‰)FM 1AB 1p-ValueMuscle TFA (FM) 2Muscle TFA (AB) 2p-ValueRC (%) 3
LA−26.1 ± 0.4−25.8 ± 0.00.322−26.7 ± 0.4−27.0 ± 0.50.128
ALA−31.8 ± 0.2−30.9 ± 0.1<0.05−30.6 ± 0.4 −31.4 ± 0.2<0.05
ARANDND −24.5 ± 0.5−28.0 ± 0.4<0.05
EPA−24.8 ± 0.7−39.6 ± 0.1<0.05−25.2 ± 0.4 −36.1 ± 1.3<0.0536.6%
DHA−24.4 ± 0.1−36.0 ± 0.2<0.05−25.3 ± 0.4−32.9 ± 1.5<0.0543.1%
ND = not detectable. 1 Values expressed as mean ± standard deviation (n = 3). 2 Values expressed as mean ± standard deviation (n = 9). 3 Relative contribution of Pav459 EPA and DHA.
Table 12. δ13C values (‰) of essential fatty acids for FM and AB diets, muscle phospholipids of fish fed two focal diets (FM and AB), and relative percent contribution (RC) of the AB diet to tissue fatty acids.
Fatty Acids (‰)FM 1AB 1p-ValueMuscle PL (FM) 1Muscle PL (AB) 1p-ValueRC (%) 2
LA−26.1 ± 0.4−25.8 ± 0.00.322−25.6 ± 0.4−26.3 ± 0.20.073
ALA−31.8 ± 0.2−30.9 ± 0.1<0.05−30.7 ± 1.2−30.6 ± 0.30.836
ARANDND −23.8 ± 0.4−27.5 ± 0.2<0.05
EPA−24.8 ± 0.7−39.6 ± 0.1<0.05−25.2 ± 0.1−36.6 ± 0.7<0.0538.1%
DHA−24.4 ± 0.1−36.0 ± 0.2<0.05−25.5 ± 0.4−32.7 ± 1.0<0.0542.0%
ND = not detectable. 1 Values expressed as mean ± standard deviation (n = 3). 2 Relative contribution of Pav459 EPA and DHA.
Disclaimer/Publisher’s Note: The statements, opinions and data contained in all publications are solely those of the individual author(s) and contributor(s) and not of MDPI and/or the editor(s). MDPI and/or the editor(s) disclaim responsibility for any injury to people or property resulting from any ideas, methods, instructions or products referred to in the content.

