
Research on the Spatial and Temporal Dynamics of Crowd Activities in Commercial Streets and Their Relationship with Formats—A Case Study of Lao Men Dong Commercial Street in Nanjing

Abstract
:1. Introduction
2. Literature Review
2.1. Related Research on Pedestrian Activity Trajectories
2.2. Research on the Correlation between Population Activity and Formats
3. Data and Methods
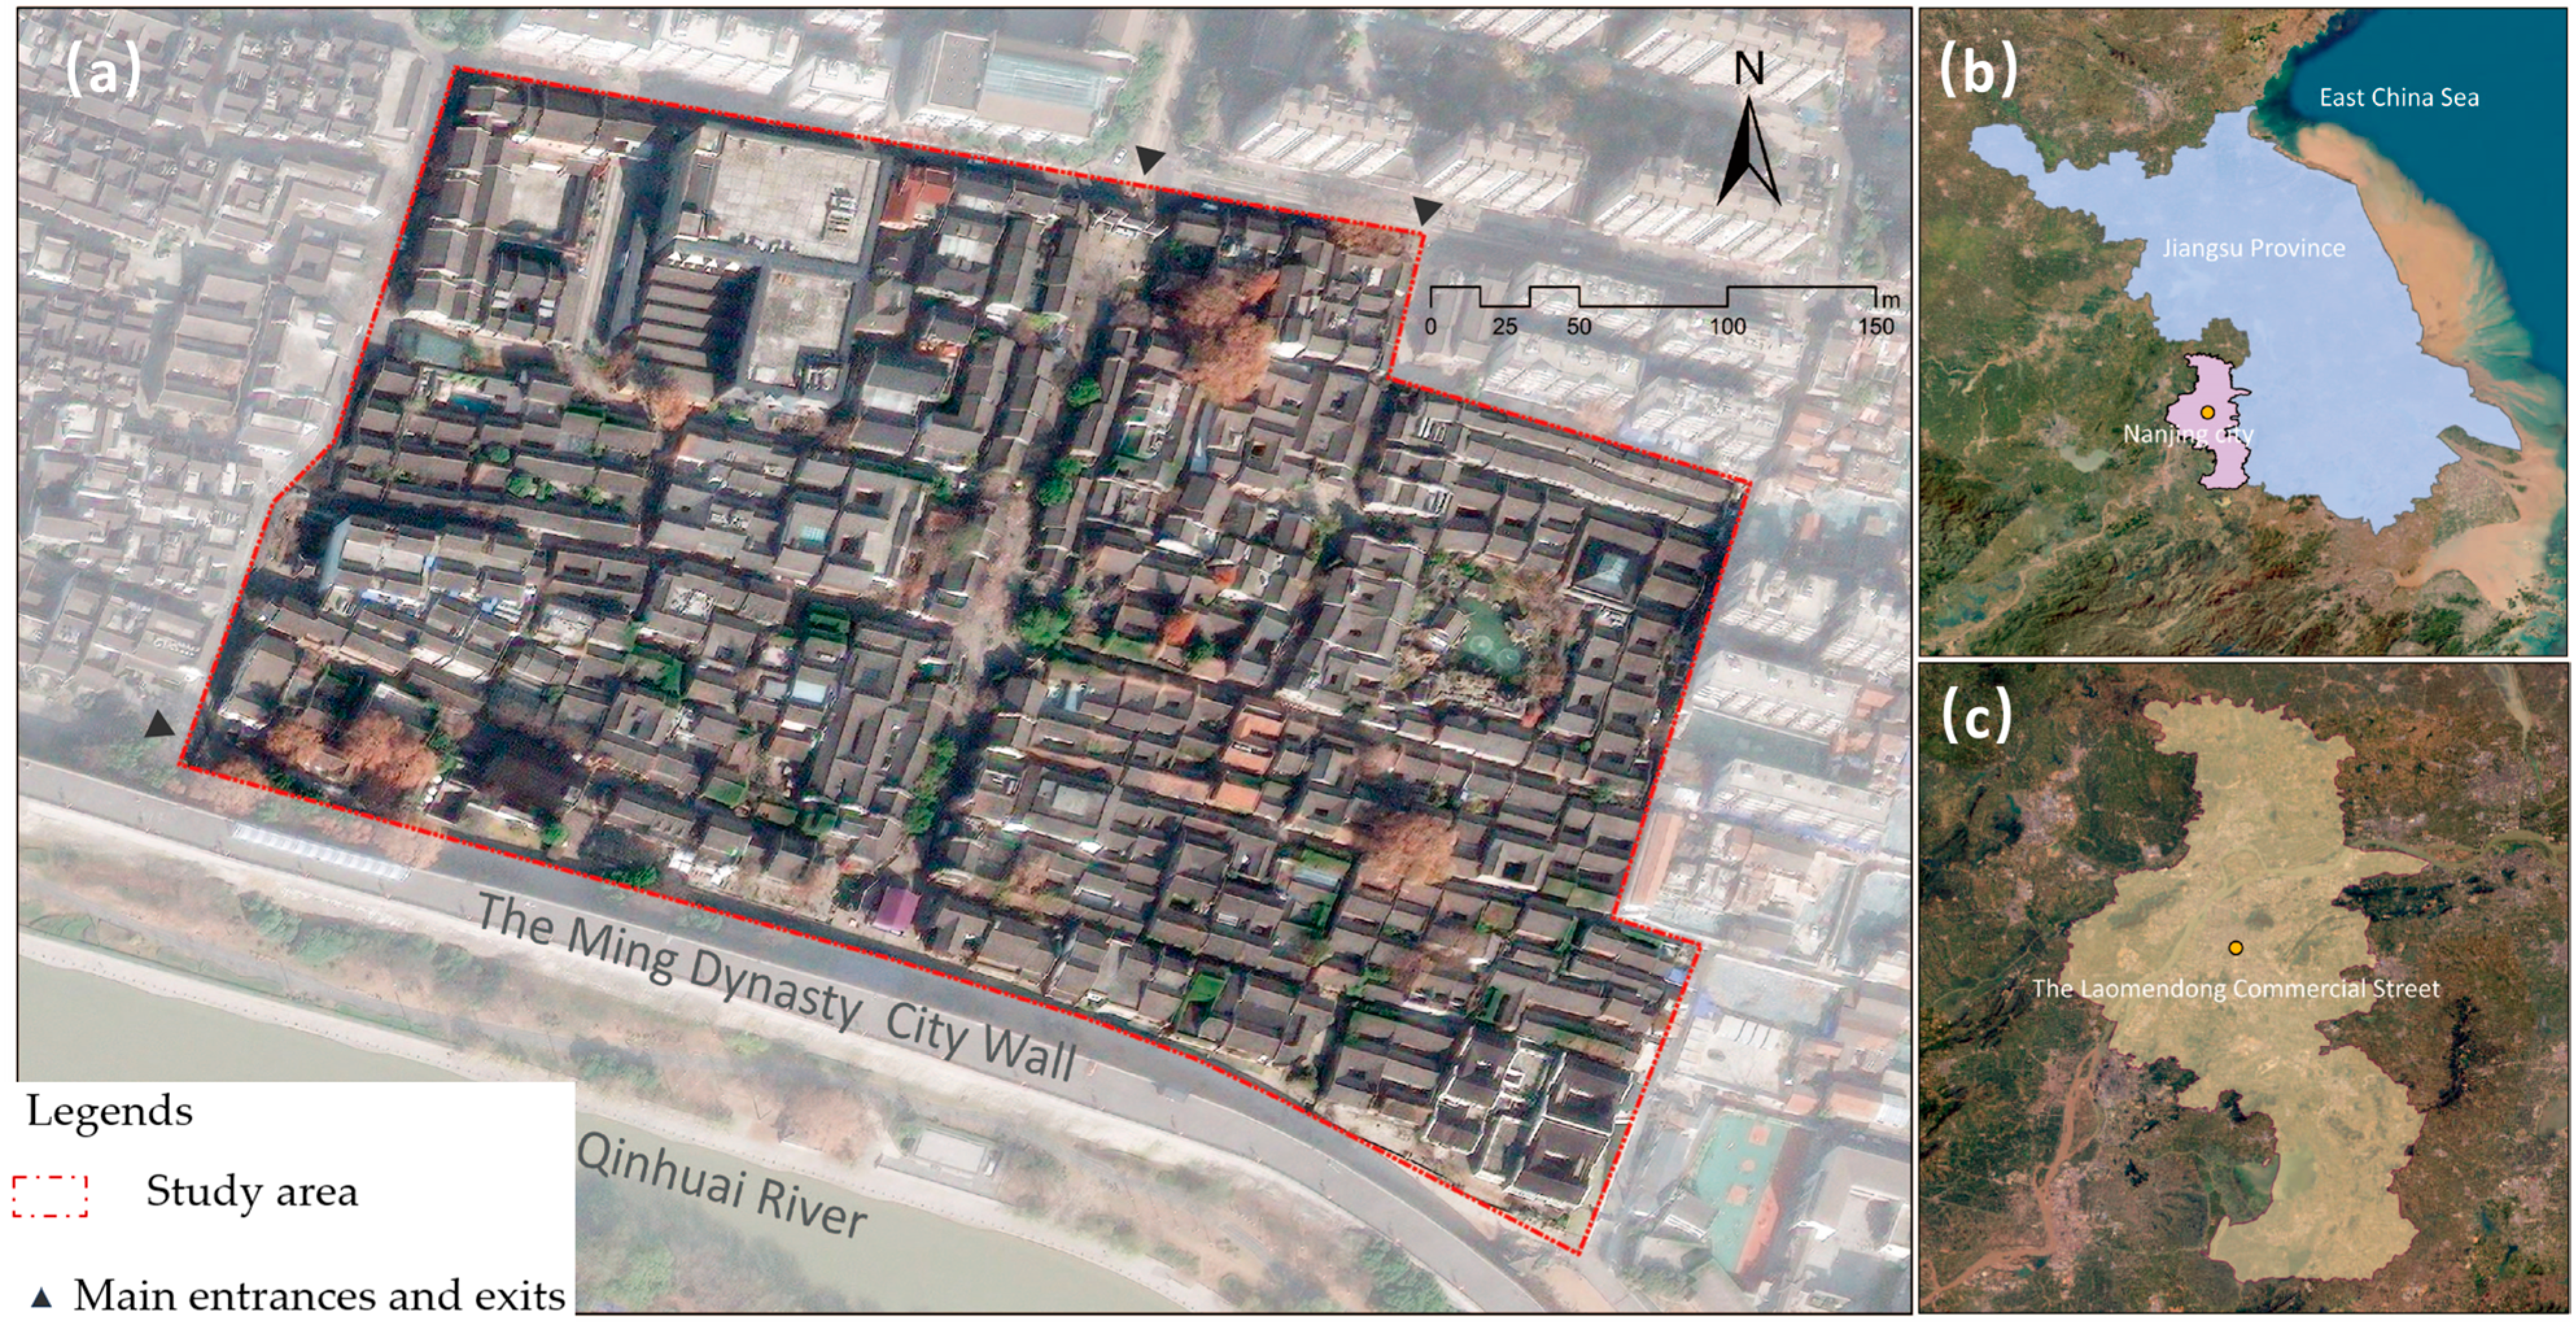
3.1. Study Area
3.2. Data
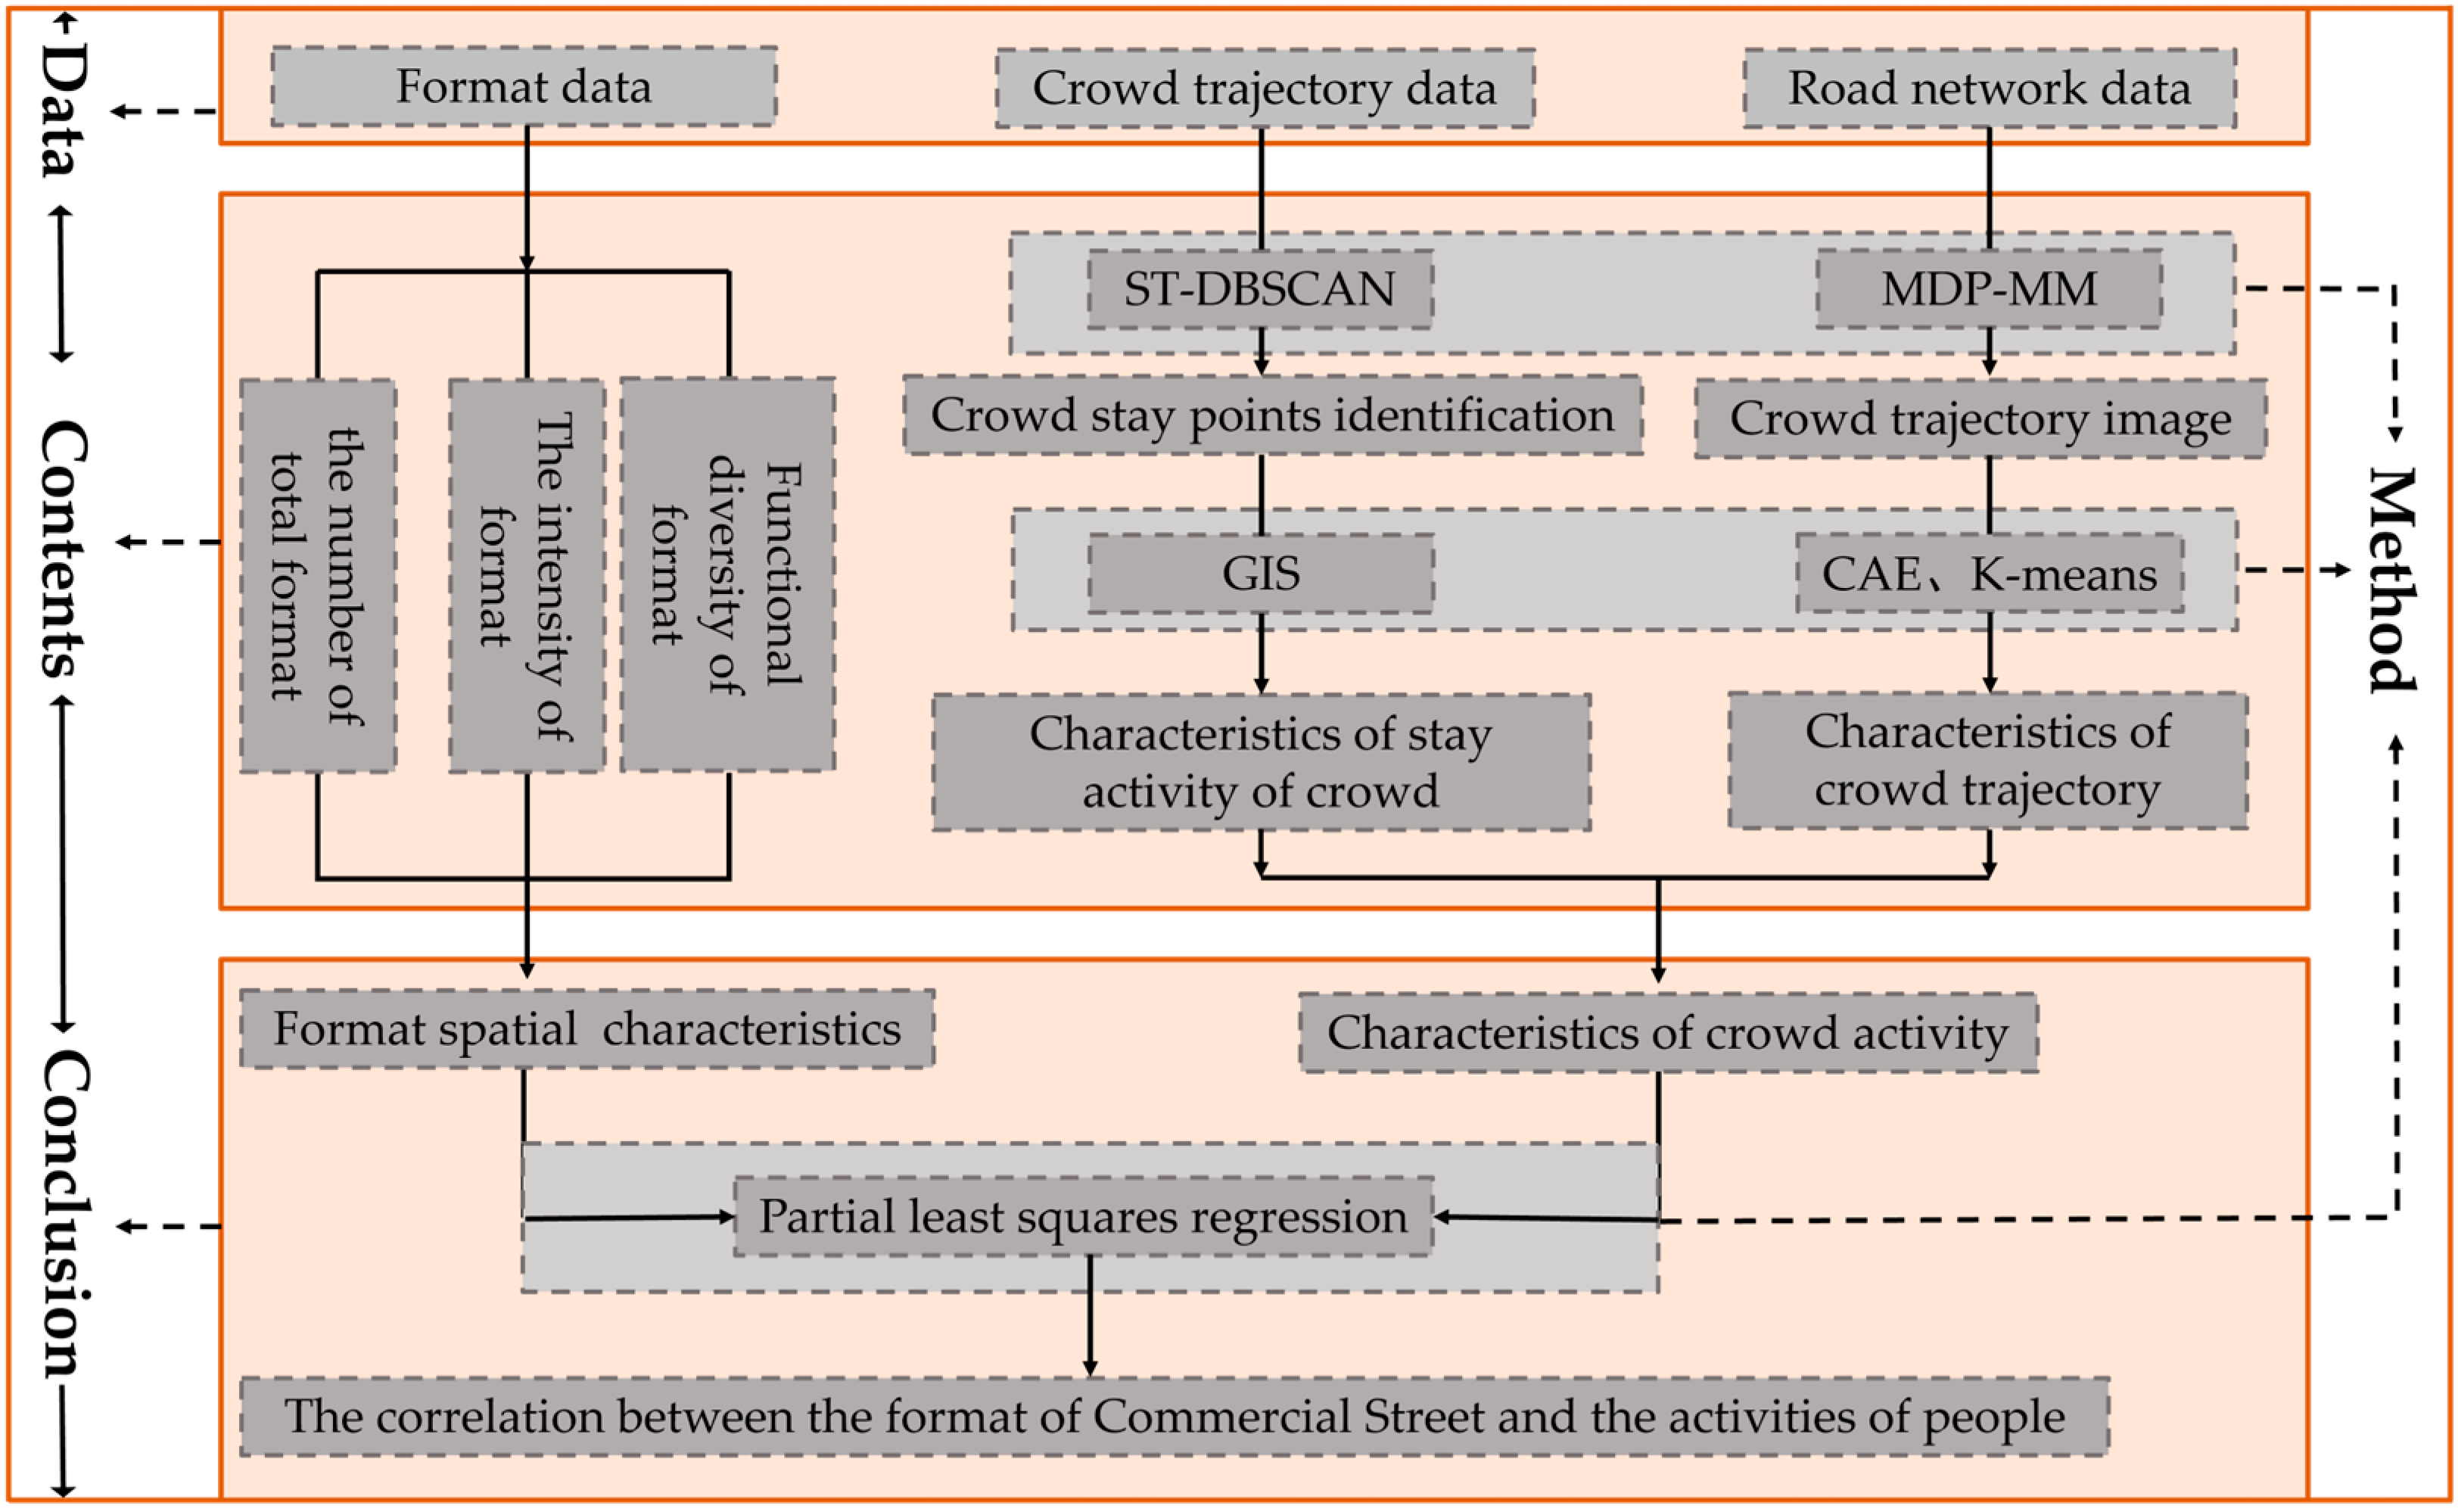
3.3. Method
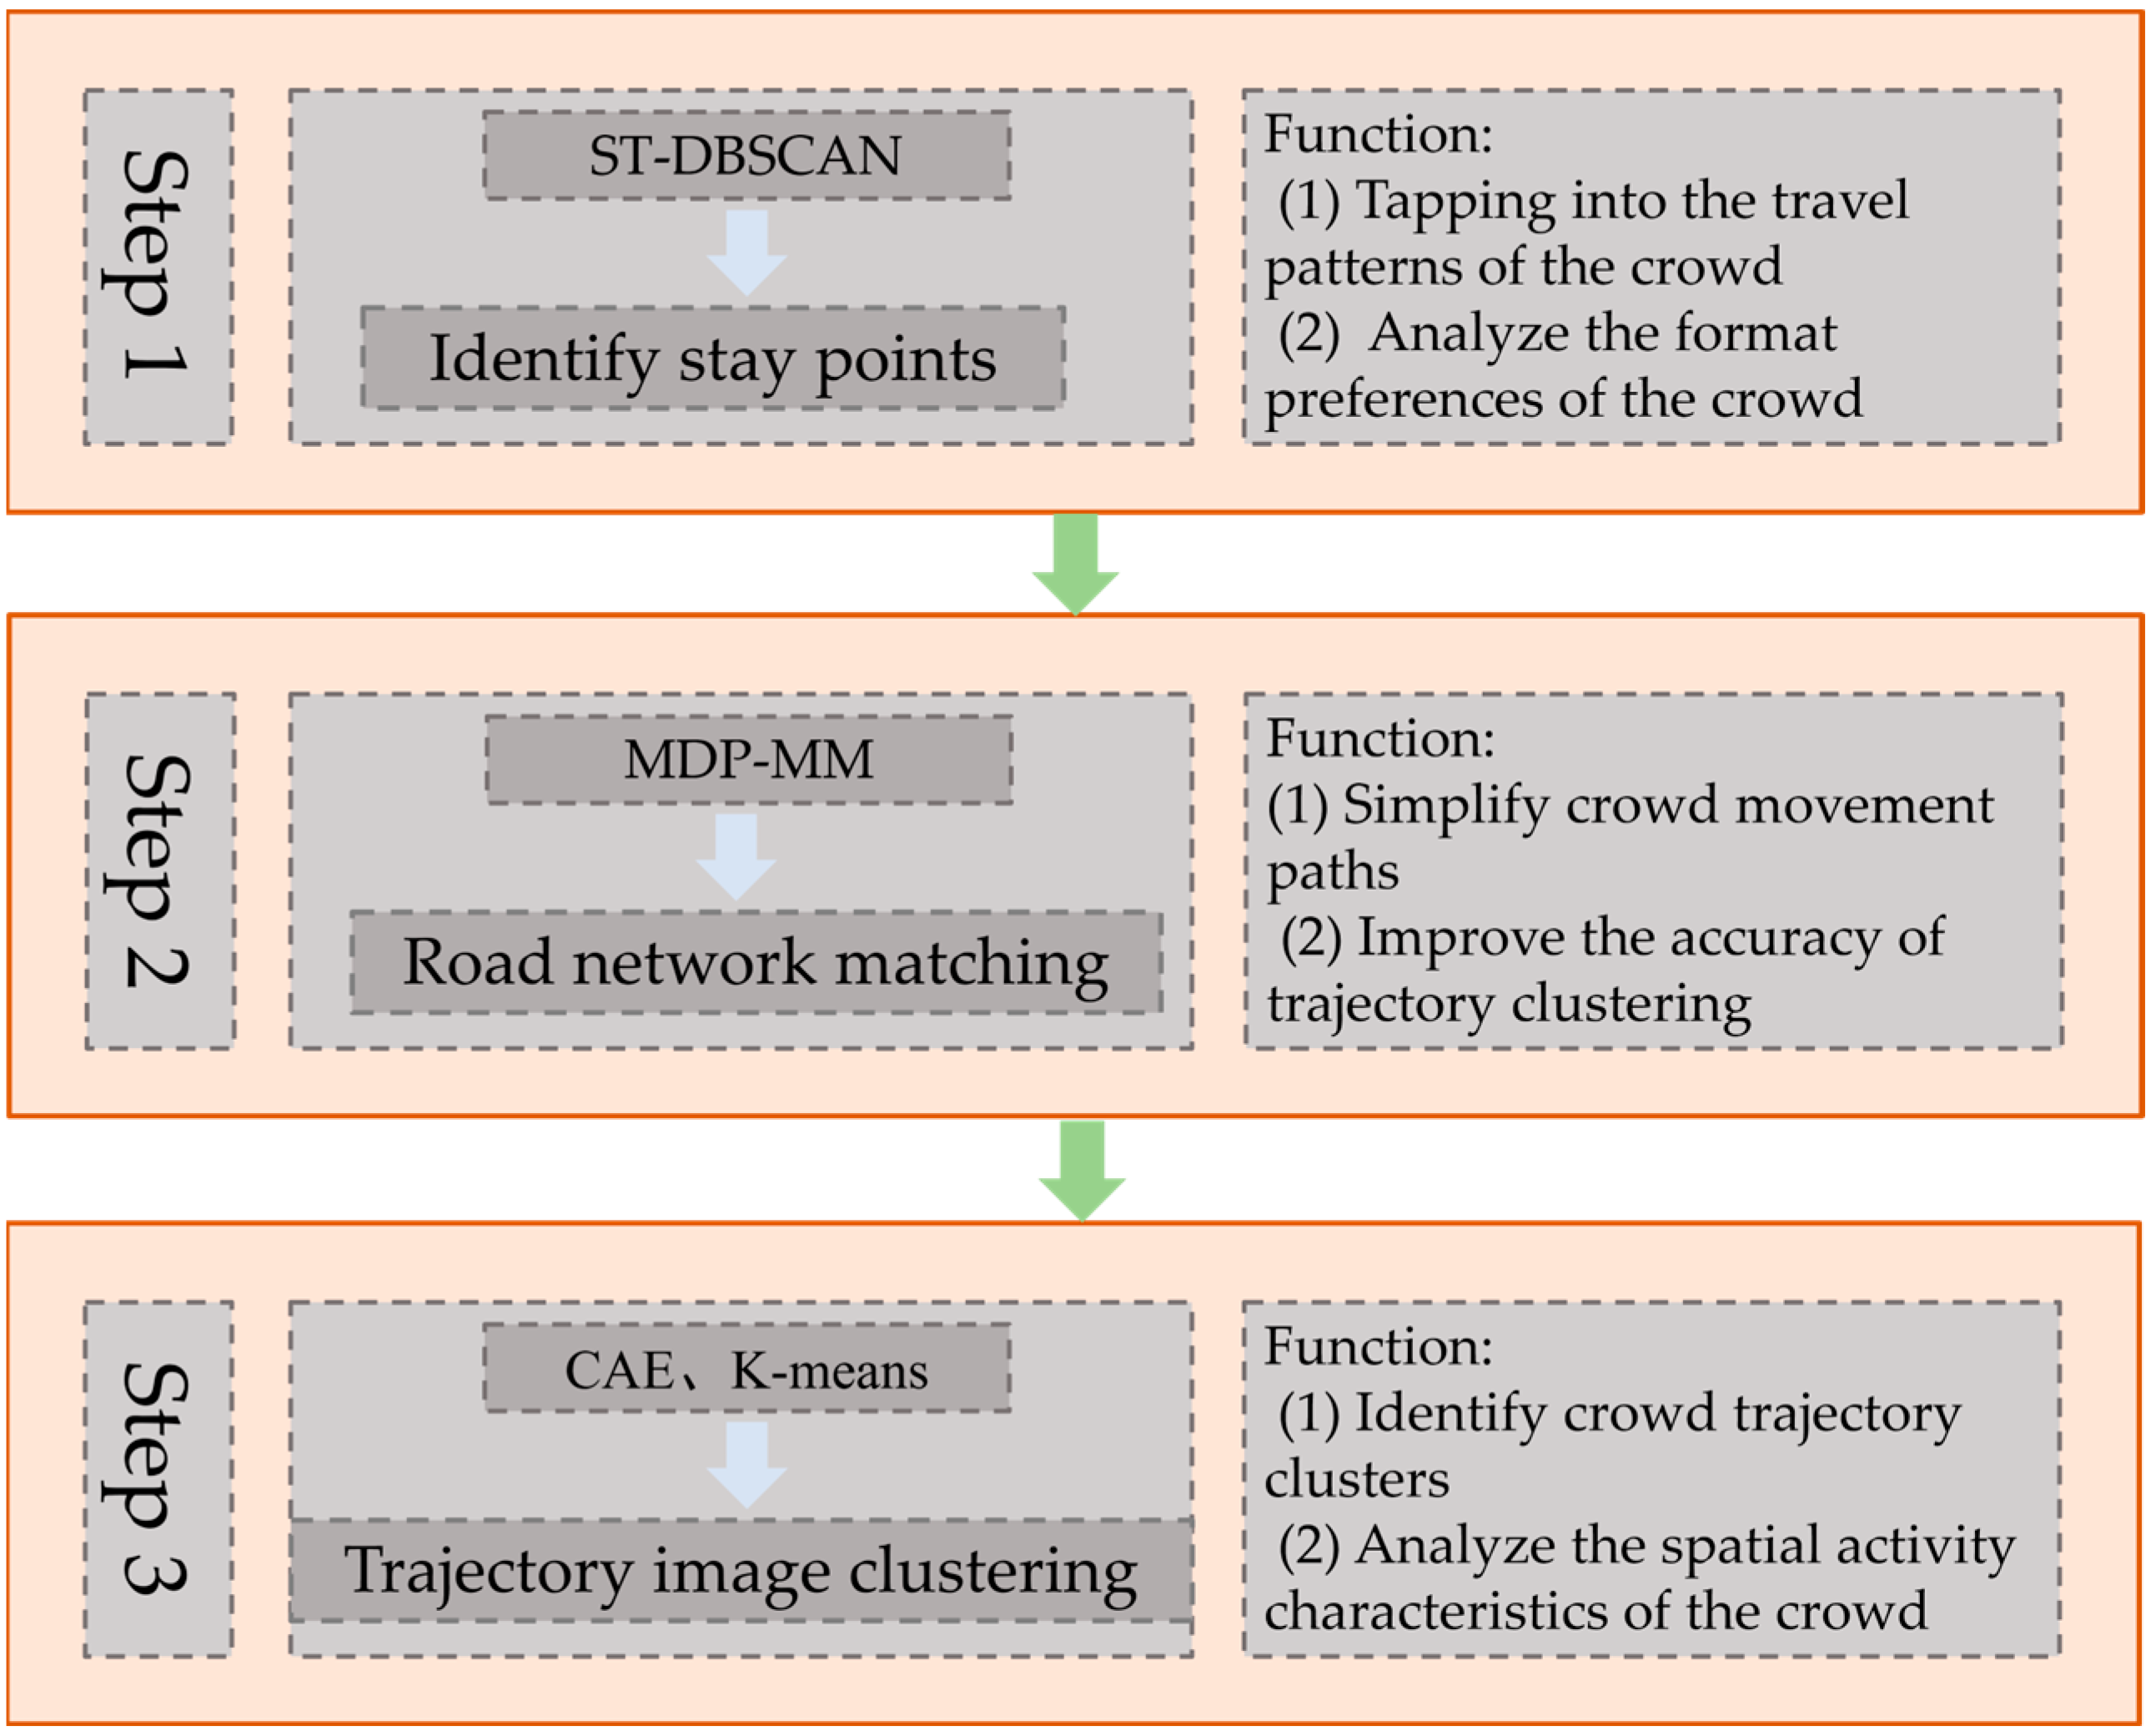
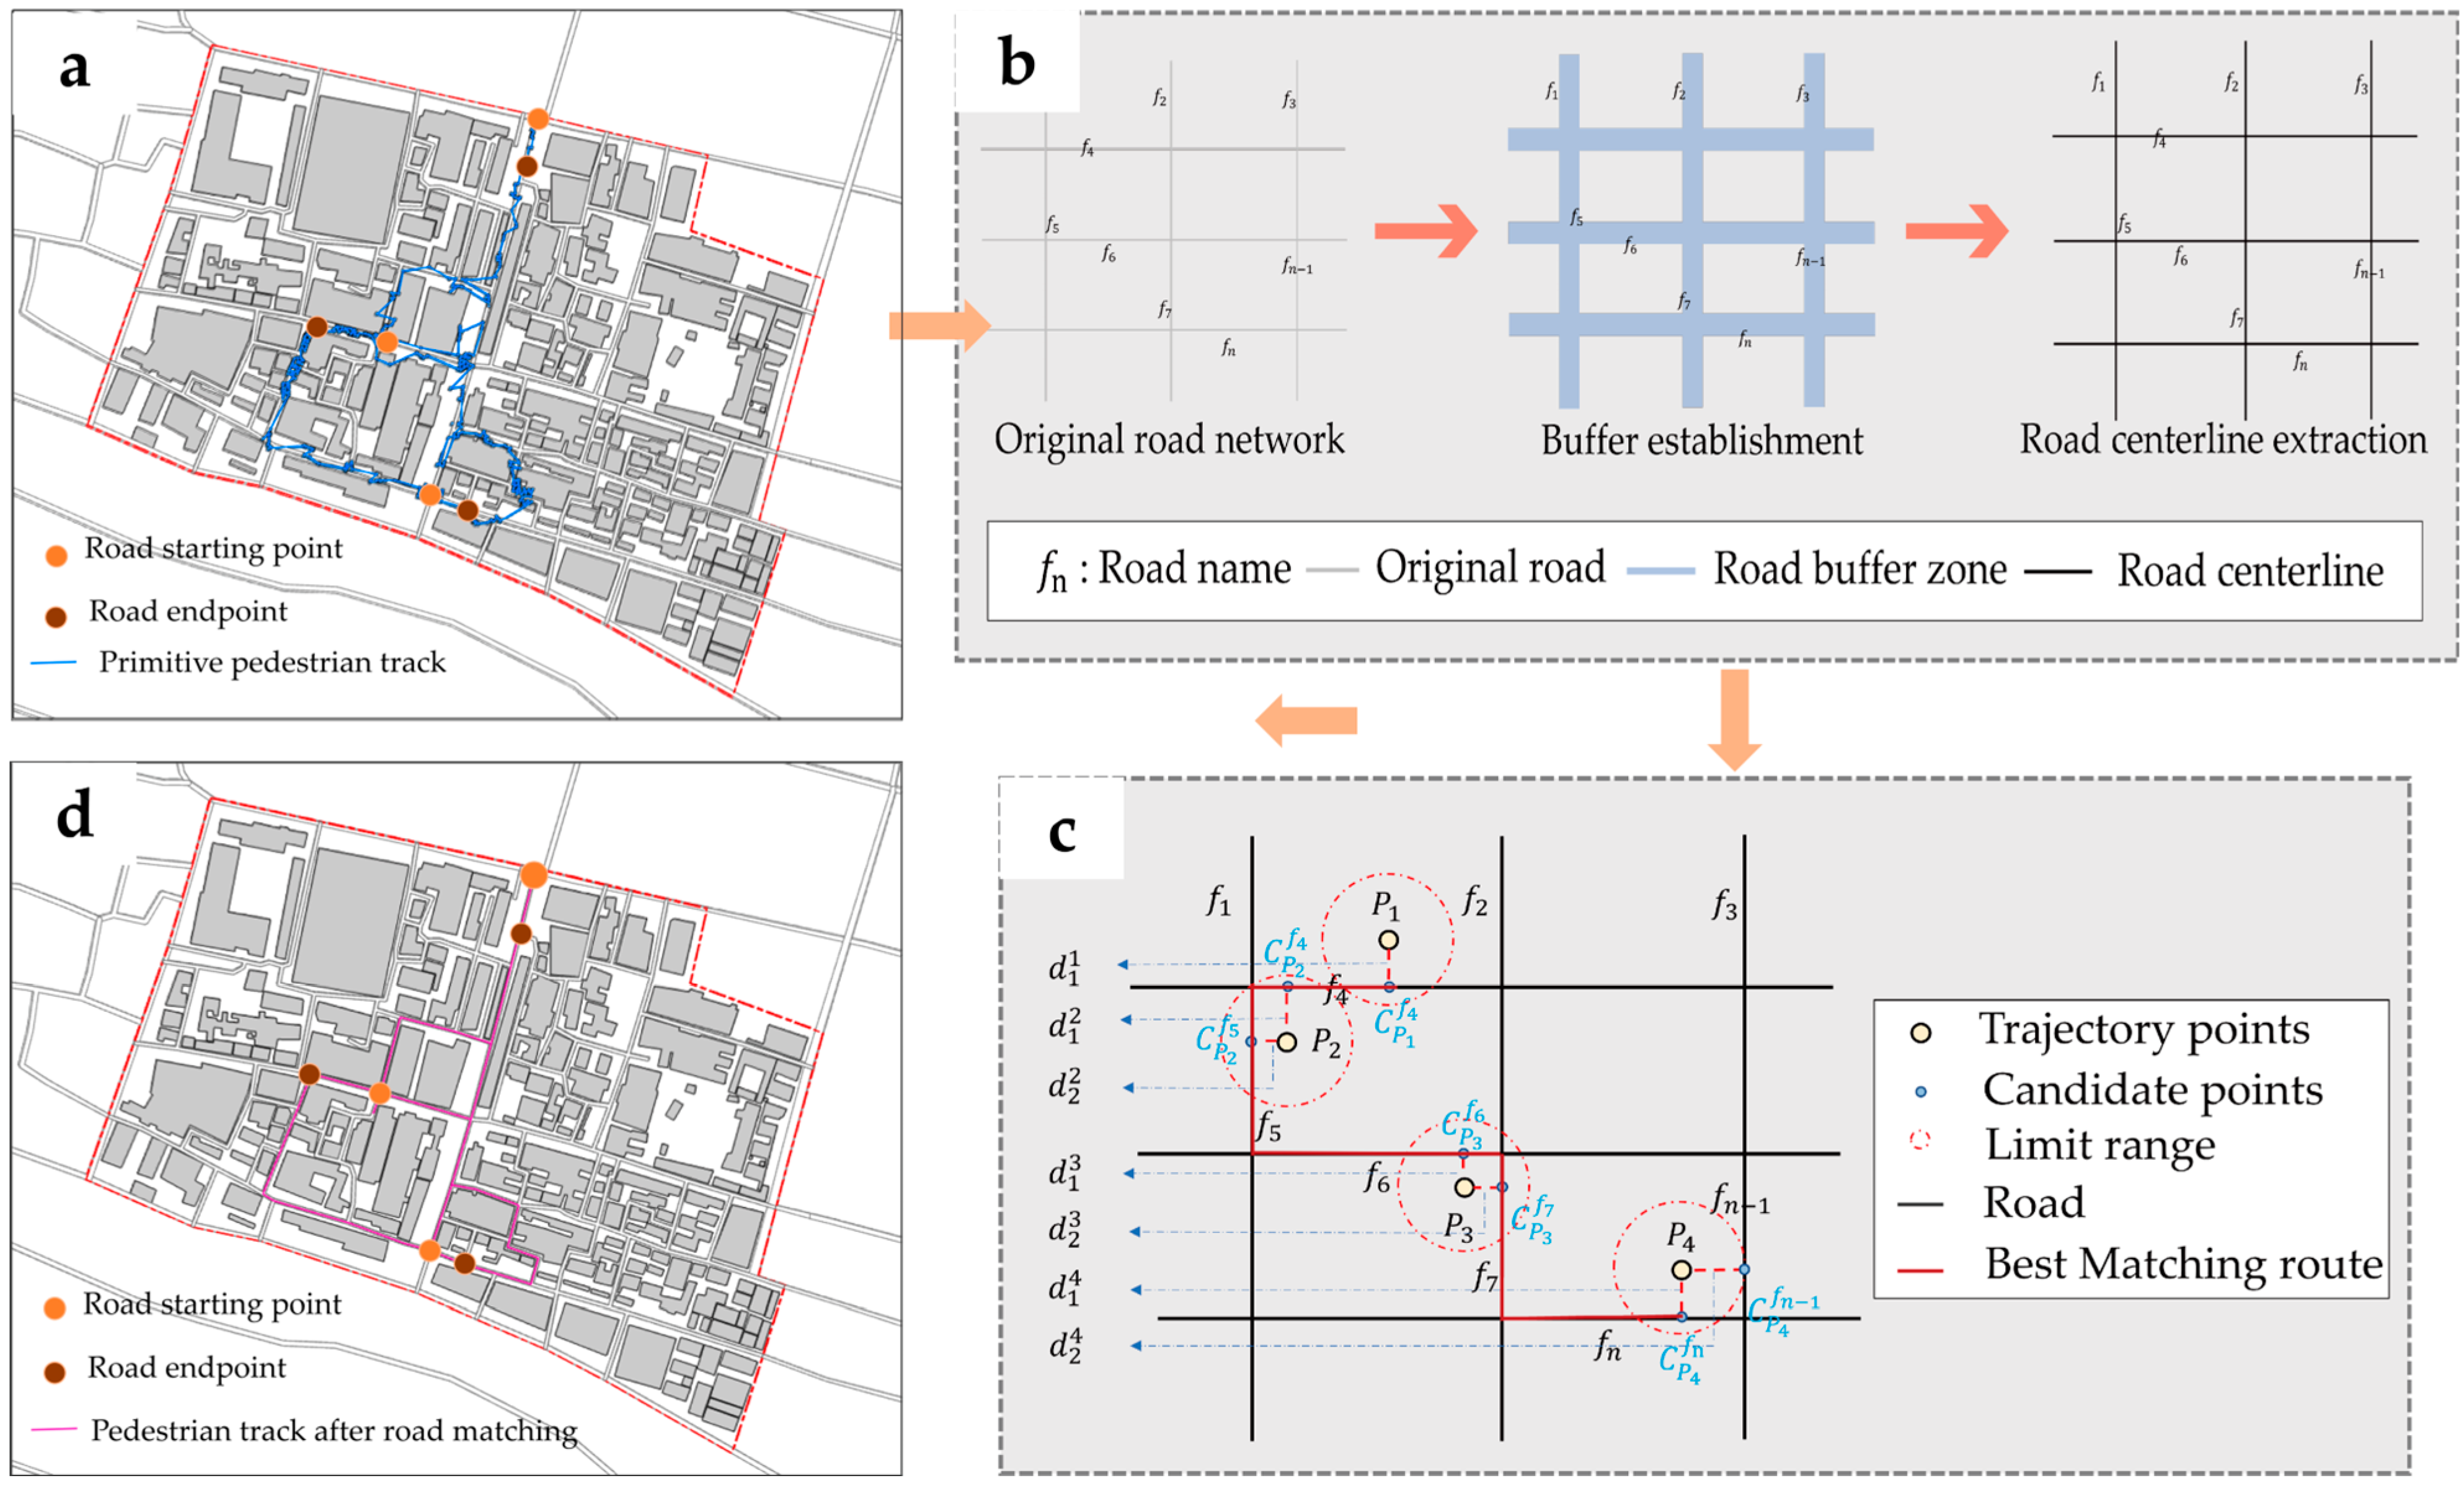
3.3.1. Acquisition of Crowd Trajectory Data
3.3.2. Crowd Spatial Characteristics Analysis Method
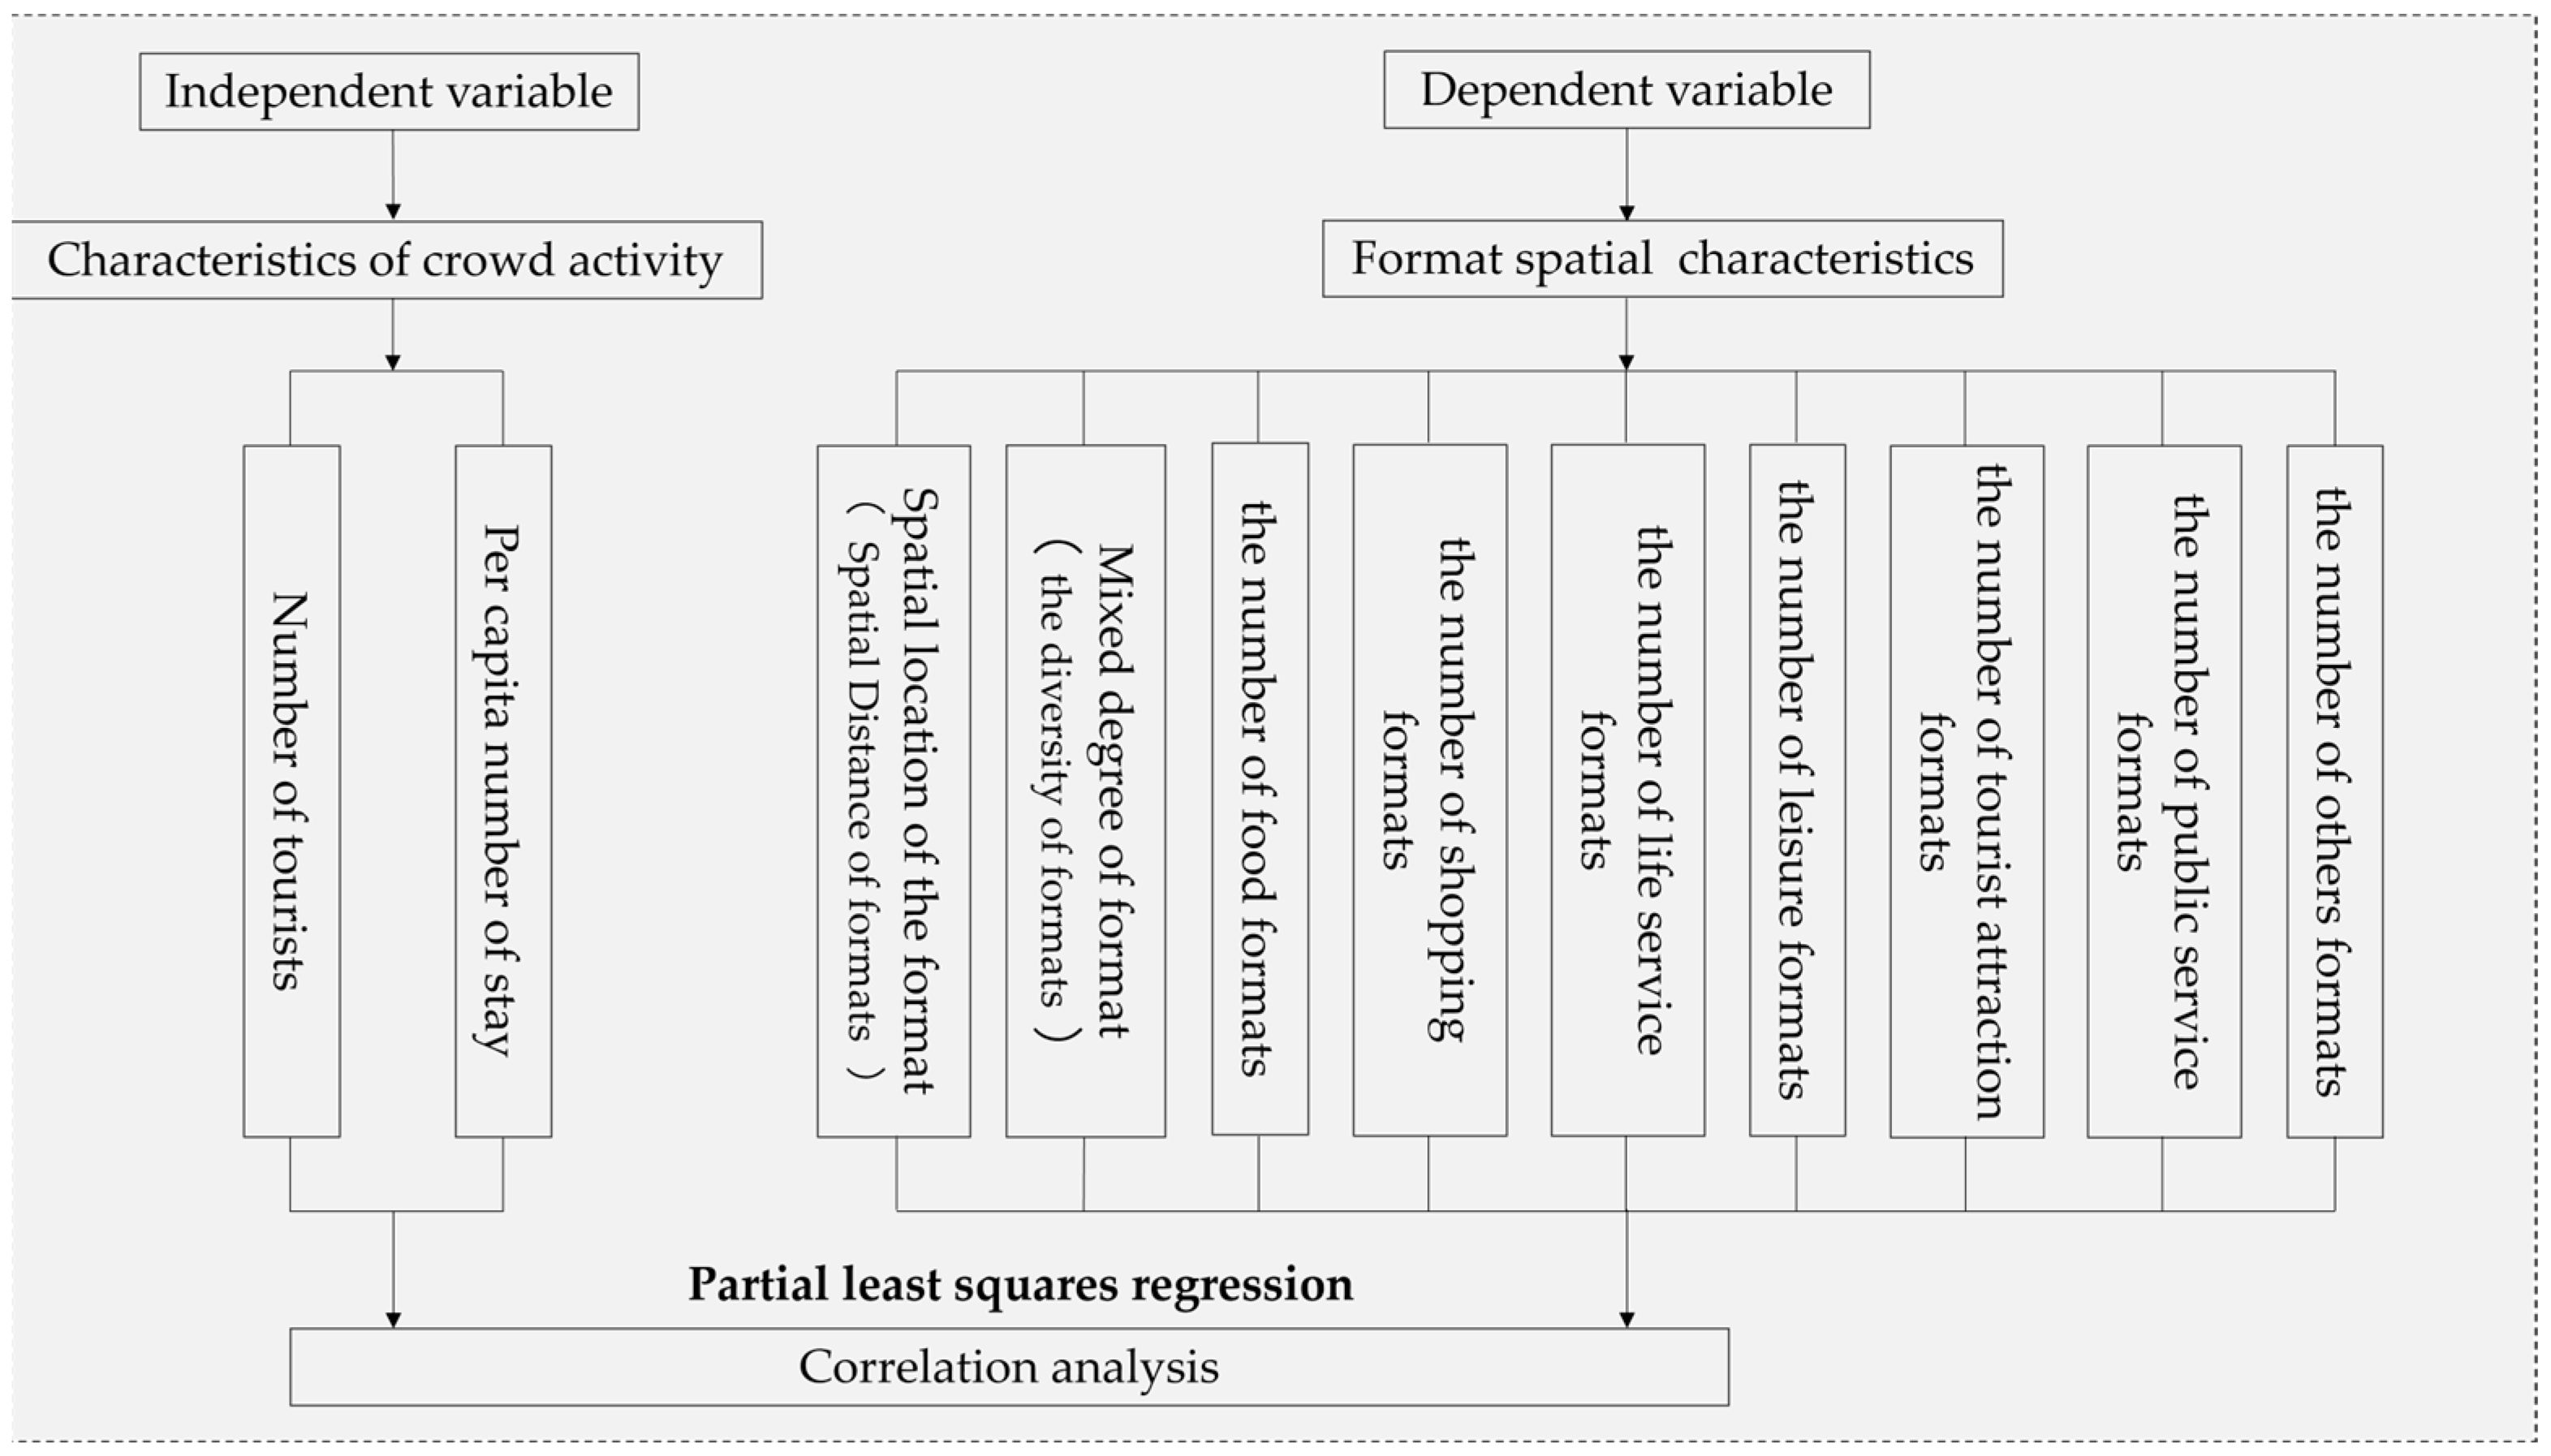
3.3.3. Variable Selection and Statistical Analysis
4. Results
4.1. Characteristics of Crowd Activities
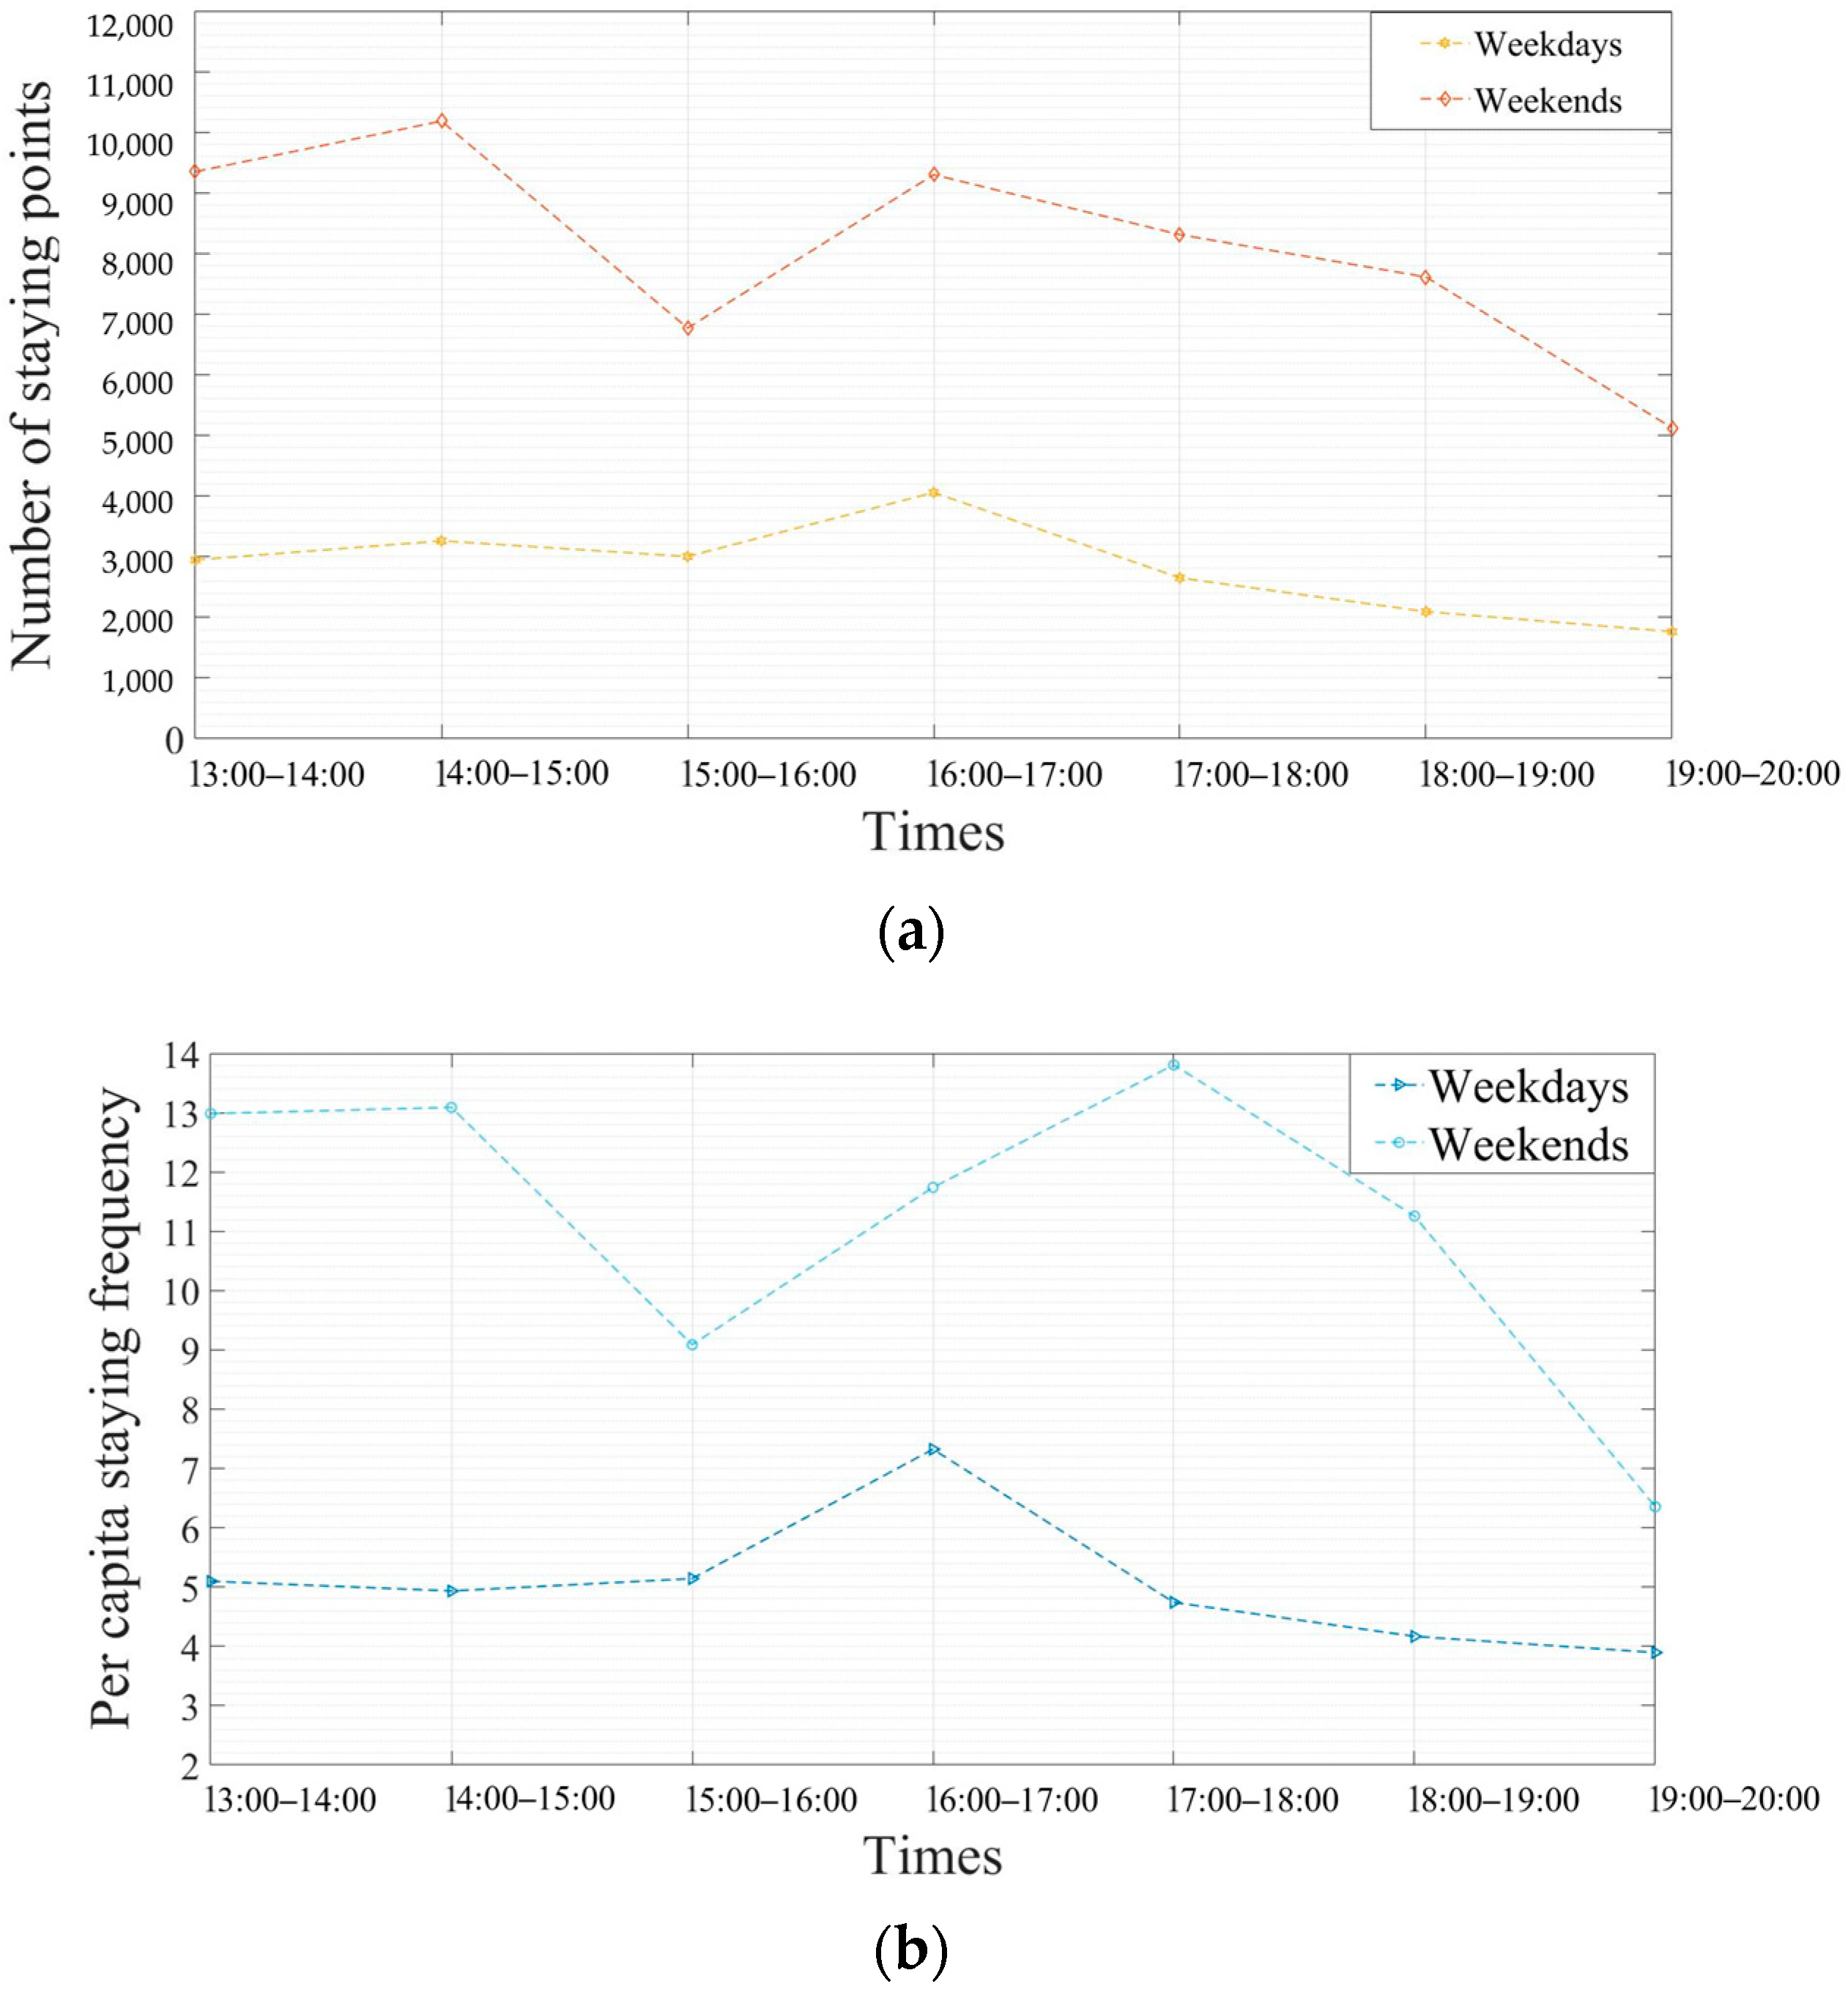
4.1.1. Spatiotemporal Characteristics of Crowd Stay Activities
4.1.2. The Characteristics of the Crowd Spatial Trajectories
- (1)
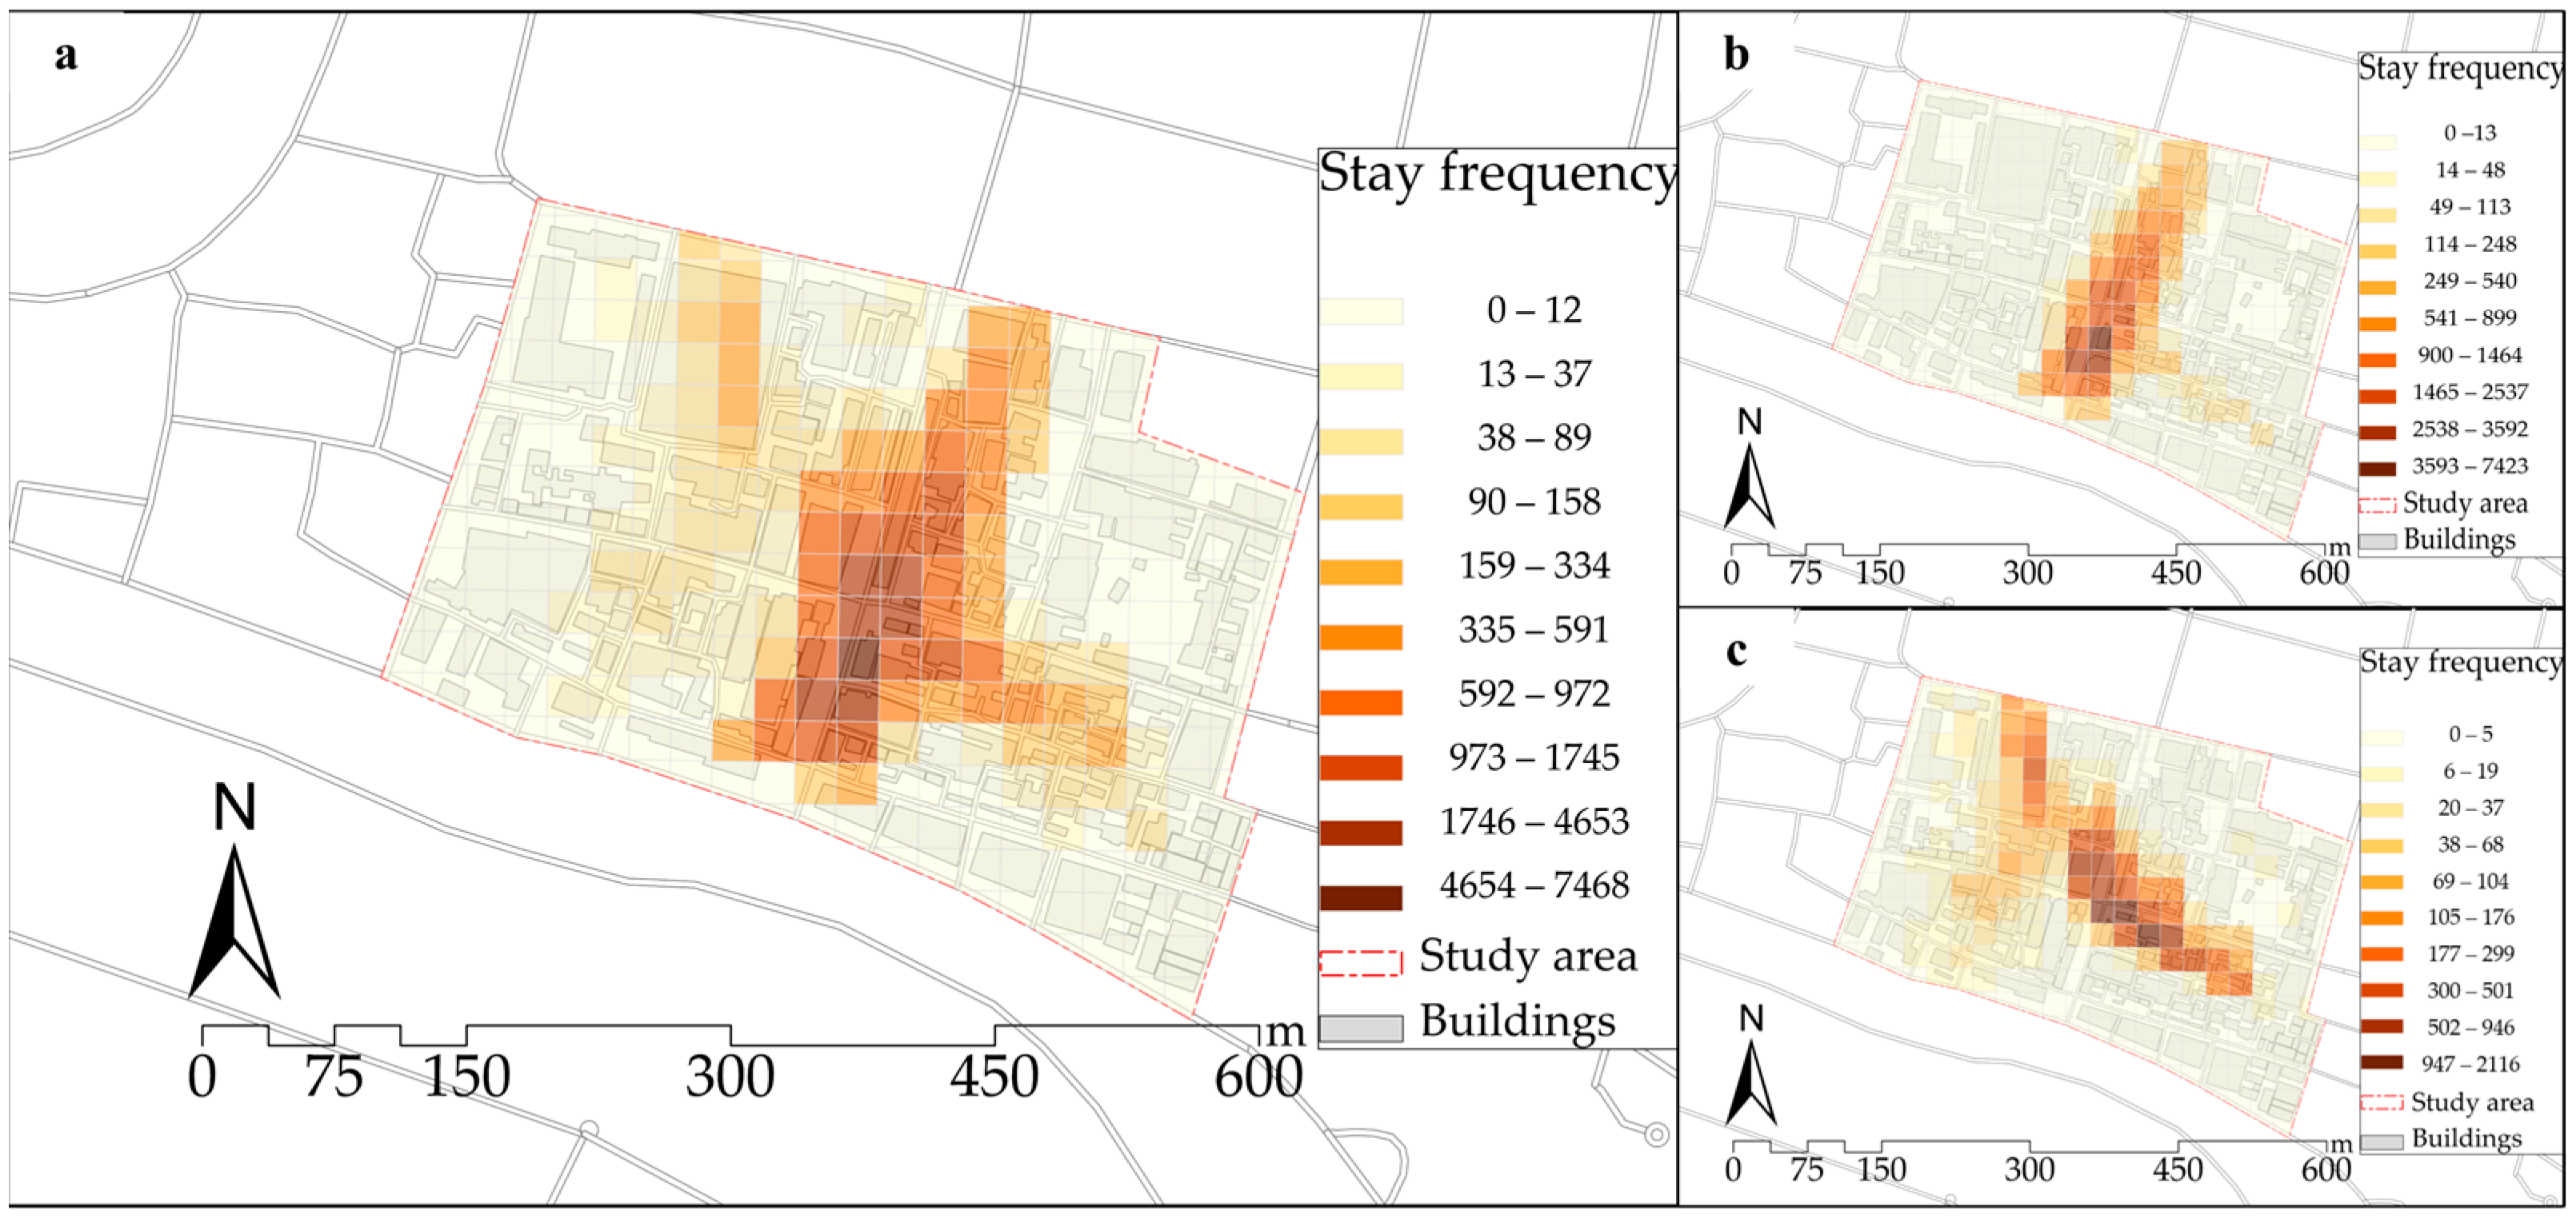
- Crowd trajectory cluster 1 (Figure 12a), accounting for 40.49% of the total number of active people, is mainly distributed in the central and eastern areas of the commercial street, which is dominated by catering and retail formats. This feature has strong spatial mobility, and people mainly carry out activities such as sightseeing and consumption and have short stays in spaces such as retail and recreational facilities.
- (2)
- Crowd-tracking cluster 2 (Figure 12b) is mainly concentrated in the middle of the commercial street, where the formats are mainly retail and leisure. The spatial mobility of the crowd under this characteristic is weak; crowds often stop and stay for a long time in leisure, entertainment, and other formats. The stay activities of the crowd are relatively concentrated, accounting for 18.48% of the total number of active people.
- (3)
- Trajectory cluster 3 (Figure 12c) is mainly concentrated in the central and southern parts of the commercial street, which is dominated by catering and entertainment formats. Under these conditions, the spatial mobility of a crowd is strong. Although the crowd stays more frequently, they mainly conduct short-stay activities such as watching and resting, and the number of active people accounts for 13.54% of the total number of active people.
- (4)
- In contrast, the number of people in trajectory cluster 4 (Figure 12d) is relatively small at only 3.8%. They are mainly active in the northwest and southeast places of the commercial street, which is dominated by cultural and leisure industries. The spatial flow of crowds is weak, and people mainly carry out short-stay activities such as sightseeing and eating.
4.2. The Relationship between Commercial Street Formats and Crowd Activity Characteristics
5. Discussion
5.1. Research Findings
- (1)
- A new framework for crowd activity analysis was proposed. Compared with traditional research methods, the framework can improve the efficiency and accuracy of data analysis, and it uses machine learning algorithms such as supervised learning algorithms and convolutional autoencoders to extract crowd-dynamic spatial activity information. Although research on machine learning algorithms for studying crowd activities has made some progress, S. Williams et al. used image processing technology to conduct quantitative statistics of location information in time and space dimensions and qualitative discussions of human activities [41]. However, it is not comprehensive to only rely on location information to measure crowd activities. Y. Li et al. used deep learning methods to explore the relationship between a street’s built environment and the street vitality but ignored the details of crowd activities [33]. Therefore, we used stay points to identify people’s stay or movement behavior in space to obtain the activity status of the crowd, and we explore the influencing factors of crowd activities in combination with the space environment they live in. Furthermore, this method can help us understand the flow trend of people in space by studying the crowd’s activity trajectory clusters, which can provide guidance for the spatial layout of commercial streets. This method is not only limited to commercial streets; it is also helpful for us to conduct correlational analysis of crowd activities in different spatial environments, such as parks, central areas, cities, and other spatial scales, making it easier to obtain the characteristics of crowd activities at different spatial scales.
- (2)
- We extracted the visited formats in a commercial street according to the stay areas under different trajectory clusters and analyzed the correlation between the characteristics of crowd activities and formats under different spatial activity ranges. Based on a subjective perspective of people’s preferences for formats, we explored the reasons why people chose commercial formats. Previous studies tended to discuss all commercial formats within the scope of the research [89,90], that is, they tended to include all business formats within the scope of research into the scope of discussion and used the business formats in the research area as part of the spatial environment to study the connection between people and space. However, we focused on commercial formats visited on a commercial street, which is more targeted and reflects the real needs and behavioral preferences of people on the street.
- (3)
- The proposed crowd analysis framework was applied to a commercial street. The results show that our method can accurately characterize the spatiotemporal characteristics of crowd activity on commercial streets, and understanding the stay rules of crowds can inspire retailers and provide certain suggestions for the spatial layout of business formats. Therefore, this method is effective and contributes significantly to enhancing the competitiveness of commercial streets. In addition, Lao Men Dong is a typical representative of small-scale, low-rise commercial streets with rich format types, diverse functions, and frequent crowd activities. Since this type of commercial street emphasizes pedestrian orientation, in order to ensure the safety and comfort of crowd activities, any destination in most commercial streets should be limited to 800 m, and the total walking distance should not exceed 1500 m [91]. The area of Lao Men Dong Commercial Street is 700,000 square meters. Its spatial scope exceeds the spatial scale of most low-rise commercial streets, and it has strong universal applicability. Therefore, revealing the degree of correlation between format space and crowd activities in Lao Men Dong Commercial Street can also provide insights into the sustainable development of commercial streets of the same scale.
5.2. Limitations
6. Conclusions
Author Contributions
Funding
Institutional Review Board Statement
Informed Consent Statement
Data Availability Statement
Conflicts of Interest
References
- Ntounis, N.; Saga, R.S.; Warnaby, G.; Loroño-Leturiondo, M.; Parker, C. Reframing high street viability: A review and synthesis in the English context. Cities 2023, 134, 104182. [Google Scholar] [CrossRef]
- Maliene, V.; Fowles, S.; Atkinson, I.; Malys, N. A sustainability assessment framework for the high street. Cities 2022, 124, 103571. [Google Scholar] [CrossRef]
- Yu, H. Trend Analysis of The Development of Commercial Street In Japan. Jiangsu Commer. Forum 2016, 381, 3–7. [Google Scholar] [CrossRef]
- Johnstone, M.-L. The servicescape: The social dimensions of place. J. Mark. Manag. 2012, 28, 1399–1418. [Google Scholar] [CrossRef]
- Peters, M.; Muellmann, S.; Christianson, L.; Stalling, I.; Bammann, K.; Drell, C.; Forberger, S. Measuring the association of objective and perceived neighborhood environment with physical activity in older adults: Challenges and implications from a systematic review. Int. J. Health Geogr. 2020, 19, 1–20. [Google Scholar] [CrossRef]
- Torrens, P.M. Data science for pedestrian and high street retailing as a framework for advancing urban informatics to individual scales. Urban Inform. 2022, 1, 9. [Google Scholar] [CrossRef]
- Wang, Y.; Chau, C.K.; Ng, W.; Leung, T. A review on the effects of physical built environment attributes on enhancing walking and cycling activity levels within residential neighborhoods. Cities 2016, 50, 1–15. [Google Scholar] [CrossRef]
- Zhao, P.; Liu, X.; Kwan, M.-P.; Shi, W. Unveiling cabdrivers’ dining behavior patterns for site selection of ‘taxi canteen’using taxi trajectory data. Transp. A Transp. Sci. 2020, 16, 137–160. [Google Scholar]
- Shi, Y.; Hu, X.; Yang, H.; Yang, J. Format compositions and spatial distribution characteristics of central districts in megacities: People’s Square and Shanghai’s Lujiazui District. Urban Des. Int. 2019, 24, 260–270. [Google Scholar] [CrossRef]
- Zahavi, Y. The UMOT Project; A Report Prepared for the US Department of Transportation, Research and Special Programs Administration, and the Federal Republic of Germany Ministry of Transport; DOT-RSA–DPW-20-79-3; US Department of Transportation: Washington, DC, USA, 1979. [Google Scholar]
- Schönfelder, S.; Axhausen, K.W. Activity spaces: Measures of social exclusion? Transp. Policy 2003, 10, 273–286. [Google Scholar] [CrossRef]
- Miller, H.J. A measurement theory for time geography. Geogr. Anal. 2005, 37, 17–45. [Google Scholar] [CrossRef]
- Dong, Y.-H.; Peng, F.-L.; Guo, T.-F. Quantitative assessment method on urban vitality of metro-led underground space based on multi-source data: A case study of Shanghai Inner Ring area. Tunn. Undergr. Space Technol. 2021, 116, 104108. [Google Scholar] [CrossRef]
- Sulis, P.; Manley, E.; Zhong, C.; Batty, M. Using mobility data as proxy for measuring urban vitality. J. Spat. Inf. Sci. 2018, 16, 137–162. [Google Scholar] [CrossRef]
- Yue, W.; Chen, Y.; Thy, P.T.M.; Fan, P.; Liu, Y.; Zhang, W. Identifying urban vitality in metropolitan areas of developing countries from a comparative perspective: Ho Chi Minh City versus Shanghai. Sustain. Cities Soc. 2021, 65, 102609. [Google Scholar] [CrossRef]
- Zhang, X.; Sun, Y.; Chan, T.O.; Huang, Y.; Zheng, A.; Liu, Z. Exploring impact of surrounding service facilities on urban vibrancy using Tencent location-aware data: A case of Guangzhou. Sustainability 2021, 13, 444. [Google Scholar] [CrossRef]
- Meng, Y.; Xing, H. Exploring the relationship between landscape characteristics and urban vibrancy: A case study using morphology and review data. Cities 2019, 95, 102389. [Google Scholar] [CrossRef]
- Wu, C.; Ye, X.; Ren, F.; Du, Q. Check-in behaviour and spatio-temporal vibrancy: An exploratory analysis in Shenzhen, China. Cities 2018, 77, 104–116. [Google Scholar] [CrossRef]
- Yang, J.; Yuan, M.; Yang, S.; Zhang, D.; Wang, Y.; Song, D.; Dai, Y.; Gao, Y.; Gong, J. Spatial Diffusion Waves of Human Activities: Evidence from Harmonized Nighttime Light Data during 1992–2018 in 234 Cities of China. Remote Sens. 2023, 15, 1426. [Google Scholar] [CrossRef]
- Han, T.; Yao, H.; Sun, X.; Zhao, S.; Zhang, Y. Unsupervised discovery of crowd activities by saliency-based clustering. Neurocomputing 2016, 171, 347–361. [Google Scholar] [CrossRef]
- Zhang, Y.; Liu, L.; Wang, H. A new perspective on the temporal pattern of human activities in cities: The case of Shanghai. Cities 2019, 87, 196–204. [Google Scholar] [CrossRef]
- Zhao, Y.; Chen, B.Y.; Gao, F.; Zhu, X. Dynamic community detection considering daily rhythms of human mobility. Travel Behav. Soc. 2023, 31, 209–222. [Google Scholar] [CrossRef]
- Hung, C.-C.; Peng, W.-C.; Lee, W.-C. Clustering and aggregating clues of trajectories for mining trajectory patterns and routes. VLDB J. 2015, 24, 169–192. [Google Scholar] [CrossRef]
- Yuan, G.; Zhao, J.; Xia, S.; Zhang, Y.; Li, W. Multi-granularity periodic activity discovery for moving objects. Int. J. Geogr. Inf. Sci. 2017, 31, 435–462. [Google Scholar] [CrossRef]
- Zhang, D.; Li, N.; Zhou, Z.-H.; Chen, C.; Sun, L.; Li, S. iBAT: Detecting anomalous taxi trajectories from GPS traces. In Proceedings of the 13th International Conference on Ubiquitous Computing, Beijing, China, 17–21 September 2011; pp. 99–108. [Google Scholar]
- Gonzalez, M.C.; Hidalgo, C.A.; Barabasi, A.-L. Understanding individual human mobility patterns. Nature 2008, 453, 779–782. [Google Scholar] [CrossRef]
- Song, C.; Koren, T.; Wang, P.; Barabási, A.-L. Modelling the scaling properties of human mobility. Nat. Phys. 2010, 6, 818–823. [Google Scholar] [CrossRef]
- Song, C.; Qu, Z.; Blumm, N.; Barabási, A.-L. Limits of predictability in human mobility. Science 2010, 327, 1018–1021. [Google Scholar] [CrossRef]
- Bao, J.; Yang, Z.; Zeng, W.; Shi, X. Exploring the spatial impacts of human activities on urban traffic crashes using multi-source big data. J. Transp. Geogr. 2021, 94, 103118. [Google Scholar] [CrossRef]
- Xu, Y.; Belyi, A.; Bojic, I.; Ratti, C. Human mobility and socioeconomic status: Analysis of Singapore and Boston. Comput. Environ. Urban Syst. 2018, 72, 51–67. [Google Scholar] [CrossRef]
- Li, J.; Li, J.; Yuan, Y.; Li, G. Spatiotemporal distribution characteristics and mechanism analysis of urban population density: A case of Xi’an, Shaanxi, China. Cities 2019, 86, 62–70. [Google Scholar] [CrossRef]
- Zhang, A.; Zhai, S.; Liu, X.; Song, G.; Feng, Y. Investigating the Association between Streetscapes and Mental Health in Zhanjiang, China: Using Baidu Street View Images and Deep Learning. Int. J. Environ. Res. Public Health 2022, 19, 16634. [Google Scholar] [CrossRef] [PubMed]
- Li, Y.; Yabuki, N.; Fukuda, T. Exploring the association between street built environment and street vitality using deep learning methods. Sustain. Cities Soc. 2022, 79, 103656. [Google Scholar] [CrossRef]
- Sun, J.; Jiang, Q.; Lu, C. Recursive social behavior graph for trajectory prediction. In Proceedings of the IEEE/CVF Conference on Computer Vision and Pattern Recognition, Seattle, WA, USA, 13–19 June 2020; pp. 660–669. [Google Scholar]
- Zhao, P.; Xu, Y.; Liu, X.; Kwan, M.-P. Space-time dynamics of cab drivers’ stay behaviors and their relationships with built environment characteristics. Cities 2020, 101, 102689. [Google Scholar] [CrossRef]
- Hu, X.; Shen, P.; Shi, Y.; Zhang, Z. Using Wi-Fi probe and location data to analyze the human distribution characteristics of green spaces: A case study of the Yanfu Greenland Park, China. Urban For. Urban Green. 2020, 54, 126733. [Google Scholar] [CrossRef]
- Feng, Z.; Zhu, Y. A survey on trajectory data mining: Techniques and applications. IEEE Access 2016, 4, 2056–2067. [Google Scholar] [CrossRef]
- Luo, F.; Cao, G.; Mulligan, K.; Li, X. Explore spatiotemporal and demographic characteristics of human mobility via Twitter: A case study of Chicago. Appl. Geogr. 2016, 70, 11–25. [Google Scholar] [CrossRef]
- Scherrer, L.; Tomko, M.; Ranacher, P.; Weibel, R. Travelers or locals? Identifying meaningful sub-populations from human movement data in the absence of ground truth. EPJ Data Sci. 2018, 7, 19. [Google Scholar] [CrossRef]
- De Gruyter, C.; Zahraee, S.M.; Young, W. Understanding the allocation and use of street space in areas of high people activity. J. Transp. Geogr. 2022, 101, 103339. [Google Scholar] [CrossRef]
- Williams, S.; Ahn, C.; Gunc, H.; Ozgirin, E.; Pearce, M.; Xiong, Z. Evaluating sensors for the measurement of public life: A future in image processing. Environ. Plan. B Urban Anal. City Sci. 2019, 46, 1534–1548. [Google Scholar] [CrossRef]
- Liu, X.; He, J.; Yao, Y.; Zhang, J.; Liang, H.; Wang, H.; Hong, Y. Classifying urban land use by integrating remote sensing and social media data. Int. J. Geogr. Inf. Sci. 2017, 31, 1675–1696. [Google Scholar] [CrossRef]
- Zhang, J.; Li, X.; Yao, Y.; Hong, Y.; He, J.; Jiang, Z.; Sun, J. The Traj2Vec model to quantify residents’ spatial trajectories and estimate the proportions of urban land-use types. Int. J. Geogr. Inf. Sci. 2021, 35, 193–211. [Google Scholar] [CrossRef]
- Kong, X.; Liu, Y.; Wang, Y.; Tong, D.; Zhang, J. Investigating public facility characteristics from a spatial interaction perspective: A case study of Beijing hospitals using taxi data. ISPRS Int. J. Geo-Inf. 2017, 6, 38. [Google Scholar] [CrossRef]
- Zhou, G.; Li, C.; Li, M.; Zhang, J.; Liu, Y. Agglomeration and diffusion of urban functions: An approach based on urban land use conversion. Habitat Int. 2016, 56, 20–30. [Google Scholar] [CrossRef]
- Xiong, W.; Yang, J. The Identification and Dynamics of Urban Shadow Areas from the Perspective of People Flows—A Case Study of Nanjing. Buildings 2023, 13, 2934. [Google Scholar] [CrossRef]
- Marčetić, D.; Maleš, L.; Ribarić, S. Crowd motion pattern detection at the microscopic level. In Proceedings of the 2019 42nd International Convention on Information and Communication Technology, Electronics and Microelectronics (MIPRO), Opatija, Croatia, 20–24 May 2019; pp. 1093–1098. [Google Scholar]
- Ge, W.; Collins, R.T.; Ruback, R.B. Vision-based analysis of small groups in pedestrian crowds. IEEE Trans. Pattern Anal. Mach. Intell. 2012, 34, 1003–1016. [Google Scholar] [PubMed]
- Guzman, L.A.; Arellana, J.; Castro, W.F. Desirable streets for pedestrians: Using a street-level index to assess walkability. Transp. Res. Part D Transp. Environ. 2022, 111, 103462. [Google Scholar] [CrossRef]
- Miranda, A.S.; Fan, Z.; Duarte, F.; Ratti, C. Desirable streets: Using deviations in pedestrian trajectories to measure the value of the built environment. Comput. Environ. Urban Syst. 2021, 86, 101563. [Google Scholar] [CrossRef]
- IRVIN, K. How far, by which route and why? A spatial analysis of pedestrian preference. J. Urban Des. 2008, 13, 81–98. [Google Scholar]
- Liu, Y.; Yang, D.; Timmermans, H.J.; de Vries, B. The impact of the street-scale built environment on pedestrian metro station access/egress route choice. Transp. Res. Part D Transp. Environ. 2020, 87, 102491. [Google Scholar] [CrossRef]
- Hino, K.; Baba, H.; Kim, H.; Shimizu, C. Validation of a Japanese walkability index using large-scale step count data of Yokohama citizens. Cities 2022, 123, 103614. [Google Scholar] [CrossRef]
- Sevtsuk, A.; Basu, R.; Li, X.; Kalvo, R. A big data approach to understanding pedestrian route choice preferences: Evidence from San Francisco. Travel Behav. Soc. 2021, 25, 41–51. [Google Scholar] [CrossRef]
- Yamamoto, T.; Takamura, S.; Morikawa, T. Structured random walk parameter for heterogeneity in trip distance on modeling pedestrian route choice behavior at downtown area. Travel Behav. Soc. 2018, 11, 93–100. [Google Scholar] [CrossRef]
- Niu, T.; Qing, L.; Han, L.; Long, Y.; Hou, J.; Li, L.; Tang, W.; Teng, Q. Small public space vitality analysis and evaluation based on human trajectory modeling using video data. Build. Environ. 2022, 225, 109563. [Google Scholar] [CrossRef]
- Hou, J.; Chen, L.; Zhang, E.; Jia, H.; Long, Y. Quantifying the usage of small public spaces using deep convolutional neural network. PLoS ONE 2020, 15, e0239390. [Google Scholar] [CrossRef] [PubMed]
- Chou, K.-Y.; Paulsen, M.; Nielsen, O.A.; Jensen, A.F. Analysis of cycling accessibility using detour ratios—A large-scale study based on crowdsourced GPS data. Sustain. Cities Soc. 2023, 93, 104500. [Google Scholar] [CrossRef]
- Liang, S.; Leng, H.; Yuan, Q.; Wang, B.; Yuan, C. How does weather and climate affect pedestrian walking speed during cool and cold seasons in severely cold areas? Build. Environ. 2020, 175, 106811. [Google Scholar] [CrossRef]
- Kirchner, T.R.; Gao, H.; Anesetti-Rothermel, A.; Carlos, H.; House, B. Longitudinal human mobility and real-time access to a national density surface of retail outlets. In Proceedings of the International Workshop on Urban Computing, New York, NY, USA, 24 August 2014. [Google Scholar]
- Chen, T.-Y.; Chen, L.-C.; Chen, Y.-M. Mining location-based service data for feature construction in retail store recommendation. In Proceedings of the Advances in Data Mining. Applications and Theoretical Aspects: 17th Industrial Conference, ICDM 2017, New York, NY, USA, 12–13 July 2017; pp. 68–77. [Google Scholar]
- Yang, W.; Ai, T. POI information enhancement using crowdsourcing vehicle trace data and social media data: A case study of gas station. ISPRS Int. J. Geo-Inf. 2018, 7, 178. [Google Scholar] [CrossRef]
- Chen, Y.-Y.; Cheng, A.-J.; Hsu, W.H. Travel recommendation by mining people attributes and travel group types from community-contributed photos. IEEE Trans. Multimed. 2013, 15, 1283–1295. [Google Scholar] [CrossRef]
- Liao, C.; Dai, T.; Zhao, P.; Ding, T. Weighted centrality and retail store locations in Beijing, China: A temporal perspective from dynamic public transport flow networks. Appl. Sci. 2021, 11, 9069. [Google Scholar] [CrossRef]
- McKenzie, G.; Janowicz, K.; Adams, B. Weighted multi-attribute matching of user-generated points of interest. In Proceedings of the 21st ACM SIGSPATIAL International Conference on Advances in Geographic Information Systems, Orlando, FL, USA, 5–8 November 2013; pp. 440–443. [Google Scholar]
- Frick, M.; Castro, M.C. Tobacco retail clustering around schools in New York City: Examining “place” and “space”. Health Place 2013, 19, 15–24. [Google Scholar] [CrossRef]
- Berendes, C.I. Towards analyzing high street customer trajectories-A data-driven case study. In Proceedings of the Business Information Systems Workshops: BIS 2019 International Workshops, Seville, Spain, 26–28 June 2019; Revised Papers 22. pp. 313–324. [Google Scholar]
- Santos, F.; Almeida, A.; Martins, C.; Gonçalves, R.; Martins, J. Using POI functionality and accessibility levels for delivering personalized tourism recommendations. Comput. Environ. Urban Syst. 2019, 77, 101173. [Google Scholar] [CrossRef]
- Shi, P.; Xiao, Y.; Zhan, Q. A study on spatial and temporal aggregation patterns of urban population in Wuhan City based on Baidu heat map and POI data. Int. Rev. Spat. Plan. Sustain. Dev. 2020, 8, 101–121. [Google Scholar] [CrossRef]
- Karamshuk, D.; Noulas, A.; Scellato, S.; Nicosia, V.; Mascolo, C. Geo-spotting: Mining online location-based services for optimal retail store placement. In Proceedings of the 19th ACM SIGKDD International Conference on Knowledge Discovery and Data Mining, Chicago, IL, USA, 11–14 August 2013; pp. 793–801. [Google Scholar]
- Shi, Y.; Tao, T.; Cao, X.; Pei, X. The association between spatial attributes and neighborhood characteristics based on Meituan take-out data: Evidence from shanghai business circles. J. Retail. Consum. Serv. 2021, 58, 102302. [Google Scholar] [CrossRef]
- Zheng, Z.; Zhou, S. Scaling laws of spatial visitation frequency: Applications for trip frequency prediction. Comput. Environ. Urban Syst. 2017, 64, 332–343. [Google Scholar] [CrossRef]
- Chen, L.; Lu, Y.; Ye, Y.; Xiao, Y.; Yang, L. Examining the association between the built environment and pedestrian volume using street view images. Cities 2022, 127, 103734. [Google Scholar] [CrossRef]
- Andersen, D.C. Credit constraints, technology upgrading, and the environment. J. Assoc. Environ. Resour. Econ. 2016, 3, 283–319. [Google Scholar] [CrossRef]
- Kontokosta, C.E.; Johnson, N. Urban phenology: Toward a real-time census of the city using Wi-Fi data. Comput. Environ. Urban Syst. 2017, 64, 144–153. [Google Scholar] [CrossRef]
- Traunmueller, M.W.; Johnson, N.; Malik, A.; Kontokosta, C.E. Digital footprints: Using WiFi probe and locational data to analyze human mobility trajectories in cities. Comput. Environ. Urban Syst. 2018, 72, 4–12. [Google Scholar] [CrossRef]
- Zhou, Y.; Lau, B.P.L.; Koh, Z.; Yuen, C.; Ng, B.K.K. Understanding Crowd Behaviors in a Social Event by Passive WiFi Sensing and Data Mining. IEEE Internet Things J. 2020, 7, 4442–4454. [Google Scholar] [CrossRef]
- Li, L.; Li, X.; Yang, Y.; Dong, J. Indoor tracking trajectory data similarity analysis with a deep convolutional autoencoder. Sustain. Cities Soc. 2019, 45, 588–595. [Google Scholar] [CrossRef]
- Spaccapietra, S.; Parent, C.; Damiani, M.L.; de Macedo, J.A.; Porto, F.; Vangenot, C. A conceptual view on trajectories. Data Knowl. Eng. 2008, 65, 126–146. [Google Scholar] [CrossRef]
- Chen, B.Y.; Yuan, H.; Li, Q.; Lam, W.H.; Shaw, S.-L.; Yan, K. Map-matching algorithm for large-scale low-frequency floating car data. Int. J. Geogr. Inf. Sci. 2014, 28, 22–38. [Google Scholar] [CrossRef]
- Marchal, F.; Hackney, J.; Axhausen, K.W. Efficient map matching of large global positioning system data sets: Tests on speed-monitoring experiment in Zürich. Transp. Res. Rec. 2005, 1935, 93–100. [Google Scholar] [CrossRef]
- Ahn, H.; Lee, S.; Ko, H.; Kim, M.; Han, S.W.; Seok, J. Searching similar weather maps using convolutional autoencoder and satellite images. ICT Express 2023, 9, 69–75. [Google Scholar] [CrossRef]
- Yue, Y.; Zhuang, Y.; Yeh, A.G.; Xie, J.-Y.; Ma, C.-L.; Li, Q.-Q. Measurements of POI-based mixed use and their relationships with neighbourhood vibrancy. Int. J. Geogr. Inf. Sci. 2017, 31, 658–675. [Google Scholar] [CrossRef]
- Yang, Y.; Ratkowsky, D.A.; Yang, J.; Shi, P. Effects of Plant Coverage on the Abundance of Adult Mosquitos at an Urban Park. Plants 2023, 12, 983. [Google Scholar] [CrossRef]
- Mal, H.; Yu, P.; Yang, Y.; Tao, L.; Mba, D. A Novel Grey Incidence Decision-making Method Embodying Development Tendency and Its Application. J. Grey Syst. 2021, 33, 1181899. [Google Scholar]
- Yu, P.; Yang, Y.; Ma, H.; Mba, D. Evaluation of High-Quality Development of Manufacturing Industry Using a Novel Grey Dynamic Double Incentive Decision-Making Model. Math. Probl. Eng. 2022, 2022, 1181899. [Google Scholar] [CrossRef]
- Aggarwal, C.; Ge, H.; Defo, M.; Lacasse, M.A. Hygrothermal performance assessment of wood frame walls under historical and future climates using partial least squares regression. Build. Environ. 2022, 223, 109501. [Google Scholar] [CrossRef]
- Wold, H. Soft modelling: The basic design and some extensions. Syst. Under Indirect. Obs. Part II 1982, 36–37. [Google Scholar]
- Fang, K.; Wang, X.; Chen, L.; Zhang, Z.; Furuya, N. Research on the correlation between pedestrian density and street spatial characteristics of commercial blocks in downtown area: A case study on Shanghai Tianzifang. J. Asian Archit. Build. Eng. 2019, 18, 233–246. [Google Scholar] [CrossRef]
- Yue, W.; Chen, Y.; Zhang, Q.; Liu, Y. Spatial explicit assessment of urban vitality using multi-source data: A case of Shanghai, China. Sustainability 2019, 11, 638. [Google Scholar] [CrossRef]
- Mehanna, W.A.E.-H.; Mehanna, W.A.E.-H. Urban renewal for traditional commercial streets at the historical centers of cities. Alex. Eng. J. 2019, 58, 1127–1143. [Google Scholar] [CrossRef]
- Hahm, Y.; Yoon, H.; Choi, Y. The effect of built environments on the walking and shopping behaviors of pedestrians; A study with GPS experiment in Sinchon retail district in Seoul, South Korea. Cities 2019, 89, 1–13. [Google Scholar] [CrossRef]
- Yan, Q.; Hu, Y.; Ye, H.B. Time to update China’s panda loan terms. Science 2020, 367, 373. [Google Scholar] [CrossRef] [PubMed]
- Hubbard, P. The Battle for the High Street: Retail Gentrification, Class and Disgust; Springer: Berlin/Heidelberg, Germany, 2017. [Google Scholar]


| Serial Number | Format Division | Quantity | Type |
|---|---|---|---|
| 1 | Food | 82 | Restaurant, snack, sweets and dessert, coffee shop, teahouse, and bar |
| 2 | Shopping | 52 | Store, house building materials, hotels, home appliance, specialist shops, shop, and market |
| 3 | Life service | 36 | Graphics express printing, photo studio, and lottery sale |
| 4 | Leisure | 33 | Cinema, theater |
| 5 | Tourist attractions | 26 | Art museum, exhibition hall, museum, and scenic spot |
| 6 | Public service | 12 | Public toilet, government agencies |
| 7 | Others | 19 | Clinic, drugstore, other non-commercial functions |
| Name | Length (m) | Starting Point Coordinates | Target Point Coordinates |
|---|---|---|---|
| f1 | 45.92 | 118.7827855, 32.0150326 | 118.782684, 32.0146936 |
| f2 | 50.86 | 118.7817985. 32.0138379 | 118.7813574, 32.0139388 |
| f3 | 26.18 | 118.7821165, 32.0129845 | 118.7823343, 32.0129092 |
| Variables | Condition | Connection and Algorithm |
|---|---|---|
| Dependent variables | Number of tourists | Refers to the strength of crowd trajectory clusters and reflects the intensity of the trajectory characteristics of the population. Number of tourists is the number of people performing similar activity trajectories during the study time. |
| Per capita number of stay | Refers to the intensity of spatial residence, and the intensity reflecting the characteristics of the population’s stay activity. Average number of tourists’ stay in the analysis cell. | |
| Independent variables | Spatial distance of formats | Refers to the spatial location of the format and reflects the convenience of the format to the tourists. The spatial distance of the format refers to the average distance of the road network from each entrance and exit to the format. |
| Quantity of each types of format | Refers to the intensity of format, reflects the number of visits to the format, and refers to the number of food formats, shopping formats, life service formats, leisure formats, tourist attraction formats, public service formats, and other formats. The number of formats is the number of each type of visited format in the analysis unit. | |
| Diversity of formats | Refers to the degree of format and reflects the extent to which the population is inclined to the functional intensity of the format. Diversity is calculated using the entropy method [83]. |
| Development Variables | Dependent Variables | |||
|---|---|---|---|---|
| Coefficients (Number of Tourists) | VIP Scores (Number of Tourists) | Coefficients (Per Capita Number of Stays) | VIP Scores (Per Capita Number of Stays) | |
| Spatial location of formats | −0.03 | 0.253 | 0.01 | 0.39 |
| Mixed degree of formats | −0.15 | 0.617 | 0.05 | 0.682 |
| The number of food formats | 0.16 | 0.907 | 0.31 | 0.898 |
| The number of shopping formats | 0.14 | 1.308 | 0.40 | 1.293 |
| The number of life service formats | 0.18 | 1.28 | −0.07 | 1.263 |
| The number of leisure formats | −0.01 | 0.885 | 0.26 | 0.873 |
| The number of tourist attraction formats | 0.14 | 0.953 | 0.20 | 0.962 |
| The number of public service formats | 0.21 | 1.27 | 0.22 | 1.252 |
| The number of other formats | −0.20 | 1.037 | 0.09 | 1.027 |
Disclaimer/Publisher’s Note: The statements, opinions and data contained in all publications are solely those of the individual author(s) and contributor(s) and not of MDPI and/or the editor(s). MDPI and/or the editor(s) disclaim responsibility for any injury to people or property resulting from any ideas, methods, instructions or products referred to in the content. |
© 2023 by the authors. Licensee MDPI, Basel, Switzerland. This article is an open access article distributed under the terms and conditions of the Creative Commons Attribution (CC BY) license (https://creativecommons.org/licenses/by/4.0/).
Share and Cite
Hu, X.; Ren, Y.; Tan, Y.; Shi, Y. Research on the Spatial and Temporal Dynamics of Crowd Activities in Commercial Streets and Their Relationship with Formats—A Case Study of Lao Men Dong Commercial Street in Nanjing. Sustainability 2023, 15, 16838. https://doi.org/10.3390/su152416838
Hu X, Ren Y, Tan Y, Shi Y. Research on the Spatial and Temporal Dynamics of Crowd Activities in Commercial Streets and Their Relationship with Formats—A Case Study of Lao Men Dong Commercial Street in Nanjing. Sustainability. 2023; 15(24):16838. https://doi.org/10.3390/su152416838
Chicago/Turabian StyleHu, Xinyu, Yifan Ren, Ying Tan, and Yi Shi. 2023. "Research on the Spatial and Temporal Dynamics of Crowd Activities in Commercial Streets and Their Relationship with Formats—A Case Study of Lao Men Dong Commercial Street in Nanjing" Sustainability 15, no. 24: 16838. https://doi.org/10.3390/su152416838