1. Introduction
In an era of constant change, whether planned or unforeseen, adaptability is a main factor for every system. As we navigate the major challenges of this decade that fundamentally impact both the public and industries, the concept of resilience emerges as a critical focal point. Nowadays, resilience is acknowledged by every industry as a valuable resource which deserves research and investment.
The COVID-19 pandemic serves as a stark reminder of the importance of resilience in the modern interconnected world. Especially for manufacturing industries, which trust worldwide networked supply chains, the pandemic triggered a seismic shift in consumer demand, with a surge in essentials like self-care and home office equipment, while industries like aviation and automotive faced unprecedented challenges. The global supply chains, on which manufacturing heavily relies, were severely disrupted, leading to shortages of critical resources and components.
In the wake of these transformative events, the last three years have produced intense deliberation on how to fortify socio-technical systems against crises. COVID-19 forced us to confront the vulnerability of manufacturing systems and their intricate supply chains. It revealed that changes in one part of the system can have cascading effects across the entire network. As a result, resilience, especially within the realms of companies and supply chains, has assumed unprecedented importance, as highlighted by McKinsey [
1]. These realizations have sparked a wave of research projects, such as the interdisciplinary Fraunhofer initiatives “RESYST”, “KResCo”, and “ResKriVer”, among others.
This work is aimed at a multitude of diverse audiences across multiple domains. First, it talks to researchers and scholars who deal with manufacturing, supply chain management, and resilience studies. Providing detailed insights about these topics along with an innovative assessment tool, further research in this area can be inspired. Secondly, it is pointed toward practitioners from industry and professionals, who may not yet have limpid ideas concerning resilience in the manufacturing sectors. Thanks to the introduction of the proposed assessment tool, everyone is potentially able to apply it following the thorough description of each of its steps, thus enhancing the individualization of weak points along their value chain, processes, and habits, to further improve their companies’ overall resilience score. Due to this, policymakers and industry stakeholders are affected by this work too. By understanding how resilience can first be assessed, and lately improved in a circular manner, they can think about the standardization of resilience assessment and improvement actions, fostering sustainable growth and competitiveness.
Therefore, the main objective of this work is to provide a robust and general assessment model tailored to this purpose. By deepening the discussion about manufacturing resilience, the authors aim to provide valuable insights especially for practitioners from industries.
2. State of the Art
2.1. Fundamental Research Contributons
The state of the art in research has expanded substantially over the last two decades. The key words “Enterprise Resilience”, “Resilience Manufacturing”, “Supply Chain Resilience”, and “Supply Chain Disruptions” became popular especially in the early 2000s. The first publications focused on the vulnerability of supply chains in order to counteract this from a business and management perspective. Incidents such as the terrorist attacks of 11 September 2001 highlighted the relevance of the issue and the need to face unpredictable situations. Natural disasters (Indian Ocean Tsunami 2004, Hurricane Katrina 2005, Eyjafjallajökull eruption 2010) or diseases/epidemics (SARS 2003, bird flu 2005) also drove the global attention to far-reaching consequences of these impactful incidents and to the necessity of resilience [
2,
3,
4]. Due to the criticism of the traditional risk management of companies, the first conceptual works of resilience were developed and are the reference for today’s research.
Even if the state of the literature was sparse in the 2010s, resilience is now a buzzword of our time. In particular, the assessment and quantification of resilience has moved to focus on supply chain management and economic research. Of course, the COVID-19 pandemic has also made a significant contribution to research on achieving, enhancing, and measuring resilience, and will be a key driver in the years to come [
5].
Next, an overview of the early contributions to resilience in manufacturing is presented. In 2003, Cranfield University [
6] introduced a set of recommendations for designing resilient supply chains based on four fundamental principles. These principles emphasize the importance of redundancy, flexibility, collaboration, and visibility within supply chains. By incorporating these principles into supply chain design, organizations can enhance their ability to respond effectively to unexpected disruptions. In 2004, Christopher and Peck [
7] conducted research that focused on the classification of supply chain risks and proposed strategies for designing resilient supply chains. Understanding the various types of risks that can affect supply chains is a crucial step in building resilience. Christopher and Peck’s work sheds light on the importance of risk categorization in resilience planning. Chopra and Sodhi [
8], in their 2004 study, delved into the drivers of supply chain risks. By identifying the root causes of risks, organizations can proactively prepare for and mitigate these challenges. Their research provides valuable insights into risk preparedness within supply chains. Sheffi and Rice’s 2005 research [
9] presents a framework that outlines different stages of disruption within supply chains, from the initial impact to recovery. Their recommendations emphasize the need for supply chain flexibility to effectively manage and recover from disruptive incidents. Understanding these stages is critical for developing resilient supply chain strategies. In 2007, Craighead et al. [
10] analyzed the relationship between supply chain characteristics, such as density, complexity, and node criticality, and the severity of disruptions. Their findings highlight the complex interplay between supply chain structure and resilience. Organizations can use this knowledge to tailor their supply chain capabilities to mitigate disruptions. Ponomarov and Holcomb conducted a comprehensive literature review in 2009 [
11], resulting in a conceptual framework that explores the role of logistic capabilities in supply chain resilience. This framework provides a structured approach to understanding and improving supply chain resilience through logistics. In 2010, Pettit et al. developed a conceptual framework aimed at assessing and ensuring supply chain resilience [
12]. Their goal was to achieve what they termed a “Zone of balanced Resilience”. This framework serves as a guide for organizations striving to strike the right balance between risk and resilience within their supply chains.
Following, it is worth introducing a number of works published during the COVID-19 pandemic, as it possibly boosted even more the interest in the effective handling of disruptive events. In 2020, Ivanov and Dolgui focused on modelling highly complex and dynamic supply chain networks to ensure their viability and survivability during the COVID-19 pandemic [
13]. Their research provides insights into the adaptability and resilience required to navigate the uncertainties introduced by the pandemic. Okorie et al. elaborated on the enablers and barriers of enterprise resilience during the pandemic [
14]. Their findings help in understanding the factors that impact the ability of businesses to ensure pandemic and post-pandemic manufacturing operations, offering valuable recommendations. Belhadi et al. outlined proactive and reactive strategies to enhance the resilience of global manufacturing and service supply chains, with a focus on the automotive and airline industries [
15]. Their research addressed the specific challenges posed by the COVID-19 pandemic. On this wave, Klöckner et al. [
16] explored empirical data to assess how companies reacted to the COVID-19 pandemic. They identified five main types of responses: operational, digitalization, financial, supportive, and organizational. Additionally, they suggested that the responses of companies varied in scope and angle: it has been highlighted that some of them acted as single entities, while others cooperated to achieve better results; some valuated potential while others aimed at mitigating risks. Their discussion also evaluated the reaction of stakeholders to the adoption of different types of measures. Ali et al. developed a four-square matrix of reactive strategies and associated costs to support small- and medium-sized enterprises (SMEs) coping with the pandemic [
17]. This matrix aids in decision-making and resource allocation during crises. Hobbs outlined potential long-term changes within agri-food supply chains resulting from the aftermath of the COVID-19 pandemic [
18]. This includes considerations of automation, digitalization, and infrastructure investments, which impact supply chain resilience. Kong et al. conducted a statistical evaluation of influence variables, such as the impact of deviance, diversification, and managerial power, on enterprise resilience during the pandemic [
19]. Their research provides insights into the factors affecting resilience. Wang et al. conducted an empirical study on the key factors significantly affecting the resilience of manufacturing enterprises in the COVID-19 pandemic [
20]. This study contributes to understanding the critical determinants of resilience. A more recent work provided by Sheth and Kusiak [
21], further sustain this research. As it introduces an inspirational tool for this work, the contribution of Sheth and Kusiak is discussed in
Section 2.3 (Resilience Models). Praharsi et al. presented a case study on the application and implementation of a Lean Six Sigma framework to support the resilience of shipping companies and logistics service providers during the pandemic [
22]. This framework offers practical insights for the industry. Qader et al. studied the impact of Industry 4.0 on supply chain resilience and explored how supply chain visibility influences the association between Industry 4.0 and supply chain performance [
23]. This research contributes to understanding the evolving landscape of supply chains. The study conducted by Kim and Kim [
24] aims at understanding how specific resilience factors influence the business performance of Korean venture companies, particularly in technology and finance. It identifies five key resilience factors: product structure intensity, brand strength, research and development commitment, cooperation, and corporate social responsibility. Using statistical analysis, the research reveals that these factors positively impact technology performance. Financial performance, on the other hand, appears to be positively influenced by research and development intensity and corporate social responsibility, but the role of the cooperation varies between technology and finance. Yang and Deng explored how digitalization impacts enterprise resilience for sustainability [
25]. The findings revealed an inverted U-shaped relationship, indicating that while digitalization significantly enhances resilience, excessive digitization beyond a certain threshold may hinder it. Resource allocation efficiency and information accessibility play mediating roles. Improved resilience not only benefits productivity but also promotes high-quality development in manufacturing. The impact of digitization is more pronounced in specific industries and regions, offering valuable policy insights.
Finally, Kumar et al. focused on enhancing digital resilience for small- and medium-sized enterprises (SMEs) as it plays a significant role in economic growth [
26]. It identifies ten crucial enablers for successful digital transformation in SMEs, with “management competencies” being the most vital. The research uses innovative techniques like the Delphi method, fuzzy interpretive structural modeling, and cross-impact matrix multiplication applied to classification analysis to develop a framework for digital resilience. The findings offer practical pathways for SMEs to integrate these enablers, promoting digital resilience. Although the data were gathered from a limited group of experts, this research is valuable for academics, industry professionals, and future studies in the field of digital resilience among SMEs.
2.2. Definitions of Resilience and Delimitation in the Literature
In the article “A Supply Chain View of the Resilient Enterprise”, [
9] define the concept of resilience as “the ability to bounce back from disruption”. This understanding adopted by Zsidisin and Wagner [
27], explains resilience as follows: “Supply chain resiliency consists of the ability to return to normal performance levels following a supply chain disruption”. The focus is on maintaining achievement or returning to regular performance after a disruptive event. The phrase
“bouncing back” has made an interesting contribution to the discourse on resilience (according to Wildavsky [
28]). Engineering approaches in particular have tried to capture resilience with this catchy description, not only because in materials science, resilience is defined as “the tendency of a material to return to its original shape after the removal of a stress that has produced elastic strain” [
12]. However, this approach does not go far enough for some scientists, who consider the ability to learn and adapt to be an essential part of the concept of resilience in supply chain management. Pettit et al. rightly add that “[…] it may be beneficial for a supply chain not to return to its original “shape” following a disruption, but rather to learn from the disturbance and adapt into a new configuration” [
12].
With respect to the understanding of resilient ecosystems, the authors [
11] understand supply chain resilience to be “the adaptive capability of the supply chain to prepare for unexpected events, respond to disruptions, and recover from them by maintaining continuity of operations at the desired level of connectedness and control over structure and function”. Furthermore, they emphasize that adaptability is very important for resilient value chains, as in many cases, the desired state after a disruption is different from the initial state.
Christopher and Peck arrived at an identical resilience understanding in 2004 (also based on ecosystem theory). The authors state that resilience is “the ability of a system to return to its original state or move to a new, more desirable state after being disturbed” and underline the importance of not only returning to the original state, but also being open to another improved state [
7]. Moreover, they clearly distinguish the concept of resilience from robustness, which are used interchangeably: “We have taken ‘robust’ to mean ‘strong or sturdy in physique or construction’. Here the emphasis is on physical strength […]. A robust process may be desirable, but does not itself equate to a resilient supply chain” [
7]. Although the authors do not further elaborate upon the delimitation between the two terms, it seems that they see the aspect of adaptability, agility, and flexibility as the essential difference.
The concepts of supply chain robustness and resilience appear in close connection in the publications of Vlajic et al. too. While there is no differentiation of both terms in the literature review by [
29], the authors include a contrasting meaning in their 2012 publication [
29,
30]. They see the robustness of supply networks as an important property for improving resilience [
30]. In this review paper, it is pointed out that in the scientific literature, numerous authors (e.g., [
31]) have defined supply chain robustness as the ability to maintain the existing structure, even under the pressure of an uncertain and turbulent environment: “We define robustness as a system’s ability to resist an accidental event and return to do its intended mission and retain the same stable situation as it had before the accidental event. Resilience may be defined as a system’s ability to return to a new stable situation after accidental event. As such, robust systems have the ability to resist, while resilient systems have the ability to adapt” [
31].
It becomes apparent that the return to acceptable (normal) performance level, as so-called supply chain robustness [
30,
31], is similar to the previously mentioned understanding of supply chain resilience by [
27].
To conclude, resilience is extremely intertwined with the terms of robustness, resistance, and agility, leading in two different perspectives. Both are clarified in the following subchapter.
2.3. Resilience Models
The models presented below deepen the understanding of enterprise resilience and support the development of assessment approaches.
The definition of resilience in [
11] relates to the abilities to prepare, to respond, and to recover. This means that the concept of resilience considers all stages of a crisis, i.e., before, during, and after. These different phases of resilient crisis management are approached by various models. The resilience cycle according to [
32,
33] adds two further abilities: resilience is defined as the capability to successfully prepare for, prevent, protect from, respond to, and recover from disruptions. The iterative concept is derived from the reflections of [
34] and is widely used in scholarship (e.g., Fraunhofer Institute for High-Speed Dynamics, Ernst-Mach-Institute, EMI [
35]).
The resilience of an enterprise is therefore the ability to successfully pass through these five phases repeatedly. It is apparent that resilience is a dynamic property and not a static and permanent condition that is preserved. For all phases of the resilience cycle, corresponding measures and strategies must be developed and applied. If the company successfully manages the five phases over time, this implies further development of the company. This means (similar to the bounce forward approach) the improvement of the systemic performance is being promoted.
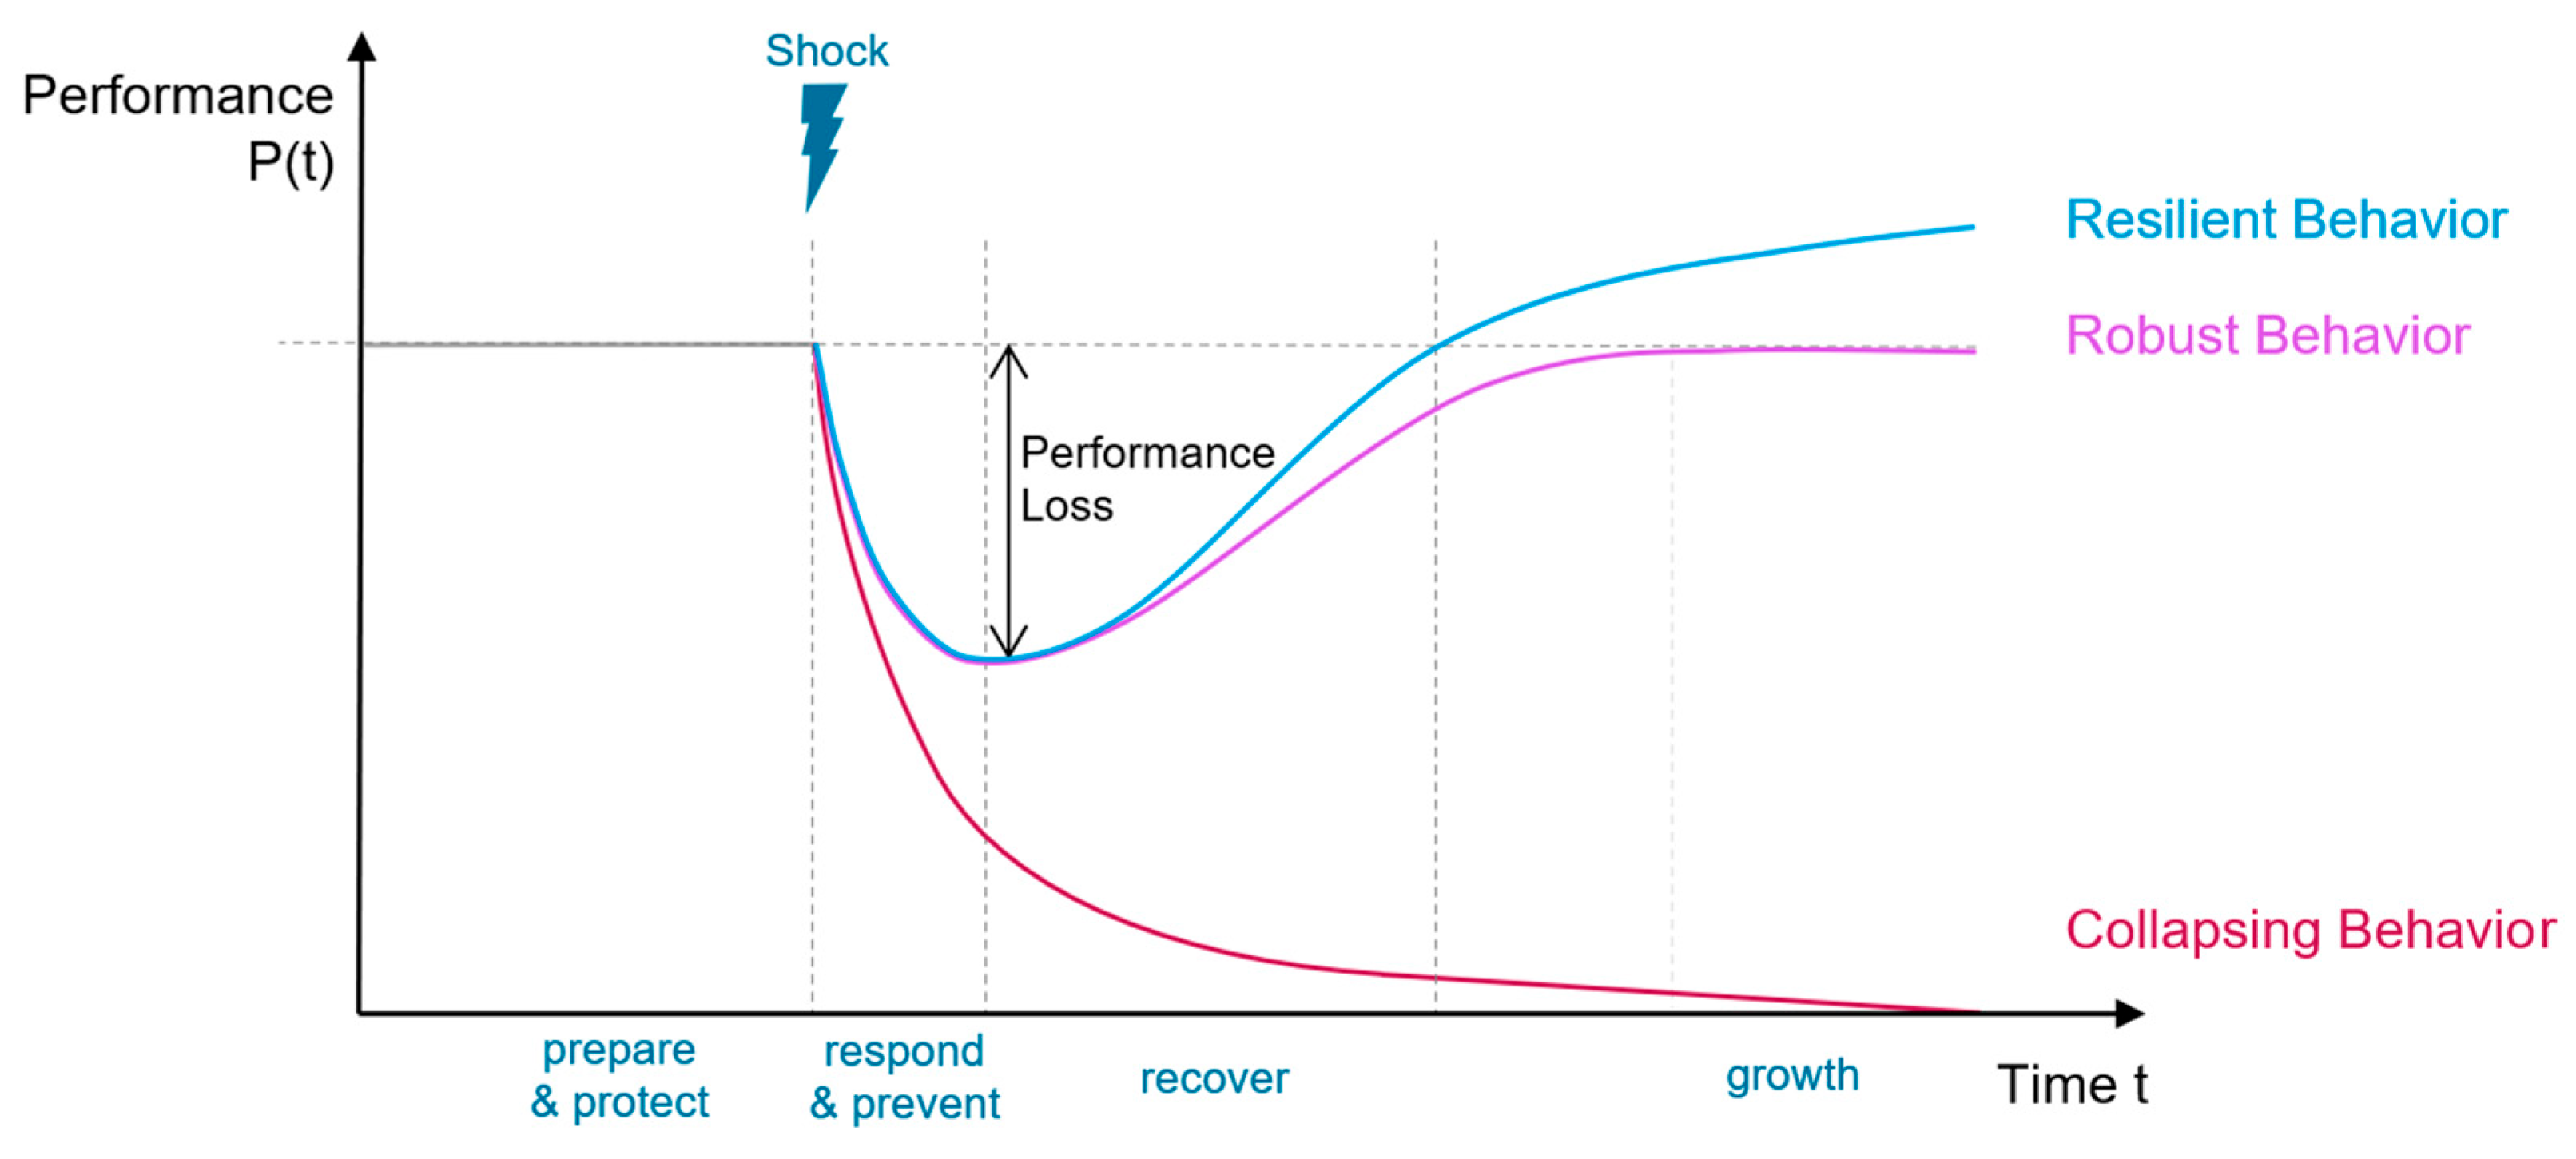
The performance curve is often used as a model to illustrate the magnitude of the risk’s negative impact and the response of resilient and less resilient systems to this [
33,
36,
37]. The different phases (from the resilience cycle) are recognizable in this illustration as well (
Figure 1).
A smoothed performance function over time can be plotted for a company’s key processes or key performance indicators (KPIs). For manufacturers, this could be the provision of produced goods, sales, customer service level, fulfilment rate, or even profits. Without interference, the performance is ideally around 100%. If a disturbance occurs, the performance can drop either suddenly or continuously over time. A reaction or respond phase follows. In the case of a system that does not collapse completely, a recovery phase carries on. The growth phase continues if the performance exceeds the previous level. All these phases progress over time. The amplitude of the performance that occurs within the reaction and recovery phase is defined as performance loss. The sum of the performance loss over time compared to the initial performance level is referred to as resilience. In other words, the smaller the sum of the loss, the more resilient the company.
This can also be seen in the comparison of the curves: a resilient behavior is characterized by a faster recovery phase. A robust system can achieve the same level of performance, while a resilient or adapted system can achieve performance growth [
33,
35].
A more organizational perspective on enterprise resilience is presented in the Resilience House Model by [
38], depicted in
Table 1. It uses the metaphors of a building by comprehending the environment and the system’s organization as foundations and pillars. Moreover, it brings six important characteristics of resilience “under one roof”. This model has similarities to the key aspects and requirements of SCRM.
Here, resilience is seen as a holistic approach, beyond the boundaries of the company. The understanding of the environment (1) and the handling of its growing complexity is to be understood as an important competitive factor. It is shown that awareness of changes is a central theme of resilience, e.g., the development toward Industry 4.0 and sustainability, political happenings, behavior of competitors, new players on the market, trends, changes in customer demands, or the identification of risks. EWS or forecasting can be useful tools for this. Furthermore, it is necessary to understand the own system (2) in order to identify vulnerabilities and to create a culture of resilience within the company. This includes the following components (3)–(6):
- (3)
Consideration of the people and employees who make a company resilient through their actions. Therefore, awareness, skills, and leadership must be promoted in the sense of resilience;
- (4)
Processes must be designed efficiently and adapted to the products and their life cycles. It becomes clear that the process of risk management is an essential aspect of resilience in this model;
- (5)
Technology and the transformation toward Industry 4.0 can help to improve resilience, e.g., by tracking and tracing logistics activities or using digital communication channels to share information;
- (6)
This information can be obtained using data analytics (whether big data or rough data) and generate value for the enterprise.
In addition, the authors name six resilience characteristics: flexibility, diversity, connectivity, knowledge, redundancy, and robustness. These (and other factors) are examined.
Assuming a manufacturing perspective in Sheth and Kusiak [
21], this work is about smart manufacturing enterprises, which are characterized by their interconnected, data-driven, and adaptive nature. The integration of information, while enhancing smartness, introduces complexity. The paper models these enterprises as complex adaptive systems with resiliency as a crucial property. Resiliency, in this context, entails the ability to understand risks comprehensively and to adapt to changes, with information integration playing a pivotal role. The systematic literature review conducted by Sheth and Kusiak reveals that the current perspectives on manufacturing resiliency often overlook enterprise-wide risks unique to smart manufacturing. To address this gap, the paper presents a five-part framework that organizes key risk sources, encompassing the external and internal environment, manufacturing processes, technology, and demand–supply networks. The role of integrated information in mitigating these risks is also discussed for each source. The paper highlights the complexity within logistics and advocates for a complex adaptive systems (CAS) view to navigate this intricacy effectively. As a model, they proposed the so-called “Integrated Lens on Smart Manufacturing Resilience”. The proposed model serves as an initial road map, to observe resilience in a smart manufacturing environment in a systematic way and to contextualize different sources of risk. The model is composed of five sections, each regarding one of the possible sources of risk that have been identified through a systematic literature review: (1) the external/operating environment; (2) the internal/enterprise environment; (3) manufacturing processes; (4) technological advancements; and (5) demand–supply networks and people’s role. The framework serves as a contextual tool for mapping specific risks to corresponding facets within smart manufacturing, encompassing various physical and cyber assets. This approach is crucial as risk events serve as primary drivers of consequences, perturbing the CAS. When utilized in this manner, the model generates a comprehensive and integrated perspective on resiliency.
The model presented by Sheth and Kusiak, together with their research on the identification of resilience attributes and risks, represent a valuable starting point for the generation of a resilience assessment tool.
2.4. Resilience and Sustainability
With respect to a “VUCA” environment, there is strong interest for companies to become more resilient, but at least as much as to become more sustainable. Both aspects are necessary in order to create value and to be profitable in the long term. Therefore, the aim of this chapter is to investigate the link between resilience and sustainability in terms of manufacturing. This is characterized by a loop that involves the capacity to absorb, recover, strengthen and adpt in face of disruptive events to build resilience, and the capacity to preserve and strengthen the involved system is a sustainable manner over time.
Firstly, the term should be clarified. A common definition of sustainability goes back to the 1987 report by the United Nations Brundtland Commission and describes a sustainable development as
“meeting the needs of the present without compromising the ability of future generations to meet their own needs” [
39,
40]. Accordingly, the key statement on sustainability is to ensure the satisfaction of concerns in the long term, considering the principles of economically efficient, socially balanced, and ecologically compatible actions. The so-called triple bottom line, i.e., sustainability in the sense of profit, people, and planet, is a widely adopted, integrated framework. Sustainability means ensuring recovery from current and future disruptions through continuous improvement. This underlying principle meets with the understanding of resilience since a lack of resilience causes vulnerability in the long term. The inability to regenerate from long-lasting or repeated disruptions leads to the gradual decline of a system. If a system is less resilient, the process of recovery will be more (resource-) costly and inevitably expensive, i.e., not sustainable.
According to different authors, resilience can therefore be considered as a prerequisite for sustainability in the current turbulent environment [
41,
42,
43,
44,
45]. Other scholars like [
46] or [
2] see sustainability as a key enabler for resilience. However, according to the definition above, it can be argued that sustainability works at a higher level than resilience and serves as a future-oriented guiding principle when building resilience [
47].
Similar to resilience, sustainability is not an achievable end state, but is a fundamental property of dynamic and evolving systems. Resilience and sustainability both result from constant adaptation to changing conditions, ensuring the growth of the company and offering long-term competitive advantages for manufacturing enterprises.
“Any company that can make sense of its environment, generate strategic options, and realign its resources faster than its rivals will enjoy a decisive advantage. This is the essence of resilience. And it will prove to be the ultimate competitive advantage in the age of turbulence where companies are being challenged to change more profoundly, and more rapidly, than ever before” [
41].
Building enterprise resilience is therefore very promising within the framework of sustainability. The economic, ecological, and social aspects must be considered simultaneously and seen as interrelated.
2.4.1. Enterprise Resilience in an Economically Sustainable Manner
The actions and strategies adopted for enhancing resilience need to be analyzed in terms of their cost–benefit ratio. On the one hand, protecting a company from all risks is not possible. On the other hand, resilience modalities and mitigation strategies need to be profitable, in order to be beneficial in the long run, otherwise it becomes ineffective [
36]. The work by [
12] describes this as a
“Zone of un-balanced resilience”, in which an excessive use of capabilities relative to vulnerabilities will erode the profitability (
Figure 2). Nevertheless, assessing resilience-building measures purely in monetary terms (e.g., amortization) is not useful, because neither any alleged risks that have been prevented nor any damage impact that has been mitigated are known in retrospect. As in other sustainability considerations, a purely economic view does not lead to the desired results.
After all, available financial resources are a crucial indicator of resilience. Especially in disruptive situations, finances and capital
“can act as a buffer or shock absorber against the impact of a crisis when providing immediate and adequate insurance” [
20]. Major inventions (e.g., in technologies and digital solutions) can provide far-reaching benefits, especially in a long-term perspective, in order to stand out from or keep up with competitors in the market.
2.4.2. Enterprise Resilience in an Ecologically Sustainable Manner
Resilience is related to the changes and uncertainties of an enterprise environment, including the nature or the ecosystem. To guarantee their future marketability, companies need to be resilient in order to cope with climate change, natural disasters, extreme weather events, or pollution. The importance of transitioning the industry into green production is reflected in the current political debates, e.g., political negotiations in Germany (after the election in September) or the UN Climate Change Conference 2021 in Glasgow. Policies can be a significant driver for enterprises to become resilient through regulations or restrictions (the use of certain materials or CO2 emissions), mandatory sustainability reporting, etc. In conclusion, resilience in an ecologically sustainable manner includes a careful usage and utilization of resources, climate-neutral and emission-reducing procurement as far as possible (regional sourcing, transport load), and a sensible consumption of energy (transition to renewable energy sources).
2.4.3. Enterprise Resilience in a Socially Sustainable Manner
As companies are socio-technical systems, their resilience ought not only to be based on technical aspects (as performances and capacities), but also take into account the human aspect [
35]. Therefore, understanding the resilience concept based on sociology and psychology is advisable. A qualified and resilience-oriented leadership contributes toward the development of innovation, adaptability, and knowledge [
48]. Moreover, negative effects of (economic) crises can be significantly mitigated by a resilient leadership and workforce [
49,
50]. Resilience might further be understood as an employee soft skill or expertise in responding to unexpected situations. Accordingly, motivation, inclusion of employees in resilient decision-making, communication, cooperation, and training are key elements of enterprise resilience too [
38,
51,
52].
2.5. Identification of Resilience Factors
Despite the extensive and theoretical scientific research on resilience, it is so far rarely understood how extreme events are handled resiliently. For this reason, many publications elaborate on the properties or capabilities of resilient systems and enterprises.
The majority of resilience frameworks presented in the literature commonly oppose two sides: a group of diverse resilience attributes minimize another group of different disruptive factors, barriers, or vulnerabilities. Vulnerability is often understood as the opposite of resilience (cf. e.g., [
53]). Thus, a high level of vulnerability may indicate low resilience; however, a contrary relationship cannot be established. On the other hand, there are the characteristics or capabilities of resilient systems and companies that are summarized in this discussion as resilience factors. Although these factors clearly differ in their naming and frequency of reference in the scientific literature, all of them are characteristics of a system’s resilience or capacities to promote resilience. The following designations appear in scientific publications from the past and the present decade:
The reason for summarizing these as RFs lies in the fact that the same terms appear in different designations. Furthermore, different scholars describe strong interrelationships and mutual dependencies between the terms. Some factors indirectly affect the improvement of enterprise resilience through the strengthening of other factors. Therefore, no clear and correct classification as “enabler of resilience”, “critical factor”, or “resilience success factor” can be made in this article.
The exploratory analysis involved the identification of thirty (most frequently mentioned) resilience factors from a total of eight selected sources. The bundled factors are listed in the table below, whereby synonymous terms (e.g., “Adaptability”, “Adaption”, or “Adaptive Capacity”) or very closely related terms (e.g., “Finances”, “Financial Strength”, “Investments”) were listed and counted only once.
The selection of literature sources used for the exploratory analysis of resilience factors is based on the following rationale:
The conceptual framework by [
12] is much addressed in resilience research and
“has been recognized as the most cited [paper] of the decade [in the publishing journal]” [
56]. The total of 14 mentioned capability factors are based on the discussion with focus groups and on other fundamental literature;
The
Top Ten Enablers compiled by [
2] are based on several literature references and a survey (Delphi method) of experts from the industry and academics. The authors also analyze the interconnections and relationships between these enablers;
The six characteristics belonging to the presented Resilience House Model were elaborated by [
38] through reviewing the literature (from four reputable electronic literature databases) and interviewing fifteen experts from European manufacturers and consultancies;
Biedermann’s book published in 2018 reviewed in detail the characteristics of a resilient supply chain in the literature from 2003–2016 and summarized 17 success factors [
55];
Ref. [
14] focuses mainly on resilience in the aftermath of the coronavirus pandemic. They identified 16 enablers mainly through examining the literature from 2020 (with respect to the impact of the COVID-19 pandemic) and confirmed them through a survey of 71 manufacturers and manufacturing-related services, like consultancies or supply chain professionals;
Additionally, through an extensive literature review of 21 sources (from 2004–2019) and with reference to 12 industrial sectors, ref. [
57] developed a vivid overview table of resilience engineering indicators;
Ref. [
54] aimed to explore the relationships between different resilience capabilities, especially for the fashion industry and its highly interconnected and highly vulnerable supply chains. The elaboration of these factors is also based on a comprehensive review of the literature by 24 scholars (published between 2004–2020);
The paper
“Critical Factors Affecting the Enterprise Resilience in COVID-19 Crises” [
20] aims to empirically examine the key resilience factors for Chinese manufacturing enterprises. Therefore, the authors have formulated five hypotheses based on the results of a literature analysis, which was to be confirmed by a questionnaire sent to over five hundred companies.
Through the selection of these eight publications, resilience factors could be identified on a very broad data basis. Overall, the literature review indicates that various scientific papers list a large number of criteria, some of which contain very elastic and general terms. This inconsistency may result from the fact that (enterprise) resilience depends on individual factors and characteristics. A “one-size-fits-all” approach will not work for the majority of manufacturers or their supply chains in practice. Instead, the resilience strategy must be optimized to the specific environment of the company. In this context, it is also important to find out which are the most promising factors and how they are mutually dependent. For this reason, a survey was conducted within this work.
In order to reduce the number of different factors and due to strong coherences, the 30 RFs were clustered according to similarities and affiliations as follows in
Table 2. The table presentation hereafter of factors was based on the tabulation of [
54,
57]. A blue label (
x) means that the factor is listed by name in the authors’ selection of resilience factors, while a green label (
x) means that the term is mentioned indirectly or is found in the description or as a sub-factor of a related term.
Throughout the explorative analysis, it was apparent that a wide range of criteria and factors are named to describe resilient enterprises (and supply chains). Among this variety, thirty factors have been identified from a total of eight selected sources. All used publications named various (partially very similar) factors. All reflections are based on extensive literature reviews of numerous publications and/or interviews with representatives from the industry, consulting, or academia. Therefore, all the RFs determined through the literature study are based on a considerable database.
In a further step, closely (content-) related factors were clustered. Ten relevant RFs were found (
Table 3).
To further inspect the perception of the 10 RF clusters listed above, an exploratory survey was conducted. For this purpose, a questionnaire was created in order to ask industry experts to evaluate the relevance of all 10 factors. The questionnaire was sent to 26 manufacturing enterprises. A total of 10 companies were successfully surveyed, partly in semi-structured interviews based on the questionnaire. The questionnaire includes two questions on each of the ten resilience factors. The first question (Q1) aims to determine the importance of the factor for resilience from the perspective of the company representative. For this purpose, a corresponding statement had to be made on a 5-point Likert scale (from “1—least important” to “5—extremely important”). In addition, a brief explanation could be added in the comment field. The chosen uneven scale, which is typical for surveys, has a mean value. This allows the participant to be neutral about a certain item. Otherwise, an even scale would have the advantage that a concrete preference or trend must be given. Since this analysis was concerned with the relevance of a factor ranging from least imponent to most important, a 5-point scale was suitable. The second question (Q2) was intended to find out whether a consideration of dealing with a certain factor (e.g., intentional improvement) has supported the company in coping with the recent COVID-19 crisis in a more resilient way. For this purpose, participants were asked to choose between four options on a nominal scale. Again, the answer could be supplemented by a comment. With the help of this question, a practical benefit of the resilience factor with regards to a real crisis could be ascertained.
Figure 3 shows the distribution of the given answers to Q1, with regards to the importance of the top 10 resilience factors in general. It is remarkable that none of the respondents considered any of the stated factors to be “least important” (1). This is a preliminary confirmation that the elaboration of the top 10 factors through the literature and clustering did not lead to unnecessary or invaluable clusters.
Figure 4 shows the distribution of the given answers to Q2, asking whether a concrete adaptation or consideration of the resilience factors leads to a more resilient handling of the impacts and consequences of the COVID-19 pandemic.
Four out of the ten factors were not considered at all by the companies surveyed. According to the given comments, one reason why there was no consideration stated was that the property was already pronounced before the coronavirus pandemic (e.g., “We already had fast production and delivery times”). In terms of organizational structures and employee involvement (RF 8), a more expedient, quick, and practical form of decision-making was needed during the crisis. In some cases, employees had difficulties adapting to new situations. Isolation and new conditions at home offices were frequently quoted as being relevant in the last months. In particular, a solid exchange and collaboration with partners (RF 9) contributed a lot to enterprise resilience, especially in new working environments like home offices: “Since COVID, we have been working together with competitors.” Internal communication (covered by RF 7, 8, and 10) became a key aspect as well, even if setting up new information technologies (RF 7) required a relatively high level of effort to create new secure systems that allowed employees to carry out their work.
Flexibility aided (at least in part) all the interviewed companies in coping with the pandemic more efficiently. Short-term operations and securing supplies (RF 1 and 2) were far more crucial than purchase prices. Moreover, redundancies and increased stock levels (RF 5), and a greater degree of flexibility in deviating from the usual production strategies helped. Independence from suppliers (e.g., through diversified procurement or in-house resource production) would have particularly contributed to flexibility and resilience.
3. Development of a Circular Resilience Assessment Tool for Manufacturing Enterprises
As the title implies, the goal of this work is to provide a practical assessment model for manufacturing companies. The previous chapters have underlined the multi-faceted nature of the concept of resilience. Various factors influencing the resilient behavior of companies were identified. The new assessment method aims to incorporate all these findings to accompany resilience as a dynamic process. Therefore, a holistic assessment could be grounded on the resilience abilities of absorbing, reacting, adapting, regenerating, improving, and growing. As discussed in the previous chapter, the assessment methods presented in the literature have their respective drawbacks, regarding pre- or post-crises management. A new approach, combining quantitative and qualitative approaches, could help to prepare adequately for disruptions, as well as to draw better conclusions for future improvement in the aftermath of crises.
Figure 5 illustrates a four-step Circular Resilience Assessment Tool (CRAT), based on the five phases according to the resilience cycle by [
33].
The purpose of the proposed CRAT model is to assess enterprise resilience not in a detached process but rather built into the existing structures and management systems of a company. Important management systems and the corresponding standardization include:
Quality Management System (QMS), ISO 9001 [
58];
Costumers Relationship Management (CRM), ISO 9001 [
58];
Content Management System (CMS), ISO 26531 [
59];
Compliance Management System, ISO 37301 [
60];
Business Continuity Management, ISO 22301 [
61];
Occupational Health and Safety Management, ISO 45001 [
62];
Environmental Resource Management System, ISO 14001 [
63].
The four steps of the CRAT model are outlined in the following subchapters.
3.1. CRAT Step 1—Risk and Vulnerability Assessment
As already discussed in the theoretical background, the concept of resilience complements the handling of known and assessable risks, which are captured and assessed by the risk management system. This includes the identification of risk sources. A traditional risk management system within the company (and along supply chains) is therefore required as the first step in the CRAT Model. The assessment of risks and vulnerabilities is only one step of the risk management procedure presented, which in turn includes:
Risk management commitment;
Risk identification;
Risk clustering;
Risk assessment and rating (including risk aggregation);
Development of risk strategies;
Risk control.
The risk management process itself is designed as a control loop wherein the steps (1–6) are performed repeatedly and a risk strategy is continuously developed [
64]. Since the CRAT model is designed as a cyclical process, the risk assessment is intended to continually evaluate and anticipate newly emerging risks, for example through newly implied measures. This refers in particular to those risks which arise through the use of IT. According to the Alliance Risk Barometer cyber incidents, data protection breaches and IT failures belong to the major business risks of manufacturing enterprises [
65].
The risk assessment and management process can be seen as an effective mechanism to control the causes and effects of risks and disruptions, but it does not prevent the occurrence of all risks, nor does it prevent all possible impacts. Resilience as an overall concept therefore contributes to a more long-term protection. For this reason, the following three steps are included in the CRAT.
3.2. CRAT Step 2—Qualitative Resilience Factor Assessment
In order to aid enterprises to evaluate the actual level of resilience, the second step includes a qualitative assessment of the top 10 RFs.
The proposed
Assessment Checklists comprises
Table A1,
Table A2,
Table A3,
Table A4,
Table A5,
Table A6,
Table A7,
Table A8,
Table A9 and
Table A10. Eight statements (inspired by the SCRAM tool by [
66]) are to be assessed for each RF. The statements are generally framed in positive terms, meaning that an agreement on them implies a resilient position of the company. The statements are assessed on an ordinal scale with a total of six options. The assessment scale (
Table 4) is based on a typical 5-point Likert scale ranging from 1 (full disagreement with the statement) to 5 (full agreement with the statement). In this way, a mean or neutral evaluation (3) of the statement is also possible. Null is to be considered separately and represents the valuation if no statement can be made about the phrase to be evaluated. The numerical rating allows the summation of a total score for each RF, which assists in the analysis of the results of the qualitative assessment.
The statements and checklists were developed on the basis of the entire explorative research study on resilience, in particular using the eight references on the resilience factors and the results of the confirmatory analysis. A verification of the appropriateness of the assessment checklists was not possible within this article.
The proposed statement checklists are recommended to be supplemented individually (e.g., increased to 10 phases per RF) to generate a more accurate assessment for the company concerned. The ambition for a (future) practical application of the CRAT model should be to create a tailor-made assessment for different manufacturing enterprises. Once a statement is made about employees or workers, it is up to the evaluating company to assess which employees these qualities apply to and which ones they do not.
In order to evaluate how resiliently an enterprise performs, the individual ratings are summed up to a (absolute) total score of each single RF. For the eight statements, ratings between 0 and 5, with a minimum resilience score and a maximum resilience score , are possible. Likewise, a relative value can be calculated as a percentage (min. ); (max. ).
Further, a prioritization of individual resilience factors through (normalized) weighting is possible. In this way, the determination of the resilience score can be adapted more precisely to the requirements and premises of the company. Otherwise, without applying a specific weighting, the 10 RFs are taken equally into account (10% each) in the overall average resilience score .
Companies should aim for a relative resilience score of 100%, within the individual resilience factors, but also in the overall average score. In a similar way to a school grading scale, the scores might be interpreted as:
| 90–100% | → | particularly resilient; |
| 75–89% | → | resilient; |
| 50–74% | → | poorly resilient; |
| >50% | → | insufficiently resilient. |
The results of the qualitative assessment can be clearly illustrated by a radar chart (“spider graph”). This chart allows us to plot and compare all the top 10 RFs. The data sets of different CRAT cycles (annual) can be displayed on top of each other for a better and clearer visualization of the improvements or deteriorations (cf. blue and yellow graphs in figure).
Table 5 and
Figure 6 represent an exemplary result. Fictitious values of any enterprise serve the purpose of demonstrating how to evaluate and interpret the qualitative assessment.
With an , this enterprise would be rather poorly resilient, although it would have improved by +3.3 percentage points compared to the (fictitious) previous period. The radar chart further reveals the main areas in which the company needs to take action for improvement. For the presented fictitious enterprise, especially the RFs 3 (Adaptivity), 2 (Flexibility), and 7 (IT and monitoring) were rated rather insufficient or poorly. Methods and strategies to improve these points will be presented in a “catalogue of measures” in the next CRAT step and ought to be implemented in the company.
A weakness of the quantitative assessment can seen in the adequacy or fit of statements (and RFs overall) to the company to be scored. If the statements are irrelevant for the enterprise, then it will underperform according to the presented calculation of the resilience score. One possible solution would be to leave the scale factor as null (no statement possible), so that it is entirely unaccounted when calculating a cumulative relative score. The following example intends to clarify this matter, showing the evaluation for RF 1 of the fictitious company (
Table 6). In the first version (i), the value of 0 for statement 6 is included, resulting in a relative score of
. In the second version (ii), statement 6 is omitted, resulting in a score of
, for RF 1.
The assessment tool can be further adapted to the specific demands of the different companies in this way. Nevertheless, it is recommended to replace inappropriate statements in the checklists with suitable ones.
3.3. CRAT Step 3—Recommended Strategies
The next step of the CRAT model is intended to support enterprises in improving the resilience factors assessed in the previous step. Therefore, an exemplary catalogue of proposed strategies, methods, digital applications, and further approaches should be formulated in step 3 of the CRAT model. It can be advised that a different set of recommendations should be provided to address different scenarios and to better suit the characteristics of a company. For this reason, the development of a holistic set of guidelines that encompasses all possible cases is out of the scope of this work and will be successively studied as a consequence of this discussion. In general, it is suggested, similar to the second CRAT step, to continuously adapt and supplement the catalogue of measures in line with the company to be assessed.
The catalogue of measures is intended to highlight both the technological and organizational aspects. Thereby, the mentioned aspects of sustainability should be incorporated too. In addition, possibilities for automation and digitalization should be listed. Technologies and applications associated with Industry 4.0 are becoming more imponent in production and manufacturing in general and can contribute significantly to achieving resilience, notably:
“Performance and risk management, as well as resilience and agility require the inclusion of higher added value enablers, such as AI, IoT, simulation […] on top of others” [
67].
This work neither provides any guidance for a concrete implementation of the presented methods, nor does it elaborate further on them. Furthermore, the financial aspects (possible costs, cost–benefit ratio) are not taken into account here.
3.4. CRAT Step 4—Quantitative Performance Assesment
The final step of the CRAT envisages calculating the resilience index according to Equations (1) and (2). This way, after a crisis or disruption is overcome, it is possible to quantitatively assess how resilient the system behavior was and how effectively the implemented actions (step 3) have improved resilience. Conclusions can be drawn for future crises and disruptions.
KPIs are particularly suitable for a quantitative assessment of resilience. With an appropriately selected KPI, a performance curve along the lines of
Figure 1 can be displayed if the corresponding values are collected over a certain period. Generally, KPIs describe different relevant metrics to measure the performance of activities in the company. To achieve strategic corporate goals, these should be monitored and visualized, e.g., with the help of a balanced scorecard. KPIs differ according to the business department and the industry sector. Logistics key figures inform about transport processes, storage operations, and supply chain processes (delivery time, inventory costs, inventory turnover rate). Customer service KPIs are helpful to evaluate the overall performance of the after-sale department and to sustainably increase customer satisfaction through process optimization (service level, net promoter score, customer effort score). Indicators in sales provide valuable insights into various aspects of the sales process to analyze the sales funnel (turnover growth, customer lifetime value, sales opportunities). Production KPIs allow manufacturers to monitor their production quality and costs [
68]. For the fourth CRAT step, special attention should be paid to these ones. In addition to temporal production indicators (lead time, set-up time share, downtimes), which are related to utilization and machine availability, the production outcome is central. The production rate (throughput) is certainly the most important KPI for manufacturing enterprises. It provides information about the utilization of machines, the current and optimal production level, and the proportion of defect-free products in the total production. Closely related is the so-called right first time, meaning the proportion of manufactured products passes internal quality control without defects at the first attempt.
The production rate is recommended in this work as an indicator to assess and measure the level of resilience (of manufacturing companies) subsequent to a disruption or crisis. In this way, negative impacts (performance or production loss) of disruptive events can be identified and conclusions drawn. Observing performance curves over medium and long-term periods and comparing different crises can then visualize an improvement (or deterioration) of the enterprise’s resilience.
4. Discussion
This work presents a novel assessment tool for the resilience of manufacturing enterprises using a combined qualitative and quantitative approach. The CRAT model is based on the current state of research and incorporates various factors that are significant for enterprise resilience. These resilience factors were elaborated through substantial literature research and confirmed by industry representatives.
Considering the work of Sheth and Kusiak [
21] as a starting point for the model, the authors propose in this work that remarkable differences can be highlighted. Mainly, the work proposed by Sheth and Kusiak is said to be a roadmap, in as much as it provides a point of view about the contextualization of risk sources; however, it fails to provide a way to measure and evaluate the resilience of a manufacturing company. Additionally, it has a strong focus on logistics functions within the manufacturing environment. The work proposed in this article aims to expand these findings, by providing a dedicated assessment tool, aimed at estimating the quality of resilience characterizing a manufacturing enterprise.
The multi-step assessment process offers technical and organizational guidance for improving resilience in the long term. Therefore, the CRAT is intended to initiate a systemic transformation process, due to its circularity and recommendation to repeat the steps. The four steps are aligned with the model of the resilience cycle by [
33], as shown in
Figure 7. Hence, the CRAT approach is designed to support manufacturing enterprises before, during, and after a disruptive event. Step 1 can be allocated to the prepare phase, while step 2 to prepare and prevent. Both aim to draw attention to weak points before incidents or adverse events occur. Only in this way is it possible to initiate targeted and effective improvement measures. A catalogue of measures is provided in step 3 (prevent, protect, respond, and recover phases of the resilience cycle). This listing is designed to encourage companies to develop an individualized action map over time. The proposed key points are only meant as a guideline or starting point to strengthen capacities to absorb, adapt, and restore enterprise performance. The quantitative performance assessment is supposed to close the circle between the recover and prepare phase, to review and learn from the effectiveness of the strategies. Nevertheless, all steps do overlap and do not necessarily have to be followed in sequence; rather, it is more a matter of an evolving assessment process.
The continuous improvement process resulting from the assessment model is closely reminiscent of the PDCA cycle (plan–do–check–act) according to [
69]. As the entire work aims to illustrate that resilience permeates all areas and processes within the company, so the CRAT does. The goal is not to be resilient, but to continuously become more resilient in a constantly changing “VUCA” environment. The model is devised to engage enterprises acting proactively before the need for change becomes inevitable.
In addition to the more apparent technical aspects and measurable business indicators, the CRAT also takes into account that softer aspects (people, organizational structure, and culture) can make a significant contribution to resilience. Authors like [
45] already pointed out that other assessment methods did not pay enough attention to the communication with SC partners and the establishment of a culture of change and resilience. With respect to this, the proposed tool should be applied across the organizational boundaries,
“as resilience to supply chain events is commonly the outcome of interactions amongst multiple actors in the network” [
56,
70].
The entire model has been developed in a very generic way, applicable to a wide range of manufacturing companies. At the same time, the assessment tool will not fit the purposes of any enterprise. In particular, the checklists in step 2 do not make special distinction between sectors, industries, or company size. A more in-depth analysis (e.g., with the help of focus groups) of differentiated resilience factors for companies with diverse requirements or even different financial preconditions has not been done in this work. One the one hand, the above-mentioned criticism that assessment models are only useful if they are tailored to a specific system for concrete circumstances does extend to the CRAT. On the other hand, authors like [
71] affirm that
“a generic method is missing, that offers the self-assessment of organizational resilience and that is also applicable […] for industry, SMEs and other organizations. […] most of the tools are very specialized and hence not customized for others”. The CRAT aims to fill the gap between these two views.
Beyond the most acknowledgeable exploitation of the CRAT model to comprehensively evaluate manufacturing companies’ resilience and pinpoint vulnerabilities, its applications can vary for different departments of a company or can have different implications throughout the entire product life cycle. For example, the CRAT model can be employed to assess and bolster the resilience of entire supply chain networks. Empowering a collaborative approach enables manufacturers to work closely with suppliers and partners to identify weaknesses and collectively develop strategies that ensure uninterrupted material flow and production, even in the face of unforeseen disruptions. Innovation and product development are also vital in manufacturing. The CRAT model can assist in evaluating the resilience of innovation pipelines, identifying bottlenecks, and enabling companies to introduce new products more efficiently, while remaining adaptable to evolving market conditions. Operational resilience, including the robustness of manufacturing processes and equipment, can be assessed and improved using the CRAT model. Manufacturers can ensure their operations can adapt swiftly to fluctuations in production demands. In addition, a resilient workforce is crucial to manufacturing success. The CRAT model can be applied to evaluate the adaptability of the workforce, their response to crises, and their ability to maintain productivity in challenging situations. Risk management is another key domain where the CRAT model proves valuable. Manufacturers can identify and mitigate operational risks proactively, helping to safeguard their operations against disruptions. Strategic planning can benefit from the insights provided by the CRAT model too. By assessing resilience and recognizing areas for improvement, manufacturers can align their long-term strategic goals with their ability to adapt to changing market dynamics and external factors. Quality control and compliance are paramount in manufacturing. The CRAT model can be applied to assess the resilience of quality control processes and compliance mechanisms, ensuring that products consistently meet customer expectations and regulatory requirements. Sustainability initiatives are integral to modern manufacturing practices. Manufacturers can employ the CRAT model to evaluate the resilience of their sustainability initiatives, ensuring they can withstand environmental and regulatory changes while remaining committed to sustainability goals. Lastly, the CRAT model fosters a culture of continuous improvement within manufacturing enterprises. By regularly assessing and reassessing resilience, companies can adapt to evolving challenges and remain competitive in the dynamic manufacturing landscape.
Future work should focus on improving and developing risk quantification approaches to reduce variability in the estimation of probabilities and impact values.
The offered qualitative self-assessment has the disadvantage of subjectivity and the possibility of bias between the assessor’s understanding of the enterprise’s resilience and the actual status, which is also driven by a “VUCA” business environment. For this reason, an actual-target comparison (e.g., with the help of step 4) is necessary.
A further limitation in the proposed model is that it requires analogue processing and is not designed as a digitalized algorithm or software application. This proposal, as well as other areas for further research and elaboration, can be highlighted.
Upcoming research could elaborate on the resilience factors more profoundly, for example, through a statistically relevant survey design, to adjust the given statements in
Table A1,
Table A2,
Table A3,
Table A4,
Table A5,
Table A6,
Table A7,
Table A8,
Table A9 and
Table A10. Future studies have to examine the interrelationships and correlations between the RFs. As influencing factors (RFs) affect each other, a network analysis, sensitivity analysis, or regression analysis are advisable. To compare the RFs in a cross-impact matrix (or -analysis) would help to determine the active and passive influences between them (see the methodology of [
2]). Existing correlations of the top 10 RFs can be analyzed more precisely in this way (in comparison to the presentation in
Figure 7). These findings would reveal better the correspondence between different resilience factors (assessed in step 1) and the actions needed to be taken (step 3).
Another limitation of the CRAT model is the disregard of financial and liquidity perspectives. Economic aspects need to be taken into account, especially if the medium and long-term added value of investments in resilience measures are to be demonstrated. This applies in particular to cost-intensive high-tech applications. A decision has to be made between economically viable measures and unprofitable ones [
35]. For this reason, it is recommended that the third and fourth step be accompanied by a cost–benefit analysis and a multi-dimensional decision-making process from an economic point of view. Resilience-enhancing activities or strategies and their investment require a cost-effective trade-off, as [
12] shows in the
“Zone of balanced Resilience”, not least in order to create acceptance within the management of a company.
The practical application of the assessment model was not realized or tested within this discussion. A large-scale implementation is necessary to validate the CRAT model in practice and the daily business of manufacturing enterprises. Within an application study, the qualitative assessment based on the presented checklists and its measurement scales must be tested. To show (in
Figure 7, step 2) an actual comparison between the resilience scores of a chosen period and a prior period would not have been feasible in the time frame of this discussion anyway. Following up on this discussion, a real review of this assessment step could be performed, e.g., with the companies surveyed. The same refers to the recommended strategies and the quantitative assessment of KPIs (e.g., production rate). Weaknesses in the entire cyclical assessment tool should be identified and the target of long-term improvement should be checked for feasibility, specifically focusing on profitability. Additionally, the conduct of longitudinal studies could further improve the adaptation of the assessment tool for the entire supply chain of manufacturing companies (compare with the SC resilience index by [
36]).
The intensity as well as the procedure of the quantitative analysis in step 4 was only clarified on a theoretical basis within a simulation experiment. A criticism of the simulation study can be seen in the simplification of the model and in a rather unrepresentative disruptive event which was simulated for a very short period. In terms of resilience toward a high-impact crisis, the recovery after a temporary machine failure is rather insignificant. It is recommended to test the validity of the quantitative assessment in a real business environment, as this is required to demonstrate the added value of the comparison between the calculated RIs over time. Depending on the disruptive situations, a more precise interpretation of the RI value should be conducted.
Further, it might be interesting to investigate the time intervals for repeating the steps of the CRAT in order to improve resilience permanently. Scenario-based simulations aligned with the CRAT could additionally aid companies in assessing the utility of the appropriate measures (step 3). Further work could also address these issues.
5. Conclusions
Resilient enterprises are characterized by their ability to withstand potential disruptive events. In the event of crises or disruptions that do occur, particularly high impacts or losses can be prevented, as the company is able to react quickly, adapt to changing circumstances, and restore the initial conditions. Resilience is a fundamental concept for companies, as it enables them to deal with completely unexpected problems, for which no planned solutions exist before. Nevertheless, the ability of resilience can be planned and assessed, as this article demonstrates. Based on the motto
“a chain is as strong as its weakest link”, the resilience of enterprises and of supply chains can be seen as a direct correlation. From a company’s point of view, cooperation with supply chain partners is therefore even more important in these days when supply chains are very vulnerable (due to the COVID-19 pandemic, for instance) and are at risk of collapsing [
72]. However, the view beyond the boundaries of the company is just as important as the view into the organization and into its (social) conditions and practices because resilience starts with the employee.
This work aims to understand the topic in its entirety and complexity. For this purpose, five research questions were formulated, discussed, and answered within the discussion, and are briefly summarized again in the following chapter. In addition, this work offers a novel assessment model for the resilience of various manufacturing companies. In an increasingly volatile, uncertain, complex, and ambiguous business world, this tool can help companies to focus on the issue and the enhancement of resilience. It allows for an independently ongoing evaluation of an enterprise’s resilience state and helps to find appropriate measures by assessing different areas that comprise resilience.


