Abstract
Soil conditioners have shown benefits in the reduction of soil erosion. A concomitant application of gypsum and polyacrylamide promotes aggregate stability and reduces the amount of runoff discharge and soil losses. Synthetic gypsum produced from flue gas desulfurization (FGD) at coalfired power plants has the potential to serve as a more sustainable source for the agricultural application of this soil conditioner. Upcycling of FGD gypsum into a pellet of a mixture of ground FGD gypsum and polyacrylamide (PAM) was compared to other types of soil surface application methods. Results confirm that surface application of PAM and FGD gypsum reduced soil erosion. Depending on the type of application method, addition of PAM and FGD gypsum presented different effects on the local hydrological processes and microtopography. Though PAM in solution acts as a physical net on the soil surface, the amount of water needed for its application makes it impractical for agricultural fields. Granular application of PAM and FGD gypsum, as well as pellets (upcycled product) has been shown to have a delayed effect in reducing soil erosion, as these methods required PAM particles to be activated. The upcycled product of FGD gypsum and PAM in the form of pellets demonstrates that the sudden expansion of the pellets due to PAM hydration results in the rapid release of the gypsum grains, providing a better treatment on the soil surface. Moreover, the increased surface area of PAM and gypsum due to the grinding is advantageous for a more rapid activation of the soil conditioners. The upcycled product of FGD gypsum and PAM is a practical application method that could be adapted by farmers to be used at field scale.
1. Introduction
Many studies have been conducted to analyze the positive effects of soil conditioners in improving soil aggregate stability and reducing soil erosion [1,2,3,4,5]. Additionally, farmers maintain a residue cover on the soil, or increase the soil surface roughness to increase depressional storage. Cogo et al. [6] have suggested that soil surfaces with greater roughness could trap more sediment due to the number of cracks and depressions formed by the equipment, thus decreasing sediment production. This concept was later added to the Universal Soil Loss Equation in its revised version (RUSLE) [7]. More recent research has shown that a soil surface with depressions may delay runoff, but that once the water storage capacity is exceeded, it may have more particle detachment and more water runoff production than a smooth surface [8,9].
Application of soil conditioners improves the various chemical and physical properties of the soil, leading to increased stability under rainwater [1,2,3,4,5,10]. The most abundant liming materials are carbonates of calcium (Ca) and magnesium (Mg). Thus, it is important to understand what cations are favored in cation exchange reactions driven by clay minerals [4,5,10]. Ca and Mg cations have smaller hydration radii than Na does, and this is why Ca promotes clay flocculation and Na promotes clay dispersion [4,11,12,13]. Clay flocculation promotes better soil stability (aggregation), whereas deteriorated soil structure is associated with clay dispersion [4,12]. In addition, several authors have discussed the impacts of the micro-structural evolution of deteriorated and contaminated soils on their macro-mechanical properties [14,15]. Thus, application of soil conditioners can also promote land reclamation processes by transforming a degraded area into a productive area [16].
Rainwater chemistry also plays an important role in the process of breaking down soil aggregates, as rainwater is low in electrolytes as compared with the soil solution. Therefore, rainwater disperses clay, and consequently, dispersed clays are illuviated and block pores [17]. When soluble materials such as gypsum () are added to the soil, the electrolyte concentration is increased and exchangeable sodium and other cations may be replaced by Ca, which can decrease clay dispersion and reduce surface sealing [4,18].
Soil conditioners promote clay flocculation. An increased amount of Ca cations promotes stable aggregates, and less surface sealing [5]. These positive effects result in a greater infiltration rate, and consequently, less water losses and less sediment production (i.e., better water quality downstream) [1,18,19,20,21,22].
Anionic polyacrylamide (PAM) is another type of soil amendment which increases aggregate stability and has been studied by various authors [2,3,23,24]. It has been reported that the addition of a small amount of PAM in rainfall water significantly increased the infiltration, reduced surface sealing, and was more effective in controlling rill erosion as compared to interrill erosion [2]. Norton and Dontsova [25] found that amending the soil with fluidized bed combustion bottom ash and PAM together increased infiltration greater than either on their own and had the greatest reduction of seal formation. The presence of an electrolyte source provides cations for bridging between anionic PAM and negatively charged clays [26]. Regarding the application methods of PAM, it has been reported that granulated PAM-applied directly to the soil surface—takes time to be activated. As a consequence, granulated PAM does not reduce soil losses in the early stages of a rainfall event; once activated, it reduces the sediment production, but not the runoff rates [26]. PAM in solution has proved to be a better method to apply to the soil surface to control soil erosion [2,3,9,23,24,27]. Furthermore, concomitant surface application of PAM and powdered gypsum () to the soil has shown positive effects in reducing soil surface sealing, and soil and water losses [1,2,3,9,22,23,24]. Lepore et al. [23] proposed a novel application method of gypsum and lime coated with PAM, however the PAM coating reduced the dissolution rate of both lime and gypsum.
Though the traditional source of gypsum is geologic deposits, abundant availability of flue gas desulfurization (FGD) gypsum—a by-product of scrubbing sulfur from coalfired power plants—has shown promise in serving as a more sustainable source for agricultural usages [28,29,30], and to reduce some of the associated negative—both environmental and economic—impacts of current food production systems [31]. The American Coal Ash Association has reported that 75.6% of the produced FGD gypsum during 2021 was recycled, showing that nearly 13.5 tons were utilized in a variety of applications, including agricultural systems (5% of the recycled amount) [32]. National standards and guidelines, in the United States, describe the appropriate use of FGD gypsum in agriculture, including it as soil amendment [33,34]. Hence, if we are already recycling FGD gypsum, how can we add value to it? “Upcycling” may be the answer to this question. Upcycling refers to the conversion of a waste material into a more valuable product (artistic, scientific, or anything useful), balancing cost benefits and waste reduction [35].
The objective of this experiment was to determine the effects of adding polyacrylamide (PAM) and FGD gypsum on the infiltration and erosion of a saturated soil under three different application methods: (1) solution-applied PAM plus dry FGD gypsum; (2) dry powdered PAM and FGD gypsum; and (3) pelletized PAM and FGD gypsum (upcycling approach).
2. Materials and Methods
2.1. Soil
The soil used in this study was a Starks–Fincastle complex silt loam collected in Tippecanoe County, Indiana. Starks–Fincastle complex soils are classified as fine-silty, mixed, superactive, mesic Aeric Epiaqualf/Endoaqualf [36]. Soil was collected from the A horizon (0–5 cm), air-dried, passed through a 4-mm sieve and stored in covered containers until its use in the experiment. Table 1 shows the chemical properties of the soil that was used. The organic matter content was determined by combustion using a Leco CNH 2000 analyzer. The available Nitrate-N (NO3−) was measured through KCl extraction. The available phosphorus was measured using an ICP/OES after Bray P-1 and Bray P-2 extractions. Neutral ammonium acetate extractions (1 M NH4OAc at pH 7) were used to determine exchangeable K, Mg, Ca, and Na. Particle size distribution of the soil was measured using the hydrometer method. The soil had 210 g kg−1 of clay (∅ < 0.002 mm), 590 g kg−1 of silt (0.002–0.05 mm), and 200 g kg−1 of sand (0.05–2 mm).

Table 1.
Chemical properties of the A horizon (0–5 cm) of a Starks–Fincastle complex soil from Tippecanoe County, Indiana, USA.
2.2. Soil Conditioners and Upcycling of FGD Gypsum
The utilized gypsum was a by-product of the flue gas desulfurization process during coal combustion to produce electricity, and it presented >95% purity (Table S1). This FGD gypsum was obtained from a power plant in the state of Indiana, USA.
The anionic polyacrylamide was purchased from Allied Colloids Inc. and was grade laboratory quality granular PAM (Percol 156).
The upcycling of FGD gypsum was performed with consideration of the fact that concomitant usage of PAM and gypsum has a greater effect on soil properties than the use of either of each on their own. Therefore, in a small pilot pelletizing facility, granular PAM was ground in a ball mill to reduce its particle size, and thoroughly mixed with FGD gypsum in a weight-based proportion of 1 kg of PAM per 50 kg of FGD gypsum. The mixture was then pelletized using an inert organic binder (lignosulfate) into pellets with a diameter of approximately 2–3 mm. The grinding process promoted the homogenization of the mixture and increased the reactive surface area of soil conditioners. Figure 1 shows a comparison of the particle size of a grain of FGD gypsum (Figure 1a), versus the particle size of FGD gypsum within a crushed pellet (Figure 1b). A conglomerate of particles of FGD gypsum and PAM, bound together by the organic lignin, can also be observed at the bottom right of Figure 1b. Average particle sizes were measured for the FGD gypsum grains using a commercial image analyzer. The average particle size was 40 µm for FGD gypsum, versus an average particle size of 20 µm for the FGD gypsum within the pellets. This half reduction in particle size indicates a reactive surface area that is twice as large for the gypsum particles within the pellets as compared with the original particle size of FGD gypsum. A greater increase in reactive surface area occurred for the PAM grains, though it was not possible to quantify it.
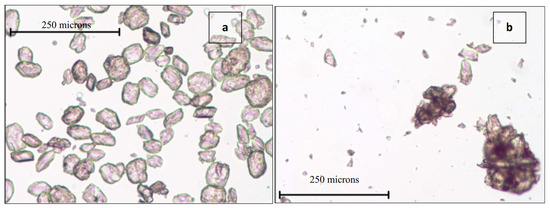
Figure 1.
Photo of FGD gypsum grains (a) and grains of FGD gypsum and organic lignin of a crushed pellet (b) using a microscope with 10× lenses and a refractive index liquid of 1.636.
2.3. Experimental Setup
The sieved soil was packed into small interrill boxes of 1 m × 0.74 m (0.74 m2) to a target bulk density of 1.4 g cm−3. Geometrically ordered surface roughness (GOR) was applied to the soil surface using a flexible dented wheel. Doing this gave the boxes a surface with small depressions capable of storing water on the otherwise smooth surface (Figure 2). Boxes were then saturated from below for a 24-h period and a slope was set at 5%. The GOR surface was then amended by the application of PAM and FGD gypsum. The treatments performed were: (1) GOR control; (2) spraying PAM in solution to the surface, allowing the surface to dry prior to the 24-h saturation period, and then applying powdered FGD gypsum to the surface (S-PAM + FGD); (3) powdered FGD gypsum mixed with powdered PAM (P-PAM + FGD); and (4) upcycled product of FGD gypsum and PAM pellets (Pell-PAM + FGD). In all cases, the application rates of amendments were 20 kg ha−1 of PAM, and 1 ton ha−1 of gypsum. Three separate boxes of each treatment were subjected to simulated rainfall with a target intensity of 44 mm h−1 using de-ionized water to simulate natural rainfall.
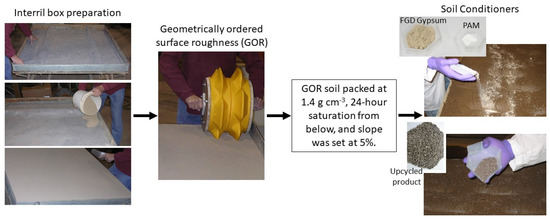
Figure 2.
A schematic of the interrill box preparation process. Soil was packed to a bulk density of 1.4 g cm−3, and a geometrically ordered surface roughness was achieved utilizing a commercial dented wheel. The illustration also depicts the application of two out of three soil conditioner treatments after allowing for a 24-h saturation period.
Another important step in this experiment setup was to force a water table during the whole rainfall simulation. Prior to the soil boxes being subjected to the rainfall event, the water level was set 10 cm below the soil surface at the end plot and allowed to equilibrate for 60 min. The reason for this was to simulate field conditions for early spring when soils in the midwestern USA present a perched water table due to snow and ice melting, and are therefore more vulnerable to soil water erosion because of poor residue coverage.
2.4. Rainfall Simulation
Deionized water was applied with a target rainfall intensity of 44 mm h−1. The average rainfall intensity for Lafayette, Indiana in a five-year return period is equivalent to the target rainfall intensity value [37]. The experiment was at the National Soil Erosion Research Laboratory using a two-trough programmable rainfall simulator [38]. Each trough had 3 VeeJet 80,100 nozzles spaced 1 m apart and were mounted 2.5 m above the box surface on an aluminum frame. Rain gauges were set on each corner of the box to verify the rainfall intensity.
Time to runoff was recorded and runoff samples were collected at 5-min intervals for one hour after runoff began or until steady-state conditions were obtained. Sediment yield and runoff were measured gravimetrically from 1-L sample bottles collected. The volumes of runoff collected at 5-min intervals were measured and compared with the amount of rainfall applied to compute the infiltration rates and the total amount of water that infiltrated into the soil.
After the rainfall event, several cubic samples of the soil surface were collected for thin section preparation.
2.5. Thin Section Preparation and Analysis
The boxes were allowed to drain for 24 h before undisturbed samples were taken by excavation. Soil samples were taken from the depression and the ridge areas created by the passing of the dented wheels. Samples were air-dried and impregnated using the procedure of Innes and Pluth [39] with a commercial electrical epoxy resin (Scotchcast #3). Impregnated samples were then cut, mounted to glass slides and polished to 30 µm. The thin sections were analyzed under a polarizing microscope to observe gypsum migration and seal formation for each treatment. Digital images were saved as electronic files using a Nikon polarizing microscope and Spot image analyzing solutions software.
2.6. Data Analysis
Data on erosion and runoff were analyzed using the Statistical Analysis System (SAS) [40]. Significant differences were obtained using analysis of variance (ANOVA) and Tukey’s studentized range test for mean treatment differences.
3. Results and Discussion
3.1. Soil Erosion Evaluation
In order to evaluate the differences among the three different application methods and the GOR control, attention was focused on the following soil erosion parameters at steady-state: (a) sediment concentration, (b) erosion rate, (c) water discharge, and (d) soil loss (Table 2). Infiltration rates (Figure 3) and total infiltration (Figure 4) were also calculated and compared by treatment.
Table 2.
Means 1 of interrill erosion parameters at steady-state organized by treatment (FGD gypsum and PAM application method).
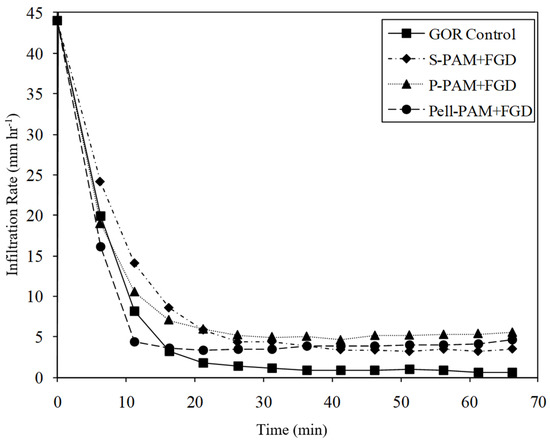
Figure 3.
Infiltration rate vs. time. After initial runoff started, two application methods (P-PAM + FGD and Pell-PAM + FGD) were shown to be not significantly different than the GOR control early in the run, but to become significantly different towards the end of the run.
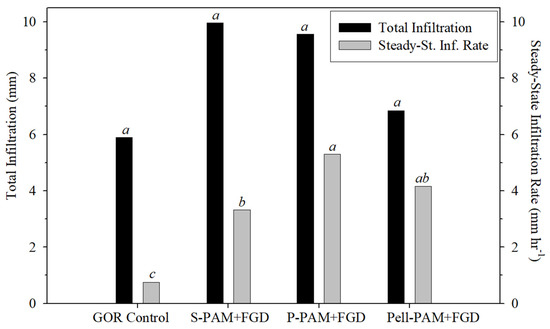
Figure 4.
Mean values of total infiltration (left axis) did not show statistical differences at any significance level. Mean values of infiltration rates at steady-state (right axis), with different letters on top of the corresponding bar, were significantly different using Tukey’s multiple comparison test at α = 0.05.
Table 2 summarizes the means of relevant erosion parameters at steady-state. Sediment concentration was significantly reduced when PAM and FGD gypsum were surface applied regardless of the application method at α = 0.05. However, there was also a significant statistical difference within application methods: Pell-PAM + FGD reduced the sediment concentration the most, followed by P-PAM + FGD within the same statistical group. Nevertheless, P-PAM + FGD was also grouped statistically with S-PAM + FGD in the following group. Sediment concentrations were in the order GOR control > S-PAM + FGD > P-PAM + FGD > Pell-PAM + FGD. The control treatment had the greatest soil loss and was significantly different than all the other treatments, due to the lack of conditioners promoting flocculation and aggregate stability; on the other hand, treatments with polyacrylamide reduced sediment concentrations at steady-state. Other parameters indicated that there was a reduction in erosion rate, water discharge, and soil loss, regardless of the application method of PAM + FGD as compared with the GOR control. Significant differences between application methods were found for erosion rate and soil loss at α = 0.1, with Pell-PAM + FGD having the least erosion rate and soil loss at steady-state. For erosion rate and soil loss, treatment order matched that of sediment concentration: GOR control > S-PAM + FGD > P-PAM + FGD > Pell-PAM + FGD. The differences observed may be due to the activation period of polyacrylamide. PAM in solution worked like a polymer web over the soil surface (as it was allowed to dry), but its effect was depleted by rainfall, whereas P-PAM + FGD and Pell-PAM + FGD were activated by dissolution during the run. These findings are in accordance with those results presented by Peterson et al. [24]. In general, these results are similar to those obtained by other authors in the past (i.e., that simultaneous applications of PAM and gypsum reduces soil erosion [20,22]), but that results can vary depending on the application method.
As mentioned above, the soil profile was saturated and a water level was maintained at 10 cm below the soil surface at the end plot; however, the excess of water above the forced water level tended to mix with the water from the level control system because the latter was open, allowing drainage and infiltration. The infiltration was calculated as the difference between rainfall rate and runoff (Figure 3 and Figure 4). Figure 3 shows how treatments behaved with respect to infiltration throughout the experiment. After the initial runoff started, two application methods (P-PAM + FGD and Pell-PAM + FGD) were found to be not significantly different from the GOR control early in the run. This can be explained due to the delay in activation of the dry PAM grains in P-PAM + FGD and within the pellets of the upcycled product (Pell-PAM + FGD). These results are consistent with those presented by Peterson et al. [24] and Tang et al. [19]. However, there is a considerable improvement near the end of the experiment (i.e., at steady-state conditions), regardless of the application method of PAM and FGD gypsum, as compared with the control. Figure 4 also shows total infiltration (mm) and infiltration rates (mm h−1) at steady-state. There were no statistically significant differences for total infiltration due to the considerable variability, but infiltration rates at steady-state showed greater values when PAM and FGD gypsum were applied. There were three statistical groups, with P-PAM + FGD being the application method with greater infiltration rate at steady-state, though one that was not significantly greater than Pell-PAM + FGD. The steady-state infiltration rate for the GOR control was very low for this soil and less than 1 mm h−1 even with the low rainfall intensity.
To illustrate why the infiltration values are so different, Figure 5 shows a digital elevation model (DEM) of two treatments side by side; on the left there is a box treated with P-PAM + FGD, which allowed greater infiltration at steady-state, and on the right the GOR control, which had the least infiltration rate at steady-state. The DEM of the soil surface was generated using data produced by a laser scanner according to the method described by Darboux and Huang [8]. From the DEM a rather smooth surface can be seen in the depression areas of the plot. This is due to fine sediment particles accumulating from sediment deposition after being transported by runoff; nevertheless, when P-PAM + FGD was applied the initial GOR shape remained. The large amount of sediment being deposited in the depressions is inversely proportional to infiltration rates at steady-state, i.e., the greater amount of trapped sediment, the lower the infiltration rate at steady-state. The microhydrology created by the dented wheels favors the accumulation of runoff and trap sediment in the depressions; for PAM + FGD treated surfaces, soil aggregates were stabilized, and less sediment was removed by runoff than from the GOR control. This was the main reason that the depositional crusts in the basins were greater in the GOR control than in the other PAM + FGD treatments. Stabilized ridges may play an important role at steady-state, but a better analysis of this can be seen in the following section which refers to the micromorphology of the surface seals.
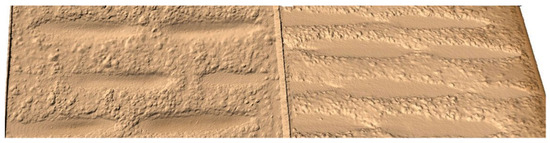
Figure 5.
Digital elevation model of GOR surface after rainfall experiment for the P-PAM + FGD (left) and GOR control (right) treatments. Depressions on the GOR control were filled with more sediment than PAM + FGD treatments, this reduced the amount of infiltrated water at steady-state.
3.2. Micromorphological Observations of Surfaces
Application of PAM and FGD proved to decrease the amount of soil loss; however, we looked closer at the effects of treatments on surface sealing and clay dispersion.
In a previous experiment [41], the same setup was used to evaluate a bare soil surface versus the GOR control of this work. The authors reported that for bare soil treatment most of the pores either collapsed or filled with finer material, due to eluvial (washed out) and illuvial (washed in) processes at a microtopography scale [41] that consequently reduced infiltration rate and increased runoff discharge.
The passing of the indented wheel created depressions and ridges, and thin sections of both areas were made. Depressions collected eroded sediment and stable aggregates carried by runoff (Figure 6a). This figure also illustrates how gypsum grains were trapped within the sediment. The arrows in Figure 6b–d show the accumulation of gypsum grains identified by relief differences in refractive oils and high birefringence in cross-polarized light. An interesting observation can be seen in Figure 6d where a piece of a pellet was trapped within the sediment. The way the gypsum is distributed on the surface indicates that a rapid release—due to hydration of the PAM inside the pellet—caused a sudden expansion and breakdown of the weak binding agent of the pellet. Another important observation is the number of pores. Figure 6a shows very few pores for the GOR control (the white areas are sand grains, identified in the partially crossed polarized light images); whereas the arrows in (b), (c) and (d) are located precisely where the pores are located. The presence of pores allows water to infiltrate and collapsed or clogged pores reduced the steady-state infiltration rate of the GOR control treatment. The upper parts of the sediment filling the depressions also have interesting features (Figure 7). Figure 7a,b (GOR control and S-PAM + FGD, respectively) show a consistent and very thin skin-seal, signaled by the arrows. This type of seal appears to have formed when small particles were detached by rainwater and deposited on the soil surface when transportation by runoff ceased at the end of the rainfall or when sediment transport capacity was exceeded. Depressions were also filled with water and fine sediment particles in suspension; these small reservoirs drained and the fine particles deposited, creating a very consistent skin seal similar to that described by Norton [42]. The other two treatments (Figure 7c,d) did not present this feature. This may be due to a differential effect of dry PAM in treatments P-PAM + FGD, and Pell-PAM + FGD, which was activated later and could have caused more aggregate stability than when applied in solution before the event. By applying the PAM in solution (before application of FGD gypsum), the aggregates on the soil surface were rapidly wetted and it is probable that aggregate slaking occurred. This effect is similar to the way in which rainwater, in the absence of an electrolyte source, causes a somewhat sealed surface. Furthermore, allowing the drying of the soil surface, after application of PAM in solution, may have caused the resultant slaked seal to be more stable than GOR control, thus resulting in less erosion than GOR control. The P-PAM + FGD and the Pell-PAM + FGD treatments showed little evidence of clay dispersion and skin seal development (Figure 7c,d).
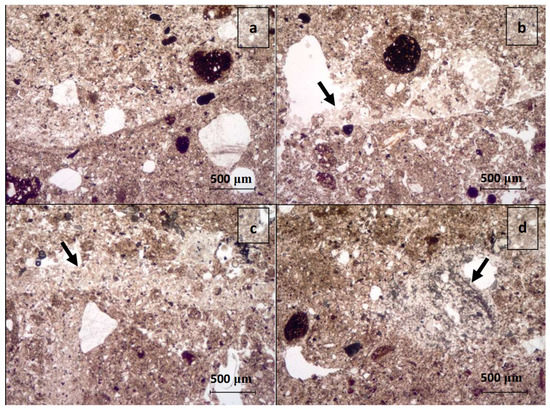
Figure 6.
Accumulation of sediment in depressions of GOR control (a), S-PAM + FGD (b), P- PAM + FGD (c), and Pell-PAM + FGD (d). Depressions collected eroded sediment and stable aggregates carried by runoff. Arrows indicate trapped gypsum grains. A piece of a pellet of PAM and FGD gypsum, signalized by arrow, can be observed in frame (d), the distribution of gypsum grains indicates a rapid release due to hydration of PAM grains inside the pellet, causing a sudden expansion and breakdown of the weak binding agent of the pellet.
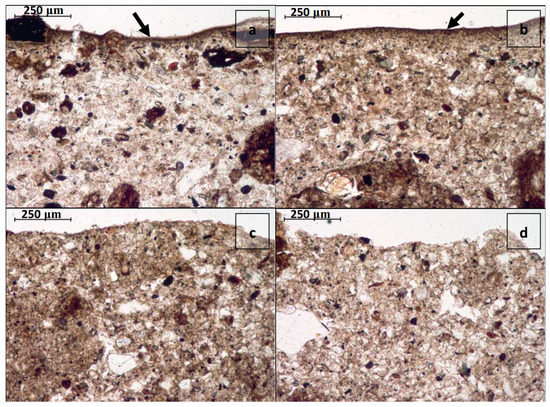
Figure 7.
Crust formed in depressions of GOR control (a), S-PAM + FGD (b), P-PAM + FGD (c), and Pell-PAM + FGD (d). Arrows indicate a very thin skin-seal in (a,b), formed when fine particles were deposited on the surface once transportation by runoff ceased at the end of the rainfall or when sediment transport capacity was exceeded.
A comparison of the ridge tops for each treatment shows little indication of downward illuviation (Figure 8). This indicates that the ridged areas provide the supply of eroded material for the wheel depressions, which captured water flow in the early stages until they were filled with sediment, and thereby reducing infiltration rates in these zones. The depressions collected material from the ridge tops and the finest sediment particles were transported off the box when the depressions were filled and runoff began.
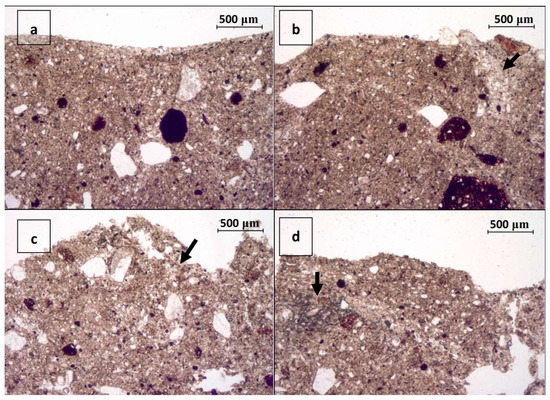
Figure 8.
Top of ridges after rainfall event of (a) GOR control, (b) S-PAM + FGD, (c) P-PAM + FGD, and (d) Pell-PAM + FGD. Arrows indicate movement of gypsum grains in the pore space. Comparison of the different treated ridge tops shows little indication of downward illuviation, indicating that the ridged areas provide a supply of eroded material for the depressions.
An important feature is the movement of the gypsum particles in the profile. Figure 8b corresponds to S-PAM + FGD. A filled pore with gypsum particles (signaled by an arrow) can be observed. Similarly, Figure 8c shows a few grains of gypsum accumulated in a pore (signaled by an arrow). Under natural conditions, accumulated grains of gypsum within pores would eventually dissolve and allow aggregate and pore stability. Figure 8d shows a piece of pellet (signaled by an arrow) with similar appearance to that of Figure 6d. This piece of pellet may have become trapped by sediment and the expansion of PAM, due to its hydration, released the gypsum grains as the water transported them through the pores. These indications of gypsum mobility into pores have implications for the beneficial effects of having an electrolyte source for the infiltration of rainwater.
Finally, image analysis using electron microscopy showed further detail regarding flocculation of particles for the Pell-PAM + FGD treatment (Figure 9). The presence of the organic lignin also bound small aggregates and soil minerals (signaled by arrows Figure 9c,d). More research should be conducted to understand the chemical and physical interactions of these materials and their implications in soil microbiome.
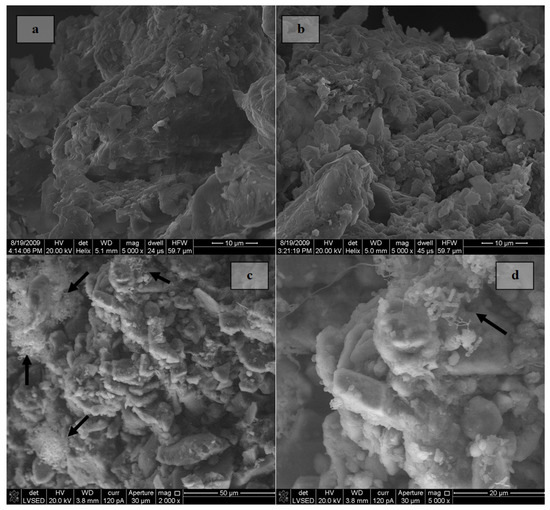
Figure 9.
Electron microscope images of the crust formed in (a) P-PAM + FGD ridge, (b) P-PAM + FGD depression, and (c,d) Pell-PAM + FGD ridge. Arrows indicate organic lignin around soil minerals after pellets reacted with the water and released PAM and FGD gypsum. This may also improve aggregate stability as the organic lignin wraps and surrounds small aggregates and soil minerals.
4. Conclusions
This work confirms that applying PAM and FGD gypsum to the soil surface can reduce soil erosion. Depending on the method of application, PAM and FGD gypsum have different effects on local hydrological processes and microtopography. PAM in solution acts as a physical net on the soil surface but is not practical for large-scale agricultural fields due to the amount of water needed. Granular application of PAM and FGD gypsum has a delayed effect on reducing soil erosion, with potential limitations due to wind drift during application. The upcycled product of FGD gypsum and PAM in the form of pellets has a more rapid activation of PAM and gypsum due to the increased surface area. This method is practical for farmers to use at a field scale. Further research is recommended to understand chemical interactions in the soil solution and their effects on the rhizosphere.
Supplementary Materials
The following supporting information can be downloaded at: https://www.mdpi.com/article/10.3390/su15031977/s1. Table S1. Chemical composition of FGD gypsum.
Author Contributions
Conceptualization, S.F.A.-G. and L.D.N.; methodology, S.F.A.-G. and L.D.N.; formal analysis, S.F.A.-G. and L.D.N.; investigation, S.F.A.-G. and L.D.N.; resources, L.D.N.; data curation, S.F.A.-G. and L.D.N.; writing—original draft preparation, S.F.A.-G.; writing—review and editing, S.F.A.-G. and L.D.N.; supervision, L.D.N.; project administration, L.D.N.; funding acquisition, L.D.N. All authors have read and agreed to the published version of the manuscript.
Funding
This research received funding from USDA Agricultural Research Service and Purdue University.
Institutional Review Board Statement
Not applicable.
Informed Consent Statement
Not applicable.
Data Availability Statement
The data presented in this study are available on request from the corresponding author.
Acknowledgments
The authors would like to thank Eusebio Jr. Ventura for his contribution during his sabbatical period at the USDA-ARS National Soil Erosion Research Laboratory.
Conflicts of Interest
The authors declare no conflict of interest.
References
- Cochrane, B.H.; Reichert, J.M.; Eltz, F.L.; Norton, L.D. Controlling soil erosion and runoff with polyacrylamide and phosphogypsum on subtropical soil. Trans. ASABE 2005, 48, 149–154. [Google Scholar] [CrossRef]
- Flanagan, D.C.; Norton, L.D.; Shainberg, I. Effect of water chemistry and soil amendments on a silt loam soil—Part 1: Infiltration and runoff. Trans. ASABE 1997, 40, 1549–1554. [Google Scholar] [CrossRef]
- Flanagan, D.C.; Norton, L.D.; Shainberg, I. Effect of water chemistry and soil amendments on a silt loam soil—Part 2: Soil erosion. Trans. ASABE 1997, 40, 1555–1561. [Google Scholar] [CrossRef]
- Dontsova, K.M.; Norton, L.D. Clay dispersion, infiltration, and erosion as influenced by exchangeable Ca and Mg. Soil Sci. 2002, 167, 184–193. [Google Scholar] [CrossRef]
- Norton, L.D.; Zhang, X.C. Liming to improve chemical and physical properties of soil. In Handbook of Soil Conditioners; Wallace, A., Terry, R.E., Eds.; Marcel Dekker, Inc.: New York, NY, USA, 1998. [Google Scholar]
- Cogo, N.P.; Moldenhauer, W.C.; Foster, G.R. Soil Loss Reductions from Conservation Tillage Practices. Soil Sci. Soc. Am. J. 1984, 48, 368–373. [Google Scholar] [CrossRef]
- Renard, K.G.; Foster, G.R.; Weesies, G.A.; McCool, D.K.; Yoder, D.C. Predicting Soil Erosion by Water: A Guide to Conservation Planning with the Revised Universal Soil Loss Equation (RUSLE); USDA—ARS, U.S. Government Printing Office: Washington, DC, USA, 1997.
- Darboux, F.; Huang, C.H. Does Soil Surface Roughness Increase or Decrease Water and Particle Transfers? Soil Sci. Soc. Am. J. 2005, 69, 748–756. [Google Scholar] [CrossRef]
- Acuña-Guzman, S.F.; Norton, L.D. Interrill erosion on random and geometrically ordered rough surfaces. In Proceedings of the ASA-CSSA-SSSA Annual Meeting, Indianapolis, IN, USA, 12–16 November 2006. [Google Scholar]
- Favaretto, N.; Norton, L.D.; Joern, B.C.; Brouder, S.M. Gypsum amendment and exchangeable calcium and magnesium affecting phosphorus and nitrogen in runoff. Soil Sci. Soc. Am. J. 2006, 70, 1788–1796. [Google Scholar] [CrossRef]
- Bronick, C.J.; Lal, R. Soil structure and management: A review. Geoderma 2005, 124, 3–22. [Google Scholar] [CrossRef]
- Levy, G.J.; Torrento, J.R. Clay dispersion and macroaggregate stability as affected by exchangeable potassium and sodium. Soil Sci. 1995, 160, 352–358. [Google Scholar] [CrossRef]
- Armstrong, A.S.B.; Tanton, T.W. Gypsum applications to aggregated saline-sodic clay topsoils. Eur. J. Soil Sci. 1992, 43, 249–260. [Google Scholar] [CrossRef]
- Hu, W.; Cheng, W.C.; Wang, L.; Xue, Z.F. Micro-structural characteristics deterioration of intact loess under acid and saline solutions and resultant macro-mechanical properties. Soil Tillage Res. 2022, 220, 105382. [Google Scholar] [CrossRef]
- Wang, L.; Cheng, W.C.; Xue, Z.F. Investigating microscale structural characteristics and resultant macroscale mechanical properties of loess exposed to alkaline and saline environments. Bull. Eng. Geol. Environ. 2022, 81, 146. [Google Scholar] [CrossRef]
- Ahmad, S.; Ghafoor, A.; Akhtar, M.E.; Khan, M.Z. Implication of gypsum rates to optimize hydraulic conductivity for variable-texture saline–sodic soils reclamation. Land Degrad. Dev. 2015, 27, 550–560. [Google Scholar] [CrossRef]
- Norton, D.; Shainberg, I.; Cichacek, L.; Edwards, J.H. Erosion and soil chemical properties. In Soil Quality and Soil Erosion; Lal, R., Ed.; CRC Press: Boca Raton, FL, USA, 1999; pp. 39–56. [Google Scholar]
- Keren, R.; Shainberg, I.; Frenkel, H.; Kalo, Y. The effect of exchangeable sodium and gypsum on surface runoff from loess soil. Soil Sci. Soc. Am. J. 1983, 47, 1001–1004. [Google Scholar] [CrossRef]
- Outbakat, M.B.; El Mejahed, K.; El Gharous, M.; El Omari, K.; Beniaich, A. Effect of Phosphogypsum on Soil Physical Properties in Moroccan Salt-Affected Soils. Sustainability 2022, 14, 13087. [Google Scholar] [CrossRef]
- Kazman, Z.; Shainberg, I.; Gal, M. Effect of low-levels of exchangeable sodium and applied phosphogypsum on the infiltration rate of various soils. Soil Sci. 1983, 135, 184–192. [Google Scholar] [CrossRef]
- Smith, H.J.C.; Levy, G.J.; Shainberg, I. Water-droplet energy and soil amendments: Effect on infiltration and erosion. Soil Sci. Soc. Am. J. 1990, 54, 1084–1087. [Google Scholar] [CrossRef]
- Tang, Z.; Lei, T.; Yu, J.; Shainberg, I.; Mamedov, A.I.; Ben-Hur, M.; Levy, G.J. Runoff and interrill erosion in sodic soils treated with dry PAM and phosphogypsum. Soil Sci. Soc. Am. J. 2006, 70, 679–690. [Google Scholar] [CrossRef]
- Lepore, B.J.; Thompson, A.M.; Petersen, A. Impact of polyacrylamide delivery method with lime or gypsum for soil and nutrient stabilization. J. Soil Water Conserv. 2009, 64, 223–231. [Google Scholar] [CrossRef]
- Zhang, X.C.; Miller, W.P.; Nearing, M.A.; Norton, L.D. Effects of surface treatment of surface sealing, runoff, and interrill erosion. Trans. ASABE 1998, 41, 989–994. [Google Scholar] [CrossRef]
- Norton, L.D.; Dontsova, K. Use of soil amendments to prevent soil surface sealing and control erosion. Adv. GeoEcol. 1998, 31, 581–587. [Google Scholar]
- Laird, D.A. Bonding between polyacrylamide and clay mineral surfaces. Soil Sci. 1997, 162, 826–832. [Google Scholar] [CrossRef]
- Peterson, J.R.; Flanagan, D.C.; Tishmack, J.K. Polyacrylamide and gypsiferous material effects on runoff and erosion under simulated rainfall. Trans. ASABE 2002, 45, 1011–1019. [Google Scholar] [CrossRef]
- Kost, D.; Ladwig, K.J.; Chen, L.; DeSutter, T.M.; Espinoza, L.; Norton, L.D.; Smeal, D.; Torbert, H.A.; Watts, D.B.; Wolkowski, R.P.; et al. Meta-Analysis of Gypsum Effects on Crop Yields and Chemistry of Soils, Plant Tissues, and Vadose Water at Various Research Sites in the USA. J. Environ. Qual. 2018, 47, 1284–1292. [Google Scholar] [CrossRef]
- Watts, D.B.; Dick, W.A. Sustainable uses of FGD gypsum in agricultural systems: Introduction. J. Environ. Qual. 2014, 43, 246–252. [Google Scholar] [CrossRef]
- Zoca, S.M.; Penn, C. An important tool with no instruction manual: A review of gypsum use in agriculture. Adv. Agron. 2017, 144, 1–44. [Google Scholar] [CrossRef]
- Ellen MacArthur Foundation. Cities and Circular Economy for Food. 2019. Available online: https://ellenmacarthurfoundation.org/cities-and-circular-economy-for-food (accessed on 3 November 2022).
- American Coal Ash Association. Publications—Production & Use Reports. 2022. Available online: https://acaa-usa.org/publications/production-use-reports/ (accessed on 3 November 2022).
- US Department of Agriculture—Natural Resources Conservation Service. Amending Soil Properties with Gypsum Products, Code 333 (Ac.). 2015. Available online: https://www.nrcs.usda.gov/sites/default/files/2022-08/Amending_Soil_Properties_with_Gypsum_Products_333_CPS_June_2015_Final.pdf (accessed on 3 November 2022).
- USEPA—National Service Center for Environmental Publications (NSCEP). Agricultural Uses for Flue Gas Desulfurization (FGD) Gypsum. 2008. Available online: http://nepis.epa.gov/Exe/ZyPURL.cgi?Dockey=P1001II9.txt (accessed on 3 November 2022).
- Pol, V.G. Upcycling: Converting Waste Plastics into Paramagnetic, Conducting, Solid, Pure Carbon Microspheres. Environ. Sci. Technol. 2010, 44, 4753–4759. [Google Scholar] [CrossRef]
- Soil Survey Staff—National Resources Conservation Service. US Department of Agriculture. Official Soil Series Descriptions. Available online: https://www.nrcs.usda.gov/resources/data-and-reports/official-soil-series-descriptions-osd. (accessed on 3 November 2022).
- Rao, A.R.; Kao, S. Statistical Analysis of Indiana Rainfall Data; Publication FHWA/IN/JTRP-2006/08. Joint Transportation Research Program; Indiana Department of Transportation: Indianapolis, IN, USA; Purdue University: West Lafayette, IN, USA, 2006. [CrossRef]
- Foster, G.R.; Eppert, E.P.; Meyer, L.D. A programmable rainfall simulator for field plots. In Agricultural Reviews and Manuals, ARM-W-10; USDA-ARS: Oakland, CA, USA, 1979; pp. 45–49. [Google Scholar]
- Innes, R.P.; Pluth, D.J. Thin section preparation using an epoxy impregnation for petrographic and electron microprobe analysis. Soil Sci. Soc. Am. J. 1970, 34, 483–485. [Google Scholar] [CrossRef]
- SAS Institute. Release 9.1 TS Level 1M3; SAS Institute: Cary, NC, USA, 2003. [Google Scholar]
- Acuña, S.F.; Norton, L.D.; Ventura, E.J. Reduction of Interrill Erosion by different application methods of Polyacrylamide and Gypsum. In Proceedings of the 21st Century Watershed Technology: Improving Water Quality and Environment Conference, Concepcion, Chile, 29 March–3 April 2008. [Google Scholar] [CrossRef]
- Norton, L.D. Micromorphological study of surface seals developed under rainfall simulation. Geoderma 1987, 40, 127–140. [Google Scholar] [CrossRef]


Disclaimer/Publisher’s Note: The statements, opinions and data contained in all publications are solely those of the individual author(s) and contributor(s) and not of MDPI and/or the editor(s). MDPI and/or the editor(s) disclaim responsibility for any injury to people or property resulting from any ideas, methods, instructions or products referred to in the content. |
© 2023 by the authors. Licensee MDPI, Basel, Switzerland. This article is an open access article distributed under the terms and conditions of the Creative Commons Attribution (CC BY) license (https://creativecommons.org/licenses/by/4.0/).