Article

Government Subsidy Strategies for the New Energy Vehicle Power Battery Recycling Industry

1
School of Customs and Public Economics, Shanghai Customs College, Shanghai 201204, China
2
Department of Agricultural and Resource Economics, The University of Tokyo, Tokyo 113-8657, Japan
3
School of Economics, Shanghai University, Shanghai 200444, China
*
Author to whom correspondence should be addressed.
Sustainability 2023, 15(3), 2090; https://doi.org/10.3390/su15032090
Submission received: 16 December 2022 / Revised: 15 January 2023 / Accepted: 17 January 2023 / Published: 22 January 2023

Abstract

:
The rapid development of the new energy vehicle industry is an essential part of reducing CO2 emissions in the transportation sector and achieving carbon peaking and carbon neutrality goals. This vigorous development of the new energy vehicle industry has generated many end-of-life power batteries that cannot be recycled and reused, which has brought serious consequences for the environment. In order to solve the negative externality problem brought by EoL power batteries, how the government intervenes in the development of the market and guides multiple parties to cooperate in recycling EoL power batteries is a question worthy of deep consideration. In this paper, we consider that the government acts before recycling companies and consumers, and recycling companies and consumers act again according to the policy. First, we examine an evolutionary game model of recycling companies and consumers in the absence of the government and explore their choice strategies in various scenarios. Second, we examine how government subsidies to recycling companies and consumers may change the trend toward positive recycling in different circumstances. This paper compares the effects of government policies on subsidies to recycling companies, subsidies to consumers, and subsidies to recycling companies and consumers. Finally, the paper proposes policy suggestions from the perspectives of the government, recycling companies, and consumers. The conclusion suggests that the market does not guarantee a high return for both parties without government subsidies. It is difficult for recyclers and consumers to cooperate proactively in recycling end-of-life power batteries. Thus, it is found that government subsidies to recycling companies and consumers can maximize social welfare at the lowest government cost. Even though government subsidies are currently targeted at recycling companies, they should gradually be extended to consumers as the industry develops.

1. Introduction

Under the dual pressure of global ecological degradation and the energy crisis, many countries have adopted the strategic goals of “carbon peaking” and “carbon neutrality” to achieve the global concept of innovative, coordinated, green, and open sustainable development. The continued emissions of greenhouse gases, especially carbon dioxide, are a major cause of environmental problems such as global warming. Globally, the transportation industry is responsible for 23% of CO2 emissions [1]. Thus, the promotion of new energy vehicles (NEVs) can reduce the dependence of vehicles on fossil fuels and effectively mitigate major environmental issues such as “carbon emissions” and the “greenhouse effect” [2]. Electric vehicle (EV) sales broke new records in 2021, making up nearly 10% of global auto sales [3]. Subsidies and incentives for EVs almost doubled by nearly USD 30 billion. An increasing number of countries have committed to phasing out internal combustion engines or setting ambitious targets to electrify their vehicles by 2030. Aside from policy targets, many manufacturers have ambitious plans to electrify their fleets [4]. In conclusion, the electrification of the transportation industry is a critical way to achieve the carbon reduction target, and the sustainable development of NEVs in all countries will become an inevitable trend [5,6,7].
The global EV market is growing rapidly. EV sales account for 9% of the global car market in 2021, four times what they were in 2019. EVs accounted for all the growth in global car sales. China had the highest sales worldwide, which accounted for half of the EV market’s growth [4]. The Chinese market is the world’s largest market for NEVs, ranking first for seven consecutive years. According to the China Association of Automobile Manufacturers, the Chinese NEV market completed a total of 2.6 million retail sales in the first half of 2022, an increase of 120% year-on-year. However, the vigorous development of NEVs is a “double-edged sword”. According to the average power battery life of 5–8 years, the first generation of NEVs put on the market is approaching the time node of power battery replacement, and society will face the problem of disposal of a large number of scrap power batteries [8]. With the popularity of NEVs, it is expected that the amount of power battery scrap will show exponential growth [9]. More than one million power batteries worldwide are expected to end their precious lives by 2030 [10]. If EoL power batteries are not handled appropriately, they may adversely affect the ecological environment, economic development, and government governance, resulting in a departure from the intended purpose of promoting NEVs to protect the environment. Conversely, if EoL power batteries are properly disposed of, this could not only reduce greenhouse gas emissions by 34% but also have various economic, social, and environmental benefits [11,12,13,14,15]. Therefore, governments should pay more attention to recycling and reusing EoL power batteries.
This paper makes the following three contributions: (1) This paper establishes an evolutionary game model between recycling companies and consumers. Unlike previous studies, this model considers a situation where the government makes decisions first and the recycling companies and consumers make decisions later based on the actual situation. (2) This study uses a numerical simulation method to analyze the impact of key parameter changes of recycling companies and consumers on the system evolution path. (3) This study adopts a case study to test the policy effects of government subsidies and costs paid in different scenarios. The conclusion proposes the optimal subsidy strategy for the government.
The remainder of the paper is organized as follows: Section 2 reviews the literature. Section 3 constructs the evolutionary game model of recycling companies and consumers. Section 4 conducts the equilibrium analysis and simulates the impact of parameter changes on the system. Section 5 constructs the game model of government participation and analyzes the optimal government subsidy strategy. Section 6 outlines the conclusions and policy recommendations.

2. Literature Review

2.1. Benefits of Power Battery Recycling

Existing studies have also confirmed the necessity and feasibility of the economic, social, and environmental benefits aspects. From the perspective of economic benefits, Neubauer et al. [16] found that second-use batteries in energy storage devices can extend their lifetime, thereby reducing the cost of producing EVs and storing energy. Lih et al. [17] showed that second-use power batteries could generate long-term stable profits for mutual profitability. Assunção et al. [18] used a Simulink degradation model to confirm that using EoL power batteries in a residential photovoltaic energy storage facility on a gradient basis can yield high economic returns. From the perspective of environmental benefits, Cusenza et al. [19] investigated from a life cycle perspective that EoL power batteries instead of new batteries for stationary energy storage systems in residential buildings can improve environmental sustainability, and the results of the study contribute to the development of society toward a low-carbon and circular economy. Nguyen-Tien et al. [20] showed that EoL power batteries could be reapplied to stationary energy storage, reducing the negative externalities of EoL power batteries on the environment and converting the residual value into a strategic resource. Wang et al. [21] conducted an environmental analysis of the various stages of power battery manufacturing, use, secondary use, and battery recycling. They found that reusing EoL lithium-ion phosphate batteries in energy storage systems can reduce the consumption of fossil fuels, thereby reducing the negative environmental impact of lithium batteries throughout their life cycle. Hao et al. [11] found that the effective recycling of EoL power batteries could reduce greenhouse gas emissions by 6.62% and energy consumption by 8.55% to achieve additional environmental benefits. From the perspective of resource benefits, Wanger [22] shows that adequately recycling lithium-ion batteries from vehicles can provide effective environmental and resource conservation. Song et al. [23] discussed the supply risk of different materials in the Chinese lithium-ion battery industry. They found that efficient waste management could alleviate the problem of tight raw material supply resources. Feng et al. [24] proved that recycling EoL power batteries could reduce environmental and resource problems by 5–30% and is a crucial way to achieve sustainable development. Lai et al. [25] demonstrated that companies can effectively track the status of batteries and reduce the production and emission of pollutants by recycling used power batteries. Companies can also implement scientific, efficient, and systematic environmental management to achieve the goal of resource optimization and control. Currently, more and more studies around the world are focusing on the rational recycling of used power batteries [26,27].

2.2. Game Theory in the Power Battery Recycling Industry

Several researchers have applied game theory to the field of used power battery recycling, with research areas focusing on the choice of recycling models. Kaushal et al. [28] use a non-cooperative game-theoretic to analyze the condition of recyclers collecting EoL batteries from consumers. Sun et al. [29] built retailer recycling, manufacturer recycling, and mixed recycling using the Stackelberg game. They investigated the influence of carbon trading policy outside the supply chain, power battery endurance capacity, and advertising effects within the supply chain on recycling channel selection. Zhang et al. [30] investigated an EV power battery supply chain under the cap-and-trade policy using the Stackelberg game to select recycling modes and decrease carbon emissions. Moreover, they proposed four mixed-channel recycling modes in which three parties participate in the recycling process: a third-party recycler, a retailer, and an echelon utilization enterprise. Additionally, they proposed four mixed-channel recycling modes in which two or three parties from a third-party recycler, a retailer, and an echelon utilization enterprise participate in the recycling business. In addition, some researchers have used game theory to explore the influence relationship among government, companies, and consumers. Zhang et al. [8] used an evolutionary game to simulate the different challenges of three parties in the reuse process and proposed a reasonable path for reducing subsidies. He et al. [31] explored the EPR mechanism of power battery recycling from the supply-side perspective based on a game theory approach. They analyzed the three parties’ behavior patterns under static and dynamic reward and punishment mechanisms. Gao et al. [32] constructed an evolutionary game model representing the cooperation between power battery production and recycling companies and government participation. They simulated the participants’ willingness and information barriers on the strategic choices of the three parties.

2.3. Government Subsidies for the Recycling Industry

The government plays an essential role in the sustainable development of the battery industry [33]. Government subsidies are essential for promoting industrial development and regulating the economy’s structure [10]. Chen et al. [34] prove that it is more effective to promote the recycling of EoL power batteries with government subsidies than without. Existing research has focused on analyzing the impact of government subsidies on the profits and decisions of supply chain members and the choice of optimal government strategies [35]. For example, Ding et al. [36] studied the effects of dismantling subsidies and collection subsidies on companies’ strategic choices. Ma et al. [37] compared the impact on supply chain members before and after government subsidies. They showed that manufacturers, consumers, and retailers are all beneficiaries of government subsidies. Shao et al. [38] constructed the framework of the optimal price discount rate and the optimal subsidy offered by the government to EV buyers. They found that the government prefers to subsidize consumers. Zhao et al. [39] developed a profit distribution model to analyze the profit distribution of supply chain members in the absence of government subsidies and in the presence of government subsidies. They found that the original profit-sharing status would change after the government subsidy was introduced into the model.
In conclusion, the government has noted that the power battery recycling industry can reap more benefits. The government’s policies are relatively broad, with most documents and policies being macrolevel guidance. Most of the Chinese government’s subsidy policies for the power battery industry are in an exploratory and pilot state. The power battery recycling industry is still at an early stage of industrial development. It is worth exploring whether the government is involved in power battery recycling and is providing the necessary subsidies to support recycling companies and consumers. However, the current research has neglected the problem that the government makes decisions first in the process of subsidies, while recycling companies and consumers make decisions later. Additionally, when subsidizing recycling companies and consumers, the government should consider which type of subsidy can achieve the goal of paying fewer costs to maximize the total benefits to society. These questions are the focus of this paper’s discussion.

3. Evolutionary Game Model for Both Recyclers and Consumers

3.1. Description of the Reality of the Situation

Manufacturers sell their vehicles to downstream retailers of NEVs, thus enabling retailers of NEVs to fully obtain information about consumers who buy NEVs. As battery manufacturers dominate the recycling battery industry chain, they use blockchain, QR codes, and other technologies to produce traceable batteries, enabling them to form a closed-loop recycling model of “production–sales–recycling” [31]. Under the extended producer system, retailers can recycle EoL products in three modes: outsourcing the process of collecting EoL power batteries to a third party, product manufacturers collecting EoL power batteries directly from customers, and manufacturers of power batteries encouraging NEV retailers to proactively collect EoL batteries from consumers through incentives [40]. Among them, recycling NEV batteries is more suitable for power battery retailers or NEV sales and service 4S shops, where the seller is the recycler [41].
In 2018, China’s Ministry of Industry and Information Technology issued the Interim Measures on the Management of Power Battery Recycling of NEVs. The document clarifies that automobile manufacturers are primarily responsible for power battery recycling. The recovered EoL power batteries will be transferred to regular power battery dismantling companies for echelon utilization and resource recycling [42]. Based on the actual situation, this paper assumes that recycling companies include power battery manufacturers, NEV manufacturers, and NEV retailers. This recycling model allows the construction of a complete recycling path to efficiently recycle EoL power batteries from NEVs. For the benefit of each, there is a game decision between companies and consumers.
As the source and starting point of EoL power battery recycling, the consumer has an essential influence on the recycling industry chain, whether or not this system uses formal recycling channels to send EoL batteries back to formal recycling companies. Consumers can choose between two strategies, participating in recycling or not. Participation in recycling involves consumers sending their EoL power batteries back to the NEV retailers, who then send them back to the upstream NEV manufacturers for battery material recycling or echelon utilization. In other words, consumers can recycle through formal recycling channels approved by the state and formal recycling companies. Consumers are more likely to participate in formal recycling if they are provided with convenient recycling services and higher recycling revenues, and they are motivated by environmental protection. Conversely, if the service provided to consumers is poor and the amount of recycling subsidies is less than if consumers sell their EoL batteries to informal workshops that offer higher prices, there is a risk that consumers will not participate in regulated recycling. Therefore, consumer behavior significantly influences whether companies actively participate in recycling. Businesses have both regulated and unregulated recycling behavioral strategies. However, companies operate their businesses mainly for profit as a rational subject. Because of the human, material and financial resources involved in the recycling process, companies weigh the value of active participation in the recycling process after calculating their net revenue. In an environment where there is no government involvement, it is presumed that there are only two game players in the market for the power battery recycling industry: recycling companies and consumers. Based on a study of the existing recycling industry [43], this paper constructs a game model between recycling companies and consumers in the power battery recycling industry without government subsidies.

3.2. Model Assumptions

Hypothesis 1.
In a “natural” environment without government involvement and other constraints, recycling companies and consumers form a complete system, assuming that the two sides of the game are power battery recycling companies and consumers. In an evolutionary game model, both players are at the initial stage, and no other players who may influence both players’ decisions are considered in the game process.
Hypothesis 2.
Due to asymmetric information, situational differences, and limitations in knowledge acquisition, the two groups of participants do not satisfy the assumption of complete rationality of traditional economics in the process of behavioral choices and strategy selection. However, each participant chooses the strategy with higher returns under the premise of limited rationality by continuous learning and imitation of other strategy choices to maximize their interests.
Hypothesis 3.
As the implementers of the extended producer system for battery recycling, NEV manufacturers can fulfill the responsibility of “selling one vehicle and recycling one EoL battery” when implementing regulated recycling. As a result, recycling companies incur certain expenses in overseeing the recycling process, such as transportation costs, product quality testing costs, storage costs, and labor costs. We define the cost involved above as C 1 , meaning that recycling companies also incur costs in unregulated process recycling C 2 . At the same time, recycling companies receive a certain amount of revenue from the recycling process, R 1 for regulated and R 2 for unregulated recycling. It is assumed that the cost of regulated recycling for recycling companies is greater than their cost of unregulated recycling and is defined as C 1 > C 2 . The benefits of regulated recycling for recycling companies are more significant than those of unregulated recycling companies and are defined as R 1 > R 2 .
Hypothesis 4.
When the consumer chooses not to participate in formal recycling, the consumer will sell the EoL power battery to a complete small workshop for a profit. We define the benefit to the consumer for not participating in formal recycling as R 4 . When the consumer participates in formal recycling, they receive more than just the financial benefits of selling their EoL power batteries. Participating in environmental initiatives also benefits both the environment and the consumer’s health, so the total benefit to the consumer of participating in formal recycling is defined as R 3 . At the same time, consumers incur certain costs when disposing of EoL power batteries; we define the cost of consumer participation in proper recycling as C 3 and the cost of not participating in formal recycling as C 4 . Additionally, we propose that consumers’ benefits from participating in formal recycling outweigh the benefits from not participating in formal recycling, which we define as R 3 > R 4 . The consumer’s cost of participating in formal recycling is greater than their cost of not participating in formal recycling, which we define as C 3 > C 4 . In addition, businesses’ intangible benefits from consumers adopting environmental measures are defined as B .

3.3. Constructing Evolutionary Game Models

The game strategies of recycling companies and consumers are as follows:
(a)
Recycling companies
Recycling companies will choose regulated recycling to dispose of EoL power batteries when the net benefit of regulated recycling is larger than the net benefit of unregulated recycling. When the net benefit of unregulated recycling is greater than that of regulated recycling, recyclers are more willing to hand EoL power batteries to small, informal workshops for a higher return. In this paper, we identify two strategies of recycling companies {regulated recycling, unregulated recycling} (RR,UR). The probability of choosing the two strategies in the group is x and 1 − x, respectively.
(b)
Consumers
When the net benefit of consumers choosing to participate in recycling is greater than the net benefit of not participating in recycling, consumers are more likely to send their EoL power batteries back to a formal recycling company and choose to participate in the recycling process. When consumers sell EoL power batteries to small workshops for an objective gain, consumers are more likely to choose not to participate in recycling. Therefore, this paper proposes two strategies for consumers {participate, not participate} (P, NP), and the probabilities of the two strategies are y and 1 − y, respectively.

4. Equilibrium Analysis of the Evolutionary Game

4.1. Expected Earnings

Based on the above assumptions, the behavioral strategy set of the recycling company is {RR,UR}, and the behavioral strategy set of the consumer is {P,NP}. Each side has two strategies, so the system has four strategy combinations. The payoff matrix for both participants under different strategies is shown in Table 1.

4.2. Evolutionary Stable Strategy Based on the Replicated Dynamic Function

We assume that U x is the expected return for recycling companies choosing regulated recycling, U 1 x is the expected return for choosing unregulated recycling, and U x ¯ is the average expected profit. Then,
U x = y ( R 1 C 1 R 3 + B ) + ( 1 y ) ( R 2 C 1 ) = y ( R 1 R 2 R 3 + B ) + R 2 C 1
U 1 x = y ( R 2 C 2 ) + ( 1 y ) ( R 2 C 2 ) = R 2 C 2
U x ¯ = x U x + ( 1 x ) U 1 x
The replicated dynamic equations of recycling companies choosing regulated recycling methods for EoL power batteries are
F ( x ) = d x d t = x ( U x U x ¯ ) = x ( 1 x ) ( U x U 1 x ) = x ( 1 x ) [ y ( R 1 R 2 R 3 + B ) C 1 + C 2 ]
We assume that U y is the expected return for consumers who participate in recycling, U 1 y is the expected return for those who choose not to participate in recycling, and U y ¯ is the average expected profit. Then,
U y = x ( R 3 C 3 ) + ( 1 x ) ( R 4 C 3 ) = x ( R 3 R 4 ) + R 4 C 3
U 1 y = x ( R 4 C 4 ) + ( 1 x ) ( R 4 C 4 ) = R 4 C 4
U y ¯ = y U y + ( 1 y ) U 1 y
The replicated dynamic equations of consumers choosing to participate in the recycling method for EoL power batteries are
F ( y ) = d y d t = y ( U y U y ¯ ) = y ( 1 y ) ( U y U 1 y ) = y ( 1 y ) [ x ( R 3 R 4 ) C 3 + C 4 ]
The replicated dynamic equations of this system are
{ F ( x ) = d x d t = x ( U x U x ¯ ) = x ( 1 x ) ( U x U 1 x ) = x ( 1 x ) [ y ( R 1 R 2 R 3 + B ) C 1 + C 2 ] F ( y ) = d y d t = y ( U y U y ¯ ) = y ( 1 y ) ( U y U 1 y ) = y ( 1 y ) [ x ( R 3 R 4 ) C 3 + C 4 ]

4.3. Stability Analysis of the Equilibrium Strategy

(a)
Stability analysis of the recycling companies’ strategy
The derivative of F ( x ) gives F ( x ) = ( 1 2 x ) [ y ( R 1 R 2 R 3 + B ) C 1 + C 2 ] . When y = C 1 C 2 R 1 R 2 R 3 + B , then F ( x ) = 0 is constant for any value of x . Thus, when 0 x 1 , all the fetching points are in a steady state. When y > C 1 C 2 R 1 R 2 R 3 + B and x = 1 , then F ( 1 ) < 0 . Show that x = 1 is the recycling company’s stabilization strategy. The recycling company chooses to regulate recycling as the system evolves and over time. When y < C 1 C 2 R 1 R 2 R 3 + B and x = 0 , then F ( 0 ) < 0 . Show that x = 0 is the recycling company’s stabilization strategy. As the system evolves and time goes on, recycling companies choose unregulated recycling.
(b)
Stability analysis of the consumer’ strategy
The derivative of F ( y ) yields F ( y ) = ( 1 2 y ) [ x ( R 3 R 4 ) C 3 + C 4 ] . When x = C 3 C 4 R 3 R 4 , then F ( y ) = 0 is constant for any value of y . When 0 y 1 , all the value points are in a steady state. When x > C 3 C 4 R 3 R 4 and y = 1 , then F ( 1 ) < 0 . y = 1 is the consumer’s stabilization strategy. The consumer chooses to participate in recycling as the system evolves and time goes on. When x < C 3 C 4 R 3 R 4 and y = 0 , then F ( 0 ) < 0 , indicating that y = 0 is a stable strategy for the consumer. As the system evolves and time goes on, consumers choose not to participate in recycling.
(c)
Stability analysis of the hybrid strategy
Letting F ( x ) = 0 and F ( y ) = 0 , one obtains that there are five equilibrium points of the two-sided game system in plane i = { ( x , y ) | 0 x 1 , 0 y 1 } that replicate the dynamic equations, and they are ( 0 , 0 ) , ( 0 , 1 ) , ( 1 , 0 ) , ( 1 , 1 ) , ( x 0 , y 0 ) . Among them, x 0 = C 3 C 4 R 3 R 4 , y 0 = C 1 C 2 R 1 R 2 R 3 + B . ( x 0 , y 0 ) is likely to be a stable equilibrium of the system when and only when 0 C 3 C 4 R 3 R 4 1 and 0 C 1 C 2 R 1 R 2 R 3 + B 1 .
According to the Friedman method, it is possible to determine whether a particular equilibrium is an evolutionary stable strategy (ESS). Based on the stability principle of differential equations, the eigenvalues of the Jacobi matrix of the system of differential equations are solved. Equilibrium is an evolutionarily stable strategy when it satisfies that the determinant of the Jacobi matrix is more significant than zero and the trace is less than zero, det J > 0 , t r J < 0 [44]. The replicated dynamic equations are derived separately for x and y to give the Jacobi matrix as:
J = [ a 11 a 12 a 21 a 22 ] = [ ( 1 2 x ) [ y ( R 1 R 2 R 3 + B ) C 1 + C 2 ] x ( 1 x ) ( R 1 R 2 R 3 + B ) y ( 1 y ) ( R 3 R 4 ) ( 1 2 y ) [ x ( R 3 R 4 ) C 3 + C 4 ] ]
The determinant of the Jacobi matrix can be obtained as
det J = a 11 a 22 a 12 a 21 = ( 1 2 x ) [ y ( R 1 R 2 R 3 + B ) C 1 + C 2 ] ( 1 2 y ) [ x ( R 3 R 4 ) C 3 + C 4 ] x ( 1 x ) ( R 1 R 2 R 3 + B ) y ( 1 y ) ( R 3 R 4 )
The trace of the Jacobi matrix can be obtained as
t r J = a 11 + a 22 = ( 1 2 x ) [ y ( R 1 R 2 R 3 + B ) C 1 + C 2 ] + ( 1 2 y ) [ x ( R 3 R 4 ) C 3 + C 4 ]
Friedman considers the point to be an ESS when the determinant and trace of the Jacobi matrix satisfy conditions det J > 0 , t r J < 0 . When conditions det J > 0 , t r J > 0 are satisfied, the point is unstable in the system’s evolution. When conditions det J < 0 , t r J = 0 or t r J are uncertain, the point is a saddle point in the system’s evolution. By changing the position of the saddle point, the evolutionary path of the system can be guided. The five equilibrium points mentioned above are brought into the Jacobi matrix separately, and the determinant and trace of the point are solved for. The expressions for the determinant and trace for each point are shown in Table 2.
Based on the above calculation results, the evolutionary stabilization strategy equilibrium points are discussed by the situation, and the results are shown in Table 3. Since t r J = 0 at equilibrium point ( x 0 , y 0 ) , this point is a saddle point in any case.
From the above analysis, we conclude that:
Scenario 1: When R 1 R 2 R 3 + B C 1 + C 2 > 0 and R 3 R 4 C 3 + C 4 > 0 , the evolutionary stabilization strategies of the system are (0, 0) and (1, 1).
Scenario 2: When R 1 R 2 R 3 + B C 1 + C 2 < 0 and R 3 R 4 C 3 + C 4 < 0 , the evolutionary stabilization strategy of the system is (0, 0).
Scenario 3: When R 1 R 2 R 3 + B C 1 + C 2 < 0 and R 3 R 4 C 3 + C 4 > 0 , the evolutionary stabilization strategy of the system is (0, 0).
Scenario 4: When R 1 R 2 R 3 + B C 1 + C 2 > 0 and R 3 R 4 C 3 + C 4 < 0 , the evolutionary stabilization strategy of the system is (0, 0).
When the net benefit of the positive behavior of both parties is greater than the negative behavior and the probability of the recycling company choosing to regulate recycling and the consumer choosing to participate in recycling is high, the stability strategy of the system can be found to be (1, 1). When the net benefit of the positive behavior of one or both parties is less than the net benefit of negative behavior, the stabilization strategy of the system is (0, 0). However, the market cannot guarantee higher returns for both parties simultaneously without government subsidy policies in practice. It is difficult to achieve cooperation between recyclers and consumers in recycling EoL power batteries, thus reducing the probability of both parties choosing a positive recycling method simultaneously. This development trend deviates from the direction of national macro policy.

4.4. Numerical Simulation

To clearly and intuitively demonstrate the impact of changes in the parameters of recycling companies and consumers on the evolutionary path of the system, this paper uses MATLAB to carry out simulations. The parameter values are assigned concerning the actual recycling situation of the companies and the simulation data of existing research results so that the parameter settings are more relevant to the actual situation [8,31,43,45]. Set R1 = 5, C1 = 1.2, R2 = 1.2, C2 = 0.1, R3 = 3, C3 = 1, R4 = 1.7, C4 = 0.1 and B = 1. The value of the parameter is positive, and the unit is 10,000 yuan/ton. x = 0.5 and y = 0.5 are set as the initial state and the effect of changing parameters on the system’s trend and evolution by changing the parameters’ values. We analyze how the main parameters can be varied to achieve the ideal state of the system.
(a)
Impact of changes in R1 and R3 on evolutionary pathways
With the other parameters assigned unchanged, let R1 = 4.5 and R3 = 2.7 for comparison Group 1 and R1 = 6 and R3 = 4 for comparison Group 2. The effect of changes in R1 and R3 on the evolutionary trend of both sides is shown in Figure 1.
As R1 and R3 increase, the probability of recycling companies adopting regulated recycling is higher, and the probability of consumers participating in proper recycling is also high, eventually reaching the ideal state of (1, 1). When recycling companies and consumers adopt a positive recycling approach, both parties obtain higher benefits than a negative recycling approach, so both of them are more willing to participate in the recycling process with a positive attitude. Conversely, it is difficult for both parties to move toward the ideal state of affairs when there is no revenue guarantee for either recycling companies or consumers. Suppose there are only two parties in the market, recycling companies and consumers. Because of market volatility, it is difficult to ensure that both recycling companies and consumers simultaneously receive a high level of benefit. Therefore, the government can adopt certain subsidies to increase the revenue of both parties to regulate recycling and can drive the system toward the ideal state.
(b)
Impact of changes in C1 and C3 on evolutionary pathways
With the other parameters assigned unchanged, let C1 = 0.7 and C3 = 0.5 for comparison Group 1 and C1 = 1.7 and C3 = 1.2 for comparison Group 2. The effect of changes in C1 and C3 on the evolutionary trend of both sides is shown in Figure 2.
When C1 and C3 are decreased, the probabilities of recycling companies adopting regulated recycling and consumers adopting participation in formal recycling are higher, eventually reaching the ideal state of (1, 1). When recycling companies and consumers take the right approach to recycling, if the cost of disposal is too high, it will reduce the incentive for both parties to take active measures. Conversely, the system can only move toward the ideal state if the government subsidizes the companies and consumers who implement proactive recycling practices to reduce the cost of proactive recycling. Otherwise, it will be challenging to reduce the cost of recycling for both companies and consumers, and it will not be possible to promote the recycling of EoL batteries for resource recovery and environmental protection.
(c)
Impact of changes in R2 and R4 on evolutionary pathways
With the other parameters assigned unchanged, let R2 = 0.3 and R4 = 0.5 for comparison Group 1 and R2 = 1.8 and R4 = 2 for comparison Group 2. The effect of changes in R2 and R4 on the evolutionary trend of both sides is shown in Figure 3.
When R2 and R4 decrease, the probabilities of recycling companies adopting regulated recycling and consumers adopting participation in formal recycling are higher, eventually reaching the ideal state of (1, 1). The system can be promoted toward the ideal state when the government imposes specific penalties on companies and consumers who implement negative recycling practices.
(d)
Impact of changes in C2 and C4 on evolutionary pathways
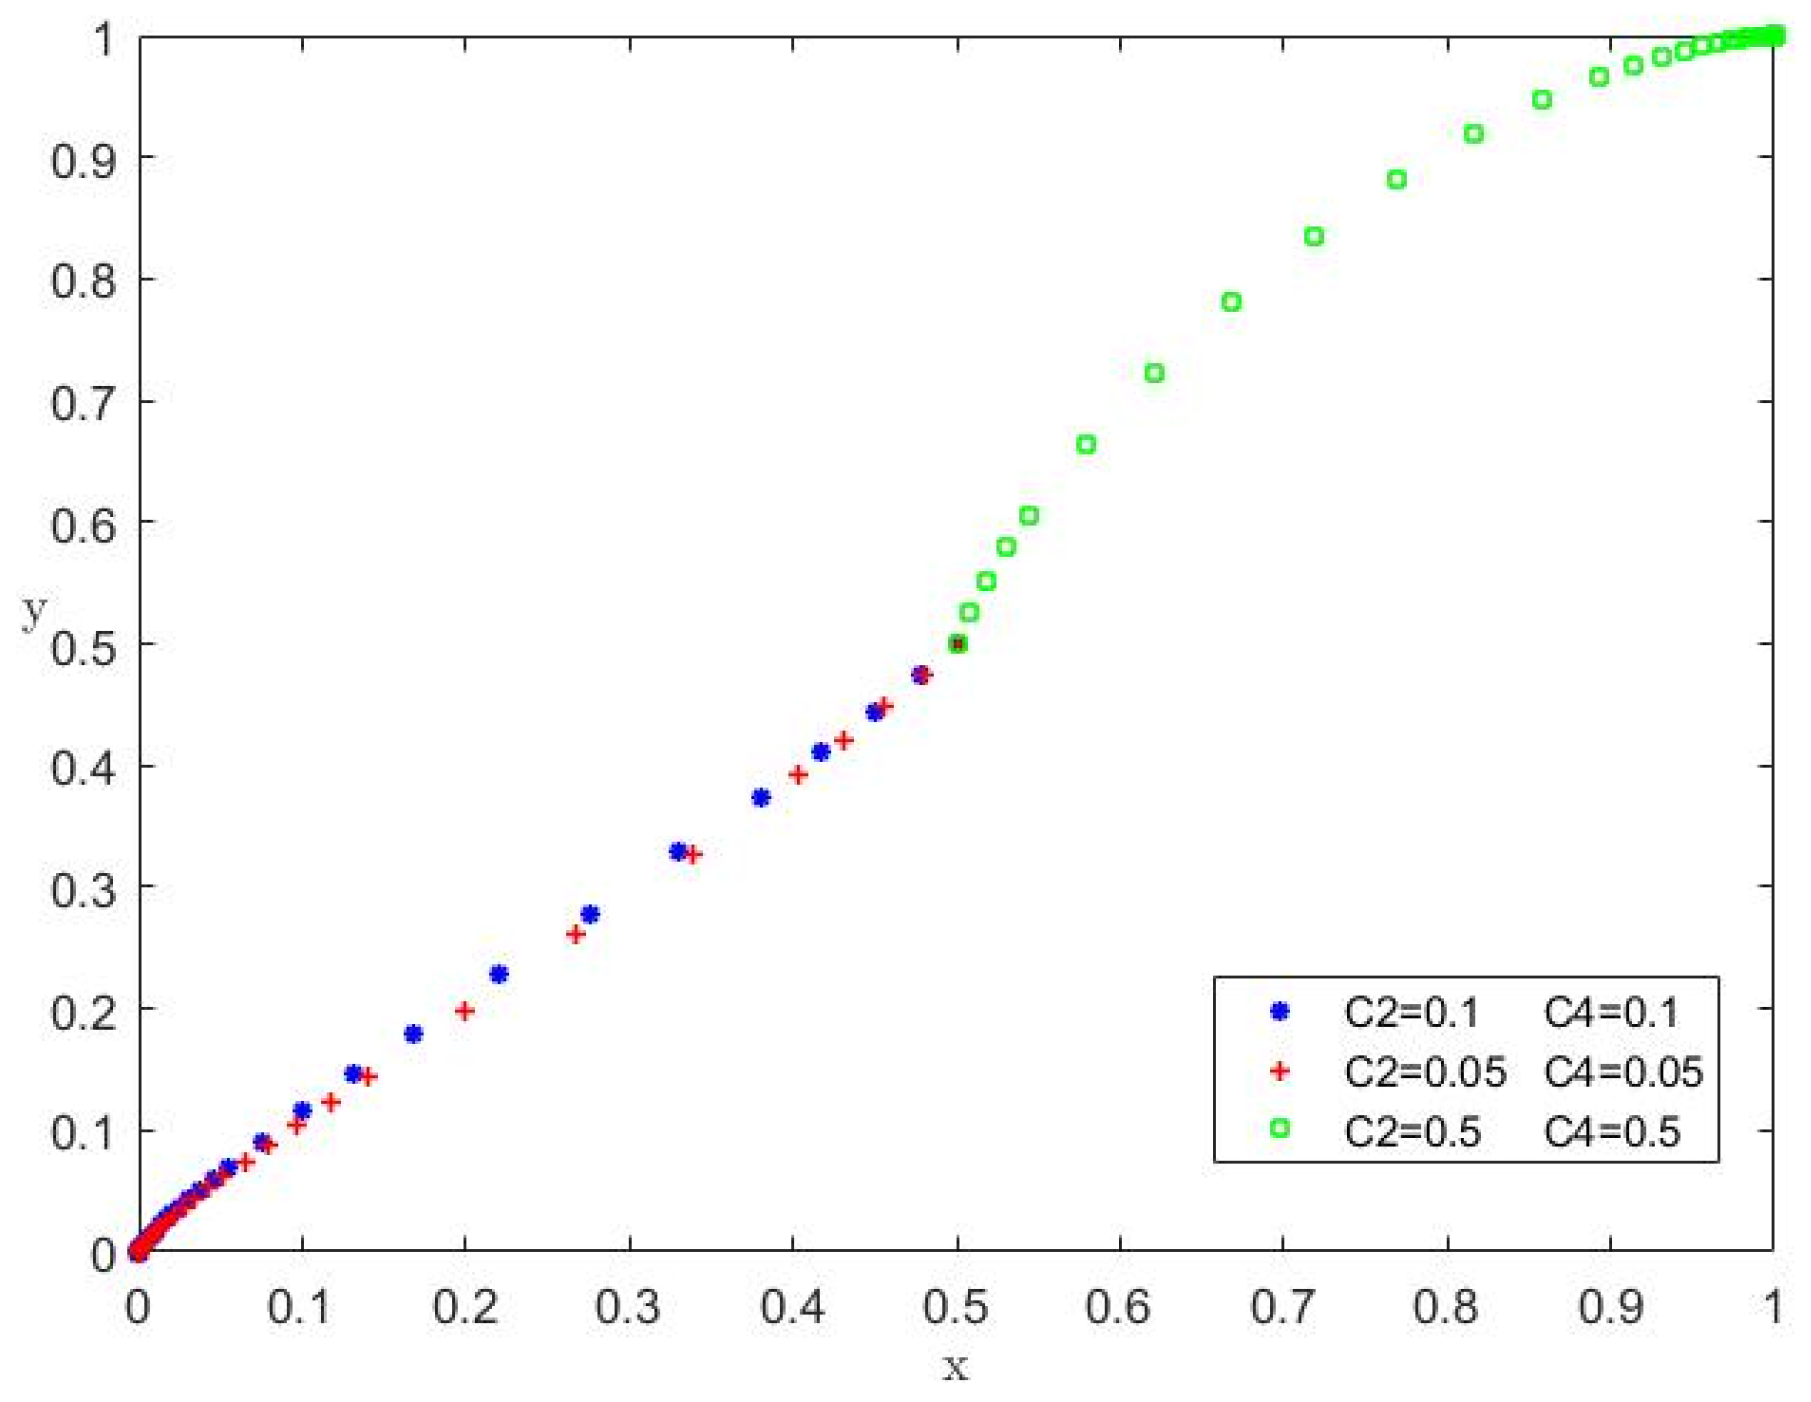
With the other parameters assigned unchanged, let C2 = 0.05 and C4 = 0.05 for comparison Group 1 and C2 = 0.5 and C4 = 0.5 for comparison Group 2. The effect of changes in C2 and C4 on the evolutionary trend of both sides is shown in Figure 4.
As C2 and C4 increase, the probabilities of recycling companies adopting regulated recycling and consumers adopting participation in formal recycling are higher, eventually reaching the ideal state of the recycling process. When recycling companies and consumers take a negative approach to recycling, both parties pay a higher cost than when they take a positive approach, so both parties are more willing to participate in the recycling process with a positive attitude. Therefore, the government can adopt certain penalties to increase both parties’ cost of adopting unregulated recycling methods and, thus, help the system to develop toward the ideal state.
(e)
Impact of changes in B on evolutionary pathways
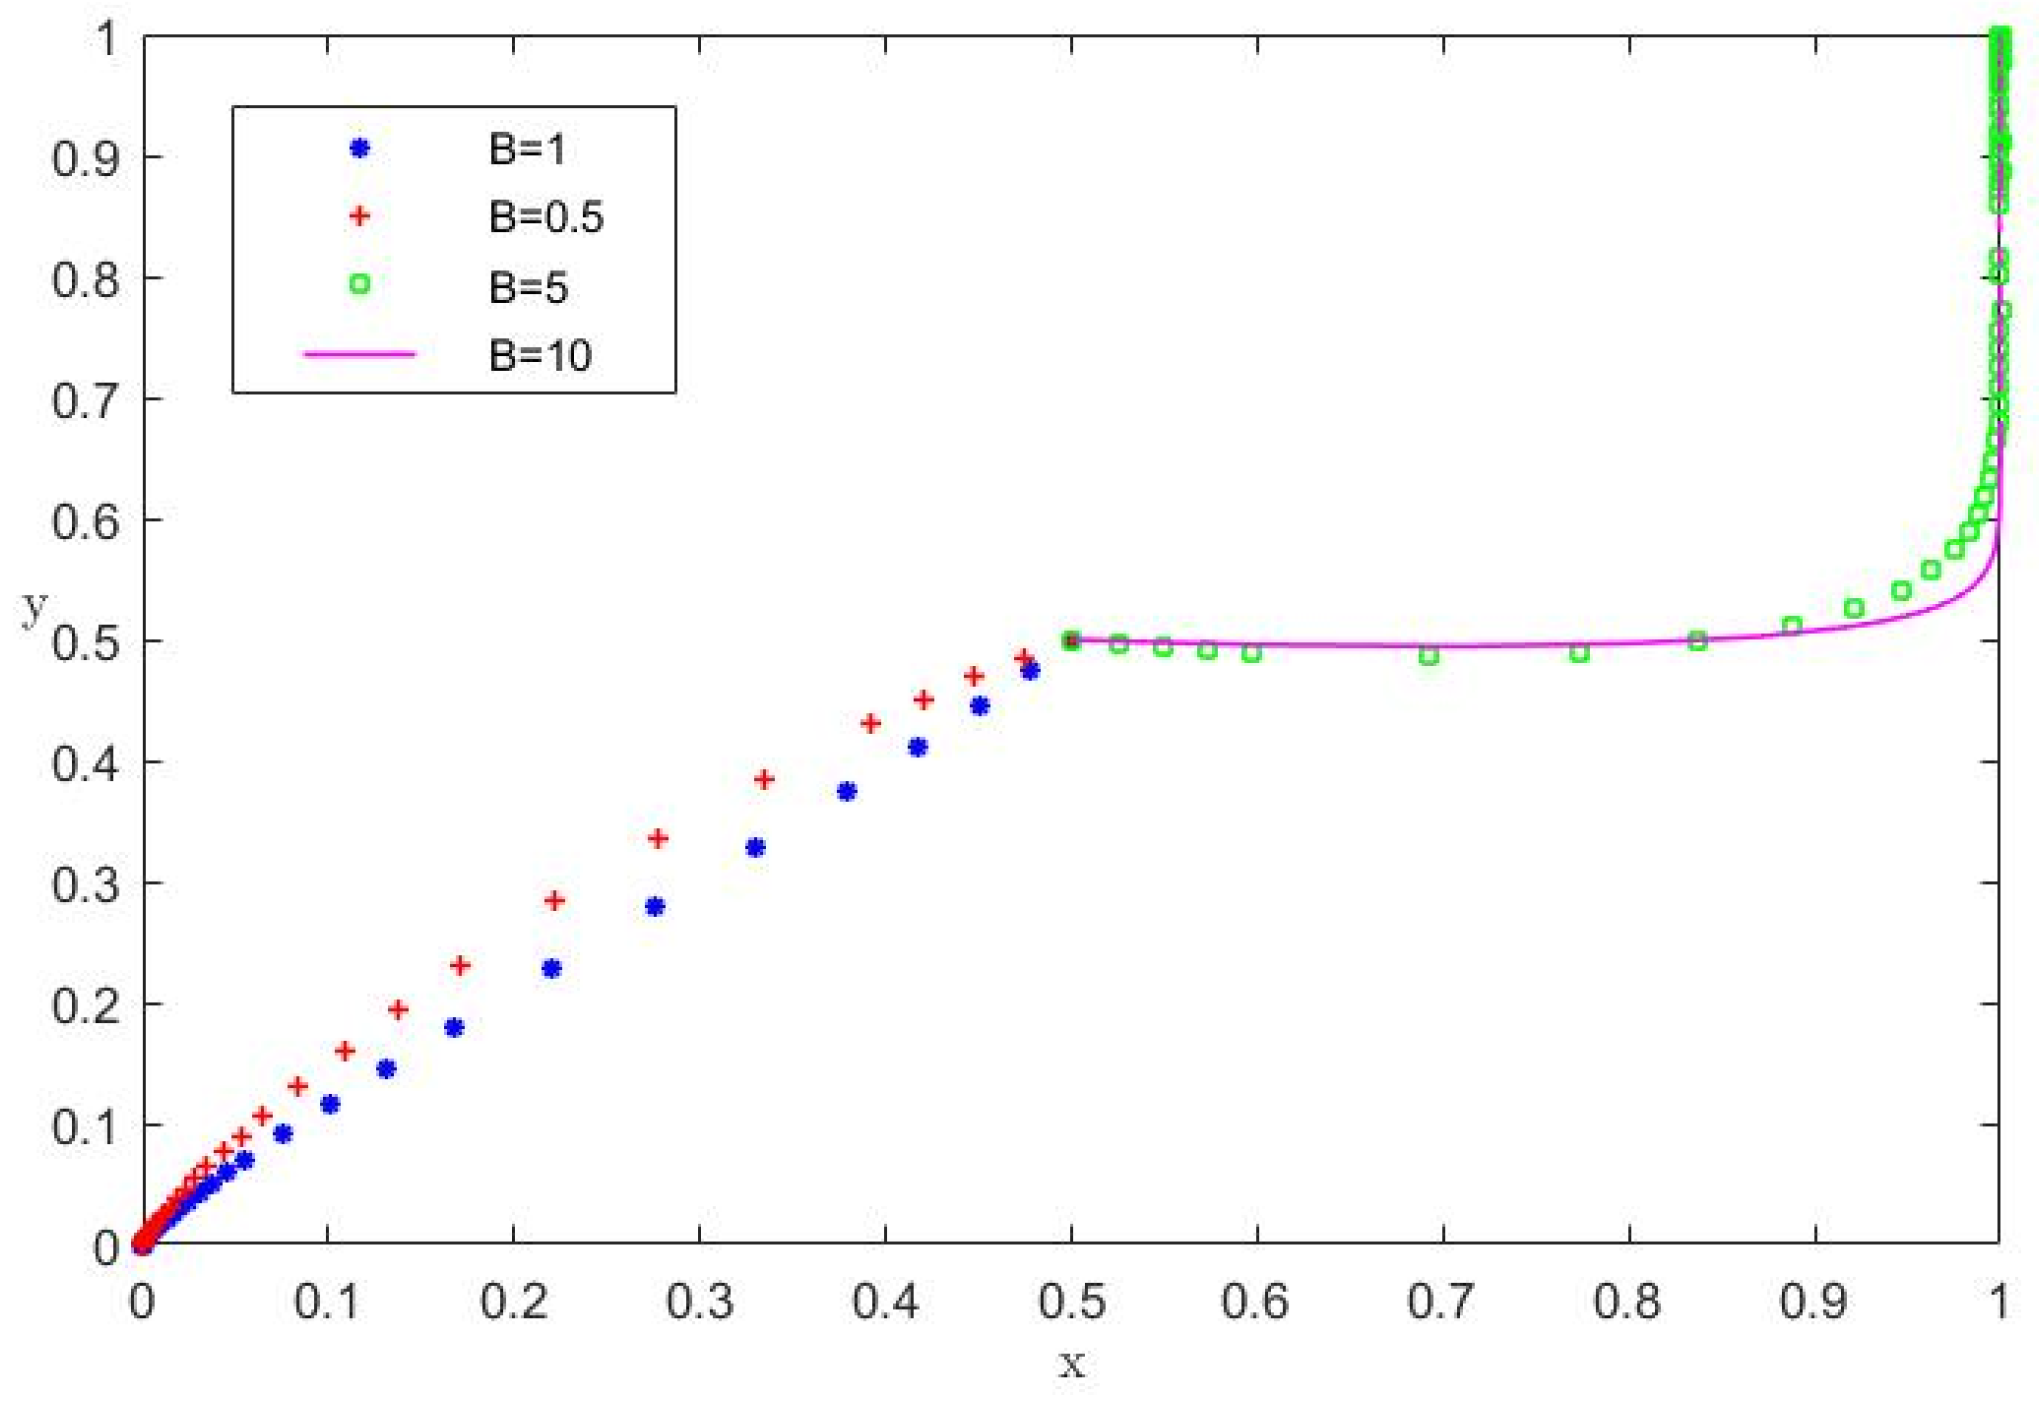
With the other parameters assigned unchanged, let B = 0.5 for comparison Group 1, B = 5 for comparison Group 2, and B = 10 for comparison Group 3. The effect of changes in B on the evolutionary trend of both sides is shown in Figure 5.
As the intangible benefits to businesses from consumers taking environmentally friendly measures increase, the benefits to recycling businesses and the probability of recycling businesses choosing regulated recycling will increase. As the value of B becomes larger, the system evolves to (1, 1) and converges more quickly, driving recycling companies to be more willing to participate in regulated recycling. In addition, there is no significant effect on consumers’ evolutionary path and speed of convergence, as the intangible benefits to companies from consumers taking environmental measures increase. This phenomenon is due to the increased intangible benefits to recycling businesses from consumer participation in formal recycling, but it has little impact on the benefits to consumers. Therefore, the increased intangible benefits to businesses from consumers taking environmental measures will not promote consumer participation in formal recycling.

5. The Choice of Optimal Government Subsidy Strategy

There are certain externalities associated with the governance of the environment as a public good. The government plays a vital role in the governance of public goods since it is difficult for economic agents to solve problems rationally [46]. China’s NEV EoL power battery recycling industry is relatively underdeveloped, and government intervention is necessary. As the new industry is affected by inevitable market failures, externalities, and information asymmetries, government intervention can effectively reduce the instability in the development of the industry. An essential role of the government is to facilitate the healthy and rapid development of the industry. As a result of simulation analysis, we find that the system can evolve toward the ideal state of (1, 1) either by increasing the revenue of recycling companies and the revenue of consumers who participate in recycling or by reducing the costs borne by recycling companies and consumers who participate in recycling. In fact, the government’s incentives for the EoL power battery industry are primarily subsidy-based, which can effectively promote the industry’s evolution toward sustainability [47]. Therefore, the government intends to find a subsidy approach that maximizes the overall welfare of society at the lowest possible cost. However, existing studies have not examined the impact of different subsidy approaches on the net benefits to society from the government’s perspective.

5.1. Description of the Reality of the Situation

It is difficult to reasonably recycle EoL power batteries in a system built by recycling companies and consumers, relying only on market regulation. As a result, government policy tools should encourage recycling companies to regulate recycling and consumers to participate in recycling. Current research highlights the importance of government involvement in the recycling process [8]. The government may facilitate policy implementation by providing subsidies to recycling companies and consumers. There are three types of incentives: subsidizing recycling companies alone, consumers alone, and both recycling companies and consumers. To increase the incentive for recycling companies to participate in regulated recycling, government subsidies are an effective way to reduce the high costs incurred by recycling companies in the process. Government subsidies can encourage consumers to return EoL power batteries through policy incentives such as trade-ins and recycling subsidies. To encourage consumers to participate in regulated recycling, different types of subsidies are available. This approach will help recycling companies fulfill the comprehensive producer system of “sell a battery, recycle a battery”. China has introduced several pilot policies at present. For example, in 2018, the Shenzhen Development and Reform Commission issued the “Shenzhen 2018 Financial Support Policy for the Promotion and Application of New Energy Vehicles”. The policy points out that NEV manufacturers bear the main responsibility for power battery recycling, and a standard of 20 yuan/kWh is specifically accrued for power battery recycling and treatment funds. Under the actual situation, this paper constructs a three-party game model of power battery recycling governance under government subsidies.

5.2. Three-Party Game Model

There are three types of government subsidies: a single subsidy for recycling companies, a single subsidy for consumers, and a subsidy for both recycling companies and consumers. Among the above parameters, we define the government subsidy to recycling companies as S1 and the government subsidy to consumers as S2. When both recycling companies and consumers participate in active recycling, there are certainly environmental benefits for both parties, defined as E.
The government wants to change the strategic choice of recycling companies and consumers from (0, 0) to (1, 1) using subsidies. In the absence of government subsidies, the total benefits ( T B 1 ) in the (0, 0) state are the sum of the benefits to recycling companies and consumers at (0, 0), T B 1 = R 2 C 2 + R 4 C 4 . Similarly, the total benefits ( T B 2 ) at (1, 1) are T B 2 = R 1 C 1 + B C 3 + E . The purpose of government subsidies is to increase the net social benefits ( N S B ). Therefore, the NSB raised by government subsidies to move recycling companies from unregulated to regulated recycling and consumers from not participating to participating in recycling is expressed as follows:
N S B = T B 2 T B 1 = R 1 C 1 + B C 3 + E R 2 + C 2 R 4 + C 4

5.3. Analysis of the Optimal Subsidy Strategy

As a rational subject, the government will only introduce a subsidy policy if the net benefit to society is more significant than the subsidy paid. Otherwise, the government will choose not to introduce related policies to promote the development of the power battery recycling industry due to regulatory costs and payment costs. Therefore, this paper uses a case study to explore how the government can pay the lowest subsidy amount among the three types of subsidies to achieve the goal of enhancing the net social benefits.
(a)
Subsidy policy analysis for scenario 1
The system’s stable strategies under scenario 1 are (0, 0) and (1, 1), respectively. The system will eventually move toward (1, 1) only if the probability of recycling companies regulating recycling and consumers participating in recycling are both high. By providing some subsidies to both parties, the government can effectively increase the probability of both parties choosing positive behavior, thus promoting the system toward (1, 1).
(b)
Subsidy policy analysis for scenario 2
The stabilization strategy of the system under the conditions of scenario 2 is (0, 0). At this point, the net benefit of regulated recycling for recycling companies is less than their net benefit of unregulated recycling, and the net benefit of consumers choosing to participate in formal recycling is less than their net benefit of choosing not to participate in formal recycling. Therefore, the government chooses to subsidize both the recycling companies and the consumers to make the net benefit of regulated recycling for recycling companies greater than their net benefit of unregulated recycling and the net benefit of consumers choosing to participate in proper recycling greater than their net benefit of choosing not to participate in formal recycling. Then, at this point, the government subsidy S1 to recycling companies and the government subsidy S2 to consumers should satisfy that the net social benefit is not less than the sum of the government subsidies to both parties, N S B S 1 + S 2 = T B 2 T B 1 S 1 + S 2 .
(c)
Subsidy policy analysis for scenario 3
The stabilization strategy of the system under the conditions of scenario 3 is (0, 0). At this point, the net benefit of regulated recycling for recycling companies is smaller than their net benefit of unregulated recycling, and the net benefit of consumers choosing to participate in formal recycling is larger than their net benefit of choosing not to participate in formal recycling. Therefore, the government’s choice to subsidize recycling companies is what allows their net benefits of regulated recycling to be greater than their net benefits of unregulated recycling. Therefore, the government subsidy S1 to the recycling company should satisfy the assumption that the net social benefit is no less than the amount of the subsidy to the recycling company, N S B S 1 = T B 2 T B 1 S 1 .
(d)
Subsidy policy analysis for scenario 4
The stabilization strategy of the system under the conditions of scenario 4 is (0, 0). At this point, the net benefit of recycling companies regulating recycling is greater than their net benefit of not regulating recycling, and the net benefit of consumers choosing to participate in formal recycling is less than their net benefit of choosing not to participate in formal recycling. Therefore, the government’s choice to subsidize consumers allows the net benefit of consumers participating in formal recycling to be greater than their net benefit of choosing not to participate in formal recycling. Therefore, the government subsidy S2 to recycling consumers should satisfy that the net social benefit is not less than the amount of the government subsidy to consumers, N S B S 2 = T B 2 T B 1 S 2 .

5.4. Case Study

Based on the actual situation and existing research results [31,43], scenarios 2, 3, and 4 were assigned values so that the number of subsidies to be paid by the government for the implementation of the three subsidy policies could be calculated, with the initial values set by the specific model. Based on the different scenario conditions, we calculate the subsidy amounts for different subsidy policies, and we assume that E = 1.1. Scenario 2 conditions, the data assignment is R1 = 3.5, C1 = 1.2, R2 = 1.2, C2 = 0.1, C3 = 1.5, R4 = 1.7, C4 = 0.1, B = 1, E = 1.1. Scenario 3 conditions, the data assignment is R1 = 3.5, C1 = 1.2, R2 = 1.2, C2 = 0.1, C3 = 1, R4 = 1.7, C4 = 0.1, B = 1, E = 1.1. Scenario 4 conditions, the data assignment is R1 = 5, C1 = 1.2, R2 = 1.2, C2 = 0.1, C3 = 1.5, R4 = 1.7, C4 = 0.1, B = 1, E = 1.1.
The calculation shows that the subsidy paid by the government in Scenario 2 is S 1 + S 2 = 0.2 , in Scenario 3 is S 1 = 0.7 , and in Scenario 4 is S 2 = 1.7 . Theoretically, a single government subsidy to recycling companies is equivalent to S 2 = 0 , and a single government subsidy to consumers is equivalent to S 1 = 0 . In other words, the single subsidy approach is equivalent to adding a constraint to the party that does not receive the subsidy, so the simultaneous subsidy approach is theoretically better, and the case study results prove this point. Therefore, the amount to be paid for both types of subsidies is greater than the amount for both recycling companies and consumers. Therefore, we find that the government pays the lowest subsidy of the three types of subsidies when choosing a policy that subsidizes both recycling companies and consumers. The government can pay a lower cost to obtain a higher net social benefit, thus promoting a convergence toward (1, 1) for both recycling companies and consumers.

6. Conclusions and Policy Recommendations

6.1. Conclusions

In order to achieve the two goals of “carbon neutrality” and “carbon peaking”, countries around the world have accelerated the layout of the green energy industry. With the support of government policies, NEVs are developing rapidly as clean transportation, and the green transformation of the auto industry has become a mainstream trend. It is expected that NEVs will generate many EoL power batteries. Governments are gradually paying attention to the environmental, resource, social, and health hazards of EoL power batteries. However, the power battery recycling industry is still in its infancy, and the existing recycling policy and the system must fully meet market demand. This paper takes the NEV power battery recycling industry as the research object and constructs an evolutionary game model between “recycling companies and consumers” without government intervention. Considering that the government acts before recycling companies and consumers, this paper introduces government subsidies based on the game model of both sides and studies the optimal government subsidies. The findings of the study are as follows.
(1)
Under no government intervention, recycling companies and consumers cannot effectively recycle EoL power batteries. When the net benefit of positive behavior of one or both parties is smaller than the net benefit of negative behavior, the system eventually evolves to {recycling companies do not regulate recycling, consumers do not participate in recycling}.
(2)
Increasing the benefits of positive recycling, the costs of negative recycling, and indirect benefits of both parties, or decreasing the benefits of negative recycling and the costs of positive recycling of both parties, will facilitate the system to eventually evolve to {recycling companies regulate recycling, consumers participate in recycling}.
(3)
Government subsidies can promote recycling companies and consumers to actively recycle EoL power batteries. The government hopes to achieve the goal of optimal total social gain by employing subsidies. However, the government will only act if the net benefit to society is greater than the subsidy paid by the government. Therefore, this paper evaluates the effects of three subsidies: a single subsidy to recycling companies, a single subsidy to consumers, and a simultaneous subsidy to both recycling companies and consumers. The case study results show that the government’s subsidizing of recycling companies and consumers work best.

6.2. Policy Recommendations

Based on the study results, the following policy recommendations are proposed to better recycle EoL power batteries, protect resources, and reduce environmental pollution.
Government subsidies should be tilted toward consumers, so that recycling companies and consumers are subsidized at the same time. However, the pilot policies introduced by the Chinese government currently focus on single subsidies for recycling companies. There are two main reasons for this phenomenon. On the one hand, in the early stages of the industry’s development, the government can have more comprehensive information on the companies to facilitate centralized regulation. On the other hand, it is cheaper for the government to regulate recycling companies. However, with many consumers, it is difficult for the government to obtain comprehensive information on consumer purchases and track EoL power batteries promptly. Therefore, there is currently little subsidy policy for consumers. With the improvement of the power battery tracking system, the government directly subsidizes consumers. Through this kind of subsidy, the government can pay a lower cost to realize the goal of maximizing the overall welfare of society. At the same time, the government should disseminate more knowledge about environmental protection and waste disposal to consumers to increase their motivation to participate. In conclusion, governments should introduce policies to support companies that handle renewable power battery recycling to optimize the structure of the power battery recycling industry and achieve the goal of balanced economic growth and environmental protection. The results of this paper provide a basis for government policy. However, the model does not consider the costs incurred in the process of government subsidies. In future studies, researchers can further discuss the impact of government subsidy costs on policy implementation based on this study.
As critical members with a wealth of recycling information, recycling companies should move toward a green and sustainable national future. Recycling companies should strictly enforce the requirements of the extended producer system and encourage consumers to return used power batteries to their companies. In addition, recycling companies should build a comprehensive and high-quality recycling service platform for consumers to improve their image and influence. At the same time, communication and coordination between upstream and downstream recycling companies should be strengthened. The echelon utilization companies should try to cooperate with the NEV companies to establish a perfect recycling system to improve recycling efficiency. The whole recycling industry is gradually developing in the direction of upstream and downstream integration. Battery remanufacturing companies should invest in recycling technology for used power batteries. If used power batteries are only disposed of in landfills, incinerators, and other common waste disposal methods, they will also cause serious environmental pollution. Remanufacturing companies can effectively reduce these problems by optimizing their recycling technology. Currently, many companies apply for the qualification of formal recycling companies. The industry will grow rapidly as the number of formal recycling companies increases. In addition, retailers of NEVs are taking advantage of the “double carbon” backdrop to advertise and promote the benefits of NEVs and raise consumer awareness. Retailers of NEVs should educate consumers about power battery recycling and formal recycling channels. Through incentives, consumers are encouraged to actively participate in the recycling process.
Consumers play a key role as the source of waste power battery recycling and the starting point of the recycling channel. With the government strongly advocating a green, low-carbon, and clean lifestyle, consumers are becoming aware of the importance of environmental protection. Consumers are concerned that the improper disposal of EoL power batteries is harmful to their health, damaging the ecological environment, and that it is a waste of resources. Therefore, both the government and recycling companies should popularize more environmental protection concepts and waste disposal knowledge to consumers to increase their participation. In the future, government subsidies will encourage consumers to participate in formal recycling. It is foreseeable that, in the future, the recycling of power batteries will be a rapidly developing area in countries around the world, and the future market for recycling EoL power batteries is promising.

Author Contributions

Methodology, J.N.; Formal analysis, Y.W.; Data curation, J.N.; Writing—original draft, Y.W.; Writing—review & editing, E.W.; Supervision, E.W.; Funding acquisition, E.W. All authors have read and agreed to the published version of the manuscript.

Funding

The research leading to these results received funding from Shanghai Municipal Education Commission under Grant Agreement No. 20CG70.

Institutional Review Board Statement

Not applicable.

Data Availability Statement

The data used in this paper refer to the simulation data based on existing studies, and the references have been cited in the original paper.

Conflicts of Interest

The authors declare no conflict of interest.

References

  1. Habib, K.; Hansdóttir, S.T.; Habib, H. Critical metals for electromobility: Global demand scenarios for passenger vehicles, 2015–2050. Resour. Conserv. Recycl. 2020, 154, 104603. [Google Scholar] [CrossRef]
  2. Xiong, S.; Ji, J.; Ma, X. Environmental and economic evaluation of remanufacturing lithium-ion batteries from electric vehicles. Waste Manag. 2020, 102, 579–586. [Google Scholar] [CrossRef] [PubMed]
  3. IEA Global Supply Chains of EV Batteries. Available online: https://www.iea.org/reports/global-supply-chains-of-ev-batteries (accessed on 14 August 2022).
  4. IEA Global EV Outlook 2022. Available online: https://www.iea.org/reports/global-ev-outlook-2022 (accessed on 14 August 2022).
  5. Ghosh, A.; Jha, J.K.; Sarmah, S.P. Optimal lot-sizing under strict carbon cap policy considering stochastic demand. Appl. Math. Model. 2017, 44, 688–704. [Google Scholar] [CrossRef]
  6. Pavlovic, J.; Marotta, A.; Ciuffo, B. CO2 emissions and energy demands of vehicles tested under the NEDC and the new WLTP type approval test procedures. Appl. Energy 2016, 177, 661–670. [Google Scholar] [CrossRef]
  7. Sun, S.; Zhao, G.; Wang, T.; Jin, J.; Wang, P.; Lin, Y.; Li, H.; Ying, Q.; Mao, H. Past and future trends of vehicle emissions in Tianjin, China, from 2000 to 2030. Atmos. Environ. 2019, 209, 182–191. [Google Scholar] [CrossRef]
  8. Zhang, H.; Zhu, K.; Hang, Z.; Zhou, D.; Zhou, Y.; Xu, Z. Waste battery-to-reutilization decisions under government subsidies: An evolutionary game approach. Energy 2022, 259, 124835. [Google Scholar] [CrossRef]
  9. Wang, W.; Wu, Y. An overview of recycling and treatment of spent LiFePO 4 batteries in China. Resour. Conserv. Recycl. 2017, 127, 233–243. [Google Scholar] [CrossRef]
  10. Gu, X.; Zhou, L.; Huang, H.; Shi, X.; Ieromonachou, P. Electric vehicle battery secondary use under government subsidy: A closed-loop supply chain perspective. Int. J. Prod. Econ. 2021, 234, 108035. [Google Scholar] [CrossRef]
  11. Hao, H.; Qiao, Q.; Liu, Z.; Zhao, F. Impact of recycling on energy consumption and greenhouse gas emissions from electric vehicle production: The China 2025 case. Resour. Conserv. Recycl. 2017, 122, 114–125. [Google Scholar] [CrossRef]
  12. Heymans, C.; Walker, S.B.; Young, S.B.; Fowler, M. Economic analysis of second use electric vehicle batteries for residential energy storage and load-levelling. Energy Policy 2014, 71, 22–30. [Google Scholar] [CrossRef]
  13. Natkunarajah, N.; Scharf, M.; Scharf, P. Scenarios for the Return of Lithium-ion Batteries out of Electric Cars for Recycling. Procedia Cirp 2015, 29, 740–745. [Google Scholar] [CrossRef]
  14. Ahmadi, L.; Young, S.B.; Fowler, M.; Fraser, R.A.; Achachlouei, M.A. A cascaded life cycle: Reuse of electric vehicle lithium-ion battery packs in energy storage systems. Int. J. Life Cycle Assess. 2017, 22, 111–124. [Google Scholar] [CrossRef]
  15. Richa, K.; Babbitt, C.W.; Nenadic, N.G.; Gaustad, G. Environmental trade-offs across cascading lithium-ion battery life cycles. Int. J. Life Cycle Assess. 2017, 22, 66–81. [Google Scholar] [CrossRef]
  16. Neubauer, J.; Pesaran, A.; Williams, B.; Ferry, M.; Eyer, J. Techno-Economic Analysis of PEV Battery Second Use: Repurposed-Battery Selling Price and Commercial and Industrial End-User Value; 0148-7191; National Renewable Energy Lab.(NREL): Golden, CO, USA, 2012.
  17. Lih, W.-C.; Yen, J.-H.; Shieh, F.-H.; Liao, Y.-M. Second use of retired lithium-ion battery packs from electric vehicles: Technological challenges, cost analysis and optimal business model. In Proceedings of the 2012 International Symposium on Computer, Consumer and Control, Taichung, Taiwan, 4–6 June 2012; pp. 381–384. [Google Scholar]
  18. Assunção, A.; Moura, P.S.; de Almeida, A.T. Technical and economic assessment of the secondary use of repurposed electric vehicle batteries in the residential sector to support solar energy. Appl. Energy 2016, 181, 120–131. [Google Scholar] [CrossRef]
  19. Cusenza, M.A.; Guarino, F.; Longo, S.; Ferraro, M.; Cellura, M. Energy and environmental benefits of circular economy strategies: The case study of reusing used batteries from electric vehicles. J. Energy Storage 2019, 25, 100845. [Google Scholar] [CrossRef]
  20. Nguyen-Tien, V.; Dai, Q.; Harper, G.D.J.; Anderson, P.A.; Elliott, R.J.R. Optimising the geospatial configuration of a future lithium ion battery recycling industry in the transition to electric vehicles and a circular economy. Appl. Energy 2022, 321, 119230. [Google Scholar] [CrossRef]
  21. Wang, Y.; Tang, B.; Shen, M.; Wu, Y.; Qu, S.; Hu, Y.; Feng, Y. Environmental impact assessment of second life and recycling for LiFePO4 power batteries in China. J. Environ. Manag. 2022, 314, 115083. [Google Scholar] [CrossRef]
  22. Wanger, T.C. The Lithium future—Resources, recycling, and the environment. Conserv. Lett. 2011, 4, 202–206. [Google Scholar] [CrossRef]
  23. Song, J.; Yan, W.; Cao, H.; Song, Q.; Ding, H.; Lv, Z.; Zhang, Y.; Sun, Z. Material flow analysis on critical raw materials of lithium-ion batteries in China. J. Clean. Prod. 2019, 215, 570–581. [Google Scholar] [CrossRef]
  24. Feng, T.; Guo, W.; Li, Q.; Meng, Z.; Liang, W. Life cycle assessment of lithium nickel cobalt manganese oxide batteries and lithium iron phosphate batteries for electric vehicles in China. J. Energy Storage 2022, 52, 104767. [Google Scholar] [CrossRef]
  25. Lai, X.; Chen, Q.; Tang, X.; Zhou, Y.; Gao, F.; Guo, Y.; Bhagat, R.; Zheng, Y. Critical review of life cycle assessment of lithium-ion batteries for electric vehicles: A lifespan perspective. eTransportation 2022, 12, 100169. [Google Scholar] [CrossRef]
  26. Miao, Y.; Liu, L.; Zhang, Y.; Tan, Q.; Li, J. An overview of global power lithium-ion batteries and associated critical metal recycling. J. Hazard. Mater. 2022, 425, 127900. [Google Scholar] [CrossRef] [PubMed]
  27. Bai, Y.; Muralidharan, N.; Sun, Y.-K.; Passerini, S.; Whittingham, M.S.; Belharouak, I. Energy and environmental aspects in recycling lithium-ion batteries: Concept of Battery Identity Global Passport. Mater. Today 2020, 41, 304–315. [Google Scholar] [CrossRef]
  28. Kaushal, R.K.; Nema, A.K.; Chaudhary, J. Strategic exploration of battery waste management: A game-theoretic approach. Waste Manag. Res. 2015, 33, 681–689. [Google Scholar] [CrossRef]
  29. Sun, Q.; Chen, H.; Long, R.; Li, Q.; Huang, H. Comparative evaluation for recycling waste power batteries with different collection modes based on Stackelberg game. J Environ. Manag. 2022, 312, 114892. [Google Scholar] [CrossRef]
  30. Zhang, C.; Tian, Y.-X.; Han, M.-H. Recycling mode selection and carbon emission reduction decisions for a multi-channel closed-loop supply chain of electric vehicle power battery under cap-and-trade policy. J. Clean. Prod. 2022, 375, 134060. [Google Scholar] [CrossRef]
  31. He, L.; Sun, B. Exploring the EPR system for power battery recycling from a supply-side perspective: An evolutionary game analysis. Waste Manag. 2022, 140, 204–212. [Google Scholar] [CrossRef]
  32. Gao, Y.; Liu, Y.; Tan, Z.; Li, Z. Analysis of cooperation equilibrium of participants in power battery recycling chains considering information barrier. Chin. J. Popul. Resour. Environ. 2022, 20, 159–167. [Google Scholar] [CrossRef]
  33. Yang, Y.; Okonkwo, E.G.; Huang, G.; Xu, S.; Sun, W.; He, Y. On the sustainability of lithium ion battery industry—A review and perspective. Energy Storage Mater. 2021, 36, 186–212. [Google Scholar] [CrossRef]
  34. Chen, J.; Zhang, W.; Gong, B.; Zhang, X.; Li, H. Optimal policy for the recycling of electric vehicle retired power batteries. Technol. Forecast. Soc. Chang. 2022, 183, 121930. [Google Scholar] [CrossRef]
  35. Liu, K.; Wang, C. The impacts of subsidy policies and channel encroachment on the power battery recycling of new energy vehicles. Int. J. Low-Carbon Technol. 2021, 16, 770–789. [Google Scholar] [CrossRef]
  36. Ding, P.; Zhao, Z.; Li, X. Government subsidies in the power battery recycling industry. Ind. Manag. Data Syst. 2020, 120, 1059–1083. [Google Scholar] [CrossRef]
  37. Ma, W.M.; Zhao, Z.; Ke, H. Dual-channel closed-loop supply chain with government consumption-subsidy. Eur. J. Oper. Res. 2013, 226, 221–227. [Google Scholar] [CrossRef]
  38. Shao, L.; Yang, J.; Zhang, M. Subsidy scheme or price discount scheme? Mass adoption of electric vehicles under different market structures. Eur. J. Oper. Res. 2017, 262, 1181–1195. [Google Scholar] [CrossRef]
  39. Zhao, J.; Sun, N. Government subsidies-based profits distribution pattern analysis in closed-loop supply chain using game theory. Neural Comput. Appl. 2020, 32, 1715–1724. [Google Scholar] [CrossRef]
  40. Savaskan, R.C.; Bhattacharya, S.; Wassenhove, L. Closed-Loop Supply Chain Models with Product Remanufacturing. Manag. Sci. 2004, 50, 239–252. [Google Scholar] [CrossRef] [Green Version]
  41. Hu, L.; Wei, X.; Ma, J. Research on Power Battery Recovery Mode of New Energy Electric Vehicles in China under Circular Economy; IOP Conference Series: Earth and Environmental Science; IOP Publishing: Bristol, UK, 2021; p. 042029. [Google Scholar]
  42. MIIT, Interim Measures for the Management of New Energy Vehicle Power Battery Recycling. Available online: https://www.miit.gov.cn/zwgk/zcwj/wjfb/zh/art/2020/art_459b0eb972964f68930bb39be9e92688.html (accessed on 18 March 2022).
  43. Long, R.; Yang, J.; Chen, H.; Li, Q.; Fang, W.; Wang, L. Co-evolutionary simulation study of multiple stakeholders in the take-out waste recycling industry chain. J. Environ. Manag. 2019, 231, 701–713. [Google Scholar] [CrossRef]
  44. Friedman, D. On economic applications of evolutionary game theory. J. Evol. Econ. 1998, 8, 15–43. [Google Scholar] [CrossRef] [Green Version]
  45. Jiang, S.; Zhang, L.; Hua, H.; Liu, X.; Wu, H.; Yuan, Z. Assessment of end-of-life electric vehicle batteries in China: Future scenarios and economic benefits. Waste Manag. 2021, 135, 70–78. [Google Scholar] [CrossRef]
  46. Heydari, J.; Govindan, K.; Jafari, A. Reverse and closed loop supply chain coordination by considering government role. Transp. Res. Part D Transp. Environ. 2017, 52, 379–398. [Google Scholar] [CrossRef]
  47. Shao, Y.; Deng, X.; Qing, Q.; Wang, Y. Optimal battery recycling strategy for electric vehicle under government subsidy in China. Sustainability 2018, 10, 4855. [Google Scholar] [CrossRef]
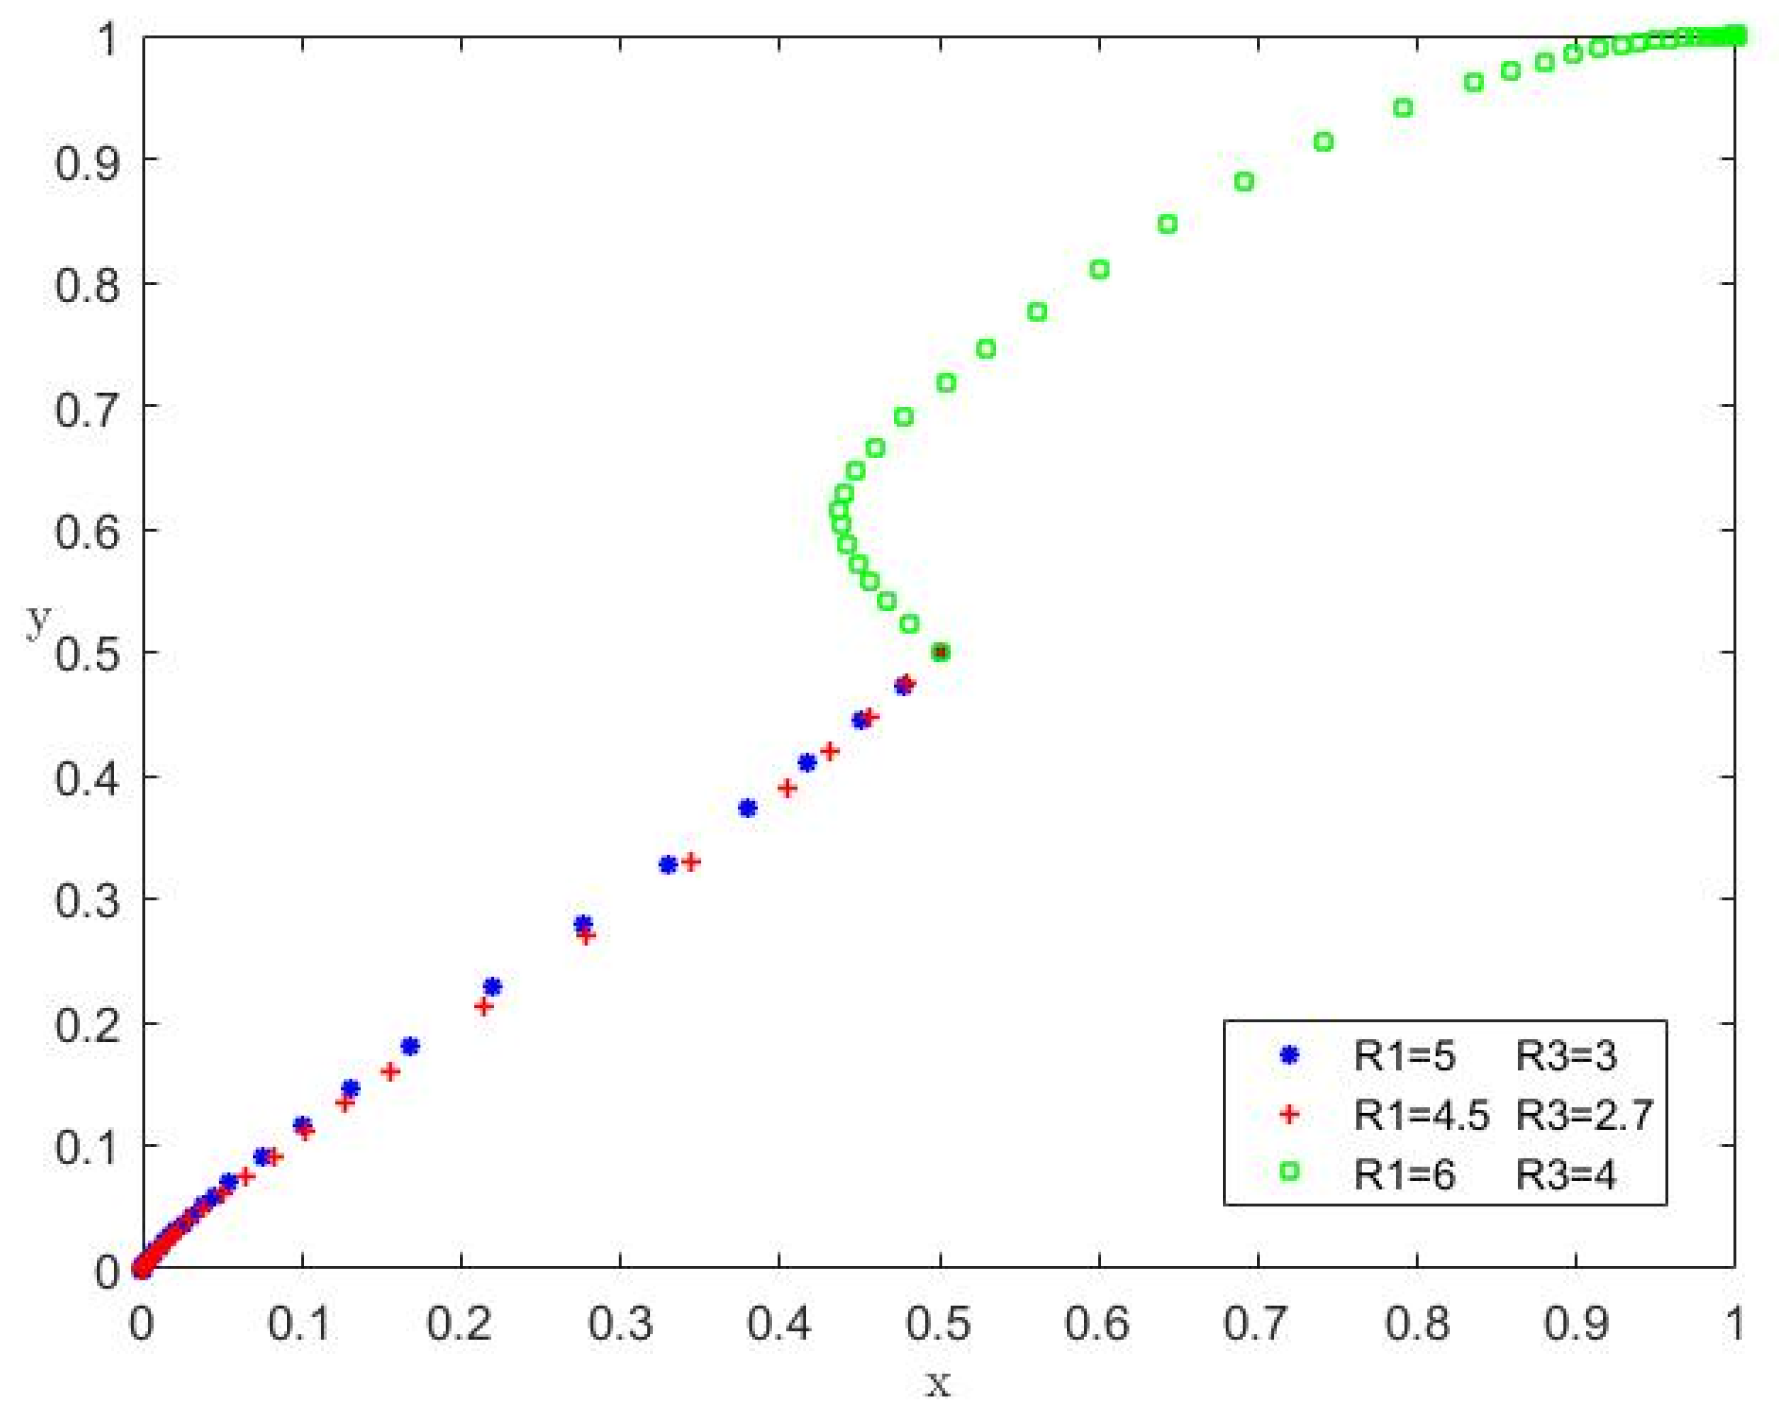
Figure 1. Impact of changes in R1 and R3 on the evolutionary trend.
Sustainability 15 02090 g001
Figure 2. Impact of changes in C1 and C3 on the evolutionary trend.
Sustainability 15 02090 g002
Figure 3. Impact of changes in R2 and R4 on the evolutionary trend.
Sustainability 15 02090 g003
Figure 4. Impact of changes in C2 and C4 on the evolutionary trend.
Sustainability 15 02090 g004
Figure 5. Impact of changes in B on the evolutionary trend.
Sustainability 15 02090 g005
Table 1. Payoff matrix for recycling companies and consumers.
Recycling CompaniesConsumers
PNP
RR ( R 1 C 1 R 3 + B , R 3 C 3 ) ( R 2 C 1 , R 4 C 4 )
UR ( R 2 C 2 , R 4 C 3 ) ( R 2 C 2 , R 4 C 4 )
Table 2. Numerical expressions for stability points.
Point det J t r J
( 0 , 0 ) ( C 1 + C 2 ) ( C 3 + C 4 ) C 1 + C 2 C 3 + C 4
( 0 , 1 ) ( R 1 R 2 R 3 + B C 1 + C 2 ) ( C 3 C 4 ) R 1 R 2 R 3 + B C 1 + C 2 + C 3 C 4
( 1 , 0 ) ( C 1 C 2 ) ( R 3 R 4 C 3 + C 4 ) C 1 C 2 + R 3 R 4 C 3 + C 4
( 1 , 1 ) ( R 1 R 2 R 3 + B C 1 + C 2 ) ( R 3 R 4 C 3 + C 4 ) ( R 1 R 2 R 3 + B C 1 + C 2 ) ( R 3 R 4 C 3 + C 4 )
( x 0 , y 0 ) ( 1 C 3 C 4 R 3 R 4 ) ( C 1 C 2 ) ( 1 C 1 C 2 R 1 R 2 R 3 + B ) ( C 3 C 4 ) 0
Table 3. ESS analysis of recycling companies and consumers.
ConditionsPoint det J t r J Results
Scenario 1 ( 0 , 0 ) +ESS
( 0 , 1 ) ++Unstable point
( 1 , 0 ) ++Unstable point
( 1 , 1 ) +ESS
Scenario 2 ( 0 , 0 ) +ESS
( 0 , 1 ) ± Saddle Point
( 1 , 0 ) ± Saddle Point
( 1 , 1 ) ++Unstable point
Scenario 3 ( 0 , 0 ) +ESS
( 0 , 1 ) ± Saddle Point
( 1 , 0 ) ++Unstable point
( 1 , 1 ) ± Saddle Point
Scenario 4 ( 0 , 0 ) +ESS
( 0 , 1 ) ++Unstable point
( 1 , 0 ) ± Saddle Point
( 1 , 1 ) ± Saddle Point
Disclaimer/Publisher’s Note: The statements, opinions and data contained in all publications are solely those of the individual author(s) and contributor(s) and not of MDPI and/or the editor(s). MDPI and/or the editor(s) disclaim responsibility for any injury to people or property resulting from any ideas, methods, instructions or products referred to in the content.