Abstract
In this article, we investigate the impact of “Renewable Electricity Output” on the green economy in the context of the circular economy for 193 countries in the period 2011–2020. We use data from the World Bank ESG framework. We perform Panel Data with Fixed Effects, Panel Data with Random Effects, Weighted Last Squares-WLS, and Pooled Ordinary Least Squares-OLS. Our results show that Renewable Electricity Output is positively associated, among others, with “Adjusted Savings-Net Forest Depletion” and “Renewable Energy Consumption” and negatively associated, among others, with “CO2 Emission” and “Cooling Degree Days”. Furthermore, we perform a cluster analysis implementing the k-Means algorithm optimized with the Elbow Method and we find the presence of four clusters. In adjunct, we confront seven different machine learning algorithms to predict the future level of “Renewable Electricity Output”. Our results show that Linear Regression is the best algorithm and that the future value of renewable electricity output is predicted to growth on average at a rate of 0.83% for the selected countries. Furthermore, we improve the machine learning analysis with a Deep Learning approach using Convolutional Neural Network-CNN but the algorithm is not appropriate for the analyzed dataset. Less complex machine learning algorithms show better statistical results.
1. Introduction
In the following article, we analyzed the value of renewable energy in the context of the circular economy considering the need to create greater sustainability and resilience of global energy systems. The dataset used for the analysis is the “Environmental, Social and Governance-ESG” of the World Bank [1]. However, as part of the large dataset, the variables relating to energy production in 193 countries for the period 2011–2020 were mainly analyzed. The circular economy paradigm requires attention to all phases of production and consumption in all countries globally. However, notoriously, the possibility of triggering economic growth processes, economic development, and the achievement of potential productivity, in all countries, requires energy consumption. In fact, the consumption of energy worldwide always tends to grow despite crises and regardless of the application of technological innovation to energy production methods.
However, the need to grow in income could push countries to use highly polluting energy sources such as non-renewable carbon-based energy sources. In this sense, the question of the energy sustainability of economic growth becomes an objective of economic policy both nationally and internationally. In fact, governments are in the need to guarantee, on the one hand, growth and prosperity to their nation, and on the other hand, they must respect the international cooperation agreements that are oriented to the reduction of CO2 emissions to reduce overheating globally. In this sense, the so-called Paris Agreements [2] and the Conference of Parties 27-COP27 [3] recently held in Egypt, try to impose ambitious environmental policy at country level to combat climate change.
One of the methods that can increase the propensity to the circular economy in the context of the sustainability of economic growth processes is renewable energy. In fact, renewable energy tends to be positively associated with the reduction of CO2 emissions and the reduction of temperature. Furthermore, since the renewable energy production methodologies require the use of a sort of production, decentralization also derives the possibility of offering energy at reasonable prices even in regional, local, and rural areas that in the past would not have had the opportunity to participate in the energy production.
However, the use of renewable energy is certainly not free from criticism or economic and technological limitations. In fact, as reported in paragraph two relating to the analysis of literature, there are empirical studies that have shown how economic growth is more compatible with the use of non-renewable energy sources rather than renewable energy sources. This dynamic can be understood because for a country it is certainly easier and faster to grow in GDP through pollution especially if it is a developing country that intends to fit into the ranks of medium and high-income countries.
However, these methodologies of economic growth are very risky as they generate pollution and relevant negative externalities at the environmental level that weigh both on the national population and on the global energy balance. It, therefore, derives the need to find new solutions, and new economic policies, which keep together economic growth, respect for the environment, need to grow energy consumption, with the reduction of CO2 emissions. One of the methodologies to achieve compatibility between the sustainability of the circular economy and economic growth consists of the growth of renewable energy production. Renewable energy can also have further positive effects at the country level by changing the mentality either of producers or consumers relating to the impact of productive and consumption choices on the environment. This change of mentality and public sensitivity can have an impact especially in developing countries and in new industrialization countries to facilitate an overall passage to the circular economy, operating as a cultural and value reform supported by the positive experience relating to the production and renewable energy consumption. Although there are certainly models of economic growth that have hypothesized the total passage also of medium-high income economies to the circular economy through the exclusive use of renewable energy, it is known that renewable energy still has limitations in the ability to be a useful tool to support, alone, the productivity of an industrialized country.
However, it is very probable that new technologies that can effectively use the forces of nature to generate energy without the emission of CO2, in a compatible way for the environment are very probable through the investment of research and development. R&D can promote new technology to support renewable energy production for cities, the manufacturing industry, as well as means of transport [4].
The development of renewable energy, therefore, becomes the essential element to guarantee the sustainability of the economic growth of countries and to allow a full transition to the circular economy.
The article continues as follows: In the second paragraph, a brief analysis of the literature is presented, which analyzes the relationship between the use of renewable energy and the sustainability of economic growth. In the third paragraph, an econometric model is presented for the esteem of the determinants of the production of renewable energy. In the fourth paragraph, the clusterization with the k-Means algorithm optimized with the Elbow Method to investigate the presence of groupings among the 193 countries analyzed in terms of renewable energy production. The fifth paragraph presents a prediction with algorithms of Machine Learning-ML to identify a path of possible development of renewable energy production, the sixth paragraph contains a Deep Learning Analysis with Convolutional Neural Network-CNN, and the seventh paragraph concludes.
2. Literature Review
A brief analysis of the literature is presented below, which, above all, takes into consideration the relationship between the production of renewable energy and the sustainability of economic growth processes.
Ref. [5] verify the existence of a positive relationship between the value of financial inclusion, globalization, the reduction of carbon dioxide emissions, and the presence of energy from renewable sources. Ref. [6] establishes a positive relationship between economic development and renewable electricity consumption in the Baltic region using data for the period 1992–2011. Ref. [7] analyzes the presence of a causal link between renewable energy, non-renewable energy, and economic growth for 26 OECD countries. The author concludes by arguing that economic growth policies should encourage renewable energy to facilitate GDP growth and increase energy independence at the country level. Ref. [8] consider the relationship between renewable energy production and Gross Domestic Product-GDP in 36 OECD countries over the period 2001–2015. The authors verify the existence of a negative relationship between GDP growth and an increase in the production of renewable energy. This report suggests that economic growth and development of renewables do not necessarily go hand in hand, especially in countries with medium-high per capita income.
Ref. [9] investigate the existing relationships between CO2 emissions, renewable electricity consumption, non-renewable electricity consumption, and economic growth in Algeria in the period between 1980 and 2012. The results show that in the long run, economic growth and the consumption of energy that is not renewable have a negative effect on the quality of the environment, while the use of renewable energy positively impacts the quality of the environment. Energy consumption is produced by economic growth. However, to improve the environmental condition in Algeria, it is necessary to invest in renewable energy by generating positive effects also in terms of reducing CO2 emissions. Ref. [10] analyze the relationship between renewable energy consumption, non-renewable energy consumption, economic growth, and CO2 emissions in Mediterranean countries in the period between 1980 and 2014. The authors verify the presence of a negative relationship between the use of renewable energy, CO2 emissions and economic growth. It follows that if on the one hand, the use of renewable energy can reduce CO2 emissions, on the other hand it is not certain that it is compatible with a program of economic growth in the short term.
Ref. [11] analyze the relationship between renewable energy production, GDP growth, and CO2 emissions in Pakistan. The results show that in the long run CO2 emissions, renewable energy production, and GDP growth increase together. The authors suggest that economic policies be applied to increase the production of renewable electricity and reduce CO2 emissions in Pakistan. Ref. [12] consider the positive impact that the ecological transition and the switch to a fully renewable energy production system could have on the Dutch economy. The authors estimate that the transition to renewable energy could create 50,000 new jobs by 2030 and increase Gross Domestic Product by 1%. Ref. [13] confirm the presence of a positive relationship between both renewable and non-renewable energy production in terms of economic growth for 174 countries between 1980 and 2012.
Ref. [14] underline the need to strengthen and facilitate the transition to fully sustainable and renewable energy-based production energy systems globally. The energy transition to a system completely free from carbon sources is considered a necessary objective to respect the limits of growth of global temperatures established in international agreements and treaties. Ref. [15] analyzes the positive relationship between the production of renewable energy and the reduction of CO2 emissions in South America over the period 1980–2010. Ref. [16] verify the presence of a positive relationship between renewable energy production, CO2 reduction and gross domestic product growth in a panel of 84 countries between 1991 and 2012. Ref. [17] consider the perverse effects that the political economic incentive for renewable energy installations has had on households in Germany. In fact, federal government subsidies for renewable energy production have pushed up prices. Poor households have been faced with higher energy prices. The authors suggest solutions to combine the growth in the price of renewable energy with the need to offer subsidies to households.
Ref. [18] considers the impact of the energy transition to renewable energy from a regional perspective. The method of investigation is bibliographic. The analysis starts from the idea that since renewable energies have a degree of reduced energy density, a significant change in the areas in which renewable energy is produced above all, at a regional, local, and rural level, is derived. Effects in terms of employment, supply chains, and value are thus detectable and are achieved at the regional and local levels. Ref. [19] analyze the impact of renewable energy in terms of economic growth in 38 countries in the period between 1990 and 2018. The results show the presence of a positive relationship between renewable energy production and economic growth. The authors suggest implementing actions at the international, governmental, and intergovernmental levels to increase the production and consumption of renewable energy.
Ref. [20] show the presence of a positive relationship between the usage of renewable energy and the ability to apply the principles of the circular economy. A circular economy promotes renewable energy consumption and production [21]. Ref. [22] shows how biomass energy if a tool to enforce circular economy principles [23,24]. Ref. [25] consider the role of renewable energy consumption and production in promoting a circular economy in the context of the Georgescu–Roegen theoretical approach [26]. The combination between circular economy and renewable energy is a strategic tool to achieve the Sustainable Development Goals-SDG [27]. An efficient technological design of renewable energies is essential to provide sustainable energy to communities oriented to a circular economy [28]. Nevertheless, circular economy principles should inspire renewable energy, too. In this sense, it is necessary to calibrate the relationship between the extraction rate of renewable energy and the regeneration rate of renewable resources [29]. Ref. [30] promote bio-hydrogen as a new renewable energy source able to boost the passage from the traditional economic system to the circular economy model. Ref. [31] suggest the application of wastewater treatment and technology to implement the energy transition toward a circular economy. Ref. [32] afford the question of the shift toward renewable energy in a country like Russia, which is an exporter of oil and other pollutant natural resources. Renewable energy operates as an instrument to improve the transition toward a circular economy in China [33] reducing emissions in the short and long run [34].
There is skepticism about the possibility to apply a circular economy, even with renewable energies, in developing countries such as Bangladesh [35]. The negative relationship between the price of non-renewable energy and renewable energy has a relevant role in promoting the energetic transition of China toward a circular economy [36]. Renewable energy induces a reduction in CO2 emission even in more advanced countries in terms of complexity index suggesting the existence of a positive relationship among circular economy, environmental sustainability, and knowledge-oriented economic systems [37].
Countries that have a greater level of renewable energy production suffer less from energy vulnerability [38]. Policymakers play an essential role in creating the institutional framework and the economic incentives to enforce the passage from a traditional and pollutant economy to a circular and more sustainable economy through the promotion of renewable energy [39]. New forms of renewable energy can boost the passage toward a more circular economy such as the bioconversion of biomass into biofuels and bio commodities [40]. Many OECD countries, such as Ireland, Luxembourg, and Norway, are investing in renewable energy and in the reduction of municipal waste and CO2 emissions to promote the shift toward sustainability and circular economy [41]. Ref. [42] find the presence of a positive association among renewable energy output, GDP growth, and the reduction of CO2 emissions in Switzerland, a case that confirm the validity of the Environmental Kuznets Curve-EKC. Renewable energy is positively associated with economic development and the transition toward a more sustainable economy in Switzerland [43]. The development of the renewable energy sector, especially the bioenergy industry, requires an increase in governance indicators especially in Western Europe [44].
The possibility to accomplish a Renewable Energy Transition-RET depends on a set of variables that are strongly related to the social, economic, institutional, and human capital at the country level and that requires a more conscious and green-oriented political economy [45]. Investment in Research and Development can promote the transition toward a renewable energy output system [46]. Even high-pollutant countries, such as China, have targeted carbon neutrality thanks to renewable energy sources [47,48]. However, the energy transition of China toward sustainability and a circular economy not only implies the change from non-renewable to renewable energy, but it also requires the change from a centralized to a de-centralized form of energy production [49]. Renewable energy can foster economic growth and financial development even in low-per-capita-income countries [50]. There is a positive relationship among renewable energy consumption, economic growth, and financial development [51]. The ability of renewable energy output to sustain the energy demand of advanced countries can be estimated with appropriate probabilistic functions and algorithms [52].
To promote energy transition it is necessary to respect cultural and institutional values at the country level. For example, the application of an Anglo-Saxon definition of energy transition for the Chinese economy is not efficient while the orientation toward a “guanxi” method could generate better effects [53]. The negative relationship between economic growth and sustainability persists even in Europe, despite the European green political economy that has financed renewable energy production and has created the conditions for the application of the circular economy [54]. The shift toward a circular economy in an ecomodernist political environment also requires financial incentives to improve the profitability of private investments [55]. The empirical analysis of the relationship among economic growth, renewable energy production, and urbanization shows that EKC holds for China [56]. The energy transition requires also political economies able to change the structure of incentives and can start with a price guarantee for renewable energy providers in order to sustain initial investments in the sector, as in the case of Germany [57]. The development of a more efficient renewable energy sector at the country level also requires investment in smart grids [58,59]. However, the intermittence of renewable energy production can produce inefficiency in the grid at the national and local levels [60]. Different Energy Storage Technologies-ESTs can solve the question of fluctuations in the production of renewable energy, such as Li-ion batteries, even if the high cost of Li-ion batteries impedes their widespread application [61]. Furthermore, energy storage improves the usage of renewable energy output and consumption [62]. Another solution to promote a better energy transition is to invest in micro-grid based [63] on multi-energy sources [64]. In any case, the risk of intermittence of renewable energy output should be computed adequately in energy planning even at the local level [65]. Smart grid based on multi-energy sources can either reduce the level of either reduce the cost of energy [66]. The increase in renewable energy output and consumption requires a more flexible power system [67].
The reduction in total energy consumption is essential to connect renewable energy output to economic growth [68]. The price of wind power has a negative impact on wind power generation, while the local demand can strengthen wind energy production [69]. However, in countries with low per capita income, i.e., Eastern African countries, there is a negative relationship between economic growth and non-renewable energy production [70]. Furthermore, the shift to a 100% renewable energy system can be too costly to implement [71]. The Integrated Energy System-IES can solve the question of uncertainty in the production and pricing of renewable energy [72]. The substitution of non-renewable energy with renewable energy consumption can happen only in the long run, even in the case of an increase in the price of oil, coal, and natural gas [73]. A probabilistic approach can solve the question of renewable energy output variability and the issues related to the stability of the distribution system [74].
As evident, the analysis of the literature tends to confirm the presence of a positive relationship between the growth of renewable energy production and the reduction of CO2 emissions. However, the relationship between the growth of the production of renewable energy and growth of the gross domestic product is ambiguous, at least in the long run. It should be considered that almost all the articles analyzed apply analytical methodologies aimed at investigating the presence of causal relationships between the variables. Furthermore, the ambiguity of the metric results about the relationship between renewable energy production and economic growth rate depends on the fact that the analyzed data fail to incorporate that the implementation of the new economic policies arranged internationally to combat climate change is likely to be incorrectly and reduce CO2 emissions. Table 1 synthesizes the references by main themes.

Table 1.
Synthesis of the Literature Review by Main Themes.
3. The Econometric Model to Estimate the Determinants of Renewable Electricity Output
An econometric analysis is then carried out for the estimation of the determinants that affect the facilitation of the production of renewable energy. The data used refer to 193 countries worldwide in a 10-year period between 2011 and 2020. The data were analyzed with the following econometric techniques, namely: Panel Data with Fixed Effects, Panel Data with Random Effects, Pooled Ordinary Least Squares-OLS, and Weighted Least Squares-WLS. The use of data in panel format was necessary due to the structure of the data used. In fact, the data analyzed do not consist only of a historical series, nor are they observations relating to countries in a single reference period. On the contrary, it is a dataset that combines on the one hand the historical series, consisting of 10 years, and on the other hand the number of observations from the countries, equal to 193 units. The result is a matrix that measures 193 × 10 and which therefore needs to be analyzed using Panel Data models that are precisely suitable for data structures that have both a historical series depth and a heterogeneity of individual observations. Table 2 contains the description of the variables.
Table 2.
Description of the Variables.
The following equation was explicitly estimated:
where i = 193 and t = 10. Table 3 synthetizes the statistical results of the econometric models.
Table 3.
Econometric Models to Estimate the Value of Renewable Electricity Output.
Based on the analysis it appears that the value of Renewable Electricity Output is negatively associated with:
- cooling degree days: is a variable that considers the quantification of the demand for energy necessary to cool buildings. From a metric point of view, consider the number of grades of the average temperature above 18 °C. There is a negative relationship between the value of renewable energy production and the Cooling Degree Days value [82]. In countries where there is greater production of renewable electricity, there is also less demand for energy necessary to cool buildings. This relationship could certainly be true for some countries that are particularly efficient from an energy point of view in northern Europe where the number of days having a temperature above 18 degrees Celsius tends to be lower. However, this report, regardless of geographical considerations, can also indicate the positive contribution that the presence of renewable energy production sources offers against global warming. Energy consumption is positively associated with both heating and cooling temperatures. In particular, the energy cost of cooling buildings should not be underestimated. Above all because the places in the world that are most populated are also the places in the world where temperatures tend to be higher. For this reason, if the number of Cooling Degree Days increases, it is possible to save on energy costs. The situation results in a reduction of renewable energy consumption.
- CO2 emissions: considers carbon dioxide emissions, i.e., those deriving from the combustion of fossil fuels and the production of cement. They include carbon dioxide produced during the burning of solid, liquid, and gaseous fuels and gas flaring [83]. There is a negative relationship between the production of carbon dioxide and the production of energy from renewable sources. This negative relationship allows us to support the possibility of combating global warming through the efficient use of renewable sources. At present, renewable energies certainly cannot fully replace the value of energy production from traditional sources. However, the possibility of reducing CO2 emissions allows energy economic policy to effectively use renewable energy as a tool to combat emissions and reduce pollution, especially in urban areas, also having positive impacts in terms of public health for the population.
- Adjusted savings: natural resources depletion (% of GNI): is the sum of net forest depletion, energy depletion, and mineral depletion. Net forest depletion is the unit resource rent multiplied by the excess harvest of timber more than natural growth. Energy depletion is the ratio of the value of the stock of energy resources to the remaining life of the reserve. It covers coal, crude oil, and natural gas. Mineral depletion is the ratio of the stock value of mineral resources to the remaining life of the reserve [84]. There is therefore a negative relationship between the value of the depletion of natural resources and the value of renewable energy production. This report indicates that by effectively increasing the production of renewable energy it is possible to reduce the consumption of natural resources and thus safeguard the environment.
- Agriculture, forestry, and fishing, value aided (% of GDP): is a measure of the impact of agriculture, silviculture, and fishing in terms of GDP [85].There is a negative relationship between the value of the percentage of GDP produced by the primary sector and the value of the growth of renewable energy production. This relationship can be understood considering that for example the production of renewable energy is often placed in a zero-sum game with agriculture. For example, solar energy often occupies the same spaces and is built on the same land that could be dedicated to agriculture. However, this is not only the motivation for this negative relationship. There is also another one that is worth above all for the countries of northern Europe and for medium-high income countries. In fact, generally, medium-high income countries tend to have a value of agriculture as a percentage of very reduced GDP, and generally less than 4% if not even 3%.
- Electricity production from coal sources (% of total): is the share of electricity produced using coal. Coal means all coal and lignite, both primary fuels including hard coal and lignite-lignite, and derivative fuels including proprietary fuels, coke oven coke, gas coke, coke oven gas, and blast furnace gas. Peat is also included in this category [86]. There is a negative relationship between the value of electricity generation from coal and the value of generation from renewable energy. This relationship allows us to identify a zero-sum game between the production of energy from renewable sources and the production of energy from coal. However, it is not possible to imagine a complete substitution of renewables with coal, at least considering the current conditions of the technology applied to renewable sources. However, the report certainly indicates that investing in renewables can make it possible, within certain limits, to reduce the production of energy from coal.
- Agricultural land (% of land area): represents the amount of land devoted to agriculture as a percentage of available land in each country. There is a negative relationship between the value of land available in each country for cultivation and the value of renewable energy production [87]. This relationship tends to reinforce the hypothesis of the presence of a zero-sum game between agriculture and the value of renewables. The motivation lies in the fact that obviously where the renewable energy plants are installed it is not possible to proceed with the exercise of land cultivation. However, it must also be considered that especially for the countries of Northern Europe, obviously, the percentage of land dedicated to agriculture tends to be small, while the areas destined for wind, geothermal and solar plants can be very large and productive.
In addition, the value of “Renewable Electricity Output” is positively associated with:
- Energy use (Kg of oil equivalent per capita): considers energy consumption as the use of primary energy before transformation into other end-use fuels, equal to domestic production plus imports and changes in stocks, minus exports and fuels supplied to ships and aircraft engaged in international transport [88]. There is a positive relationship between energy consumption and investment in renewable energies. Evidently, renewable energy contributes to the production of energy at the local level and therefore generates an increase in available energy and related consumption. It is also true that energy consumption tends to be ever-increasing in almost all countries. However, certainly having greater quantities of energy available certainly also allows us to sustain greater consumption. Furthermore, renewable energy is often produced in rural locations and, therefore, also at the distribution level, it allows for an increase in consumption capacity even in territories that otherwise would be almost isolated.
- Access to electricity (% of population): is a variable that considers access to electricity as the percentage of the population that has access to electricity. Electrification data are collected from industry, national surveys, and international sources [89]. There is a positive relationship between the value of access to electricity and investment in renewable energy production. Obviously, the growth in energy production makes it possible, especially in rural areas, for access to electricity to reach people who were previously excluded from it. This is especially true for countries that have low per capita incomes and are in Africa or South Asia. Obviously, the possibility of producing energy even in the vicinity of rural, peripheral areas further increases the inclusiveness of renewable sources. Renewable energies, therefore, become a tool for reducing social and economic inequality, allowing the population of many countries to access the use of electricity.
- Forest area (% of land area): it is a variable that considers the forest area or the land under natural woods or trees planted with at least 5 m in situ, whether productive or not, and excludes woods in agricultural production systems and trees in parks and urban gardens [90]. There is a positive relationship between the value of forest area and the investment in renewable energy production at the country level. This relationship is since the installation of renewable energy production stations generally does not take place in forest areas. In fact, renewable energies do not use any of the products that directly or indirectly can be obtained from the exploitation of forests as an input. For this reason, it is possible to develop renewable energy and at the same time make sure that the forest area also grows thanks to the cultural effects induced by renewables.
- PM2.5 air pollution, mean annual exposure (micrograms for cubic meter): considers exposure to environmental PM2.5 pollution is defined as the average level of exposure of a nation’s population to concentrations of airborne particles measuring less than 2.5 microns in aerodynamic diameter, which are capable of penetrating deeply into the respiratory tract and cause serious damage to health [91]. There is a positive relationship between the value of renewable energies and the growth of pollution due to the presence of PM2.5. This relationship may be since the presence of renewable energy sources by itself does not automatically eliminate other polluting sources of energy production or some methods of energy production that generate PM2.5 as in the case of fossil fuel-powered transport. It follows that especially in countries characterized by the presence of densely populated urban areas, there can be a simultaneous growth in investment in the production of renewable energy and a growth in pollution from PM2.5.
- Fossil fuel energy consumption (% of total): represents the energy consumption from fossil fuels as a % of the total energy consumption [92]. There is a positive relationship between the value of investment growth in renewable energies and the value of energy consumption from fossil fuels. This motivation is because, in general, the countries that have access to the production of renewable energy, even if they are countries with a medium-low per capita income, can experience forms of economic growth. And this economic growth can, for example, be accompanied by the diffusion of means of transport such as cars, motorcycles, and buses and, therefore, by an increase in the use of fossil fuels. In fact, the process of economic development that leads a country to grow in the level of income is extremely expensive from an energy point of view and therefore also requires the use of fossil energy sources both for the production purposes of the industries and for the consumption purposes of the families.
- Renewable energy consumption (% of total final energy consumption): is a variable that considers the consumption of renewable energy in the total final energy consumption [93]. Obviously, there is a positive relationship between the value of renewable energy production and the consumption of renewable energy at the country level. This relationship represents a kind of tautology. In fact, if there is greater production of renewable energy, and therefore the share of renewable energy out of the total energy produced increases, as well as the share of renewable energy consumed out of the total energy consumed. Furthermore, it must be considered that this relationship is practically immediate for those renewable energy installations which are connected to domestic users, and which therefore support the capacity of families to consume energy. However, this relationship has limitations. For example, to meet the demands of cities and energy-intensive industries it can be very difficult to act with the supply of renewable energy. Therefore, it is probable that this relationship, although verified at the country level, may then encounter limitations if analyzed at the local or regional level.
- Adjusted savings: net forest depletion (% of GNI): is calculated as the product of unit resource rents and the excess log harvest over natural growth [94]. There is a relationship between the value of the growth of investment in renewable energy and the growth of net impoverishment. This relationship may appear counterfactual, however, it can be better understood because most of the countries that have invested heavily in renewable energies are also developing countries in which the primary sector is very relevant. In addition, since forestry activity is a primary type of extractive activity, it is probable that, at least for most middle-low-income countries, there is a positive convergence between net impoverishment and the growth of renewables. However, this relationship tends to change once countries reach the upper-middle per capita income level due to the reduction in the relative contribution of the primary sector including timber harvesting.
We used the 13-variable regression model with the aim of investigating the variables connected to the environmental economics contained in the World Bank database entitled ESG-Environment Sustainability Governance. The thirteen variables that were used were chosen on the basis of statistical significance within the dataset analyzed. Certainly, the variables included in the ESG World Bank dataset do not exhaust the complex environmental and geographical variables and factors that can have an impact on the production of renewable energy. An analysis that goes beyond the dimension of nations and instead considers the geographical dimension from an environmental point of view would probably also be necessary. In fact, the parts of the territory that are included in the geographical definition of a nation can be very heterogeneous in terms of the endowment of natural resources useful for renewables, while on the contrary, parts of the territory belonging to different countries can show high levels of homogeneity. However, the possibility of considering these geographical factors at the level would require a shift of the analysis from the national dimension to the regional dimension.
4. Clusterization with the k-Means Algorithm Optimized with the Elbow Method
In the following analysis, a method is applied using the k-Means algorithm optimized with the Elbow Method (Figure 1). The application of a method of clusterization is necessary for a database consisting of 193 countries characterized by enormous heterogeneity from an economic, social, institutional, and geographical point of view. In this way, clusterization allows the presence of groupings that can be due to a composite set of environmental economic policy choices that put together economic, geographical, financial, and technological elements. Generally, the Silhouette coefficient is used to optimize the K-means algorithm. However, due to the excessive polarization of the data, the use of the silhouette coefficient appeared excessively simplifying, manifestation of the existence of only two Clusters in a context of 193 countries. This analysis initially attempted would have simply represented a contrast between two blocks of countries, namely rich countries and poor countries. To grasp the greatest heterogeneity in the dataset, it was chosen to use the Elbow method that highlights four clusters (Figure 2). Specifically, the following clusters were identified, namely:
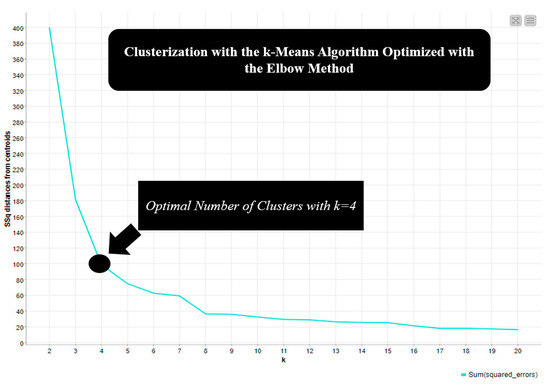
Figure 1.
Clusterization with the k-Means algorithm optimized with the Elbow Method.
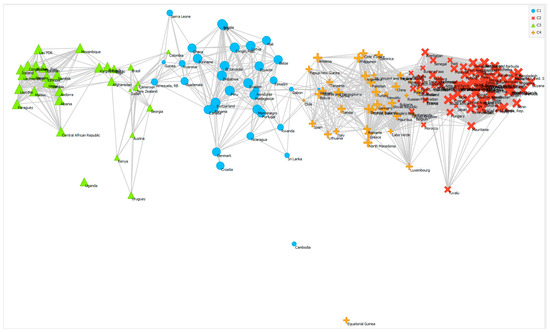
Figure 2.
Clusters of countries for the value of Renewable Energy Output based on k-Means algorithm. Here there is a representation with Multidimensional Scaling-MDS. The x axis represents the input proximities and the y-axis represents either the distances or the input proximities.
- Cluster 1: Angola, Belize, Cambodia, Canada, Congo Rep., Croatia, Denmark, Ecuador, El Salvador, Eswatini, Fiji, Gabon, Ghana, Guatemala, Guinea, Honduras, Latvia, Madagascar, Mali, Montenegro, Myanmar, Nicaragua, Panama, Peru, Portugal, Rwanda, Sierra Leone, Sri Lanka, Suriname, Sweden, Switzerland, Venezuela, Vietnam, Zimbabwe;
- Cluster 2: Algeria, Antigua and Barbuda, Australia, Azerbaijan, Bahamas, Bahrain. Bangladesh, Barbados, Belarus, Benin, Botswana, Brunei Darussalam, Bulgaria, Burkina Faso, Chad, Comoros, Cuba, Cyprus, Czech Republic, Djibouti, Dominican Republic, Egypt, Eritrea, Estonia, Finland, Gambia, Grenada, Guinea-Bissau, Guyana, Haiti, Hungary, Indonesia, Iran, Iraq, Israel, Jamaica, Japan, Jordan, Kazakhstan, Kiribati, Korea Rep., Kuwait, Lebanon, Liberia, Libya, Malaysia, Maldives, Malta, Marshall Islands, Mauritania, Micronesia, Moldova, Monaco, Mongolia, Morocco, Nauru, Netherlands, Niger, Oman, Palau, Poland, Qatar, San Marino, Sao Tome and Principe, Saudi Arabia, Senegal, Seychelles, Singapore, Solomon Islands, Somalia, South Africa, South Sudan, St. Kittis and Nevis, St. Lucia, Syrian Arab Republic, Thailand, Timor-Leste, Tonga, Trinidad and Tobago, Tunisia, Turkmenistan, Tuvalu, Ukraine, United Arab Emirates, United States, Yemen Rep;
- Cluster 3: Afghanistan, Albania, Andorra, Austria, Bhutan, Brazil, Burundi, Cameroon, Central African Republic, Colombia, Congo Dem. Rep., Ethiopia, Georgia, Iceland, Kenya, Kyrgyz Republic, Lao PDR, Lesotho, Liechtenstein, Malawi, Mozambique, Namibia, Nepal, New Zealand, Norway, Paraguay, Sudan, Tajikistan, Togo, Uganda, Uruguay, Zambia;
- Cluster 4: Argentina, Armenia, Belgium, Bolivia, Bosnia and Herzegovina, Cabo Verde, Chile, China, Cote d’Ivoire, Dominica, Equatorial Guinea, France, Germany, Greece, India, Ireland, Italy, Korea, Dem. People’s Rep., Lithuania, Luxembourg, Mauritius, Mexico, Nigeria, North Macedonia, Pakistan, Papua New Guinea, Philippines, Romania, Russian Federation, Samoa, Serbia, Slovak Republic, Slovenia, Spain, St. Vincent and the Grenadines, Tanzania, Turkey, United Kingdom, Uzbekistan, Vanuatu.
Considering the value of the median of the clusters, it results that Cluster 3-C3 is equal to an amount of 91.63, while Cluster-C1 is equal to an amount of 54.64 units, Cluster-C4 is equal to an amount of 25.41 units and Cluster 2-C2 equal to an amount of 1.47. The following ordering of the clusters is, therefore, derived: C3 > C1 > C4 > C2. From a geographical point of view, we can see that it is above all the countries with low per capita incomes that have the greatest percentage of electricity production from renewable sources. However, this condition can be better explained by considering that countries that have low per capita incomes are in the following situation:
- have probably not invested sufficiently in traditional forms of energy production due to lack of infrastructure;
- being African and Asian countries, they are in the climatic conditions to optimize the advantages of renewable energies.
However, there are of course exceptions. For example, in Cluster 3-C3 which is the one that has the greatest value in terms of presence of renewable energy production, there are also Liechtenstein, Norway, Austria, New Zealand, and Iceland. It is obviously a presence that needs to be explored. In the case of Austria, most of the renewable energy is produced by hydroelectricity, followed by solar, biomass, solar and geothermal. Also, in Norway, the main source of energy is hydroelectricity, followed by solar and thermal energy. Finally, Iceland manages to produce geothermal and wind energy. However, we must consider that Austria, Norway, Iceland are small countries, and their energetic demand is smaller with respect to other more populous high-income countries.
It is also relevant to afford the question of the relationship between the demand for CO2 in the industrial sector in OECD countries and the percentage of renewable energy output as a percentage of the total energy produced. We have analyzed the relationship between CO2 emissions in the industrial sector and renewable energy output for OECD countries. Specifically, first of all, a cluster analysis is performed with the application of the k-Means algorithm optimized with the Elbow Method to verify the presence of clusters in terms of CO2 emissions in the industry sector in OECD countries. Subsequently, for each cluster, a comparative analysis was carried out with the level of Renewable Energy Output-REO to verify the presence of a general positive or negative trend through a graphical representation method.
In particular, the variable used to approximate the “CO2 emissions embodied in domestic final demand, by source country and industry”. The variable is calculated in millions of tons. A clustering with k-Means algorithm is therefore carried out by applying the Elbow method. The analysis shows the presence of 4 clusters (Figure 3).
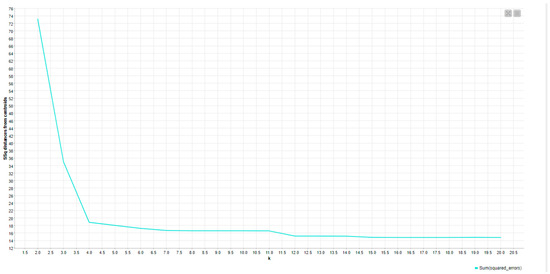
Figure 3.
The Elbow Method for the Optimization the k-Means algorithm for clusterization.
The clusters are composed as follows:
- Cluster 1: Taipei, Thailand, Netherlands, Argentina, Malaysia, Kazakhstan, Belgium, Greece, Vietnam, Czech Republic, Malta, Iceland, Philippines, Brunei Darussalam, Switzerland, Cambodia, Cyprus, Luxembourg, Hong Kong, Latvia, Costa Rica, Austria, Israel, Romania, Estonia, Lithuania, Slovenia, Colombia, Chile, Croatia, Tunisia, Sweden, Denmark, Slovakia, Peru, Bulgaria, Portugal, Singapore, New Zealand, Ireland, Finland, Hungary, Morocco, Norway,
- Cluster 2: Japan, Russia, India, Germany;
- Cluster 3: Poland, South Africa, Turkey, Spain, United Kingdom, Indonesia, Saudi Arabia, Brazil, Italy, South Korea, Canada, Australia, France, Mexico;
- Cluster 4: China, USA.
The value in millions of tons, specifically it is possible to identify the following ordering of the clusters, namely: C4 = 6886.2 > C2 = 1264.25 > C3 = 460.2 > C1 = 61.6. It therefore follows that from the point of view of the emissions produced in the industrial sector, China and the USA have very high values of eliminate pollution from industry, i.e., a value equal to about 40% among the countries considered in the OECD dataset.
As can be seen from the analysis, it appears that the relationship between the percentage of renewable energy production and CO2 emissions in the industrial sector, with reference to 2015, is negative for the first and second clusters (Figure 4 and Figure 5), tends to be zero for the third cluster (Figure 6), and is positive for the fourth cluster (Figure 7). Probably the countries that have a greater balance between the level of CO2 emissions from the industrial sector and the level of renewable energy output are the countries of cluster 3. It follows that between renewable energy output andCO2 emissions from industrialization, it is not necessarily a negative relationship. There are some countries, such as for example the countries of cluster 3, which manage to invest in the production of renewable energy despite the presence of CO2 emissions from the industrial sector.
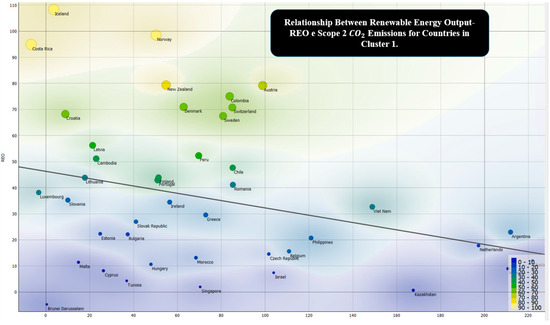
Figure 4.
Relationship Between Renewable Energy Output-REO, on the x-axis and “ emissions embodied in domestic final demand, by source country and industry” on the y-axis, for countries in Cluster 1.
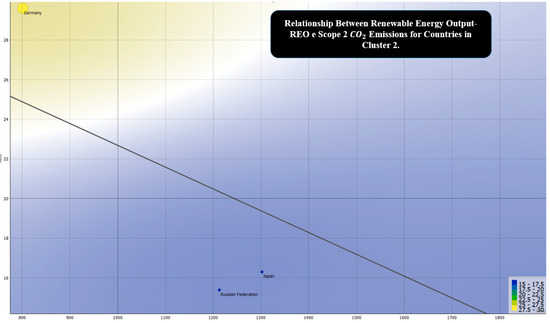
Figure 5.
Relationship Between Renewable Energy Output-REO, on the x-axis, and “CO2 emissions embodied in domestic final demand, by source country and industry” for Countries in Cluster 2.
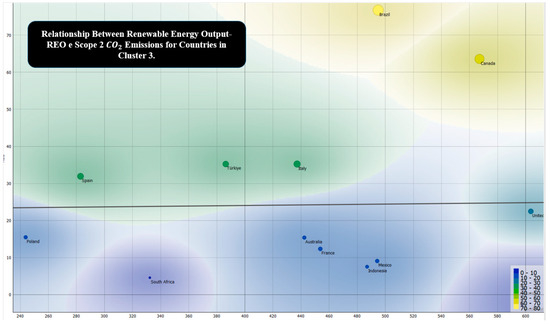
Figure 6.
Relationship Between Renewable Energy Output-REO, on the x-axis, and ”CO2 emissions embodied in domestic final demand, by source country and industry” for countries in Cluster 3.
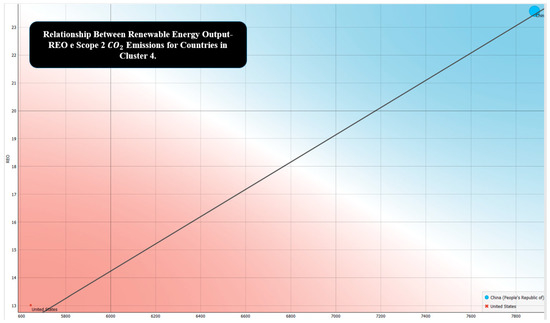
Figure 7.
Relationship Between Renewable Energy Output-REO, on x-axis and “CO2 emissions embodied in domestic final demand, by source country and industry” Countries in Cluster 4.
The ability of countries to invest in renewable energy output can be considered as a function of a series of socio-economic factors that comprehend also demographic and cultural elements. However, overall, the investment in renewable energy output at the global level is the consequence of the development of a green conscious and the implementation of green political economies. In this sense, it is not sufficient to consider the economic consequences and incentives for the implementation of renewable energy sources. In effect, the promotion of political movements that are centered on the fight against climate change has a positive impact on the improvement of renewable energy output at the global level. The idea of environmental sustainability and circular economy together with the application of Cost-Benefit Analysis and worst-case scenario oriented to visualize and compute the negative and adverse consequences of climate change are powerful and useful tools to promote renewable energy outputs even in high developed and pollutant countries.
5. Machine Learning and Predictions
Below is a comparison between seven different Machine Learning algorithms for the prediction of the future value of renewable energy production. The algorithms were evaluated based on their statistical capacity measured based on the maximization of the R-Squared and the minimization of the following statistical errors or: Mean Absolute Error-MAE, Mean Squared Error-MSE, Root Mean Squad Error-RMSE. Table 4 shows the statistical results.
Table 4.
Statistical Results of the Machine Learning Estimations for the Prediction of the Level of Renewable Energy Output.
The algorithms were trained with 70% of the data while the remaining 30% were used for the actual prediction. The following order of Machine Learning algorithms for predictive performance was therefore obtained or:
- Linear Regression with a payoff equal to 4;
- Polynomial Regression with a payoff equal to 7;
- Gradient Boosted Trees Regression with a payoff value of 11;
- Tree Regression Ensemble with a payoff value of 12;
- Simple Regression Tree with a payoff value of 17;
- ANN-Artificial Neural Network with a payoff value of 21;
- PNN-Probabilistic Neural Network with a value of 25.
Table 5 contains the ranking of machine learning algorithms based on predictive performance.
Table 5.
Ranking of Algorithm for Predictive Performance.
Therefore, using the best performing algorithm or Linear Regression (Figure 8 and Figure 9) it is possible to predict the following values for the countries indicated, i.e.:
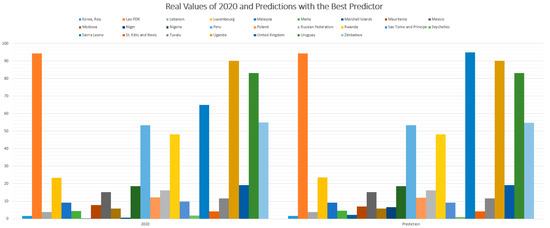
Figure 8.
Predictions with the Best Predictive Algorithm for countries from Korea, Rep. to Zimbabwe i.e., the countries reported in the second column of Table 6.
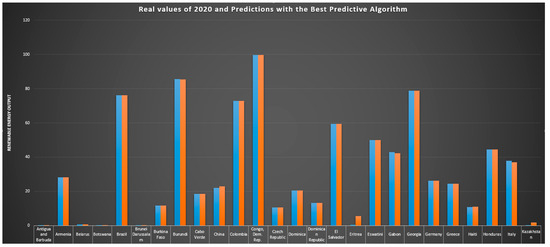
Figure 9.
Predictions with the Best Predictive Algorithm for countries from Antigua and Barbuda and Kazakhstan i.e., the first column of Table 6.
- Antigua and Barbuda with an increasing variation from an amount of 0.10 up to a value of 0.11 units or equal to 0.01 equivalent to 10.00%;
- Armenia with a change of an amount of 28.20 units up to a value of 28.18 units or equal to a change of −0.02 units equal to −0.07%;
- Bahrain and Barbados which in 2020 recorded 0.00% of renewable energy production remain in their condition without further investing in the growth of energy produced through renewables;
- Belarus with a diminutive variation from an amount of 0.74 units up to a value of 0.72 units or a variation equal to −0.02 units equal to −3.303%;
- Botswana with a change of an amount of 0.04 units up to a value of 0.07 units or equal to a value of 0.03 units equal to a value of 64.33%;
- Brazil with a variation from an amount of 76.24 units up to a value of 76.21 units or equal to a variation of −0.03 units equal to a value of −0.04%;
- Brunei Darussalam with a variation from an amount of 0.05 units up to a value of 0.06 units or equal to a value of 0.01 units or equal to a variation equal to a value of 28.00%;
- Burkina Faso with a variation from an amount of 11.66 units up to a value of 11.65 units or equal to a value of −0.01 units equal to a value of −0.11%;
- Burundi with a value of 85.53 units up to a value of 85.40 units equal to a value of −0.13 units equal to a value of −0.15%;
- Cabo Verde with a variation from an amount of 18.48 units up to a value of 18.49 units or equal to a variation of 0.01 units equal to a value of 0.03%;
- China with a variation from an amount of 22.01 units up to a value of 22.99 units or equal to a variation of 0.98 units equal to an amount of 4.45%;
- Colombia with a variation from an amount of 72.98 units up to a value of 72.97 units or equal to a variation of −0.01 units equal to a variation of −0.01%;
- Comoros with zero variation and a value of renewable energy production equal to 0;
- Congo with a variation from an amount of 99.79 units up to a value of 99.76 units or equal to a value of −0.03 units equal to a value of −0.03%;
- Czech with a zero change in absolute value and a marginal change in percentage value equal to 0.02 for a total value of renewable energy produced equal to 10.69%;
- Dominica with a diminutive variation from an amount of 20.52 units up to a value of 20.49 units or equal to a variation of −0.03 units equal to a value of −0.16%;
- Dominican Republic with a zero change in absolute value and an amount of renewable energy production equal to a value of 13.25%;
- El Salvador with an increasing variation from an amount of 59.34 units up to a value of 59.35 units or equal to a value of 0.01 units equal to a variation of 0.02%;
- Eritrea with a variation from an amount of 0.52 units up to a value of 5.53 units or equal to a variation of 5.01 units equal to an amount of 963.08%;
- Eswatini with a variation from an amount of 46.93 units up to a value of 46.95 units or equal to a variation of 0.02 units equal to an amount of 0.04%;
- Gabon with a variation from an amount of 42.93 units up to a value of 42.40 units or equal to an amount of −0.53 units in absolute value equivalent to −1.23%;
- Georgia with an increasing variation from an amount of 78.78 units up to a value of 78.79 units or equal to a value of 0.01 units equal to a value of 0.01%;
- Germany with a diminutive variation from an amount of 26.26 units up to a value of 26.25 units or equal to an amount of −0.01 units equal to an amount of −0.03%;
- Greece with a variation from an amount of 24.54 units up to a value of 24.56 units or equal to an amount of 0.02 units equal to a value of 0.08%;
- Haiti with a variation from an amount of 10.95 units up to a value of 10.96 units equal to an amount of 0.01 units equal to a value of 0.11%;
- Honduras with zero variation and an amount of renewable energy production equal to a value of 44.59 units;
- Italy with a variation from an amount of 37.99 units up to a value of 37.00 units or equal to a value of −0.99 units equal to a value of −2.61%;
- Kazakhstan with a variation from an amount of 0.14 units up to a value of 1.91 units equal to a value of 1.77 units equal to a value of 1267.14%;
- South Korea with a diminutive variation from an amount of 1.68 units up to a value of 1.60 units or equal to a value of −0.09 units equivalent to −5.06%;
- Lao PDR with a diminutive variation from an amount of 94.33 units up to a value of 94.31 units equal to an amount of −0.02 units equal to a value of −0.02%;
- Lebanon with a variation from an amount of 3.78 units up to a value of 3.87 units equal to an amount of 0.09 units equal to a value of 2.38%;
- Luxembourg with a variation from an amount of 23.48 units up to a value of 23.50 units or equal to an amount of 0.02 units equal to a value of 0.10%;
- Malaysia with a variation from an amount of 9.11 units up to a value of 9.24 units or equal to an amount of 0.13 units equal to a value of 1.43%;
- Malta with an increasing variation from an amount of 4.35 units up to a value of 4.52 units or equal to an amount of 0.17 units equal to a value of 3.91%;
- Marshall Islands with a variation from an amount of 0.23 units up to a value of 2.23 units or equal to a value of 2.00 units equal to an amount of 868.70%;
- Mauritania with a variation from an amount of 7.47 units up to a value of 7.02 units or equal to a variation of −0.45 units equal to an amount of −6.02%;
- Mexico with a variation from 15.25 units up to a value of 15.23 units or equal to a variation of −0.02 units equal to −0.13%;
- Moldova with a variation from an amount of 5.78 units up to a value of 5.77 units or equal to a value of −0.01 units equal to −0.17%;
- Monaco with zero change in renewable energy production;
- Niger with an increasing variation from an amount of 0.66 units up to a value of 6.66 units or equal to a value of 6.00 units equal to a value of 908.79%;
- Nigeria with zero absolute variation and an amount of renewable energy production equal to an amount of 18.55;
- Peru with a variation from an amount of 53.46 units up to a value of 53.45 units or equal to a value of −0.01 units equal to a value of −0.02%;
- Poland with a variation from an amount of 12.11 units up to a value of 12.09 units or equal to a variation of −0.02 units equal to an amount of −0.17%;
- Qatar with zero variation and an amount of renewable energy production equal to 0.00%;
- Russian Federation with a diminutive variation from an amount of 16.20 units up to a value of 16.19 units or equal to an amount of −0.01 units equal to a value of −0.06%;
- Rwanda with a variation from an amount of 48.18 units up to a value of 48.17 units or equal to a value of −0.01 units equal to −0.02%;
- Sao Tome and Principe with a variation from an amount of 9.71 units up to a value of 9.17 units or equal to a value of −0.54 units equal to a value of −5.56%;
- Seychelles with a variation from an amount of 1.79 units up to a value of 1.08 units or equal to a value of −0.71 units equal to an amount of −39.72%;
- Sierra Leone with a variation from an amount of 64.94 units up to a value of 64.89 units or equal to a value of −0.05 units or equal to a value of −0.08%;
- St. Kitts and Nevis with a variation from an amount of 4.23 units up to a value of 4.19 units equal to an amount of −0.04 units equal to a value of −0.95%;
- Timor-Leste and Trinidad and Tobago with zero variation and an absolute value of renewable energy production equal to an amount of 0.00 units;
- Tuvalu with a variation from an amount of 11.68 units up to a value of 11.66 units up to a value of −0.02 units equal to an amount of −0.14%;
- Uganda with a variation from an amount of 90.23 units up to a value of 90.24 units or equal to an amount of 0.01 units equal to a value of 0.01%;
- United Kingdom with zero variation and an amount of renewable energy production equal to an amount of 19.16%;
- Uruguay with a variation from an amount of 83.14 units up to a value of 83.10 units or equal to a value of −0.04 units equal to a value of −0.05%;
- Zimbabwe with a variation from an amount of 54.88 units up to a value of 54.84 units or equal to a value of −0.04 units equal to a value of −0.07%.
Table 6 shows the results of the predictions.
Table 6.
Predictions with the Best Predictor.
Therefore, considering the average values, it appears that the value of energy production from renewable sources is expected to grow by an amount equal to 0.21 units or equal to a value of 0.83%. From a strictly geographical point of view, it is foreseen that there will be a growth of renewable energies above all in the African continent, China, and in Kazakhstan. It follows that it will certainly be precisely the countries with low per capita incomes that will increase the value of the production of renewable energy. However, it is very probable that investments in scientific and technological research could lead to further growth in the production capacity of renewables such as allowing an increase in use even in countries with higher per capita incomes, which are generally characterized by greater demand for energy.
We used a set of different machine learning algorithms with the aim of identifying which algorithm is more efficient in prediction. In fact, it is not possible to know, without carrying out the necessary analyses, which algorithms are efficient from a predictive point of view without first making a comparison and a statistical analysis of the predictive performance. The abundance of algorithmic tools used for prediction requires a comparative approach. The comparative approach, which is based on the statistical analysis of the predictive performance, is necessary, on the one hand in order not to underestimate the contribution of the algorithms to the prediction, and on the other hand to create rankings of the most efficient algorithms for the analyzed dataset. In the case of renewable energy output, the trend of the data has essentially a linear structure, due to the fact that the percentage variations in the production of renewable energy at the country level tend to grow slowly, or in any case tend to be devoid of maximums and minimums, whether absolute or relative.
Certainly, there are limitations in the dataset used, which do not allow to connect the production of renewable energy to the energy infrastructure at the country level, and which do not even offer the possibility to check for the presence of economic policies which encourage the installation of energy production plants renewable. In fact, it would be necessary to consider the cost, including the institutional one, associated with the growth of the production of renewable energy, due to the need to design appropriate incentives, both for the plants and for the distribution. Furthermore, it would also be necessary to calculate the capacity of renewable energy to guide the country toward the achievement of environmental sustainability objectives compatible with international agreements.
6. Deep Learning and Convolutional Neural Networks-CNN for the Estimation of Renewable Energy Output
The adopted Convolutional Neural Network (CNN) model is developed by Keras (TensorFlow) Deep Learning Python libraries integrated into Konstanz Information Miner (KNIME) workflow. KNIME is a versatile tool useful for testing supervised algorithms [75,76,77,78,79] and also predicting energy in renewable energetic sources [80,81]. The optimized CNN network is characterized by the following hyperparameters: an input layer with 193 inputs (the input matrix dataset is transposed to obtain as rows the temporal succession and as attributes the name of the nations), a dense layer (193 neurons adopting a ReLU activation function), an output dense layer (193 outputs predicting the next two years using Softmax as activation function), 80% of the dataset as training dataset (from year 2022 to year 2018), 20% of the remaining dataset as a testing dataset (data from last two years, 2019 and 2020), 100 epochs, training batch size equals to 100, Adam optimizer (0.001 as learning rate, beta1 equals to 0.9, beta2 equals to 0.999, epsilon equals to 1E−8.0 as learning rate decay). Figure 10a indicates the CNN performance statistics (values of R2, MAE, MSE, RMSE, MSD, MAPE, and adjusted R2 related to the prediction of one nation), Figure 10b summarizes the hyperparameters of the adopted CNN network sketched in the layout of Figure 10c. The supervised algorithm is implemented by the KNIME workflow of Figure 10d. Furthermore are provided the accuracy and the loss functions of the prediction model (see Figure 10e,f). By observing algorithm performance results, we conclude that the analyzed dataset is not suitable for the analysis of more complex networks such as a Deep Learning network: the predicted trend of each nation is correctly checked but the increase in percentage is characterized by a high error. The proposed CNN algorithm is more suitable for forecasting problems involving a large number of years (only data from 2011 to 2020 are available).
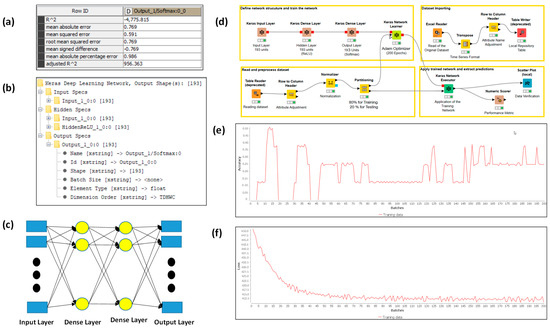
Figure 10.
(a) Statistic of the performance of the CNN implemented model. (b) Screenshot summarizing CNN structure and related hyperparameters. (c) CNN layout, and (d) related KNIME workflow. (e) Accuracy of the prediction. (f) Loss parameter of the predicted results.
7. Implication, Limitations, and Further Research
The implications, limitations, and future developments of research around the role of renewable energy as a tool for environmental sustainability and the circular economy are briefly indicated below.
Implications. The implications of our analysis are above all political. In fact, on the one hand, international policy guidelines appear very clear in proposing a significant reduction in pollutant emissions also through renewable energy and the circular economy, while on the other hand, there are many countries that still have many incentives to grow in GDP through the consumption of non-renewable energy. In this sense, it is especially important to underline the difficulties of developing countries, which, having very low per capita incomes, need to consume large quantities of energy, often non-renewable, to reach a level of per capita income of medium-high level. In this sense, the emancipation of a large part of the world’s population from poverty would require a surplus of pollution and non-renewable energy. A paradoxical condition is therefore created: that is, rich countries have a green orientation while poor countries tend to still be linked to polluting forms of industrial production. In some way, it is about the empirical application of the EKC, even with all the limitations that this model entails. In fact, the EKC cannot be generalized and must be verified on a case-by-case basis through empirical data analysis. However, to guarantee the triggering of the positive externalities associated with the EKC, it is necessary for policymakers to have a strategic vision, especially in developing countries, to prevent economic policies from failing, on the one side of lack of economic growth and industrialization, and on the other side for the destruction of the environment.
Limitations. The limitations of the proposed research primarily concern the difficulty of introducing an analysis that also considers the distinctions between Scope 1, Scope 2, and Scope 3, with reference to CO2 emissions. In fact, in our analysis, we did not exactly calculate the relationship between the use of renewable energy and the impact on Scope 1, Scope 2, and Scope 3, at the country level. A further limitation of our analysis concerns the construction of the dataset. In fact, we limited ourselves to analyzing the environmental variables present in the World Bank’s ESG dataset and did not instead consider other variables that could be very relevant, such as the availability of natural resources such as to be able to activate the production of renewable energy. Furthermore, we have not even considered the sociological, cultural, political, institutional, and value-based elements that have an impact on the orientation toward the production of renewable energy both in connection with environmental sustainability and with reference to the circular economy. The fact that a population is more or less sensitive to the environment has a very significant impact in terms of orientation toward the production of renewable energy. Finally, the fact that a country is open to adopting international climate agreements can create the conditions for an increase in investment in renewable energy. However, we must not only consider elements connected to the dimension of moral and political values. In fact, the considerations relating to the financial and institutional dimensions are also very relevant. In this sense, it is the task of policymakers to design the appropriate financial and tax incentives to allow the installation of renewable energy production plants. It is also necessary to evaluate the quality of policymakers in connection with government effectiveness and the fight against corruption. Finally, a further limitation of our analysis consists in not having analyzed the variables that highlight the efficiency of the distribution and energy accumulation systems at the regional and national levels.
Further research. The regional aspects related to the development of renewable energy need to be analyzed in more detail in further research. In fact, one of the characteristics of renewable energy is that it is produced in a de-localized, decentralized way. Furthermore, it would also be necessary to estimate the maximum production of renewable energy that can be produced nationally based on the analysis of the natural resources that are available. Finally, it is also necessary to consider the impact that investment in research and development can have in increasing the efficiency in the production of renewable energy, allowing overcoming the current technological limits. Furthermore, it is also necessary to develop models to verify how climate change also affects the feasibility of natural resources available for renewable energy production such as wind, to avoid installing plants that are unable to produce because of climate change.
8. Conclusions
The circular economy is an economic policy landing that allows you to completely modify the production and consumption models both in developed countries and in developing countries. However, to make sure that the application of the circular economy is compatible with economic growth, it is also necessary to act in determining the energy production methods. In fact, since economic growth is very expensive in energy terms it is necessary to draw new energy production models that are sustainable. In this sense, it is necessary to develop the production of renewable energies in the context of the circular economy to allow the sustainability of economic growth. Certainly, renewable energies are very useful for quickly reducing CO2 production, global overheating, and offering solutions for energy consumption, especially in rural, and local areas. However, there are limitations in the use of renewable energies including the low energy intensity and the variability of some natural phenomena that are the basis of the production of renewable energy. These limitations must be understood as temporary. In fact, it is very likely that the application of research and development and technological innovation to the production of renewable energy can generate new production methods that can also offer energy to cities and manufacturing industrial systems. In any case, even if the transition to a completely renewable energy system may appear very difficult, poorly effective, and very complex at present, there are still good reasons to increase the presence of renewable energy in the energy balance at the country level and at the level global. Not least, the cultural and value effect must be considered, which can mainly concern developing countries which, through the experience of the production and consumption of renewable energy, can acquire positive expectations about the possibility of a sustainable economic model oriented to a circular economy.
Author Contributions
Conceptualization, L.L., A.M., A.C. and A.L.; methodology, L.L., A.M., A.C., and A.L; software, L.L., A.M., A.C. and A.L.; validation, L.L., A.M., A.C. and A.L.; formal analysis, L.L., A.M., A.C. and A.L.; investigation, L.L., A.M., A.C. and A.L.; resources, L.L., A.M., A.C. and A.L.; data curation, L.L., A.M., A.C. and A.L.; writing—original draft preparation, L.L., A.M., A.C. and A.L.; writing—review and editing, L.L., A.M., A.C. and A.L.; visualization, L.L., A.M., A.C. and A.L.; supervision, L.L., A.M., A.C. and A.L.; project administration, L.L., A.M., A.C. and A.L.; funding acquisition, L.L., A.M., A.C. and A.L. All authors have read and agreed to the published version of the manuscript.
Funding
This research received no external funding.
Data Availability Statement
The data presented in this study are available on request from the corresponding author.
Acknowledgments
We are grateful to the teaching staff of the LUM University Giuseppe Degennaro and to the management of the LUM Enterprise s.r.l. for the constant inspiration to continue our scientific research work undeterred.
Conflicts of Interest
The authors declare no conflict of interest.
References
- World Bank. ESG. Available online: https://datatopics.worldbank.org/esg/ (accessed on 11 December 2022).
- UN, Paris Agreements. Available online: https://unfccc.int/process-and-meetings/the-paris-agreement/the-paris-agreement (accessed on 11 December 2022).
- COP27. COP27. Available online: https://cop27.eg/#/ (accessed on 11 December 2022).
- Nordhaus, W. The Climate Casino: Risk, Uncertainty, and Economics for a Warming World; Yale University Press: Yale, MI, USA, 2013. [Google Scholar]
- Qin, L.; Raheem, S.; Murshed, M.; Miao, X.; Khan, Z.; Kirikkaleli, D. Does financial inclusion limit carbon dioxide emissions? Analyzing the role of globalization and renewable electricity output. Sustain. Dev. 2021, 29, 1138–1154. [Google Scholar] [CrossRef]
- Furuoka, F. Renewable electricity consumption and economic development: New findings from the Baltic countries. Renew. Sustain. Energy Rev. 2017, 71, 450–463. [Google Scholar] [CrossRef]
- Aydin, M. Renewable and non-renewable electricity consumption–economic growth nexus: Evidence from OECD countries. Renew. Energy 2019, 136, 599–606. [Google Scholar] [CrossRef]
- Melnyk, L.; Sommer, H.; Kubatko, O.; Rabe, M.; Fedyna, S. The economic and social drivers of renewable energy development in OECD countries. Probl. Perspect. Manag. 2020, 18, 37–48. [Google Scholar] [CrossRef]
- Bélaïd, F.; Youssef, M. Environmental degradation, renewable and non-renewable electricity consumption, and economic growth: Assessing the evidence from Algeria. Energy Policy 2017, 102, 277–287. [Google Scholar] [CrossRef]
- Belaïd, F.; Zrelli, M.H. Renewable and non-renewable electricity consumption, environmental degradation and economic development: Evidence from Mediterranean countries. Energy Policy 2019, 133, 110929. [Google Scholar] [CrossRef]
- Rehman, A.; Rauf, A.; Ahmad, M.; Chandio, A.A.; Deyuan, Z. The effect of carbon dioxide emission and the consumption of electrical energy, fossil fuel energy, and renewable energy, on economic performance: Evidence from Pakistan. Environ. Sci. Pollut. Res. 2019, 26, 21760–21773. [Google Scholar] [CrossRef]
- Bulavskaya, T.; Reynès, F. Job creation and economic impact of renewable energy in the Netherlands. Renew. Energy 2018, 119, 528–538. [Google Scholar] [CrossRef]
- Atems, B.; Hotaling, C. The effect of renewable and nonrenewable electricity generation on economic growth. Energy Policy 2018, 112, 111–118. [Google Scholar] [CrossRef]
- Bogdanov, D.; Ram, M.; Aghahosseini, A.; Gulagi, A.; Oyewo, A.S.; Child, M.; Caldera, U.; Sadovskaia, K.; Farfan, J.; Barbosa, L.D.S.N.S.; et al. Low-cost renewable electricity as the key driver of the global energy transition towards sustainability. Energy 2021, 227, 120467. [Google Scholar] [CrossRef]
- Hdom, H.A.D. Examining carbon dioxide emissions, fossil & renewable electricity generation and economic growth: Evidence from a panel of South American countries. Renew. Energy 2019, 139, 186–197. [Google Scholar]
- Bhattacharya, M.; Churchill, S.A.; Paramati, S.R. The dynamic impact of renewable energy and institutions on economic output and CO2 emissions across regions. Renew. Energy 2017, 111, 157–167. [Google Scholar] [CrossRef]
- Landis, F.; Böhringer, C.; Reaños, M.A.T. Economic impacts of renewable energy production in Germany. Energy J. 2017, 38. [Google Scholar] [CrossRef]
- Jenniches, S. Assessing the regional economic impacts of renewable energy sources—A literature review. Renew. Sustain. Energy Rev. 2018, 93, 35–51. [Google Scholar] [CrossRef]
- Shahbaz, M.; Raghutla, C.; Chittedi, K.R.; Jiao, Z.; Vo, X.V. The effect of renewable energy consumption on economic growth: Evidence from the renewable energy country attractive index. Energy 2020, 207, 118162. [Google Scholar] [CrossRef]
- Baratsas, S.G.; Pistikopoulos, E.N.; Avraamidou, S. A systems engineering framework for the optimization of food supply chains under circular economy considerations. Sci. Total Environ. 2021, 794, 148726. [Google Scholar] [CrossRef] [PubMed]
- Sassanelli, C.; Rosa, P.; Rocca, R.; Terzi, S. Circular economy performance assessment methods: A systematic literature review. J. Clean. Prod. 2019, 229, 440–453. [Google Scholar] [CrossRef]
- Sherwood, J. The significance of biomass in a circular economy. Bioresour. Technol. 2020, 300, 122755. [Google Scholar] [CrossRef]
- Wang, P.; Wang, J.; Jin, R.; Li, G.; Zhou, M.; Xia, Q. Integrating biogas in regional energy systems to achieve near-zero carbon emissions. Appl. Energy 2022, 322, 119515. [Google Scholar] [CrossRef]
- Zhu, T.; Curtis, J.; Clancy, M. Promoting agricultural biogas and biomethane production: Lessons from cross country studies. Renew. Sustain. Energy Rev. 2019, 114, 109332. [Google Scholar] [CrossRef]
- Korhonen, J.; Honkasalo, A.; Seppälä, J. Circular economy: The concept and its limitations. Ecol. Econ. 2018, 143, 37–46. [Google Scholar] [CrossRef]
- Georgescu-Roegen, N. The Entropy Lawand the Economic Process; Harvard University: Cambridge, MA, USA, 1971. [Google Scholar]
- Schroeder, P.; Anggraeni, K.; Weber, U. The relevance of circular economy practices to the sustainable development goals. J. Ind. Ecol. 2019, 23, 77–95. [Google Scholar] [CrossRef]
- Esposito, M.; Tse, T.; Soufani, K. Introducing a circular economy: New thinking with new managerial and policy implications. Calif. Manag. Rev. 2018, 60, 5–19. [Google Scholar] [CrossRef]
- Suárez-Eiroa, B.; Fernández, E.; Méndez-Martínez, G.; Soto-Oñate, D. Operational principles of circular economy for sustainable development: Linking theory and practice. J. Clean. Prod. 2019, 214, 952–961. [Google Scholar] [CrossRef]
- Sharma, S.; Basu, S.; Shetti, N.P.; Aminabhavi, T. Waste-to-energy nexus for circular economy and environmental protection: Recent trends in hydrogen energy. Sci. Total Environ. 2020, 713, 136633. [Google Scholar] [CrossRef] [PubMed]
- Płuciennik-Koropczuk, E.; Myszograj, S.; Mąkowski, M. Reducing CO2 Emissions from Wastewater Treatment Plants by Utilising Renew. Energy Sources—Case Study. Energies 2022, 15, 8446. [Google Scholar] [CrossRef]
- Proskuryakova, L.N.; Ermolenko, E.G.V. The future of Russia’s renewable energy sector: Trends, scenarios and policies. Renew. Energy 2019, 143, 1670–1686. [Google Scholar] [CrossRef]
- Kong, D.; Liang, J. Analysis on the development of renewable energy power application in the energy transition. IOP Conf. Ser. Earth Environ. Sci. 2021, 766, 012039. [Google Scholar] [CrossRef]
- Abbasi, K.R.; Shahbaz, M.; Zhang, J.; Irfan, M.; Alvarado, R. Analyze the environmental sustainability factors of China: The role of fossil fuel energy and renewable energy. Renew. Energy 2022, 187, 390–402. [Google Scholar] [CrossRef]
- Ahmed, Z.; Mahmud, S.; Acet, H. Circular economy model for developing countries: Evidence from Bangladesh. Heliyon 2022, 8, e09530. [Google Scholar] [CrossRef] [PubMed]
- Liu, B.; Chen, J.; Wang, H.; Wang, Q. Renewable energy and material supply risks: A predictive analysis based on an LSTM model. Front. Energy Res. 2020, 8. [Google Scholar] [CrossRef]
- Wang, Z.; Ben Jebli, M.; Madaleno, M.; Doğan, B.; Shahzad, U. Does export product quality and renewable energy induce carbon dioxide emissions: Evidence from leading complex and renewable energy economies. Renew. Energy 2021, 171, 360–370. [Google Scholar] [CrossRef]
- Gatto, A.; Busato, F. Energy vulnerability around the world: The global energy vulnerability index (GEVI). J. Clean. Prod. 2019, 253, 118691. [Google Scholar] [CrossRef]
- Alwehab, A. The Impact of Renewable Energy Output and Consumption Policies and Environmental Taxes on the Environmental Sustainability. Soc. Space 2022, 22, 216–235. [Google Scholar]
- Sadare, O.O.; Ejekwu, O.; Moshokoa, M.; Jimoh, M.; Daramola, M. Membrane Purification Techniques for Recovery of Succinic Acid Obtained from Fermentation Broth during Bioconversion of Lignocellulosic Biomass: Current Advances and Future Perspectives. Sustainability 2021, 13, 6794. [Google Scholar] [CrossRef]
- Mavi, R.K.; Mavi, N.K.; Saen, R.F.; Goh, M. Common weights analysis of renewable energy efficiency of OECD countries. Technol. Forecast. Soc. Chang. 2022, 185, 122072. [Google Scholar] [CrossRef]
- Magazzino, C.; Mele, M.; Schneider, N. The relationship between municipal solid waste and greenhouse gas emissions: Evidence from Switzerland. Waste Manag. 2020, 113, 508–520. [Google Scholar] [CrossRef]
- Magazzino, C.; Mele, M.; Schneider, N. Renewable energy present status and future potentials in India: An overview. Innov. Green Dev. 2022, 1, 100006. [Google Scholar]
- Alsaleh, M.; Abdul-Rahim, A.; Abdulwakil, M.M. The importance of worldwide governance indicators for transitions toward sustainable bioenergy industry. J. Environ. Manag. 2021, 294, 112960. [Google Scholar] [CrossRef] [PubMed]
- Bhattarai, U.; Maraseni, T.; Apan, A. Assay of renewable energy transition: A systematic literature review. Sci. Total Environ. 2022, 833, 155159. [Google Scholar] [CrossRef]
- Ou, X.; Ye, P.; Failler, P.; March, A. Planning the R&D of marine renewable energy resources: Avoiding bottlenecks and ensuring sustainable development in developing marine economies. Front. Environ. Sci. 2021, 9, 654566. [Google Scholar]
- Li, J.; Ho, M.S.; Xie, C.; Stern, N. China’s flexibility challenge in achieving carbon neutrality by 2060. Renew. Sustain. Energy Rev. 2022, 158, 112112. [Google Scholar] [CrossRef]
- Hassan, S.T.; Batool, B.; Sadiq, M.; Zhu, B. How do green energy investment, economic policy uncertainty, and natural resources affect greenhouse gas emissions? A Markov-switching equilibrium approach. Environ. Impact Assess. Rev. 2022, 97, 106887. [Google Scholar] [CrossRef]
- Hove, A.; Meidan, M.; Andrews-Speed, P. Software Versus Hardware: How China’s Institutional Setting Helps and Hinders the Clean Energy Transition; OIES Paper: Oxford, UK, 2021. [Google Scholar]
- Obuobi, B.; Zhang, Y.; Nketiah, E.; Adu-Gyamfi, G.; Cudjoe, D. Renewable energy demand, financial reforms, and environmental quality in West Africa. Environ. Sci. Pollut. Res. 2022, 29, 69540–69554. [Google Scholar] [CrossRef]
- Saqib, N. Green energy, non-renewable energy, financial development and economic growth with carbon footprint: Heterogeneous panel evidence from cross-country. Econ. Res. Ekonomska Istraživanja 2022, 35, 6945–6964. [Google Scholar] [CrossRef]
- Cho, Y.B.; Cho, Y.S.; Lee, J.G.; Oh, S.C. Design and Implementation of Probabilistic Transient Stability Approach to Assess the High Penetration of Renewable Energy in Korea. Sustainability 2021, 13, 4205. [Google Scholar] [CrossRef]
- Huang, P.; Westman, L.; Broto, V.C. A culture-led approach to understanding energy transitions in China: The correlative epistemology. Trans. Inst. Br. Geogr. 2021, 46, 900–916. [Google Scholar] [CrossRef]
- Martínez, J.M.G.; Puertas, R.; Martín, J.M.M.; Soriano, D.E.R. Digitalization, innovation and environmental policies aimed at achieving sustainable production. Sustain. Prod. Consum. 2022, 32, 92–100. [Google Scholar] [CrossRef]
- Levidow, L.; Raman, S. Metamorphosing waste as a resource: Scaling waste management by ecomodernist means. Geoforum 2019, 98, 108–122. [Google Scholar] [CrossRef]
- Xia, Q. Does green technology advancement and renewable electricity standard impact on carbon emissions in China: Role of green finance. Environ. Sci. Pollut. Res. 2022, 30, 6492–6505. [Google Scholar] [CrossRef]
- Rechsteiner, R. German energy transition (Energiewende) and what politicians can learn for environmental and climate policy. Clean Technol. Environ. Policy 2021, 23, 305–342. [Google Scholar] [CrossRef] [PubMed]
- Leal-Arcas, R.; Santos, F.; Papadea, D. Energy, Electricity and Smart Grids in Latvia and Portugal–Developments and Concerns. Kentucky J. Equine. Agric. Nat. Resour. Law 2020, 12, 2. [Google Scholar] [CrossRef]
- Dong, J.; Nie, S.; Huang, H.; Yang, P.; Fu, A.; Lin, J. Research on economic operation strategy of CHP microgrid considering renewable energy sources and integrated energy demand response. Sustainability 2019, 18, 4825. [Google Scholar] [CrossRef]
- Dastas, M.B.; Song, H. Renewable Energy Generation Assessment in Terms of Small-Signal Stability. Sustainability 2019, 11, 7079. [Google Scholar] [CrossRef]
- Behabtu, H.A.; Messagie, M.; Coosemans, T.; Berecibar, M.; Anlay Fante, K.; Kebede, A.A.; Mierlo, J.V. A review of energy storage technologies’ application potentials in renewable energy sources grid integration. Sustainability 2020, 12, 10511. [Google Scholar] [CrossRef]
- Wu, J.; Tan, Z.; Wang, K.; Liang, Y.; Zhou, J. Research on multi-objective optimization model for hybrid energy system considering combination of wind power and energy storage. Sustainability 2021, 13, 3098. [Google Scholar] [CrossRef]
- Dong, J.; Zhang, Y.; Wang, Y.; Liu, Y. A two-stage optimal dispatching model for micro energy grid considering the dual goals of economy and environmental protection under CVaR. Sustainability 2021, 13, 10173. [Google Scholar] [CrossRef]
- Liu, H.; Wang, Y.; Nie, S.; Wang, Y.; Chen, Y. Multistage Economic Scheduling Model of Micro-Energy Grids Considering Flexible Capacity Allocation. Sustainability 2022, 14, 9013. [Google Scholar] [CrossRef]
- Tang, L.; Gou, X.; Liang, J.; Yang, Y.; Yuan, X.; Yang, J.; Yan, Y.; Wang, D.; Wang, Y.; Chen, X.; et al. A Two-Stage Planning Optimization Study of an Integrated Energy System Considering Uncertainty. Sustainability 2022, 14, 3645. [Google Scholar] [CrossRef]
- Alharthi, Y.Z.; Siddiki, M.K.; Chaudhry, G.M. Resource assessment and techno-economic analysis of a grid-connected solar PV-wind hybrid system for different locations in Saudi Arabia. Sustainability 2018, 10, 3690. [Google Scholar] [CrossRef]
- Dong, J.; Chen, Z.; Dou, X. The Influence of Multiple Types of Flexible Resources on the Flexibility of Power System in Northwest China. Sustainability 2022, 14, 11617. [Google Scholar] [CrossRef]
- Dinç, D.T.; Akdoğan, E.C. Renewable energy production, energy consumption and sustainable economic growth in Turkey: A VECM approach. Sustainability 2019, 11, 1273. [Google Scholar] [CrossRef]
- Ma, L.; Xu, D. Toward renewable energy in china: Revisiting driving factors of Chinese wind power generation development and spatial distribution. Sustainability 2021, 13, 9117. [Google Scholar] [CrossRef]
- Yang, C.; Namahoro, J.P.; Wu, Q.; Su, H. Renewable and Non-Renewable Energy Consumption on Economic Growth: Evidence from Asymmetric Analysis across Countries Connected to Eastern Africa Power Pool. Sustainability 2022, 14, 16735. [Google Scholar] [CrossRef]
- Raza, M.A.; Aman, M.M.; Rajpar, A.H.; Bashir, M.B.A.; Jumani, T.A. Towards Achieving 100% Renewable Energy Supply for Sustainable Climate Change in Pakistan. Sustainability 2022, 14, 16547. [Google Scholar] [CrossRef]
- Abdalla, A.N.; Ju, Y.; Nazir, M.S.; Tao, H. A Robust Economic Framework for Integrated Energy Systems Based on Hybrid Shuffled Frog-Leaping and Local Search Algorithm. Sustainability 2022, 14, 10660. [Google Scholar] [CrossRef]
- Ben-Salha, O.; Hakimi, A.; Zaghdoudi, T.; Soltani, H.; Nsaibi, M. Assessing the Impact of Fossil Fuel Prices on Renewable Energy in China Using the Novel Dynamic ARDL Simulations Approach. Sustainability 2022, 14, 10439. [Google Scholar] [CrossRef]
- Lee, M.; Yoon, M.; Cho, J.; Choi, S. Probabilistic Stability Evaluation Based on Confidence Interval in Distribution Systems with Inverter-Based Distributed Generations. Sustainability 2022, 14, 3806. [Google Scholar] [CrossRef]
- Massaro, A. Electronic in Advanced Research Industry: From Industry 4.0 to Industry 5.0 Advances; Wiley: New York, NY, USA, 2021. [Google Scholar]
- Massaro, A.; Vitti, V.; Galiano, A.; Morelli, A. Business Intelligence Improved by Data Mining Algorithms and Big Data Systems: An Overview of Different Tools Applied in Industrial Research. Comput. Sci. Inf. Technol. 2019, 7, 1–21. [Google Scholar] [CrossRef]
- Massaro, A.; Manfredonia, I.; Galiano, A.; Xhahysa, B. Advanced Process Defect Monitoring Model and Prediction Improvement by Artificial Neural Network in Kitchen Manufacturing Industry: A Case of Study. In Proceedings of the II Workshop on Metrology for Industry 4.0 and IoT (MetroInd4.0&IoT), Naples, Italy, 4–6 June 2019; pp. 64–67. [Google Scholar]
- Massaro, A.; Galiano, A.; Scarafile, D.; Vacca, A.; Frassanito, A.; Melaccio, A.; Solimando, A.; Ria, R.; Calamita, G.; Bonomo, M.; et al. Telemedicine DSS-AI Multi Level Platform for Monoclonal Gammopathy Assistance. In Proceedings of the IEEE International Symposium on Medical Measurements and Applications (MeMeA), Bari, Italy, 1 June–1 July 2020; pp. 1–5. [Google Scholar]
- Massaro, A. Multi-Level Decision Support System in Production and Safety Management. Knowledge 2022, 2, 682–701. [Google Scholar] [CrossRef]
- Massaro, A. Advanced Control Systems in Industry 5.0 Enabling Process Mining. Sensors 2022, 22, 8677. [Google Scholar] [CrossRef] [PubMed]
- Massaro, A.; Starace, G. Advanced and Complex Energy Systems Monitoring and Control: A Review on Available Technologies and Their Application Criteria. Sensors 2022, 22, 4929. [Google Scholar] [CrossRef] [PubMed]
- WB. Cooling Degree Days, World Bank. Available online: https://databank.worldbank.org/metadataglossary/environment-social-and-governance-(esg)-data/series/EN.CLC.CDDY.XD (accessed on 12 January 2023).
- WB. CO2 Emissions, World Bank. Available online: https://data.worldbank.org/indicator/EN.ATM.CO2E.PC (accessed on 12 January 2023).
- WB. Adjusted Savings: Natural Resources Depletion (% of GNI), World Bank. Available online: https://databank.worldbank.org/metadataglossary/world-development-indicators/series/NY.ADJ.DRES.GN.ZS. (accessed on 12 January 2023).
- WB. Agriculture, Forestry, and Fishing, Value Added (% of GDP), World Bank. Available online: https://databank.worldbank.org/metadataglossary/world-development-indicators/series/NV.AGR.TOTL.ZS. (accessed on 12 January 2023).
- WB. Electricity Production from Coal Sources (% of total), World Bank. Available online: https://databank.worldbank.org/metadataglossary/world-development-indicators/series/EG.ELC.COAL.ZS (accessed on 12 January 2023).
- WB. Agricultural Land (% of Land Area), World Bank. Available online: https://databank.worldbank.org/metadataglossary/world-development-indicators/series/AG.LND.AGRI.ZS (accessed on 12 January 2023).
- WB. Energy Use (Kg of Oil Equivalent per Capita), World Bank. Available online: https://databank.worldbank.org/metadataglossary/world-development-indicators/series/EG.USE.PCAP.KG.OE (accessed on 12 January 2023).
- WB. Access to Electricity % of Population, World Bank. Available online: https://databank.worldbank.org/metadataglossary/world-development-indicators/series/EG.ELC.ACCS.ZS (accessed on 12 January 2023).
- WB. Forest Area (% of Land Area), World Bank. Available online: https://databank.worldbank.org/metadataglossary/world-development-indicators/series/AG.LND.FRST.ZS (accessed on 1 December 2022).
- WB. PM2.5 Air Pollution, Mean Annual Exposure (Micrograms Per Cubic Meter), World Bank. Available online: https://databank.worldbank.org/metadataglossary/world-development-indicators/series/EN.ATM.PM25.MC.M3 (accessed on 12 January 2023).
- WB. Fossil Fuel Energy Consumption (% of Total), World Bank. Available online: https://databank.worldbank.org/metadataglossary/world-development-indicators/series/EG.USE.COMM.FO.ZS (accessed on 12 January 2023).
- WB. Renewable Energy Consumption (% of Total Final Energy Consumption), World Bank. Available online: https://databank.worldbank.org/metadataglossary/world-development-indicators/series/EG.FEC.RNEW.ZS (accessed on 12 January 2023).
- WB. Adjusted Savings: Net Forest Depletion (% of GNI), World Bank. Available online: https://databank.worldbank.org/metadataglossary/world-development-indicators/series/NY.ADJ.DFOR.GN.ZS (accessed on 12 January 2023).


Disclaimer/Publisher’s Note: The statements, opinions and data contained in all publications are solely those of the individual author(s) and contributor(s) and not of MDPI and/or the editor(s). MDPI and/or the editor(s) disclaim responsibility for any injury to people or property resulting from any ideas, methods, instructions or products referred to in the content. |
© 2023 by the authors. Licensee MDPI, Basel, Switzerland. This article is an open access article distributed under the terms and conditions of the Creative Commons Attribution (CC BY) license (https://creativecommons.org/licenses/by/4.0/).