Article

Water Reuse through Membrane Technologies for a Dairy Plant Using Water Pinch Simulation Software

by
Jonathan Cawettiere Espíndola
1,*,
José Carlos Mierzwa
1,
Míriam Cristina Santos Amaral
2 and
Laura Hamdan De Andrade
3
1
International Reference Center on Water Reuse of the University of São Paulo (IRCWR-USP), Environmental and Hydraulic Department (PHA), Polytechnic School of the University of São Paulo (USP), São Paulo 05508-020, SP, Brazil
2
Department of Sanitary and Environmental Engineering, Federal University of Minas Gerais, P.O. Box 1294, Belo Horizonte 30270-901, MG, Brazil
3
Department of Chemical Engineering, Pontifical Catholic University of Minas Gerais, Belo Horizonte 30535-901, MG, Brazil
*
Author to whom correspondence should be addressed.
Sustainability 2023, 15(3), 2540; https://doi.org/10.3390/su15032540
Submission received: 29 November 2022 / Revised: 17 January 2023 / Accepted: 28 January 2023 / Published: 31 January 2023

Abstract

:
The main goal of this study is to evaluate possible reuse routes of effluents from adairy plant. First, the water flow in the plant was evaluated. All water consumed and effluents generated by the industrial process were quantified and characterized. In addition, the water quality parameters required for different industrial activities were assessed. Secondly, a treatment system using a membrane bioreactor and a nanofiltration reactor, from a study previously conducted by the authors, was considered. Then, a water pinch analysis was carried out through the application of the collected data using the Water Pinch software. Both direct reuse/recycle and regeneration schemes were investigated. In this context, although the direct reuse/recycle of effluents were shown to be able to reduce the freshwater use for the clean-in-place process (CIP) by 33.4%; the schemes with the regeneration of the effluents showed up to 66.7% and 95.4% of freshwater reduction for the CIP and general processes, respectively. Finally, four water reuse routes were proposed. The proposed route combining the most advanced treatment technologies studied showed the best performance in terms of reduction of the total freshwater consumption (69.5%) in the dairy plant.

1. Introduction

When considering all of the industrial activities, the food sector is the one with the highest water consumption and effluent generation, per production unit. Following the chemical and refinery sectors, the dairy sector ranks third in volume of water usage and effluent output [1]. According to the Food and Agriculture Organization (FAO) of the United Nations, the global milk production in 2019 was 852 million tons, showing a 1.4-fold increase, when compared to 2018. Brazil, the fifth-biggest world milk producer, was one of the countries responsible for this growth due to the 3.1% increase in the produced volume [2]. Although as an activity of great social and economic importance, the dairy industries include many processes which present a high water demand, which results in a significant amount of effluents in practically all stages of the production process, which is a major environmental concern. The generated effluents are rich in organic compounds, such as fats, protein, lipids, and have a high “biochemical oxygen demand/chemical oxygen demand” (BOD/COD) values, which present a high pollution potential (e.g., eutrophication of water bodies) if released into the surroundings without proper treatment [3]. Notwithstanding, the background of the lower availability of water for use in production processes, combined with the increasingly strict legislations regarding the release of effluents into water bodies, has encouraged the industrial sector to develop better water management practices [4,5]. In this context, wastewater treatment and reuse routes appear to be an option for minimizing freshwater usage and effluent generation in the industry [6].
Several approaches have been applied for dairy wastewater treatment, which mainly involve the removal of organic matter and nutrients through biological processes. However, to promote a safe water reuse scheme, it is necessary to use complementary treatment technologies to improve the removal of specific contaminants, such as dissolved salts and residual organics [7]. Technologies, such as reverse osmosis, electrodialysis, ion exchange and nanofiltration can be used as a polishing step for this purpose [7,8,9]. Andrade et al. [10] studied a hybrid approach by applying a biological reactor with microfiltration membranes followed by a post-treatment with nanofiltration (NF) membranes. This system can be considered an alternative for advanced treatment, as it is quite efficient in terms of residual pollutants removal, and generating an effluent of high quality that can be reused at different stages of the industrial process. It is noteworthy that membrane technologies are present in most industrial water reuse plans [11,12,13]. This is due to the fact that this technology is able to produce highly purified recycled water as it works as a pollutants barrier, allowing only the permeation of small molecules and water through the membrane pores [11].
Both freshwater and wastewater flows can be reduced simultaneously (in-plant water recovery) when water reuse is adopted, leading to improved water footprint values [14]. For that, several tools of process integration and pinch analysis have been developed to create water recovery networks. The technique consists of two stages: 1) determination of the minimum fresh water and wastewater flow rates needed for a process based on the mass balance principle; and 2) design of the network to achieve the minimum flow rate targets [15]. In this context, it is worth pointing out three important concepts: (i) reuse—the water applied in a specific process is reutilized in a different process; (ii) recycle—the water applied in a process is partially or completely recycled to the same process; and (iii) regeneration—water sources are totally or partially treated to improve its quality before they are directed for reuse/recycle schemes [4].
To date, various water pinch analysis techniques have been developed and applied for improving the water management in industries [4,5,16,17,18]. However, there are no comprehensive studies focusing on understanding the correlation between water treatment efficiencies and water reuse opportunities in the dairy industry, to create the best reuse route.
Therefore, the main objective of this work is to evaluate possible reuse routes of the effluents from a dairy plant, considering the water quality requirements for each use. This study is justified by the water stress scenario experienced in different areas worldwide (e.g., in the area where the plant is located). First, the dairy plant case study was described. All water consumed and effluents generated by the industrial process were quantified. Samples of these effluents were collected and characterized. In addition, the water quality parameters required for different industrial activities were assessed. The data related to the treatment efficiencies using a membrane bioreactor (MBR) and NF systems previously conducted by the authors [10] was considered. Total dissolved solids (TSs) and chemical oxygen demand (COD) were taken as leading water quality parameters in the water streams. Finally, water pinch analysis was carried out through the application of the collected data on the Water Pinch software to assess the potential to reduce industrial water usage and effluent generation. Both direct reuse/recycle and regeneration schemes were investigated, and water reuse routes were proposed.

2. Materials and Methods

2.1. Water Usage Assessment in the Dairy Industry

A large dairy industrial plant located in the Minas Gerais state, Brazil, has been chosen as a site for investigation. The selected industrial plant addresses its water requirements by using mainly freshwater (either potable water, surface water or groundwater occasionally), with the exception of a portion of the water used in the clean-in-place (CIP) process, which is recirculated. Considering the main activities developed in the dairy industry it was possible to identify six main water uses, namely: (i) CIP’s; (ii) toilets; (iii) food processing; (iv) cooling; (v) heating; and (vi) others (various uses). Figure 1 shows a schematic of the macro water balance at the studied dairy plant.
The studied dairy plant, apart from processing the collected raw milk, manufactures various milk derived products, such as yogurt, cheese, cottage cheese and Petit Suisse. The dairy requires an average of 2085 m3 of water per day. Dairy products processing involves a daily usage of 486 m3. The use of toilets takes up 76 m3 of water per day. The water requirement for the cooling tower and boiler feed are 249 and 40 m3 day−1, respectively. The 13 m3 of water used per day in floor washing, vehicle washing and other similar uses are clubbed in the “Others” section of the scheme. Clean-in-place accounts for the maximum consumption of fresh water which is 1221 m3 day−1.
CIP is a three-stage process: (i) first stage—rinsing of equipment with water, (ii) second stage—washing the equipment with sodium hydroxide and detergent solutions to wash out the microorganisms, (iii) third stage—washing out leftover lye in the equipment with water. Usually, the CIP system re-utilizes the washed-out water used in its second and third stage for rinsing the equipment in its first stage. Indeed, the CIP process at the studied plant consumes 610.5 m3water d−1 in each one of the three stages, however, as the water for the first stage is reused water, the total water consumption of the CIP process is 1221 m3 d−1 (Figure 1).

2.2. Water Samples

The effluent samples evaluated in this study were collected from the dairy plant, located in the state of Minas Gerais, Brazil. These samples were collected via grab sampling in three different sampling points, namely: (i) SP1—after the first wash of the CIP process; (ii) SP2—on the water reuse tank (effluents from the second and third washing of the CIP process); and (iii) SP3—the final effluent of the plant after the stages of sieving and flotation with compressed air (effluents from all of the processes except the one from toilets). Collected samples were preserved via acidification in the samples’ flasks and conditioned under cooling.

2.3. Analytical Determinations

All physicochemical analyses were carried out in the laboratories of the Department of Sanitary and Environmental Engineering of the Federal University of Minas Gerais, following the methodology of the “standard methods for the examination of water and wastewater” [19]. The analyses performed and their respective identification codes were: chemical oxygen demand—COD (Code 5220), solids’ series (Code 2540), pH (Code 4500), and conductivities (Code 2510).

2.4. Dairy Effluent Treatment Data

The data relating to the dairy effluent treatment by a membrane bioreactor and a nanofiltration system were obtained from a previous work [10]. The MBR system was composed of one submerged hollow fiber microfiltration module (polyetherimide, average pore size of 0.5 µm, membrane area of 0.044 m2, packing density of 500 m2 m−3) and three acrylic tanks: (i) a 40 L feed storage tank, (ii) a 4.4 L biological tank, into which the membrane module was housed, and (iii) a 5 L tank for permeate storing. The nanofiltration system consisted of an NF90 commercial membrane inserted into a stainless-steel cell (62 cm2 filtration area), and the recovery rate of the nanofiltration treatment is 50%. The membrane water permeability presented a mean value of 2.3 L h−1 m−2 bar−1. Table 1 presents the data related to the treatment efficiencies of the effluents from the dairy plant using the evaluated systems.

2.5. Water Pinch Analysis

Water pinch analysis (WPA) was adopted to determine the minimum freshwater requirements and maximum recycle/reuse (with and without regeneration) through the integration of water-using activities or processes. The typical WPA solution is based on two steps: setting the water targets, followed by network design to achieve the targets. COD and TS were selected as water targets. These parameters were considered “restrictive” for the evaluation of the water reuse according to the possible applications in the plant [17]. Both properties (water targets) were analyzed by considering single (one property at a time in process) and double (two properties together at the same time) target approaches. In targeting the minimum utility requirements and in locating the pinch points, a graphical method, namely the composite curves of “concentration vs. mass load” was used to carry out the required objective.
In this stage, the quantitative and qualitative data of the waters used in the industrial processes and of the treated effluents were input in the “Water Pinch software”. The software was made available by the “Virginia Polytechnic Institute and State University” free for download and without the need of any documentation, at the university webpage (https://www.vt.edu/ (accessed on: 3 September 2022)). The assessment of both reuse/recycle and regeneration schemes were conducted through the analysis of the required quality of the waters for each process and the quality of the effluents with and without treatment. Then, possible water reuse routes were proposed.

3. Results

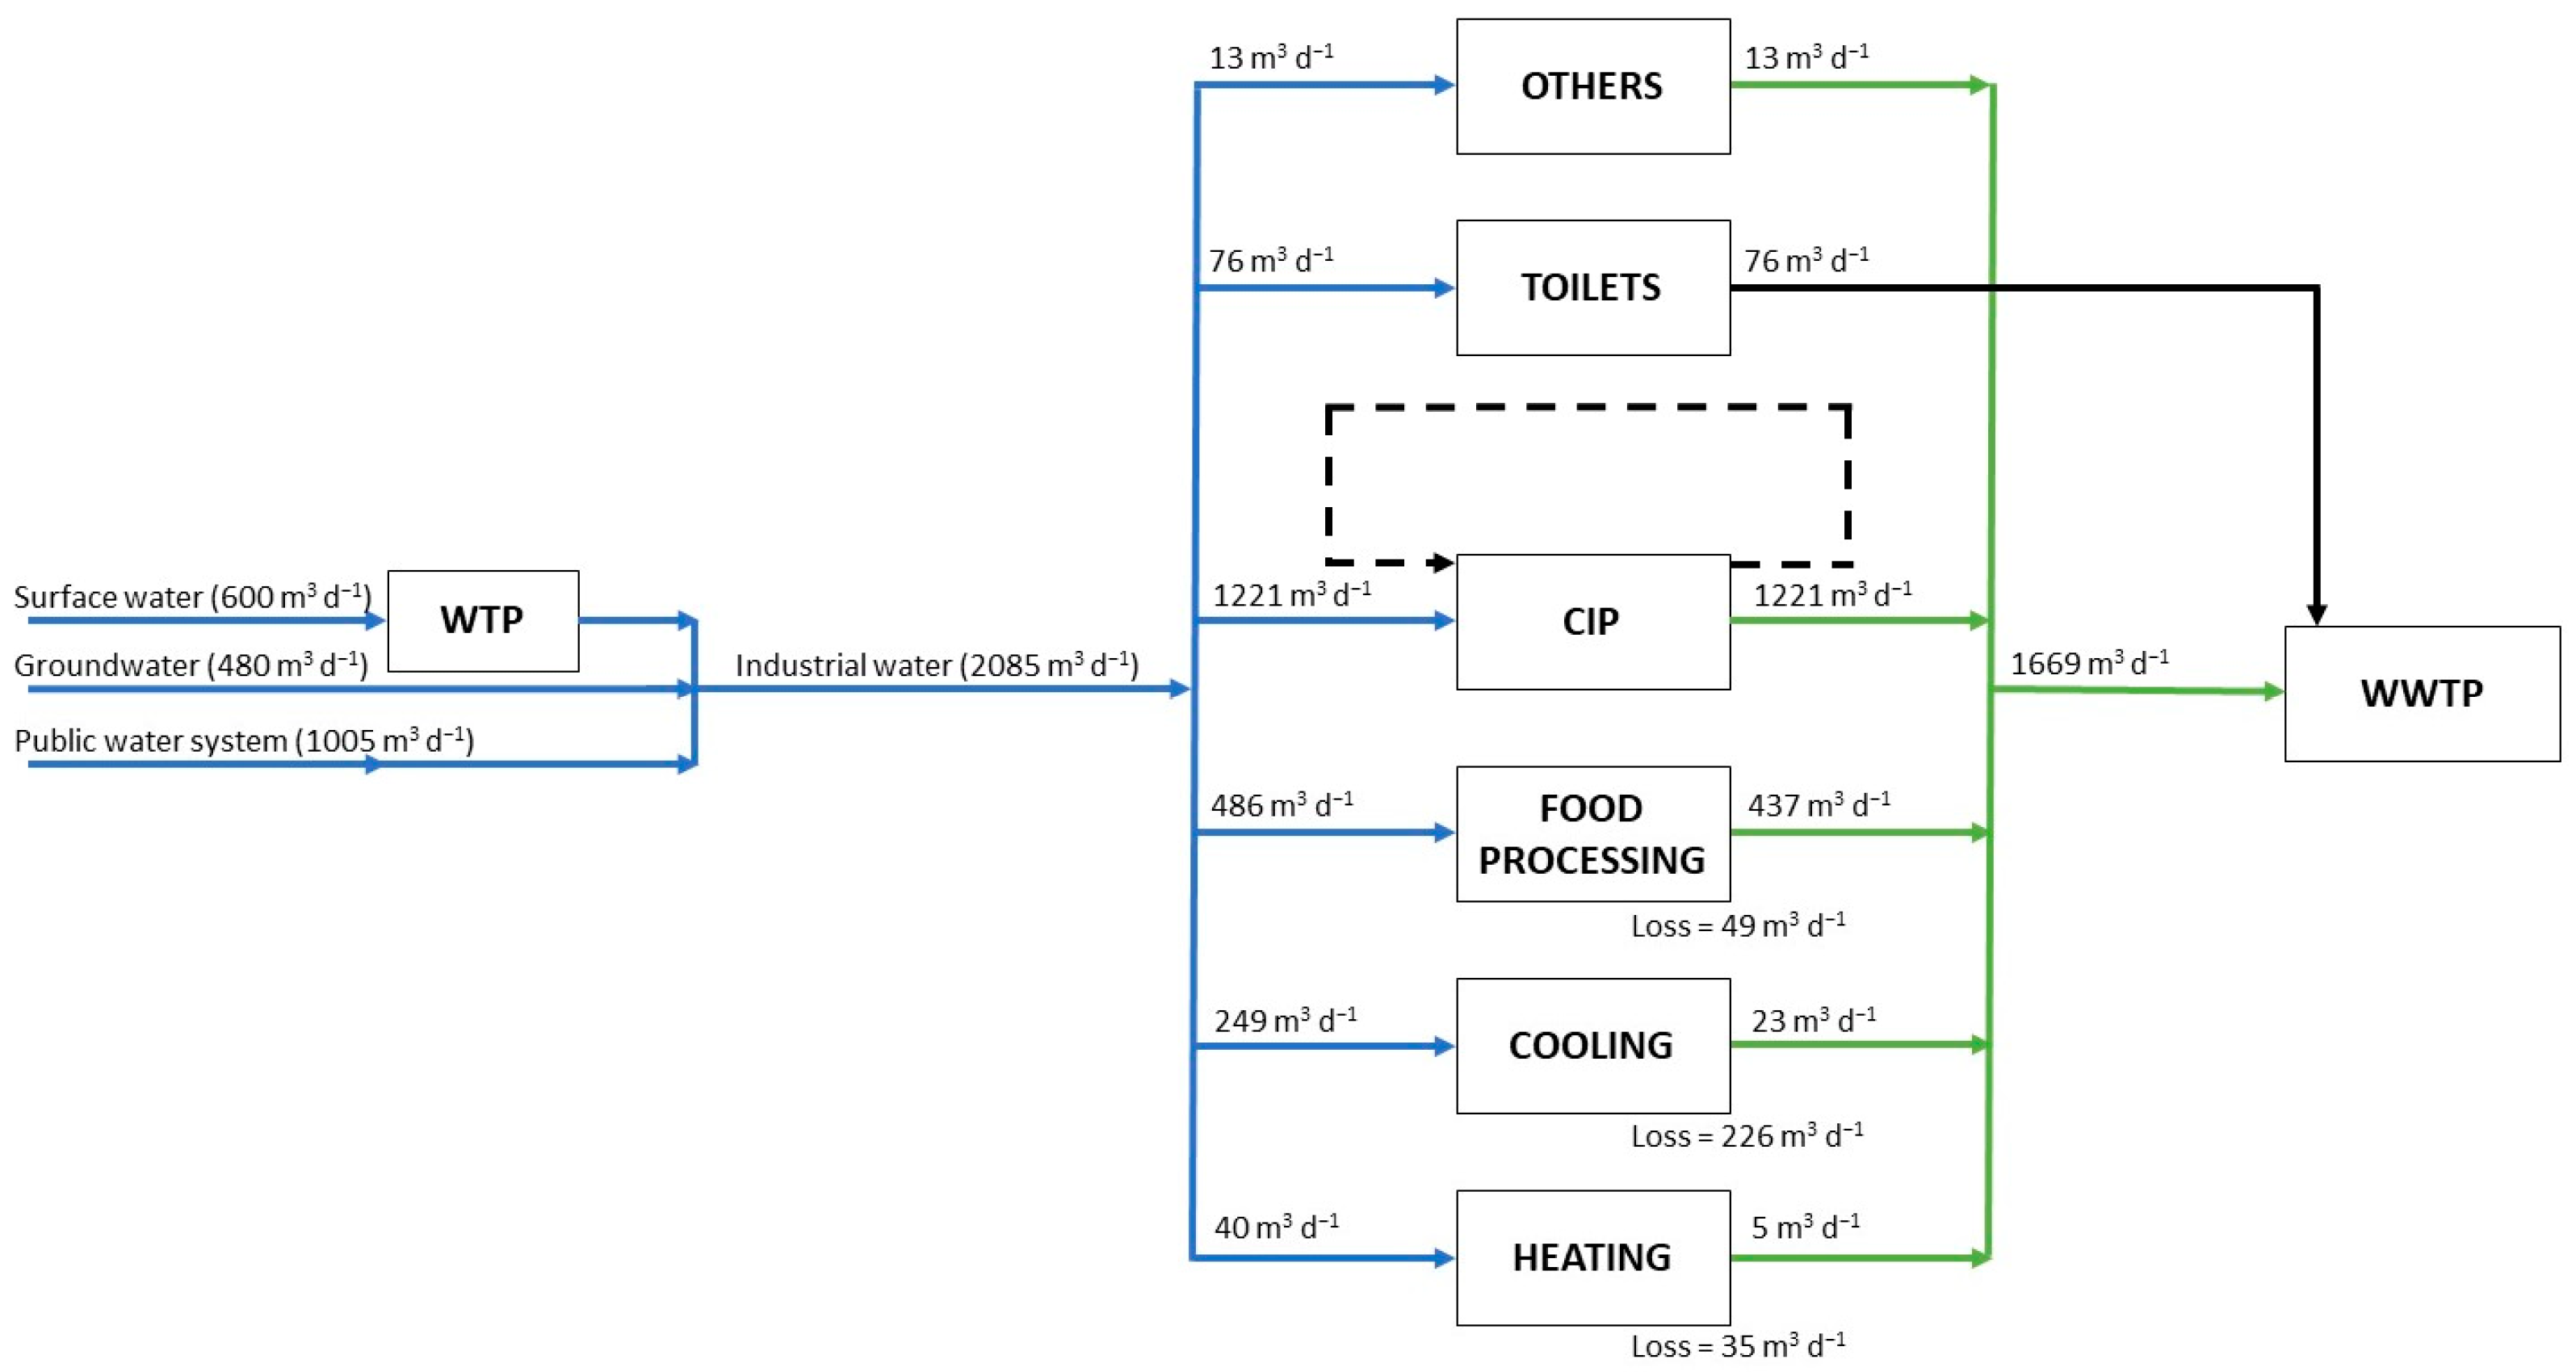
3.1. Assessment of Water Consumption and the Effluents Characterization at the Dairy Plant

The area where the plant is located is experiencing significant water stress. It is not uncommon that during the operating hours of the plant, there are moments when no water is supplied by the public water supply network, which restricts the operation of some industrial areas. It is also worth mentioning that the use of only mains water should, in general, be avoided as not only does it increase the running cost of the plant but also the treatment to achieve potable water quality standards requires high energy consumption and such high-quality water is not required for some processes. Indeed, the latter fact indicates that water reuse routes may be feasible in the plant. To evaluate the possible reuse routes, a survey of the water quality standards required (input parameters) for each industrial process was carried out. Additionally, the effluents were also characterized (output parameters). Details about the different water-using processes, as depicted in Figure 1, are provided in Table 2. COD and TS were considered restrictive parameters for possible applications in the plant [20].
The plant’s wastewater treatment system receives the effluent generated in all the industrial processes mentioned. The system is composed of a preliminary sieving stage, followed by dissolved air flotation and biological treatment in an activated sludge reactor. To allow safer reuse, the effluents from the toilet were not considered for reuse purposes in this study. The final effluent used in this study was collected at sampling point 3 (SP3), after sieving and flotation stages. This effluent can be directly reused/recycled or regenerated (by using the MBR or the MBR + NF system) and then reused in industrial processes. Since the effluents generated at the CIP process have a high potential for reuse (i.e., large amounts and possible good quality), they were characterized separately from the other processes. The first stage of the CIP process produces an effluent with a great mass load (as observed in Table 2) and it is not directed to the reuse tank, collected at the sampling point (SP1). Both effluents from the second and third stages are sent to the reuse tank (SP2). As expected, this effluent possesses much lower values of COD and TS when compared to the effluent from the first stage (i.e., first wash) (Table 2).
Considering the water stress scenario in the area where the dairy plant is located and the observed water reuse opportunities, the development of a water management/reuse plan was carried out.

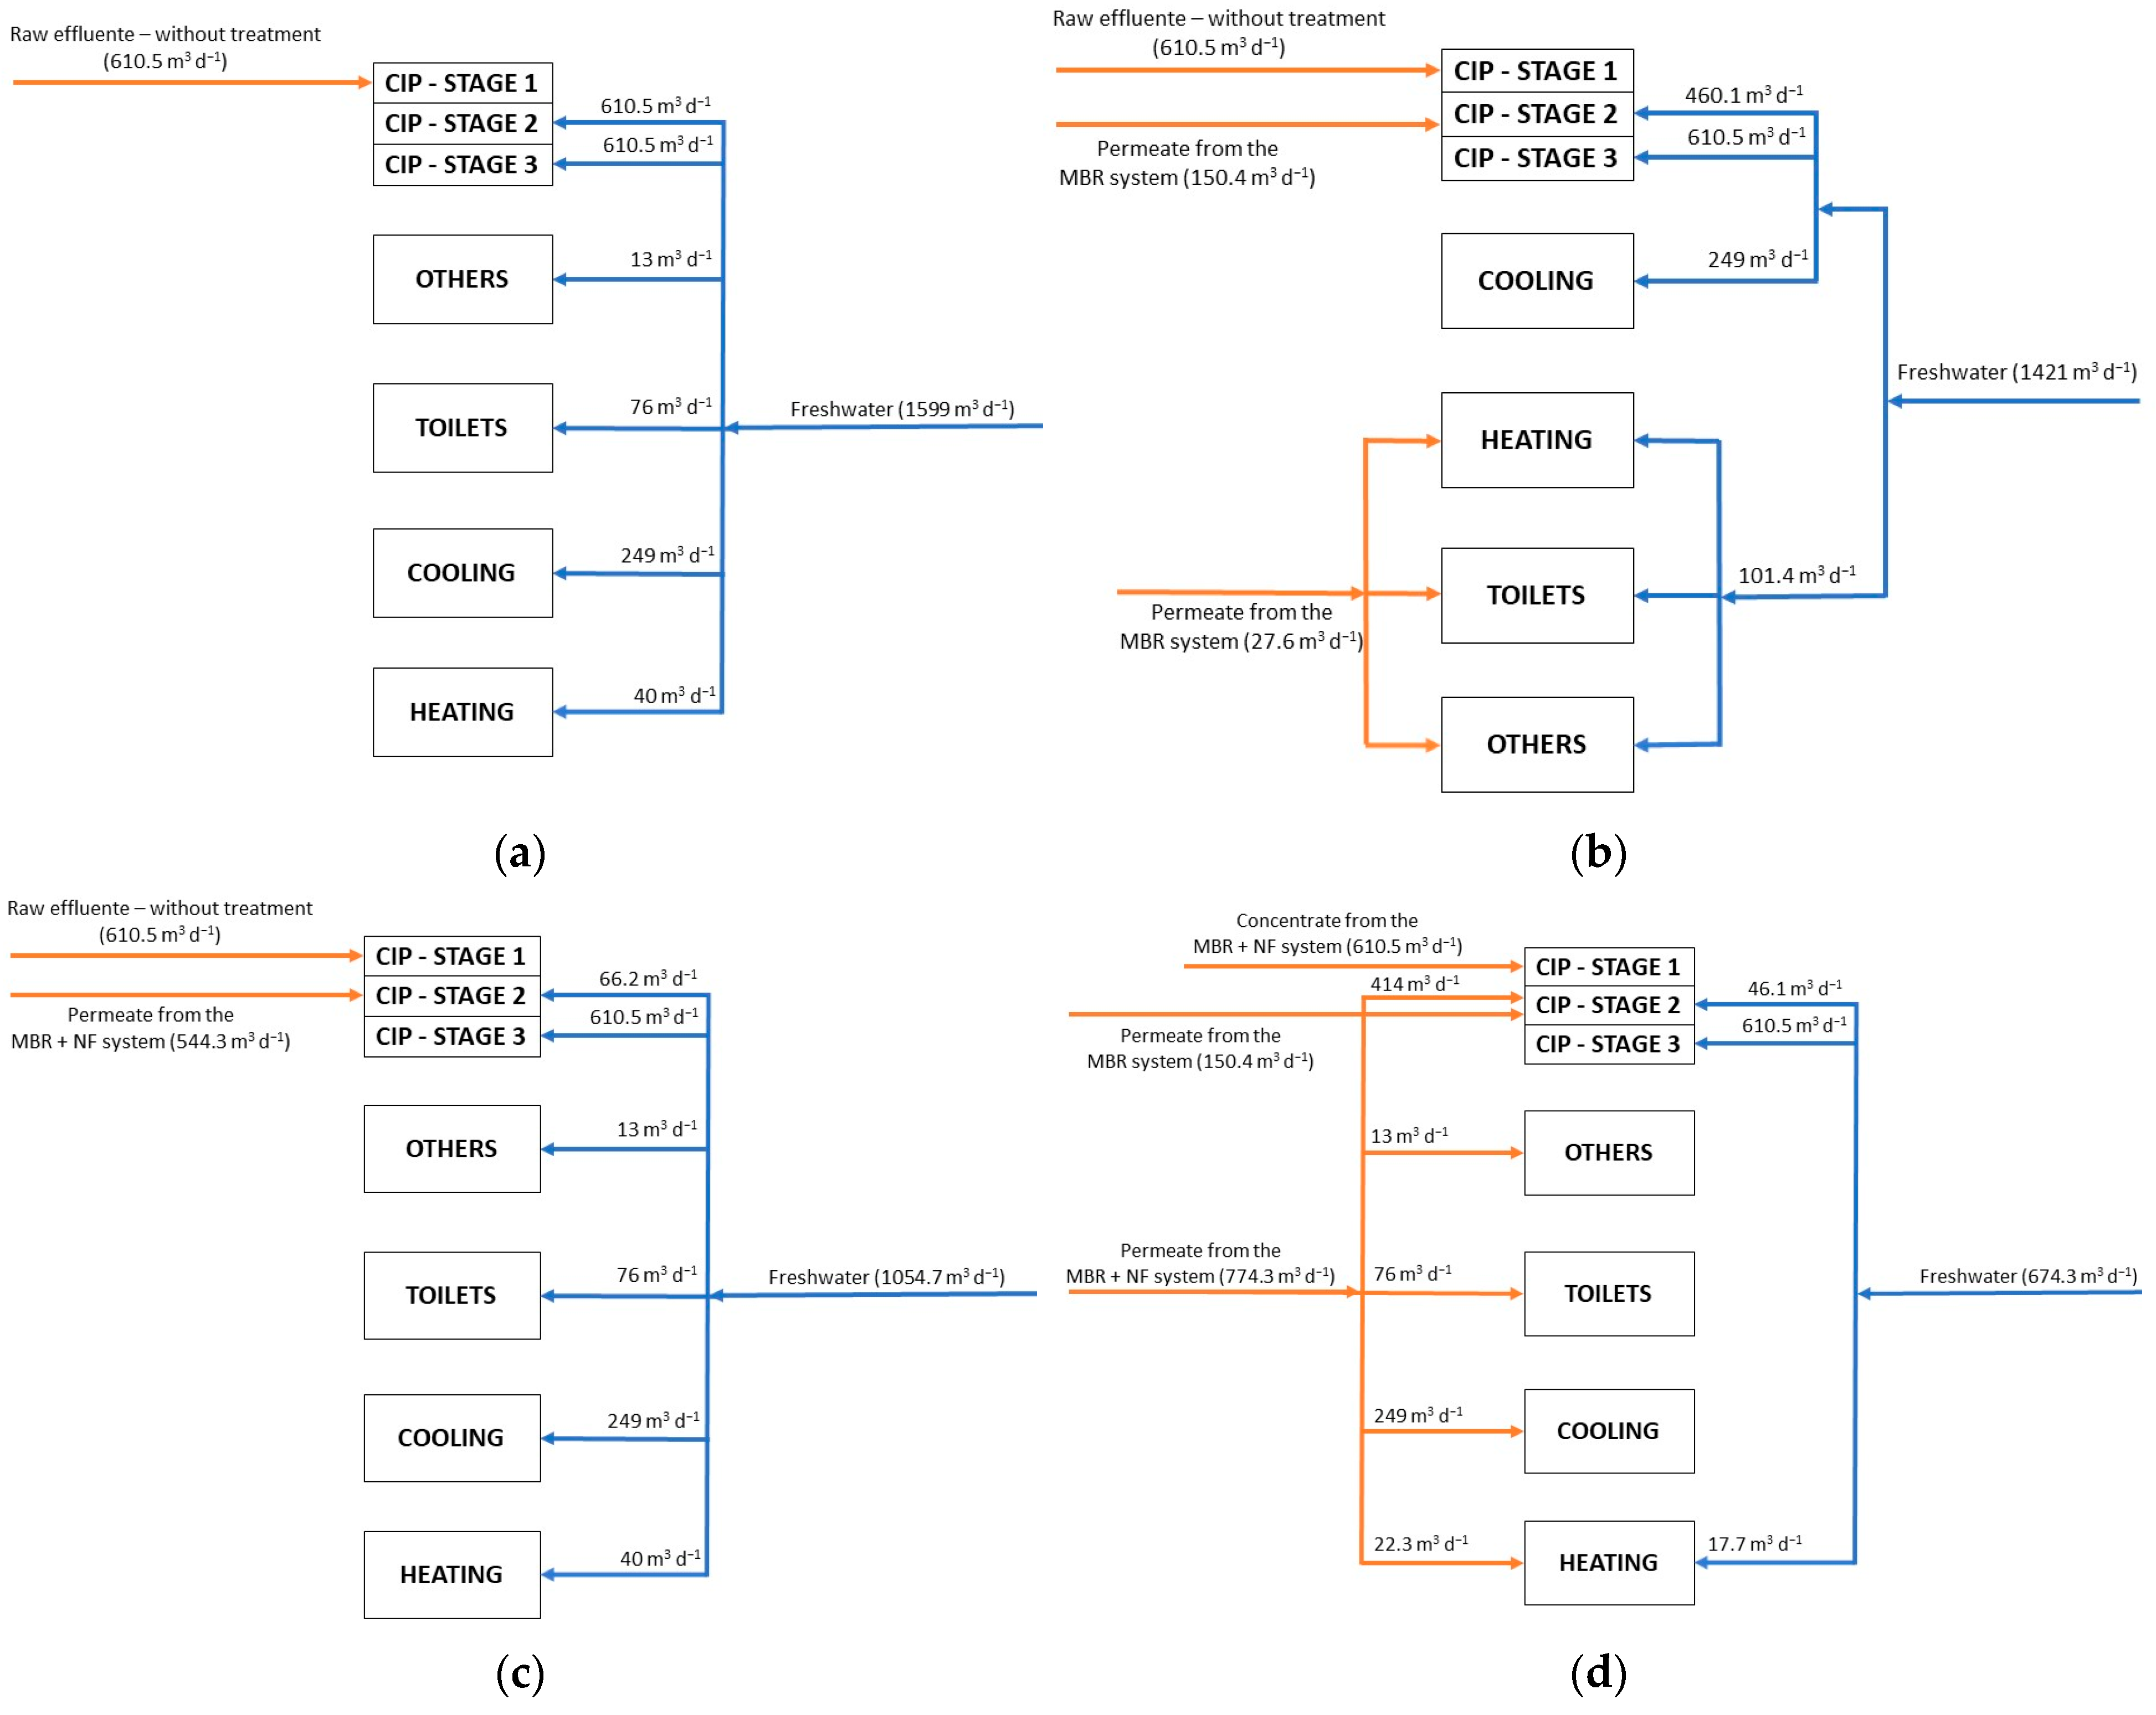
3.2. Application of the Water Pinch Analysis for Freshwater Reduction

For the purpose of the water pinch analysis, it was accepted that mains water, groundwater and surface water can be used as freshwater sources within the plant, as described above; and when regenerated water is required, sufficient quantity is stored in the reuse tank.
Three water reuse schemes were evaluated: (i) direct reuse/recycle, (ii) regeneration with the MBR system, and (iii) regeneration with the MBR + NF systems. Then, reuse routes were proposed to see their contribution to the water footprint reduction for the industrial processes.

3.2.1. Direct Reuse/Recycle of Spent Process Water

To evaluate the potential for direct water reuse/recycle, the proposed treatment units in the plant (MBR and NF systems) were excluded from the analysis. Thus, the use of the final effluent of the plant, after the stages of sieving and flotation with compressed air, was considered. To carry out the water pinch analysis, the limiting water parameters needed to be extracted correctly for all “water sinks” and “water sources”. “Water sinks” refer to units/processes that consume water (generally the inlet streams for the process units). In this case, the input water parameters need to be considered (see Table 2). Moreover, “water sources” refer to the freshwater used and also the water-containing streams that leave the industrial units (outlet streams) that can be reused. In this case, it is important to verify the output parameters of the effluent streams of each unit (Table 2). As shown, there are eight sinks and three sources. The water sinks are: (1) toilets, (2) CIP–stage 1, (3) CIP–stage 2, (4) CIP–stage 3, (5) cooling, (6) heating, (7) others and (8) food processing. The latter one will not be considered in the reuse schemes as it is a food industrial process, and the use of reclaimed water is not allowed. To facilitate the pinch analysis, industrial processes were divided into two groups: (i) CIPs—including water sinks 2, 3 and 4; and (ii) General processes—including water sinks 1, 5, 6 and 7. Three water sources are available for use in this case. Apart from the freshwater source (TS and COD concentration = 0 mg L−1), the water from the reuse tank and the final effluent from the plant may also be reused (with or without regeneration). Note that the total water source flow rate is less than that of the total sinks (Figure 1 and Table 2) because part of the added water is lost during the industrial process (e.g., evaporation and product incorporation). In addition, the effluents from the toilets are not considered for reuse purposes.
The direct reuse/recycle of effluents in “general processes”, without regeneration, was not evaluated because the effluents would not meet the water quality requirements for this purpose. The results for the direct reuse/recycle scheme considering the CIP process and TS or COD as restrictive parameters are presented in Table 3.
The result indicates that the minimum freshwater flow needed for the CIP, with direct reuse/recycle, is 1219.00 or 1110.3 m3 d−1, considering COD or TS as restrictive parameters, respectively. Therefore, considering the most restrictive parameter, COD in this case, the freshwater flow needed is 1219.0 m3 d−1. This is a considerably lower flow value than the necessary flow, considering the use of freshwater only (1831.50 m3 d−1), which represents a 33.4% decrease in freshwater consumption. However, it is known that the dairy plant already reuses the effluents from the reuse tank (stage 2 and 3) for stage 1; thus, its average freshwater consumption for the CIP process is 1221.0 m3 d−1. The slight reduction observed through the proposed direct reuse scheme (1219.0 instead of 1221.0 m3 d−1) is due to the fact that in addition to the reuse of effluents in stage 1, the scheme also proposes a mixture of effluents with freshwater for stage 2.

3.2.2. Regeneration of Spent Process Water

Once the potential of freshwater flow rate reduction via direct reuse/recycle is exhausted, the schemes with water regeneration were evaluated to reduce the water footprint of the dairy plant. In this case, the final effluent of the dairy plant (after sieving and flotation) would be directed to a treatment system composed of a membrane bioreactor and a nanofiltration system. The data related to the dairy effluents’ treatment by the mentioned system was obtained from our previous work [10]. Table 4 presents the concentrations of the restrictive parameters considered in this study of effluents when submitted to both treatment systems evaluated (i.e., MBR and MBR + NF).
Unlike in the case of direct reuse/recycle, the reuse scheme with regeneration allows the use of the treated water not only for the CIP process but also for general processes. Table 5 summarizes the reuse schemes with both treatment systems (i.e., MBR and MBR + NF) for the CIP process, whereas Table 6 presents the results for the general processes.
Great potential for the regeneration of the effluents for its use in the CIP process was noticed. When using the MBR system, the reuse scheme showed a 41.8% decrease in freshwater usage (Table 5). Most of the reused water is applied for the CIP’s first stage (610.5 m3 d−1), while a smaller portion of this flow (154.4 m3 d−1) is used for a blend solution with freshwater and applied for the CIP’s next stages. Moreover, when using the MBR + NF system, both the first and second stages of the CIP process operated with reused water. It is worth mentioning that, as observed in Table 5, when evaluating only TS as restrictive parameter, all the required water volume for the CIP process could be fulfilled with reused water, as the TS value is lower than the 500 mg L−1 (see Table 2 and Table 4). However, as it is needed to select the most restrictive parameter (in this case COD), the reduction of freshwater consumption was 66.7%.
Following the same pattern, the regeneration of the effluents for use in the general process of the plant also showed great potential (see Table 6). In this case, the combination of the membrane bioreactor with the nanofiltration system was able to produce reused water that could promote a 95.4% reduction in water usage at the plant.

3.3. Water Footprint Reduction upon the Water Pinch Analysis—Evaluation of the Reuse Routes

Results from the water pinch analysis showed that all recovery schemes do improve freshwater consumption. The composite curves of “concentration vs. mass load” of the evaluated schemes are presented at the “Supplementary Material”. In this context, four reuse routes were proposed: Route 1—Only direct reuse/recycle of the effluents; Route 2—Direct reuse/recycle of effluents in the CIP and reuse after regeneration with MBR in the general processes; Route 3—Direct reuse/recycle of effluents in the CIP and reuse after regeneration with MBR + NF in general processes; Route 4—Direct reuse/recycle of effluents in the CIP, reuse after regeneration with MBR + NF in the general processes and reuse of the NF concentrate. Each route differs from the other due to the use of effluents from a different water treatment. The selection and assessment of these routes are justified due to the fact the route that promotes maximum freshwater minimization is not always the most viable route.
Route 1 is based on a simple reuse/recycle of the effluents, without the need for any type of treatment in addition to sieving and flotation. In this route, 610.50 m3 d−1 of raw effluent are reused directly in CIP’ stage 1. According to the WPA calculations, 2.00 m3 d−1 could also be reused for a blend solution with freshwater and applied for the CIP’s stage 2. However, as the amount of effluent to be reused for the blend solution is not significantly relevant, it was disregarded for the project of Route 1. This route promoted a reduction of 27.6% in the consumption of freshwater, considering that all the daily required water flow for the mentioned processes of the plant was from freshwater sources, i.e., 2209.5 m3 d−1.
As in Route 1, Route 2 was constructed by the direct reuse/recycle of effluents for CIP’s stage 1 (610.5 m3 d−1). In addition, in this route, 150.4 m3 d−1 of the MBR permeate is reused in CIP’s stage 2 and 27.6 m3 d−1 in the general processes, promoting a water consumption minimization of 35.7%. In Route 3, from the 1699.0 m3 d−1 of raw effluent generated by the plant, 610.5 m3 d−1 would be directly reused in CIP’s stage 1. The remaining 1088.5 m3 d−1 would be directed to treatment (MBR + NF). As the recovery rate of the nanofiltration treatment, a conservative value of 50% was considered; thus, only 544.3 m3 d−1 of permeate flow would be available to be reused in CIP’s stage 2. It is worth mentioning that the recovery rate on-site could be higher when adopting strategies to optimize the membrane process. This route can reduce 52.3% of the use of water in the plant.
Finally, Route 4 presents the most efficient route in terms of minimizing water consumption. In this route, 150.4 m3 d−1 of the total effluent flow produced by the plant would be treated only with a MBR system and the generated permeate would be used in the CIP’s stage 2. The remaining effluent (1548.6 m3 d−1) would be treated by the MBR + NF system, thus generating 774.3 m3 d−1 of permeate and 774.3 m3 d−1 of concentrate. The concentrate from this system would be directed to the CIP’s stage 1, while the permeate would be used as input water in the company’s general processes and in CIP’s stage 2. By applying this route, 69.5% of the water consumption could be reduced. Figure 2 presents a simplified flowchart of all proposed routes.
As expected, Route 4 was the most efficient among those evaluated, the minimization of freshwater usage can reach 69.5% (from 2209.5 to 636.3 m3 d−1); while the reduction in Routes 1, 2 and 3 water consumption reductions were 27.6%, 35.7% and 52.3%, respectively. However, when elaborating a water reuse plan, many aspects must be taken into consideration, such as: cost of the treatment and tanks for effluent storage, area needed for treatment systems, separate pipes for each type of effluent, personnel for the water management, among others. Thus, the route that presents the best efficiency in reducing water consumption is not always the most feasible for the company. Furthermore, the results confirm that water reuse must be conducted in a systematic manner; the reuse plan can not be conducted without consideration of a wider application. Furthermore, the water pinch analysis is an important tool to assist in the preparation of water reuse plans.

4. Conclusions

This study indicates the viability of applying a treatment system based on membrane technologies toward the decontamination of effluents, from a dairy plant, for their reuse in industrial processes. The water quality requirements for the industrial processes, the quality of the generated effluents and the treatment efficiencies of the membrane systems played an important role on the development of water reuse schemes. The direct reuse/recycle scheme of the effluents from the dairy plant proved to be an interesting approach, as it was able to reduce the freshwater consumption for the CIP process by 33.4% without the need of any additional treatment. However, when submitting the effluents from the dairy plant to treatment by membrane technologies, the produced water possessed the quality to be used in different sectors of the industry as well as in higher amounts. The schemes with the regeneration of the effluents showed up to 66.7% and 95.4% of freshwater reduction for the CIP and general processes, respectively. Finally, a proposed route (Route 4) that combined the direct reuse/recycle of effluents with the regeneration of wastewater and the use of permeate/concentrate flows from a MBR and MBR + NF systems showed the best performance in terms of reduction of the total freshwater consumption (69.5%) in the dairy plant. Nevertheless, many aspects must be taken into consideration when implementing a water reuse plan (e.g., cost of the treatment and tanks for effluent storage, area needed for treatment systems, separate pipes for each type of effluent, personnel for the water management, among others). The results obtained build on the potential for not only consolidating membrane technologies for the treatment of wastewater of various origins but also allowing the development of directives to promote the viability of wastewater reuse.

Supplementary Materials

The following supporting information can be downloaded at: https://www.mdpi.com/article/10.3390/su15032540/s1, Figure S1: Composite curves of “concentration vs. mass load” for water reuse in CIP process through direct reuse/recycle—COD as restrictive parameter. Figure S2: Composite curves of “concentration vs. mass load” for water reuse in CIP process through direct reuse/recycle—TS as restrictive parameter. Figure S3: Composite curves of “concentration vs. mass load” for water reuse in CIP process through regeneration with the MBR system—COD as restrictive parameter. Figure S4: Composite curves of “concentration vs. mass load” for water reuse in CIP process through regeneration with the MBR system—TS as restrictive parameter. Figure S5: Composite curves of “concentration vs. mass load” for water reuse in CIP process through regeneration with the MBR + NF system—COD as restrictive parameter. Figure S6: Composite curves of “concentration vs. mass load” for water reuse in General processes through regeneration with the MBR system—COD as restrictive parameter. Figure S7: Composite curves of “concentration vs. mass load” for water reuse in General processes through regeneration with the MBR system—TS as restrictive parameter. Figure S8: Composite curves of “concentration vs. mass load” for water reuse in General processes through regeneration with the MBR + NF system—TS as restrictive parameter.

Author Contributions

Conceptualization, J.C.E. and L.H.D.A.; methodology, J.C.E., M.C.S.A. and L.H.D.A.; software, J.C.E.; validation, J.C.E. and J.C.M.; formal analysis, J.C.E. and L.H.D.A.; investigation, J.C.E.; resources, M.C.S.A.; data curation, J.C.E., M.C.S.A. and L.H.D.A.; writing—original draft preparation, J.C.E.; writing—review and editing, J.C.M., M.C.S.A. and L.H.D.A.; supervision, M.C.S.A. and L.H.D.A.; project administration, L.H.D.A.; funding acquisition, M.C.S.A. All authors have read and agreed to the published version of the manuscript.

Funding

This research was funded by the National Council for Scientific and Technological Development (CNPQ), the Foundation for Research Support of the State of Minas Gerais (FAPEMIG), and the São Paulo Research Foundation (FAPESP) (grant #2020/13094-7).

Institutional Review Board Statement

Not applicable.

Informed Consent Statement

Not applicable.

Data Availability Statement

The data presented in this study are available upon request from the corresponding author.

Acknowledgments

The authors acknowledge the financial resources provided by the National Council for Scientific and Technological Development (CNPQ), the Foundation for Research Support of the State of Minas Gerais (FAPEMIG) and the São Paulo Research Foundation (FAPESP). Jonathan C. Espíndola acknowledges the São Paulo Research Foundation for his research grant (grant #2020/13094-7). We would like to extend our sincere gratitude and appreciation to the editors and anonymous reviewers for their comments and suggestions.

Conflicts of Interest

The authors declare no conflict of interest.

References

  1. B, R.K.; Bhuvaneshwari, S.; Majeed, F.; M, M.M.; Jose, E.; Mohan, A. Different treatment methodologies and reactors employed for dairy effluent treatment—A review. J. Water Process. Eng. 2022, 46, 102622. [Google Scholar] [CrossRef]
  2. Food and Agriculture Organization. Overview of Global Dairy Market Developments in 2018; Dairy Market Review; Food and Agriculture Organization: Rome, Italy, 2019. [Google Scholar]
  3. Wang, Y.; Serventi, L. Sustainability of dairy and soy processing: A review on wastewater recycling. J. Clean. Prod. 2019, 237, 117821. [Google Scholar] [CrossRef]
  4. Skouteris, G.; Ouki, S.; Foo, D.; Saroj, D.; Altini, M.; Melidis, P.; Cowley, B.; Ells, G.; Palmer, S.; O’Dell, S. Water footprint and water pinch analysis techniques for sustainable water management in the brick-manufacturing industry. J. Clean. Prod. 2018, 172, 786–794. [Google Scholar] [CrossRef]
  5. Kamat, S.; Bandyopadhyay, S. Bi-objective Pinch Analysis of heat integrated water conservation networks. J. Clean. Prod. 2021, 312, 127676. [Google Scholar] [CrossRef]
  6. Alwi, S.R.W.; Manan, Z.A. Water Pinch Analysis for Water Management and Minimisation: An Introduction. In Handbook of Process Integration (PI); Klemeš, J.J., Ed.; Woodhead Publishing: Cambridge, UK, 2013; pp. 353–382. [Google Scholar] [CrossRef]
  7. Ahmad, N.N.R.; Ang, W.L.; Teow, Y.H.; Mohammad, A.W.; Hilal, N. Nanofiltration membrane processes for water recycling, reuse and product recovery within various industries: A review. J. Water Process. Eng. 2022, 45, 102478. [Google Scholar] [CrossRef]
  8. Scandelai, A.P.J.; Zotesso, J.P.; Vicentini, J.C.M.; Filho, L.C.; Tavares, C.R.G. Intensification of supercritical water oxidation (ScWO) by ion exchange with zeolite for the reuse of landfill leachates. Sci. Total. Environ. 2021, 794, 148584. [Google Scholar] [CrossRef] [PubMed]
  9. Sosa-Fernandez, P.; Post, J.; Bruning, H.; Leermakers, F.; Rijnaarts, H. Electrodialysis-based desalination and reuse of sea and brackish polymer-flooding produced water. Desalination 2018, 447, 120–132. [Google Scholar] [CrossRef]
  10. Andrade, L.; Mendes, F.; Espindola, J.; Amaral, M. Nanofiltration as tertiary treatment for the reuse of dairy wastewater treated by membrane bioreactor. Sep. Purif. Technol. 2014, 126, 21–29. [Google Scholar] [CrossRef]
  11. Tang, C.Y.; Yang, Z.; Guo, H.; Wen, J.J.; Nghiem, L.D.; Cornelissen, E. Potable Water Reuse through Advanced Membrane Technology. Environ. Sci. Technol. 2018, 52, 10215–10223. [Google Scholar] [CrossRef] [PubMed]
  12. Ghernaout, D.; Alshammari, Y.; Alghamdi, A.; Aichouni, M.; Touahmia, M.; Messaoudene, N.A. Water reuse: Extenuating membrane fouling in membrane processes. Am. J. Chem. Eng. 2018, 6, 25. [Google Scholar] [CrossRef]
  13. Galvão, D.F. Membrane Technology and Water Reuse in a Dairy Industry. In Technological Approaches for Novel Applications in Dairy Processing; Nurcan, K., Ed.; Intech Open: Rijeka, Croatia, 2018; p. 9. [Google Scholar] [CrossRef] [Green Version]
  14. Hogeboom, R.J. The Water Footprint Concept and Water’s Grand Environmental Challenges. One Earth 2020, 2, 218–222. [Google Scholar] [CrossRef]
  15. Foo, D. Process Integration for Resource Conservation; CRC Press: Boca Raton, FL, USA, 2016. [Google Scholar] [CrossRef]
  16. Chin, H.H.; Liew, P.Y.; Varbanov, P.S.; Klemeš, J.J. Extension of pinch analysis to targeting and synthesis of water recycling networks with multiple contaminants. Chem. Eng. Sci. 2022, 248, 117223. [Google Scholar] [CrossRef]
  17. Jia, X.; Klemeš, J.J.; Alwi, S.R.W.; Varbanov, P.S. Regional Water Resources Assessment using Water Scarcity Pinch Analysis. Resour. Conserv. Recycl. 2020, 157, 104749. [Google Scholar] [CrossRef]
  18. Souifi, M.; Souissi, A. Simultaneous Water and Energy Saving in Cooling Water Networks Using Pinch Approach. Mater. Today: Proc. 2019, 13, 1115–1124. [Google Scholar] [CrossRef]
  19. Federation, W.E.; Association, A. Standard Methods for the Examination of Water and Wastewater; American Public Health Association (APHA): Washington, DC, USA, 2005; p. 21. [Google Scholar]
  20. Federação das Indústrias do Estado de São Paulo—FIESP. Conservação e Reúso de água: Manual de Orientações Para o Setor Industrial; Federação das Indústrias do Estado de São Paulo: Sao Paulo, Brazil, 2011. [Google Scholar]
Figure 1. Schematic of the macro water balance at the dairy plant. WTP = water treatment plant, WWTP = wastewater treatment plant, CIP = clean-in-place.
Sustainability 15 02540 g001
Figure 2. Flowchart of the water reuse by (a) Route 1, (b) Route 2, (c) Route 3 and (d) Route 4.
Sustainability 15 02540 g002
Table 1. Treatment efficiencies of the effluents from the dairy plant using the MBR system and with the MBR + NF system (adapted from Andrade et al. [10]).
Water ParameterRemoval Efficiency (%)
MBRMBR + NF
COD99.099.9
Total Solids (TS)23.290.0
Table 2. Average values of the COD and TS in the input and output of all the water-using processes at the dairy plant.
Flow
(m3 d−1)
Input ParametersOutput Parameters
COD
(mg L−1)
TS
(mg L−1)
COD
(mg L−1)
TS
(mg L−1)
Others1310500**
Toilets7610500**
CIPFirst stage610.5600010,000320,00011,770
Second stage610.5105003045 a8275 a
Third stage610.501000
Food processing48601000**
Cooling24975500**
Heating405200**
Final effluent1699 b--43933504
Adapted from FIESP [20]. * Not measured. a Value related to the reuse tank (effluents from the second and third stages mixed). b This value corresponds to all of the effluents generated in the plant, also considering the losses in the processes.
Table 3. Data for the direct reuse/recycle obtained through the Water Pinch software.
CIP
Restrictive ParameterCODTS
ProcessRequired Flow (m3 d−1)Water Reuse (m3 d−1)
CIP–stage 1 (m3 d−1)610.5610.5610.5
CIP–stage 2 (m3 d−1)610.52.0110.7
CIP–stage 3 (m3 d−1)610.500
Total required water (m3 d−1)1831.51831.5
Total reused water (m3 d−1)612.5721.2
Total consumed freshwater (m3 d−1)1219.01110.3
Decrease in freshwater use (%)33.439.4
Table 4. Concentration of restrictive water parameters from different water sources at the dairy plant.
Water SourceCOD (mg L−1)TS (mg L−1)
Final effluent4393.03504.0
MBR system39.52691.1
MBR + NF system4.4350.4
Concentrate of the MRB + NF system98.44656.5
Table 5. Data for the reuse after regeneration, for the CIP process, obtained through the Water Pinch software.
CIP
SystemMBRMBR + NF
Restrictive ParameterCODTSCODTS
Total required water (m3 d−1)1831.51831.51831.51831.5
Total reused water (m3 d−1)764.9950.81221.01831.5
Total consumed fresh water (m3 d−1)1066.6880.7610.50
Decrease in freshwater use (%)41.851.966.7100
Table 6. Data for the reuse after regeneration, for the general processes, obtained through the Water Pinch software.
General Processes
SystemMBRMBR + NF
Restrictive ParameterCODTSCODTS
Total required water (m3 d−1)378.0378.0378.0378.0
Total reused water (m3 d−1)276.665.8378.0360.8
Total consumed fresh water (m3 d−1)101.4312.2017.2
Decrease in freshwater use (%)73.217.410095.4
Disclaimer/Publisher’s Note: The statements, opinions and data contained in all publications are solely those of the individual author(s) and contributor(s) and not of MDPI and/or the editor(s). MDPI and/or the editor(s) disclaim responsibility for any injury to people or property resulting from any ideas, methods, instructions or products referred to in the content.

