Abstract
As a pillar industry carrying China’s ambition in manufacturing upgrades and energy transformation, the new energy vehicle (NEV) industry has received much attention from the government and investment institutions. The spatial pattern of the industry, which is undergoing dramatic changes, urgently needs to be studied retrospectively. This paper explores the spatial distribution pattern of related industries and their influencing factors using data related to NEV industry listed companies from 2008 to 2021. Spatial statistical analysis and stepwise regression analysis were conducted in this study. At the national level, the study found that an “8” industrial axis was formed, with the Yangtze River Delta, the Pearl River Delta, and the Beijing–Tianjin–Hebei city cluster as the core. At the provincial level, it was found that the traditional auto industry-dominant regions do not have a competitive advantage in the NEV field. After stepwise regression of the potential factors, five key factors determining the number of listed NEV enterprises in each province were identified, namely, policy strength, patents, per capita wage, tertiary industry share, and road density. The research results improve the understanding of NEV industry development rules in related disciplines and provide a reference for the spatial arrangement of the NEV industry to be coordinated and optimized at the regional level.
1. Introduction
As a new engine of China’s economic growth, the new energy vehicle industry has brought great opportunities to upgrade China’s manufacturing industry. According to the statistics of the China Association of Automobile Manufacturers (CAAM), the market penetration rate of new energy vehicles in China in 2021 continues to rise (see Figure 1), with annual sales reaching 3.521 million units, up 155% year on year, accounting for 50% share of the global new energy vehicle market. However, it is known that the production of cars in 2021 was deeply affected by the epidemic and the chip shortage. According to the published data of CAAM from January to October 2022, the cumulative production and sales of China’s domestic NEV market are 5.485 million and 5.28 million, respectively, with a year-on-year growth of 1.1 times. The market penetration rate has soared to 24%, which exceeded the annual expectation.
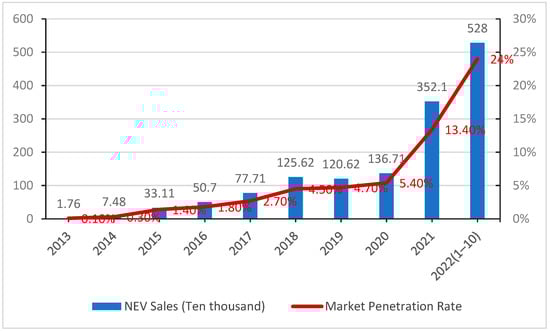
Figure 1.
China’s NEV sales volume and market penetration from 2013 to 2022. Source: CAAM.
On the other hand, the rising demand for new energy vehicles has forced the reform and reshaping of China’s automobile industry chain [1]. Thanks to a completely different power system, China has solved the dilemma of lacking core technologies and patents in the era of the internal combustion engine and has gradually formed a relatively complete upper, middle, and downstream industrial chain with battery, motor, electronic control (also known as EIC system) technology as the core. With the continuous promotion and popularization of new energy vehicles, users’ functional requirements for such vehicles are becoming more mature and sophisticated. The industrial chain is constantly derived to intelligent technology and service end, and the overall added value is also rising. Accordingly, world-class companies such as BYD, CATL, and NIO continue to emerge as the key links of China’s new energy automobile industry chain. The New Energy Vehicle Industry Development Plan (2021–2035) adopted by The State Council in 2020 marks the Chinese government once again upgrading the importance of the NEV industry. They have planned to further promote the development of related industries from the aspects of scientific research projects, infrastructure construction, and financial incentives [2] to realize the “corner overtaking” of Chinese manufacturing in the automobile industry competition.
However, “overtaking” is not easy. Related studies [3,4] have shown that China’s NEV industry chain not only suffers from the risk of key components and core technologies being “ strangled” but also faces problems such as the development of industrial clusters that have not yet been formed and the mismatch of resources due to blind investment by local governments. Low-quality development will not only mean a waste of resources but also lead to failure in the world’s new energy vehicle development race. Therefore, in order to scientifically deploy industrial resources, cultivate an internationally competitive industrial cluster network, and avoid low-level repetition and disorderly competition, it is necessary to examine the spatial pattern of China’s NEV industry at the regional level and examine the differences in location preferences between the NEV industry and traditional automobile industry, thus identifying the unique industrial development trends and influencing factors in China. In this way, we can help construct an up-to-date theory of industrial space evolution for the NEV industry and provide a reference for the subsequent productivity layout of related regions.
To achieve this goal, this study plans to use location data of listed companies related to China’s NEV industry to visually analyze the spatial distribution pattern and change trends of this industry based on a GIS platform. It also attempts to construct a series of correlation variables and explore the key factors influencing the spatial pattern of the NEV industry by using a stepwise regression method. The specific structure is as follows. In Section 2, we first review the classical theories and summarize the common methods and basic features for studying the spatial evolution of related industries. Based on these foundations, Section 3 introduces the data sources and research methodologies used in this study. Section 4 shows the spatial distribution pattern of NEV-related listed companies during the period 2008–2021. Section 5 presents the basis of variable selection and the extraction of significant factors using stepwise regression methods. In the concluding part, the spatial pattern of the above industries and their influencing factors are discussed and summarized in Section 6 and Section 7. The shortcomings and prospects of this study are also presented at the end of this paper.
2. Literature Review
Recently, the NEV industry has received much attention from the academic community, but very few existing studies have focused specifically on the spatial pattern of the NEV industry. In order to explore this new field efficiently, we will conduct a literature review following the logic below: 1. Review the basic characteristics of the spatial distribution and agglomeration of the automobile industry in classical theory; 2. Sort out the existing research results related to the development of China’s NEV industry; 3. Refer to the analysis methods on the spatial pattern of other new energy industries.
First of all, industry and firm location has always been a hot topic in economic geography. According to traditional location theory, factors such as raw materials, market, labor supply, technology, and environment will affect the location choice of enterprises [5,6]. New economic geography believes that market size, transportation conditions, and agglomeration economy will affect the location choice of enterprises [7,8]. As a typical capital-intensive industry, automobile manufacturing in the era of the internal combustion engine proved to have a very strong positive cluster effect [9]. For example, Klepper found that the geographic concentration of auto start-ups around Detroit was due to four early successful entrants and the many successful derivatives they spawned in the Detroit area [10]. In the study on the pattern of China’s automobile industry, Liu and Yeung proved through typical enterprise cases that the embedding of multinational corporations and the deregulation of the Chinese government are the two key factors affecting the geographical distribution of China’s automobile industry [11]. Zhao [12] builds a location choice model for automobile enterprises based on the prefecture-level city for spatial units and finds that market size and local protection have a significant impact on the location choice of newly created parts enterprises when the agglomeration economy is excluded. He claimed that China’s automobile manufacturing industry showed a trend of further concentration in the east coast, the north coast, and the middle reaches of the Yangtze River, but the overall regional strength is tending to balance, the agglomeration of the automobile industry is weakening, and the degree of spatial dispersion is increasing.
Secondly, based on the higher added value of NEVs, research related to this industry has become a popular topic in recent years. Up to now, in the field of social science research, many articles have revealed that the development of the NEV industry is highly correlated with the supporting policies of local governments [2,13,14,15]. They pointed out that local governments are actively attracting investment in NEV manufacturing plants by providing large amounts of land for construction and have introduced many subsidies or financial policies to help the development of related industries. However, this series of moves have also brought about serious problems such as low-level duplication, overcapacity, waste of resources, and local protectionism [16]. In contrast, in the field of natural science, there are few studies related to the spatial evolution pattern of the NEV industry. Zhang et al. used patent data from the NEV industry as the basis of their study to reveal and analyze the geographic distribution pattern of NEV innovation activities [16]. Liang and Lu conducted a dynamic evaluation and regional difference analysis of NEV industry development in China by using statistical yearbook data and a grey target model [17]. Cao et al. collected the location data of 135 key enterprises and 260 vehicle production bases related to NEVs in a more systematic way for empirical study. On this basis, they argued that the current NEV industry in China shows a “T” spatial distribution pattern in general [18].
Meanwhile, scholars have studied similar high-value-added emerging industries in the new energy field, which means that NEV researchers can find relevant experiences in them. For example, Park and Lee studied the changes in Korean green industries over time and spatial patterns in each municipal administrative unit using multi-year business activity survey data and analyzed the location selection mechanism of green industries using a panel data regression model [19]. They noted that Korean green industries tend to cluster in areas where traditional manufacturing industries are concentrated, but emerging advanced green urban industries tend to develop within or near large cities. Fan and Wang analyzed the spatial pattern and influencing factors of China’s wind turbine manufacturing industry using data on Chinese wind power equipment manufacturing enterprises from 2000 to 2014, claiming that the industrial base of a region mainly influences the location of the parent company of the relevant industry, while the location choice of its subsidiaries depends more on the wind resource endowment of the region and the strength of local government policy support [20]. Chen and Wang studied the spatial pattern of China’s solar photovoltaic industry using data from PV enterprises from the 2009 China New Energy Annual Industry Report to measure the spatial distribution and found that PV enterprises were mainly distributed in the southeast coastal region, while the base of PV power generation was concentrated in northern China, where sunlight resources are abundant. Moreover, the main influencing factors found by the method of factor analysis were government policy, technology level, consumer market, and energy efficiency [21].
In summary, the formation and development of China’s NEV industry has received worldwide attention, but the results focusing on the spatial layout of the industry are relatively lacking at present. This has led to an insufficient exploration of the characteristics and patterns of location choices made by NEV enterprises at various scales. For this study, the established research results can help select some classical factors which influence the spatial evolution of the auto industry and also provide theoretical and methodological references for the analysis of the NEV industry pattern.
3. Data and Methods
3.1. Data Sources
As an important type of enterprise, a listed company refers to a company limited by shares that is approved by the administrative department through specific procedures and officially issues shares in the stock exchange. To some extent, the number of listed companies in a specific industry not only reflects the capital securitization level and direct financing ability of the region but also reflects the important position and development potential of the region in the relevant industrial system [22]. This study uses A-share new energy vehicle concept-related companies registered in mainland China and listed on the Shanghai Stock Exchange and Shenzhen Stock Exchange, including the four sectors of the Main Board, Small and Medium-sized Board, Growth Enterprise Board, and Sci-Tech innovation Board, excluding companies registered and listed in Hong Kong, Macau, and Taiwan, totaling 459 companies. Due to the generally large size of listed companies and the crossover of business types, there is no unified list of companies in the NEV concept sector identified by the industry at present. The list of NEV-related listed companies and their headquarters addresses collected in this article are filtered from the concept stock database of Huaxi Securities (https://m.hx168.com.cn/stock/concept/,accessed on 26 September 2022) and the industry classification results of listed companies published on the official website of the China Securities Regulatory Commission (http://www.csrc.gov.cn/, accessed on 10 November 2022).
The data were organized and clarified according to the year of listing and registered address of companies, and the outliers, such as duplicate data and companies delisted midway, were removed. In this paper, four years are selected as nodes, which are 2008, 2013, 2018, and 2021, in order to build a database of the spatio-temporal distribution of the headquarters of listed companies with NEV concepts in China up to 2021. The selection of these four time sections is based on the results of the natural breakpoint classification of the number of listed companies over the years, as well as the timing of some major industry-related events, such as the promulgation of special government support policies or the emergence of key leading companies.
In the part of the influencing factors, this paper collects relevant statistical yearbook panel data for each province, autonomous region, and municipality of China in the above four time cross-sections according to the variables selected in Section 5, which are mainly derived from the China Statistical Yearbook and the China Automotive Industry Yearbook. However, due to the large span of statistical years, early statistics on the automobile industry in some provinces are missing. Considering the availability and reliability of data, several provinces with no automobile production or very little automobile production are excluded from the regression analysis of the influence factor section, and only the remaining 25 province-level administrative regions are explored.
3.2. Methodology
3.2.1. Global Spatial Autocorrelation Analysis
According to Tobler’s first law of geography [23], everything is related to everything else, and things that are close to each other are more closely related. However, in the case of China, provincial governments generally have a tendency toward local protectionism due to horizontal competitive relationships, and the policies in terms of industrial development vary within their respective administrative divisions. Therefore, the number of relevant companies in each provincial administrative region is first counted to verify whether the nationwide distribution of NEV listed companies is random. In this study, the global Moran’s I index was adopted as the method to measure the regional global clustering test. The relevant formula is as follows:
where is the number of provincial administrative units; and are the number of NEV listed companies in provinces i and j; is the average of the number of companies; is the spatial weight. The global spatial autocorrelation coefficient takes values in the range of [−1, 1]. When Global Moran’s I > 0, it indicates that the factors are spatially clustered; when Global Moran’s I < 0, it shows dispersion; when Global Moran’s I = 0, it indicates that the factors are randomly distributed.
3.2.2. Kernel Density Analysis
Kernel density analysis is one of the commonly used methods to calculate the degree of agglomeration and dispersion of sample data based on certain sample point data [24], which can intuitively reflect the distribution of discrete measured values in a continuous region. It takes into account the interaction between spatial elements and the weight values of specific parameters. The higher the kernel density value is, the higher the concentration of point data distribution is; otherwise, the lower it is [25]. The analysis method uses the following equation:
In Equation (2), is the distance from the estimated point to the sample point; is the search radius; is the number of points within the search radius; (*) is the kernel function equation; the higher the value, the higher the kernel density.
In this study, the geographic coordinate vector data of the headquarters of China’s NEV-related listed companies were taken as “point” data, and the kernel density analysis method of ArcGIS software was used to set the same pixel size and search radius for the spatial distribution pattern of China’s NEV-related listed companies in 2008, 2013, 2018, and 2021. The agglomeration characteristics of the new energy automobile industry distribution in mainland China were identified based on the kernel density map.
3.2.3. Location Quotient of Specialization Level
The degree of industrial agglomeration is considered to deeply influence the location choice of newly established manufacturing industries in agglomeration economic theory [26,27,28,29]. The commonly used indicators to measure industrial agglomeration and diffusion are Concentration Ratio, Location Quotient, Locational Gini Coefficient [30], Herfindahl index [31], EG index [32], etc., which have their own advantages and disadvantages. Considering the availability of data, this paper selects Location Quotient to reflect the uneven degree of the spatial distribution of industrial economic activities [33] and measures the evolution of industrial spatial patterns by examining the changes in the uneven degree of the spatial distribution of NEV listed enterprises in each province during each study period. The equation is as follows:
where is the main business income of the NEV industry in region j, is the main business income of all industries in region j. is the main business income of NEV industries in the country, and the corresponding is the main business income of all industries in the country. The higher the value of the location quotient, the more prominent the specialization level of industry and the higher the level of regional industrial agglomeration. Generally speaking, when > 1, the degree of industry specialization in the region is higher than the national average.
3.2.4. Stepwise Regression Analysis
The location choice of industries is influenced by many factors. The most common method to identify the influencing factors is Pearson’s correlation and ordinary least-squares regression (OLS). Some studies have considered the effect of spatial correlation using methods such as spatial autoregressive models [22], geographically weighted regression [34,35], or GeoDetector [36]. When it is necessary to explore the most dominant factors among a large number of potential indicators, methods such as principal component analysis [37] or stepwise regression [38,39] are commonly used. Since NEV is an emerging industry and there is no mature theory to guide the narrowing of indicator selection, this study integrated the research results of the automotive industry, manufacturing industry, and corporate innovation to establish a library of indicators to be tested. Finally, the stepwise regression method was used to remove the multicollinearity and extract the factors with the most significant effects.
The purpose of stepwise regression is to establish the “optimal” multiple linear regression equation. The basic principle is to introduce variables one by one, provided that their partial regression sum of squares is empirically significant [40]. At the same time, after each new variable is introduced, the old variables that have been included in the selected regression model are tested individually, and the variables that are considered insignificant by the test will be removed to ensure that every variable in the resulting subset of independent variables is significant. This process is carried out in several steps until no new variables can be introduced. At this point, all variables in the regression model are significant for the dependent variable.
4. Industrial Spatial Pattern
4.1. Overall Distribution Characteristics
According to the classical economic geography theory, enterprises in the same industry (especially those upstream and downstream of the same industry chain) are more likely to choose to cluster geographically to form clusters in order to obtain externality economies and improve economies of scale. In this way, they can share labor and gain capital, knowledge, and technology spillovers. Is the NEV industry, as an alternative to the transformation of the traditional automobile industry, influenced by the location of the traditional automobile industrial base when choosing its location? We used the collected address information of NEV listed companies as the basis, matched them with the map of China’s sub-provinces using the ArcGIS platform, and visualized the spatial coordinate information of corresponding listed companies in different years (Figure 2), and also marked the approximate location of China’s traditional automobile production bases. The comparison shows that several old auto cities or regions could indeed incubate NEV listed companies in the early period, but over time, the total number of NEV listed companies in northeastern, central, and western cities grew slowly, while more NEV listed companies clearly appeared along the Yangtze River Delta, Pearl River Delta, and southeast coast. A significant clustering development trend can also be found in the point data of these enterprises.
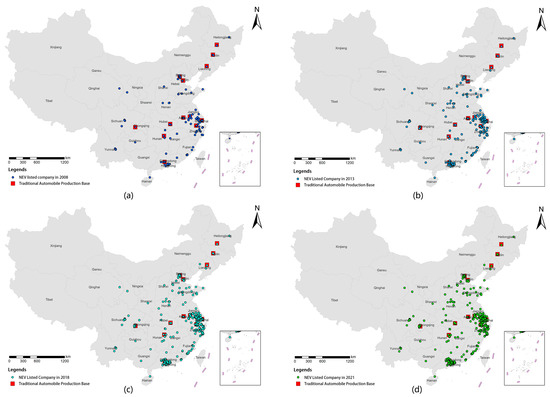
Figure 2.
Spatial distribution of listed NEV companies in China: (a) 2008, (b) 2013, (c) 2018, (d) 2021.
Subsequently, based on the above spatial coordinate information, the number of NEV listed enterprises in each province was counted in four years, respectively, and the pattern after visualization of the latest 2021 statistics is shown in Figure 3. It can be found that NEV listed companies are mainly concentrated in the Yangtze River Delta, Pearl River Delta, and Beijing–Tianjin–Hebei regions, with the total number of the three regions accounting for more than 72% of the country. Sichuan and Chongqing in the western region are also performing well, while Hubei, a traditional auto powerhouse in the central region, is experiencing a “central collapse”.
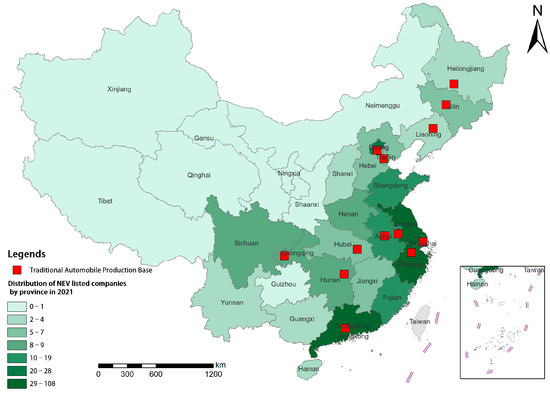
Figure 3.
Statistics on the number of listed NEV companies by province until 2021 in China.
4.2. Spatial Correlation Characteristics
Is it possible that the spatial distribution of the above NEV listed companies is random? The research was verified using ArcGIS software to calculate the global Moran’s I index under the Queen neighborhood weights and geographic distance inverse spatial weights, which were, respectively, calculated as shown in Table 1.

Table 1.
Global Moran’s I value of NEV listed companies.
From the calculation results, it can be seen that the global Moran’s I values of Chinese NEV listed companies show two different results under the influence of two spatial weights. Under the inverse distance matrix weighting, the first three years did not pass the significance test, while the results of adopting the Queen adjacent weighting algorithm showed robust spatial correlation, and Moran’s I index passed the significance test of at least 10%. This shows that the agglomeration of NEV listed companies on a national scale is not simply affected by spatial distance but is determined by the development of related companies in the neighboring provincial administrative regions of each province. There are two reasons for this phenomenon. One is that the status quo of NEV development and the intensity of supporting industrial development vary among provinces in China. Administrative divisions objectively restrict the free flow of industrial factors. Then, the NEV industry still has the characteristics that the manufacturing industry is inseparable from the agglomeration effect. The endowment of related industries in the surrounding areas has greatly affected the development potential of the local NEV industry.
Second, from 2008 to 2021, Moran’s I value using Queen’s adjacent weights first decreases and then increases, indicating that the spatial correlation of NEV listed companies first weakens and then strengthens during the study time period. By phases, this trend is in a trough in 2013 and hits a peak in 2021—with a Z-score up to 2.3209. This pattern fits the situation that the industry pattern in China’s NEV sector was undefined in the early years, while the position of the strongest players has gradually solidified in recent years. This is because the agglomeration of related enterprises in the pioneer areas already has a scale effect, and the sharing of related resources and technology spillover attracts further geographical concentration of high-quality enterprises in the NEV track.
4.3. Agglomeration Intensity Characteristics
Aiming to further reveal the spatial clustering pattern characteristics of Chinese NEV listed enterprises from a smaller geographical scale, the image element size is set at 2 km. From the actual transportation demand of the NEV industrial supply chain, the search radius was determined to be 200 km based on several adjustments and comprehensive considerations. Moreover, in order to guarantee the consistency of the display effect, the 4-year kernel density value results were uniformly classified and displayed according to the range of the result value in 2021, and the natural segment point grading method was used to classify the kernel density levels into 10 levels. The final results are shown in Figure 4.
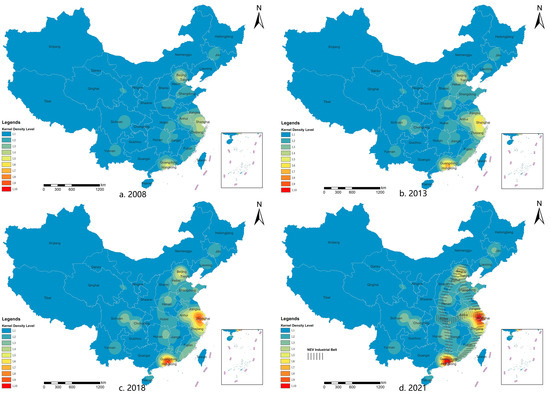
Figure 4.
Kernel density diagram of listed NEV companies in China: (a) 2008, (b) 2013, (c) 2018, (d) 2021.
In 2008, China’s NEV listed companies showed a spatially dispersed pattern, with Beijing, the Yangtze River Delta, and the Pearl River Delta being relatively high-density areas at that time, with the Yangtze River Delta region being a more obvious conjoined phenomenon. In 2013, the clustering of NEV listed enterprises in the Pearl River Delta and Yangtze River Delta rose, and the Beijing–Tianjin–Hebei region began to develop coherently. In 2018, two high-density core regions of the Yangtze River Delta and the Pearl River Delta emerged, while Beijing–Tianjin–Hebei served as a sub-high-density contiguous region. At this time, the enterprise clusters in the central province gradually became a belt-like trend extending vertically from north to south, forming an industrial corridor parallel to the southeast coast in the central part. There is little change in 2021, but the core agglomeration of the Yangtze River Delta and the Pearl River Delta has further strengthened, widening the development gap with other regions.
Overall, the concentration of NEV-related listed companies in China has been increasing over the study period, with two stable high-density zones in the Yangtze River Delta and the Pearl River Delta, followed by a sub-high-density zone in Beijing, Tianjin, and Hebei, with Beijing as the core. The overall spatial pattern shows an “8” shape structure formed by two vertical and one horizontal industrial corridor. The industrial circle of Chengdu, Chongqing, and Northeast China has a certain scale but has not yet formed an effective link with the eastern industrial contiguous region, forming several independent enclaves.
5. Factors Affecting Spatial Distribution
5.1. Selection of Variables
There are complex and diverse factors affecting the spatial evolution of the high-end equipment manufacturing industry. According to the research results of existing literature, this paper selects 17 indicators as potential independent variables from 5 aspects: socio-economic, industrial foundation, production cost, governmental behavior, and innovation capability (Table 2). However, since all of these indicators represent important bases for industrial production in all cities, it is inevitable that the indicators of socio-economic, industrial foundation, and governmental behaviors will be correlated with each other. In order to avoid serious multicollinearity among the influencing factors, a backward stepwise regression method was chosen, hoping to eliminate the factors with repeated effects to the maximum extent.
Table 2.
Potential influencing factors and definitions on space distribution of NEV listed companies.
5.2. Analysis of Regression Results
After using the above 14 indicators as independent variables and the number of NEV-related listed enterprises in each province for four years, including 2008, 2013, 2018, and 2021 as dependent variables for backward stepwise regression analysis, the model finally leaves a total of five items in the model, respectively, per-capita wage, tertiary industry share, patents, policy strength, and road density (Table 3). The final model has an R2 value of 0.889, which means that these five indexes can explain 88.9% of the causes of variation in the dependent variable Y. The model passed the F-test (F = 149.923, p = 0.000 < 0.05), indicating that the model is valid. In addition, we found that the VIF values in the model are less than 5, which can be considered a no-collinearity problem in economic geography-related studies. The D-W value is around the number 2, which also indicates that there is no autocorrelation between the sample data, and the model built by this method is good. Finally, we obtain the regressed equation as:
Table 3.
Results of spatial distribution influence factor analysis of NEV-related listed companies based on stepwise regression.
According to the regression coefficients in this equation, the tertiary industry share (x4), patents (x14), and policy strength (x13) will have a significant positive effect on Y, while per capita wages (x11) and road density (x7) will have a significant negative effect on Y. Although the number of indicators is significantly refined, it is still possible to find that the five selected indicators precisely belong to the five major categories of the framework: socio-economic, industrial foundation, production cost, governmental behavior, and innovation capacity.
The ranking of the three factors with positive impact in terms of influence magnitude is x13 > x14 > x4, which indicates that the NEV-related policy strength representing government actions has the highest explanatory power and boosts the NEV listed enterprises the most. The second ranking is the number of patent applications, which represents the innovation capability of the region, indicating that the high-quality research and innovation level is the basis for nurturing NEV listed companies and is an important consideration for the location choice of the relevant enterprises. The share of tertiary industry, which represents the local socio-economic structure, is also positively correlated with the number of NEV listed enterprises to a certain extent. This reflects that NEV-related enterprises essentially transcend the spatial layout logic of the traditional manufacturing industry, which in turn demonstrates that they reflect the characteristics of near high-tech industries in their value chain operations.
In terms of negative impact, the per capita wage, which represents the production cost, is the main influencing factor, indicating that NEV-related companies are very sensitive to labor costs. It also shows that NEV-related industries still combine some characteristics of labor-intensive industries. What is surprising is that road density, which represents the local industrial foundation, is negatively correlated with the number of NEV listed companies to some extent. However, when analyzed further, dense roads not only represent efficient transportation but also represent lower transportation costs in the region. The advantage of transportation cost may form the path dependence of traditional local industries on the established transportation mode, thus increasing the difficulty of transforming towards new energy vehicles. This is ultimately reflected in the phenomenon that higher highway densities, in turn, reduce the number of local NEV-related listed companies.
6. Discussion
In this paper, some unexpected but reasonable phenomena are found in the process of identifying the spatial distribution characteristics of China’s new energy vehicle industry and its influencing factors using the location information of NEV listed companies over the years.
First of all, in terms of the overall spatial pattern of the NEV industry, the distribution of the industry in 2008 was roughly the same as that of the traditional automobile production bases, indicating that the early growth of the NEV industry was attached to the traditional automobile industry chain. However, in the subsequent development process, the uneven development pattern of “two super cores and one strong core” gradually emerged. Generally speaking, automobile manufacturing is a typical agglomeration industry. Regions with advantages in traditional fuel vehicles have better human capital accumulation, readily available industrial support in terms of R&D capital and technology, and a relatively well-established supporting supply chain, which leads to the expansion of related enterprises usually dependent on the existing location. Local governments at all levels also clearly understand and value the importance of the automotive industry. Among the 31 provinces or autonomous regions in mainland China, 28 provinces have listed the automotive industry as a pillar or key development industry in their economic plans during the study period. If the NEV industry follows the development logic of the traditional automobile manufacturing industry, there will not be such a big difference in the development rate between regions. However, according to research statistics, two super core patterns have been formed in the Yangtze River Delta and the Pearl River Delta. Eastern China tends to be more popular with NEV-related industries than the central or western part of the country, reflecting the significant regional heterogeneity. The study argues that this phenomenon, although different from expectations, is still consistent with the classical economic geography theory. The reasons can be attributed to two aspects. On the one hand, as studied by He [41], Pan [42], Sheng [43], and others, listed companies generally tend to set up in the core cities or core regions of the country in the early stage, considering more economic factors to achieve the minimum cost or profit maximization. On the other hand, the regional integration features of the Yangtze River Delta and the Pearl River Delta break the natural administrative boundaries, which is conducive to factor flow and cooperation between the upstream and downstream of the NEV industries in these regions. Other regions have not formed such a close intra-regional link, and to a certain extent, their local protection and excessive administrative intervention in key industries have hindered the transformation and marketization process of the auto industry, generating unnecessary regional internal consumption and vicious competition.
Secondly, in the study of the factors influencing the spatial distribution of China’s NEV industry, the important influence on the location choice of the automobile manufacturing industry was excluded in the stepwise regression analysis. However, the final five elements identified still correspond to the index framework preset in the article, which is in line with the expectation of borrowing the NEV industry from a similar research approach in the high-end equipment manufacturing industry. It is worth noting that important indicators of the local automotive industry foundation, such as location quotient or vehicle production, did not meet expectations in terms of their significance in influencing the layout of the NEV industry in each province. Compared to the existing automotive industry base, this shows that pragmatic local incentives for related industries and the local strength in science and innovation are the key to attracting quality NEV companies to settle down. This may provide some new ideas to the government and policymakers who want to vigorously develop the NEV industry. That is, with limited resources, more efforts should be made to stimulate market demand and strengthen local science and innovation capacity instead of stereotypically following the traditional manufacturing development path, with a single emphasis on the provision of physical resources such as land, factories, and infrastructure.
7. Conclusions and Prospects
7.1. Conclusions
Based on the data related to NEV industry listed companies in mainland China, this paper analyzes the evolution process of the spatial pattern of China’s NEV industry from 2008 to 2021 and explores the influence of factors including socio-economic, industrial foundation, production cost, governmental behavior, and innovation capability on the location choice of NEV listed companies. The main conclusions obtained are as follows.
- In general, the spatial pattern of China’s NEV industry has shown obvious regional differences and agglomerative trends, which are different from the distribution of the auto industry base in the era of internal combustion engines. The Yangtze River Delta and the Pearl River Delta are the absolute core of NEV industry clustering; the Beijing–Tianjin–Hebei area has formed a second-tier industry cluster; the central, western, and northeastern regions are significantly behind the development of the above core regions. In the development trend, the eastern coastal corridor and the central industrial vertical corridor have gradually taken shape; the two have initially converged to form an “8” shaped industrial agglomeration axis pattern.
- As for the influencing factors, the policy strength of the government, the research and innovation capacity of the region, and the vitality of the local tertiary industry are important factors that attract NEV listed companies to take root and develop. Production cost and road density are the major negative factors affecting the number of NEV listed companies. The results of the regression analysis suggest that the various studies mentioned above on how local governments can support the NEV industry have indeed made a difference. The advanced manufacturing characteristics with capital and technological innovation as the core orientation allow the NEV industry to no longer be constrained by the locational limitations of traditional automotive industrial bases, with head NEV firms gradually concentrating on quality innovation sources. It can be further speculated that the competitiveness to meet the listing of NEV companies is not only reflected in the cost control ability on the supply side but also in the ability to meet the demand and product innovation on the technology side.
- In terms of the industrial development path, the foundation of the traditional automobile industry determines the soil for the growth of the NEV industry. The core regions of the NEV industry are all transformed from traditional auto industry bases, which means it is difficult for the related industries to start from zero. If late-developing regions want to catch up, they should clearly realize that the endogenous core driver of the NEV industry is the capability of science and technology innovation, and the main external driver is the government’s supporting policies. The cultivation of relevant listed companies not only requires the strong support of local governments but also cannot be separated from local innovation sources and quality intellectual resources.
7.2. Limitations and Prospects
Although this study has retrospectively analyzed the spatial evolution pattern of the NEV industry in China and identified the factors influencing its spatial pattern, there are still two issues that deserve further discussion.
First, the data sources of the study need to be further enriched. This paper mainly uses the data of 459 NEV-related listed companies in 4 major sectors of Chinese A-shares as the basis to study their industrial patterns, but a large number of high-quality small and medium-sized companies in the NEV industry chain are not counted in this study. Another situation is that many listed companies, although headquartered in first-tier cities in China, may have their main production bases located in third- or fourth-tier cities where costs are lower. Therefore, studying the headquarters of NEV listed companies alone may not give a three-dimensional view to show the full spatial layout of the NEV industry. In the future, more diverse data on enterprises or production bases need to be used to study their spatial patterns.
Second, the exploration of influencing factors needs to be further developed. In this study, we referred to a large number of existing studies on the influencing factors of spatial distribution in areas such as automobile manufacturing, corporate headquarters, sci-tech enterprises, etc., and then selected the most relevant factors from them for stepwise regression analysis. This approach effectively selects the most significant influences but may ignore some indicators that are less common or valid only for the NEV industry. These indicators may be panel data in regions or cities, or they may be special data that are not in various statistical yearbooks. The mining and analysis of the above-mentioned emerging data will need to be further tested and explored in the future.
In summary, the NEV industry is recognized as an important opportunity for China’s manufacturing industry to surpass that of the West. Its strategic position in the global industrial competition is beyond doubt. In order to avoid key technologies and components being restricted by others while extending the value chain of China’s own brands, before planning the layout of the NEV industry, the government should understand that it has a different development logic from the traditional automobile industry. At the local level, the government should increase the incentives for scientific and technological innovation, optimize the supply of innovation elements, and encourage collaborative innovation between car companies and research institutions. At the national level, the provinces should also coordinate and integrate resources in terms of region-wide productivity layout to avoid disorderly competition.
Author Contributions
Conceptualization, methodology, writing—original draft preparation, D.C.; supervision, G.W.; visualization, validation, E.Z.; writing—review and editing, Z.Y. All authors have read and agreed to the published version of the manuscript.
Funding
This research received no external funding.
Institutional Review Board Statement
Not applicable.
Informed Consent Statement
Not applicable.
Data Availability Statement
Not applicable.
Acknowledgments
Thanks to Huang Jingnan, Niu Qiang, and Li Zhigang from Wuhan University and Huang Yaping and Chen Jinfu from Huazhong University of Science and Technology for their guidance and suggestions on this project. Thanks also to the journal editors and anonymous reviewers for their patient reviews and helpful suggestions.
Conflicts of Interest
The authors declare no conflict of interest.
References
- Jin, Y. Study on the Improvement of China’s New Energy Vehicle Industry Chain Level During the New Development Opportunity. Econ. Rev. 2022, 1, 83–90. [Google Scholar] [CrossRef]
- Liu, L.; Zhang, T.; Avrin, A.-P.; Wang, X. Is China’s Industrial Policy Effective? An Empirical Study of the New Energy Vehicles Industry. Technol. Soc. 2020, 63, 101356. [Google Scholar] [CrossRef]
- Zhang, H. Problems and Suggestions Facing the Development of China’s New Energy Vehicle Power Battery Industry. Sci. Manag. Res. 2018, 36, 58–61. [Google Scholar] [CrossRef]
- Chen, R.; Bai, C. Current Situation, Problems and Countermeasures of New Energy Vehicle Industry Development in China. Auto Ind. Res. 2015, 248, 10–13. [Google Scholar]
- Ohlin, B. Interregional and International Trade; Harvard University Press: Cambridge, MA, USA, 1935; ISBN 978-0674460003. [Google Scholar]
- Marshall, A. Principles of Economics: Unabridged Eighth Edition; Cosimo, Inc.: New York, NY, USA, 2009; ISBN 978-1-60520-802-2. [Google Scholar]
- Fujita, M.; Krugman, P.R.; Venables, A. The Spatial Economy: Cities, Regions, and International Trade; MIT Press: Cambridge, MA, USA, 2001; ISBN 978-0-262-56147-1. [Google Scholar]
- Deichmann, J.; Karidis, S.; Sayek, S. Foreign Direct Investment in Turkey: Regional Determinants. Appl. Econ. 2003, 35, 1767–1778. [Google Scholar] [CrossRef]
- Beaudry, C.; Swann, G.M.P. Firm Growth in Industrial Clusters of the United Kingdom. Small Bus Econ 2009, 32, 409–424. [Google Scholar] [CrossRef]
- Klepper, S. Disagreements, Spinoffs, and the Evolution of Detroit as the Capital of the U.S. Automobile Industry. Manag. Sci. 2007, 53, 616–631. [Google Scholar] [CrossRef]
- Liu, W.; Yeung, H.W. China’s Dynamic Industrial Sector: The Automobile Industry. Eurasian Geogr. Econ. 2008, 49, 523–548. [Google Scholar] [CrossRef]
- Zhao, J.; Sun, T.; Li, G. Agglomeration and Enterprise Location Choice in China’s Automobile Manufacturing Industry. Acta Geogr. Sin. 2014, 69, 850–862. [Google Scholar]
- Gong, H.; Wang, M.Q.; Wang, H. New Energy Vehicles in China: Policies, Demonstration, and Progress. Mitig. Adapt. Strat. Glob Change 2013, 18, 207–228. [Google Scholar] [CrossRef]
- Wang, D.; Li, Y. Measuring the Policy Effectiveness of China’s New-Energy Vehicle Industry and Its Differential Impact on Supply and Demand Markets. Sustainability 2022, 14, 8215. [Google Scholar] [CrossRef]
- Li, D.; Guo, H.; Wang, X.; Liu, Z.; Li, C.; Wang, W. Analyzing the Effectiveness of Policy Instruments on New Energy Vehicle Industry Using Consistent Fuzzy Preference Relations: A Case Study in China. IRSPSD Int. 2016, 4, 45–57. [Google Scholar] [CrossRef]
- Zhang, K.; Qian, Q.; Feng, Z. Distribution Patterns and Multilevel Factors of the Innovation Activities of China’s New Energy Vehicle Industry. ISPRS Int. J. Geo-Inf. 2021, 10, 385. [Google Scholar] [CrossRef]
- Liang, Y.; Lu, H. Dynamic Evaluation and Regional Differences Analysis of the NEV Industry Development in China. Sustainability 2022, 14, 13864. [Google Scholar] [CrossRef]
- Cao, L.; Deng, F.; Zhuo, C.; Jiang, Y.; Li, Z.; Xu, H. Spatial Distribution Patterns and Influencing Factors of China’s New Energy Vehicle Industry. J. Clean. Prod. 2022, 379, 134641. [Google Scholar] [CrossRef]
- Park, J.-I.; Lee, S. Examining the Spatial Patterns of Green Industries and the Role of Government Policies in South Korea: Application of a Panel Regression Model (2006–2012). Renew. Sustain. Energy Rev. 2017, 78, 614–623. [Google Scholar] [CrossRef]
- Fan, X.; Wang, W. Spatial Patterns and Influencing Factors of China׳s Wind Turbine Manufacturing Industry: A Review. Renew. Sustain. Energy Rev. 2016, 54, 482–496. [Google Scholar] [CrossRef]
- Chen, F.; Wang, L. Analysis of the Spatial Pattern and Influencing Factors of China’s Solar Photovoltaic Industry. Resour. Sci. 2012, 34, 287–294. [Google Scholar]
- Meng, D.; Wei, G.; Sun, P. Analyzing the Characteristics and Causes of Location Spatial Agglomeration of Listed Companies: An Empirical Study of China’s Yangtze River Economic Belt. Complexity 2020, 2020, e8859706. [Google Scholar] [CrossRef]
- Tobler, W.R. A Computer Movie Simulating Urban Growth in the Detroit Region. Econ. Geogr. 1970, 46, 234–240. [Google Scholar] [CrossRef]
- Bowman, A.W.; Azzalini, A. Applied Smoothing Techniques for Data Analysis: The Kernel Approach with S-Plus Illustrations; OUP Oxford: Oxford, UK, 1997; ISBN 978-0-19-154569-6. [Google Scholar]
- Silverman, B.W. Density Estimation for Statistics and Data Analysis, 1st ed.; Routledge: Oxford, UK, 2018; ISBN 978-1-315-14091-9. [Google Scholar]
- Hoover, E.M. Location Theory and the Shoe and Leather Industries; Harvard University Press: Cambridge, MA, USA, 1937. [Google Scholar]
- Porter, M.E. Competitive Advantage of Nations: Creating and Sustaining Superior Performance; Simon and Schuster: Manhattan, NY, USA, 2011; ISBN 1-4516-5149-X. [Google Scholar]
- Lu, J.; Tao, Z. Trends and Determinants of China’s Industrial Agglomeration. J. Urban Econ. 2009, 65, 167–180. [Google Scholar] [CrossRef]
- Fan, C.C.; Scott, A.J. Industrial Agglomeration and Development: A Survey of Spatial Economic Issues in East Asia and a Statistical Analysis of Chinese Regions. Econ. Geogr. 2003, 79, 295–319. [Google Scholar] [CrossRef]
- Krugman, P. Geography and Trade; MIT Press: Cambridge, MA, USA, 1992; ISBN 978-0-262-61086-5. [Google Scholar]
- Davies, S.; Lyons, B.; Matraves, C.; Sembenelli, A.; Rondi, L.; Gual, J.; Sleuwaegen, L.; Veugelers, R. Industrial Organization in the European Union: Structure, Strategy, and the Competitive Mechanism; Oxford University Press: Oxford, UK, 1996; ISBN 0-19-828973-1. [Google Scholar]
- Ellison, G.; Glaeser, E.L. Geographic Concentration in US Manufacturing Industries: A Dartboard Approach. J. Political Econ. 1997, 105, 889–927. [Google Scholar] [CrossRef]
- Zhong, Y.; Fu, Y.; Guo, W.; Qiu, J. Spatial Pattern Evolution and Driving Factors of China’s Listed Companies. Sci. Geogr. Sin. 2018, 38, 485–494. [Google Scholar]
- Xu, B.; Lin, B. Do We Really Understand the Development of China’s New Energy Industry? Energy Econ. 2018, 74, 733–745. [Google Scholar] [CrossRef]
- Wang, Y.; Wang, X.; Chen, W.; Qiu, L.; Wang, B.; Niu, W. Exploring the Path of Inter-Provincial Industrial Transfer and Carbon Transfer in China via Combination of Multi-Regional Input–Output and Geographically Weighted Regression Model. Ecol. Indic. 2021, 125, 107547. [Google Scholar] [CrossRef]
- Gao, C.; Tang, S. Study on the Level of Agglomeration of Advanced Manufacturing Industries in Jiangsu Province and the Influencing Factors. Mod. Urban Res. 2022, 02, 104–111. [Google Scholar]
- Fatoki, O.; David, G. Obstacles to the Growth of New SMEs in South Africa: A Principal Component Analysis Approach. Afr. J. Bus. Manag. 2010, 4, 729–738. [Google Scholar] [CrossRef]
- Peng, J.; Jia, J.; Liu, Y.; Li, H.; Wu, J. Seasonal Contrast of the Dominant Factors for Spatial Distribution of Land Surface Temperature in Urban Areas. Remote Sens. Environ. 2018, 215, 255–267. [Google Scholar] [CrossRef]
- Asgarian, A.; Amiri, B.J.; Sakieh, Y. Assessing the Effect of Green Cover Spatial Patterns on Urban Land Surface Temperature Using Landscape Metrics Approach. Urban Ecosyst. 2015, 18, 209–222. [Google Scholar] [CrossRef]
- Liu, L. Selection of Independent Variables in Linear Regression Models and Stepwise Regression Methods. Stat. Decis. 2015, 441, 80–82. [Google Scholar] [CrossRef]
- Shi, J.; He, C. Factors Influencing the Spatial Variation of New Business Establishment in China—A Case Study of Metal Products Industry. Geogr. Res. 2018, 37, 1282–1296. [Google Scholar]
- Pan, F.; Guo, J.; Zhang, H.; Liang, J. Building a “Headquarters Economy”: The Geography of Headquarters within Beijing and Its Implications for Urban Restructuring. Cities 2015, 42, 1–12. [Google Scholar] [CrossRef]
- Sheng, K.; Yang, Y.; Sun, W.; Kerong, S.; Yu, Y.; Sun, W. Influencing Factors and formation Mechanism of Network Centrality in Chinese Cities—Based on the Network Perspective of Top 500 Listed Companies. Prog. Geogr. 2019, 38, 248–258. [Google Scholar] [CrossRef]


Disclaimer/Publisher’s Note: The statements, opinions and data contained in all publications are solely those of the individual author(s) and contributor(s) and not of MDPI and/or the editor(s). MDPI and/or the editor(s) disclaim responsibility for any injury to people or property resulting from any ideas, methods, instructions or products referred to in the content. |
© 2023 by the authors. Licensee MDPI, Basel, Switzerland. This article is an open access article distributed under the terms and conditions of the Creative Commons Attribution (CC BY) license (https://creativecommons.org/licenses/by/4.0/).