Abstract
Sustainable food systems have the potential to protect humans and planet health. Green public procurement (GPP) is a tool for the sustainable transformation. In Poland, the share of GPP is extremely low. As part of the StratKIT project, a survey-based research study was carried out in the city of Rybnik (Silesia Region). The aim of this paper is to diagnose the level of awareness in the field of sustainable development of the project stakeholders, and to propose further sustainable actions related to GPP in Poland. The survey was conducted in social care homes and two primary schools. Statistical analyses were performed using SPSS 24 software. The results show that the level of education has an impact on the assessment of the environment, and that the place of residency interferes with the level of environmental, organic and nutritional knowledge. Correlational analysis showed no statistically significant relationships between age, level of education, place of residence and willingness to introduce action connected to GPP (e.g., organic food). In conclusion, there is a need for an appropriate educational program for the public procurement and catering services (PPCS) sector, teaching about advantages of GPP for the food systems in connection to sustainable agriculture, consumption and climate actions.
1. Introduction
The global food system is responsible for approximately 21–37% of total greenhouse gas (GHG) emissions [1]. It is a fact that current food production and consumption causes serious global environmental and welfare risks, but Sustainable Food Systems (SFS) have the potential to mitigate climate change and sustain planetary and public health [2]. Global sustainable development is the reason why 17 integrated global goals, called the Sustainable Development Goals (SDGs), have been set by the United Nations (UN) in 2015 [3]. Enforcing the so-called 2030 Agenda for Sustainable Development by working on achieving SDGs—especially “Sustainable Consumption and Production” (no. 12), ensuring sustainable consumption and production patterns—is a necessary step in order to address global food system crises including climate change, biodiversity loss, public health degradation and pollution [4].
Climate change is here understood as a change in climate which is attributed directly or indirectly to human activity that alters the composition of the global atmosphere (United Nations Framework Convention on Climate Change, UCNFCCC) [5].
Likewise, from a global perspective, the European Union’s (EU’s) food system is not sustainable when considering the three key indicators: environmental, economic, and social aspects [6]. Therefore, the European Commission’s ‘Green Deal’ with ‘Farm to Fork’ strategy has been elaborated to support the 2030 Agenda and to enable transition to a system that safeguards European food safety and security, healthy diets, and sustainable (especially organic) food production [7].
The public procurement process is a significant tool when considering systems transition, which has the potential to provide a substantial influence on the market and to achieve environmental and health improvements in the public sector [8].
“Promoting sustainable public procurement according to national priorities” is an explicit target under SDG no. 12.7 [9]. Every year, over 250,000 public authorities in the EU spend around 14% of GDP (approx. EUR 2 trillion per year) on public procurement [10]. Green Public Procurement (EU GPP) policy offers assistance in the process of reducing the environmental and health impacts delivered from the consumption in the public sector [11].
The European Commission has developed criteria to facilitate the inclusion of green requirements into public procurement tenders for more than 20 product groups [12]. The European Commission has identified Food and Catering services as an important group with high share of public purchasing combined with the substantial improvement potential for environmental performance [8].
Although comparative studies on Green Public Procurement are still in progress [13], since January 2010 European Commission has been collecting exceptional good practices demonstrating the positive effects of “GPP in practice” on communities, economy, and environment. In the food and catering services sector there are examples from almost all the EU countries: Italy [14], Austria [15], Sweden [16], Latvia [17], Belgium [18], Denmark and France, except Poland. In Poland, the share of green or innovative public procurement was reported in 2020 to be 1% of the total number of public tenders awarded, while the value accounted for 7% of the total value of public contracts awarded [19]. Only 384 contracting authorities awarded 1544 contracts of an environmental or innovative nature. The application of the cost criterion using life-cycle costing took place in only 21 proceedings. In approximately 85% of cases the offer was chosen due to the lowest price criterion [19].
Among the main reasons for the low level of sustainable and innovative procurement in Poland is the insufficient level of awareness of their advantages among contracting officers, including managers and executives [20]. The research conducted for the Polish Ministry of Environment in 2018, evaluating pro-ecological awareness and behavior of Polish citizens, shows an especially low level of environmentally friendly individual actions and consumer behavior. Poles often have not paid attention to the labels related to ecology and the environment, which is reflected in the low familiarity with environmental labels. The environmental awareness, however, increases depending on education level and the size of city and countryside that respondents are coming from [21]. Another Polish study shows that one of the key aspects determining pro-ecological behavior is ecological awareness, the formation of which is a complex and long-term process [22]. Therefore, there is a need for a constructed analysis to determine the level of awareness in the field of sustainable development—including environmental, nutritional, and agricultural components among the employees of the public procurement and catering services sector—before constructing appropriate educational program about sustainability in food systems.
Environmental awareness and knowledge about climate change seem to be particularly necessary in Rybnik, which is one of the most polluted cities in Poland [23] and one of the ten European cities with the highest PM2·5 mortality burden [24]. According to the research conducted by Nawrot et al. (2020), children in this city suffer serious health consequences for this reason [25].
This is definitely one of the reasons why Rybnik was selected as a partner and pilot town in the 2019–2021 StratKIT project (Innovative Strategies for Public Catering: Sustainability Toolkit across the Baltic Sea Region) founded by Interreg Baltic Sea Region (https://www.stratkit.eu/en/, accessed on 25 October 2022).
The aim of this study was to diagnose the environmental and nutritional awareness of the selected group of catering employees in Rybnik town, in order to design a comprehensive food educational program for Rybnik within the framework of the StratKIT project [26]. The long-term goal is to increase the level of sustainability and to introduce green public procurement (GPP) in Rybnik as the pilot town with the possibility of applying this concept in other cities in Poland and Europe. The delimitation of the presented study is based on the deliberate selection of one pilot city and three public units in which the study was carried out. This choice was dictated by the conditions and possibilities of the StratKIT project within which the research was carried out. The three public institutions were selected by the city based on the submission form filled and sent by them in order to participate in the StratKIT project’s actions (supported by project’s funds for these types of activities). Those units not only took part in the survey, but also have been chosen to undergo the food educational program designed by Polish StratKIT team.
2. Materials and Methods
As part of the StratKIT project [26] a research study was carried out to diagnose the level of awareness in the field of sustainable development, including environmental, nutritional, and agricultural components of the project’s stakeholders: employees and parents of the pupils attending to two primary schools in Rybnik, as well as of the personnel from the Social Care Home in Rybnik involved in the public catering. The first and main research tool used for all respondents was a comprehensive survey consisting of 6 sections: (1) respondents’ particulars; (2) environmental awareness; (3) sustainability awareness; (4) organic sector awareness; (5) nutritional awareness; and (6) evaluation of the institution’s public catering services.
The validation of the questionnaire was obtained by circulating the survey among 30 scientists from Warsaw University of Life Sciences with content expertise (i.e., sustainable diet and organic food) and/or expertise in surveys. The experts tested the questionnaire to verify the survey and validate the understandability of questions. They received the survey in the Word format and included their feedback. Feedback from the experts was reviewed and integrated by the author team. After this pilot test, the questionnaire was distributed to the target group of 200 adult stakeholders living in and around Rybnik, and was filled in correctly by 147 respondents. A detailed scheme of the research is presented in Figure 1.
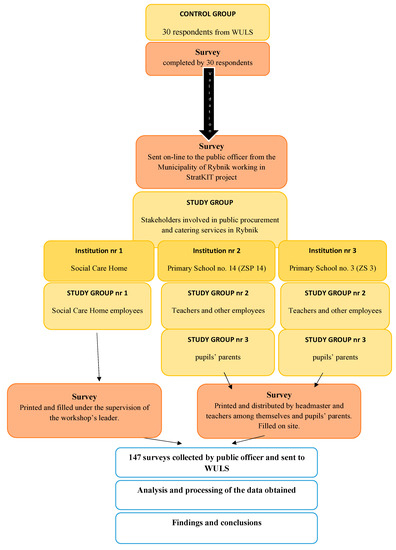
Figure 1.
Detailed scheme of the research.
2.1. Ethical Considerations
The study was approved by the Committee for the Ethics of Research Involving Human Participants of the Faculty Human Nutrition of the Warsaw University of Life Sciences (approval number: 10/2021). All participants consented to take part in the study.
The survey was voluntary and fully anonymized. In accordance with the opinion of the Warsaw University of Life Sciences Data Protection Officer, the questionnaire does not contain personal data and the results will be protected by passwords in the secure documents.
Any personal data collected during the project have been secured in accordance with the Regulation (EU) 2016/679 of the European Parliament and of the Council of 27 April 2016, on the protection of natural persons regarding the processing of personal data and on the free movement of such data and repealing Directive 95/46/EC [27].
2.2. Participants Recruitment
Between March and April 2021, printed surveys were distributed among the employees of social care homes in Rybnik during culinary workshops organized within the StratKIT project. The respondents were filling questionnaires under the supervision of the workshops’ leaders. Due to COVID-19 restrictions, in two chosen primary schools the survey could be only distributed by a headteacher and circulated among teachers, employees, and parents of the pupils (Figure 1). In all the above cases the survey was originally sent to the public officer from the Municipality of Rybnik working in the StratKIT project, who distributed it within the three public institutions (Figure 1).
In total 147 respondents correctly filled the survey. The following groups were identified: teachers and other employees of primary schools (36%), parents of pupils of primary schools (40%) and Social Care Home employees (24%) (Table 1).

Table 1.
Overview of the respondents’ groups.
2.3. Survey
The survey was question-based, and it included:
- -
- An assessment of environmental awareness (attitudes, opinions) including knowledge of environmental problems and climate change;
- -
- An assessment of the knowledge of sustainable development (production, consumption, food waste);
- -
- An assessment of organic awareness (attitudes, motivations, opinions) including knowledge of organic food production;
- -
- An assessment of nutritional awareness (information sources, basic knowledge);
- -
- An assessment of the institution’s public catering services (open questions).
The “environmental awareness” part consists of eight original questions designed to identify the respondents’ level of knowledge and opinion on environmental problems and climate change. The “sustainability awareness” part consists of nine original questions to help diagnose knowledge about sustainable development goals, including sustainable production, consumption, and food waste. The “organic awareness” part contains a set of six original questions based on a report from the analysis of the Tracking Survey on Ecological Awareness and Behaviour of Polish Citizens (Analysis for the Ministry of the Environment, 2018) [21]. The aim of this segment is to identify elements of the knowledge of the organic sector (opinions, perceptions, certificates, attitudes, and motivations) and pro-environmental consumer behaviour declared by respondents. The “nutritional awareness” part consists of two basic questions, which aim to find out what respondents know about basic nutrition and where they find their information. The “evaluation of the institution’s public catering services “part has an open question assessing the canteen of participants’ institution.
To ascertain respondents’ awareness and knowledge of environmental, agricultural and health issues, several screening questions were included in the survey. The distribution of answers to these questions is illustrated by figures, with correct indications marked in yellow. The distribution for some questions is presented in tabular form, with correct answers marked in bold and red in the tables.
2.4. Statistical Analyses
The significance of differences in mean scores between more than two groups was tested using One-Way ANOVA (analysis of variance). Further post hoc analysis was performed using the Bonferroni test. The use of parametric tests requires several assumptions to be met. Homogeneity of variance in the compared groups was checked using the Levene’s test, normality of distributions in the compared groups was checked using the Shapiro–Wilk test. The significance of relationships between ordinal variables was checked using Spearman’s rank correlation coefficient. The significance of relationships between nominal variables was checked using the chi-square test of independence.
Statistical analyses assumed a significance level of p = 0.05. Analyses were performed using SPSS 24.0.0.0 software.
3. Results
3.1. Environmental Awareness
3.1.1. Respondents’ Opinion of the Natural Environment
Respondents’ opinion of Poland’s natural environment was not unequivocal—35% assessed it rather well and 42% rather badly (Figure 2a). The situation was similar when respondents rated the state of the environment in their home town—39% rather good, 41% rather bad (Figure 2b).
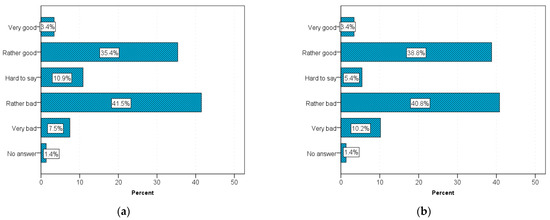
Figure 2.
Assessment of the state of the environment: (a) in Poland; (b) in Rybnik.
There was a statistically significant correlation between the level of education of the Social Care Home employees and the assessment of the state of the natural environment in Poland (p = 0.001). Respondents with a higher level of education rated the state of the natural environment in Poland lower (r = −0.56). However, there was no significant relationship between the level of education and the assessment of the natural environment in Rybnik (p = 0.558) (Table 2).

Table 2.
Spearman rank correlation coefficient values. Relationship between the level of education and the assessment of the state of the natural environment in Poland and in Rybnik.
3.1.2. Respondents’ Opinion on the Major Environmental Problems
Respondents had to indicate the three most important environmental problems. The most common environmental problems indicated by respondents were air pollution (61% of indications), poor waste management/litter problem (52%), food waste (33%). Less frequently, respondents indicated issues such as climate change (22%), water pollution (19%), deforestations (17%), disappearance of animals and plants (8%), increase in noise pollution (3%), overfishing of the seas and oceans (3%). None of the respondents indicated such a problem as soil degradation due to monocultures (Figure 3).
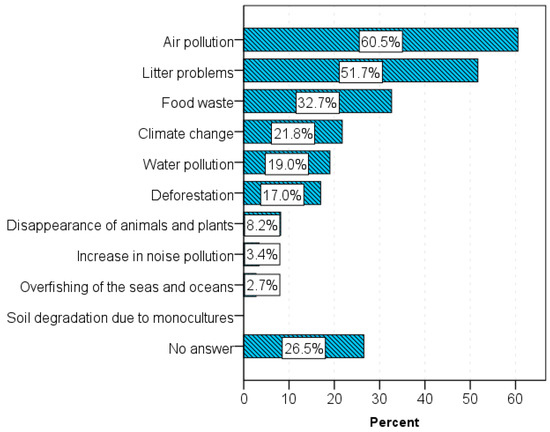
Figure 3.
Major environmental problems. Multiple responses possible (each bar represents the % of respondents with a particular indication out of the total).
In addition to indicating the problems, respondents also had to rate the importance of the problem on a scale from 1 (most important) to 3 (least important). The most important problems were air pollution (mean score = 1.2), deforestation (1.8) and poor waste management (1.9). The least important to respondents was overfishing of the seas and oceans (3.0) (Table 3).

Table 3.
Major environmental problems, importance rating (1—most important problem to 3—least important problem).
3.1.3. Respondents’ Awareness of Climate Change
Most of the respondents correctly defined “climate change” as a change in climate which is attributed to human activity (69%). Of the incorrect answers, the most common was “the natural climate variability on Earth” (22%) (Figure 4).
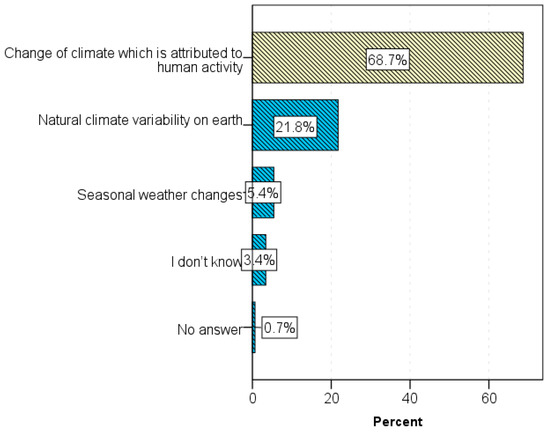
Figure 4.
What the respondent understands by climate change.
Most respondents blamed burning fossil fuels by humans (78%) and clearing rainforests (57%) for climate change. Fewer respondents knew that nitrogen fertilisers (32%), increased industrial livestock breeding (14%), diet (12%), and agricultural intensification (11%) were also responsible for climate change (Figure 5a).
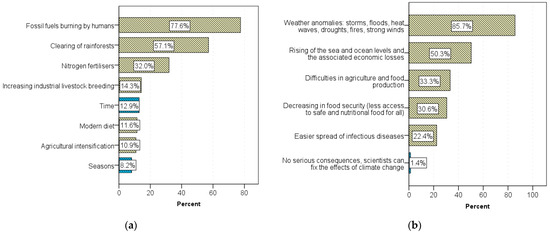
Figure 5.
Climate change in opinion of respondents (Multiple responses possible): (a) causes of climate change; (b) consequences are threatened by climate change.
The most frequently cited consequences of climate change were weather anomalies (86%), less frequently cited were consequences such as rising sea and ocean levels (50%), difficulties in agriculture (33%), reduced food security (31%), and easier spread of infectious diseases (22%) (Figure 5b).
3.1.4. Respondents’ Awareness of Air Pollution
The most frequently indicated consequences of inhaling smog were serious illnesses (86%) and shorter life expectancy (70%); fewer people indicated high concentrations of carcinogenic black carbon in the body (59%) (Figure 6a).
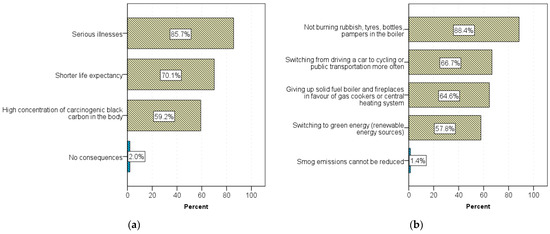
Figure 6.
Smog in opinion of respondents (Multiple responses possible): (a) consequences of inhaling smog; (b) ways to reduce smog emissions.
The most common approach indicated by respondents to reduce smog emissions was not to burn rubbish, tyres, bottles, diapers in the boiler (88%). Slightly less frequently mentioned ways were switching from driving a car to cycling or public transportation more often (67%), giving up solid fuel boiler and fireplaces in favour of gas cookers or central heating system (65%), switching to green energy (renewable energy sources (58%). Individuals mistakenly believed that smog emissions could not be reduced (1%) (Figure 6b).
3.2. Knowledge of Sustainable Development
3.2.1. Sustainable Development
Respondents knew what the three elements of sustainable development were. They most often indicated the respect for the environment (83%), less often such features as social progress (69%) and economic growth (52%). Among the wrong answers were features such as the development of agriculture through monocultures (31%) and the development of industry (30%), which were most often indicated (Figure 7).
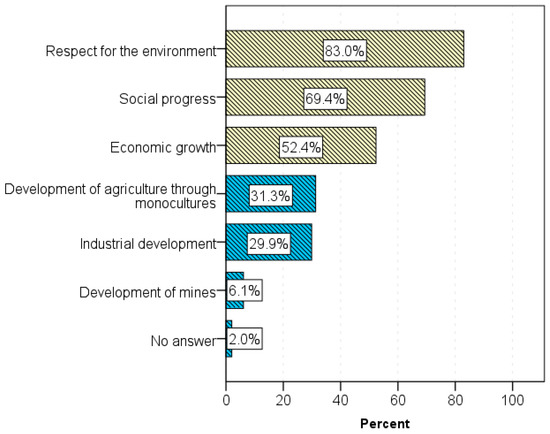
Figure 7.
Three elements of sustainable development. Three responses possible.
3.2.2. Sustainable Consumption
Most people assumed that the term “sustainable food consumption” means that the energy value of the food eaten is equal to the energy expended on that day (56%). The fact that the essence of the term is to conduct the daily diet in such a way that the environmental impact is minimized as possible was known to 25% of respondents. Most people correctly identified the term sustainable fishing (88%) (Figure 8).
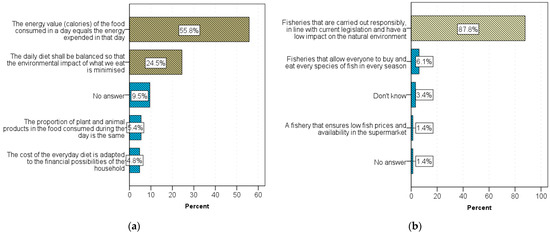
Figure 8.
What the following terms mean: (a) sustainable food consumption; (b): sustainable fishing.
3.2.3. Sustainable Food Production
Respondents felt that the agricultural production most often affects the environment (73%), health (59%) and animal welfare (46%). Fewer thought it affected water, river, and sea pollution (38%), biodiversity (28%), climate change (21%), economics (21%), and species extinction (15%) (Figure 9).
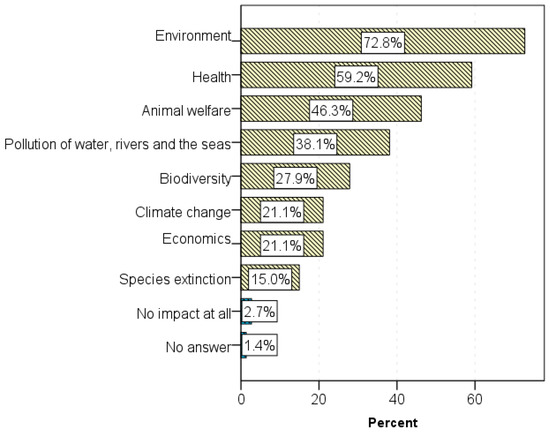
Figure 9.
What is affected by the agricultural production? Multiple responses possible.
Of the food groups with the least environmental impact, respondents most often selected were fruit (57%), vegetables (57%) and pulses (49%), while fewer people knew that bread (26%) was also such a food group (Figure 10a).
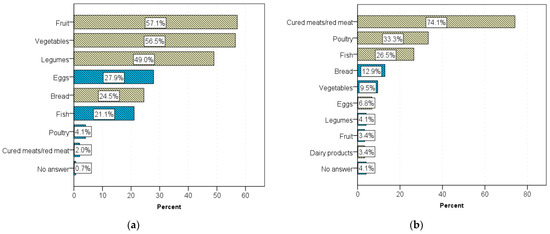
Figure 10.
Which of the listed food groups has (Multiple responses possible): (a) the least impact on the environment; (b) the greatest impact on the environment.
For respondents, red meat production had the greatest environmental impact (74%), with poultry (33%) and fishing (27%) indicated less frequently (Figure 10b). Only 3.4% chose dairy products.
3.2.4. Food Waste
Respectively, 63%, 52% and 46% of the respondents knew that the statement “use-by date” refers to products that are perishable, products that may be hazardous to health after indicated time, and products that should not be eaten after the indicated time. In addition, 52% of the respondents knew that “best before date” refers to long-lasting products, and 48% to products that can be eaten after the indicated time, but their sensory properties deteriorate (Table 4).

Table 4.
Which statements refer to: Use-by date, Best before date (correct answers are in bold and marked in red).
Most people correctly estimated what percentage of the world’s food is thrown away or wasted (68%) (Figure 11).
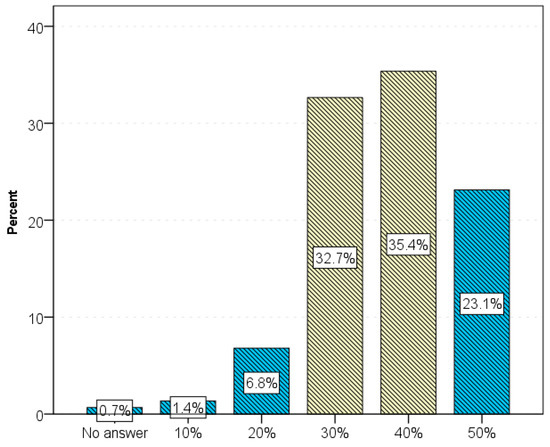
Figure 11.
Respondents’ opinion what percentage of the world’s food is thrown away or wasted?
3.3. Organic Sector
3.3.1. Organic Food Production
The fact that organic food is produced without the use of synthetic fertilisers, without plant protection products and without genetic modification was known to 74% of respondents, but 10% gave no answer and 14% chose an answer that it was food produced in the countryside by small local farmers (Figure 12a). Most respondents (79%) believed organic farming has an impact on the environment (Figure 12b).
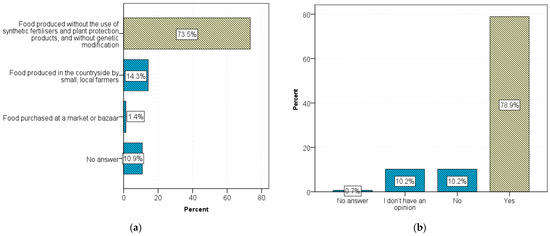
Figure 12.
Organic food in opinion of respondents: (a) understanding the concept of organic food; (b) an impact of organic food on the environment.
3.3.2. Organic Certificate
The label of certified organic food was correctly indicated by just over 54% of those surveyed (Figure 13).
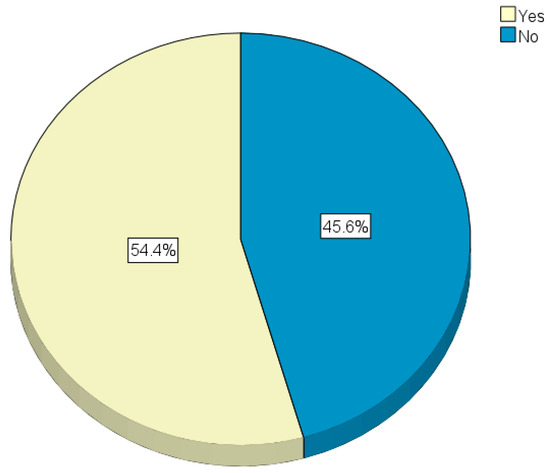
Figure 13.
Familiarity with the official label for certified organic food.
3.3.3. Organic Food Consumers
Respondents most often thought that certified organic food compared to conventional food was 30% more expensive (46%), but slightly fewer thought it was more than half as expensive (22%) or 20% more expensive (17%) (Figure 14). This may indicate a lack of orientation and experience of respondents in this area, as in reality prices of organic products in Polish shops are usually 50–100% higher than conventional prices [28,29].
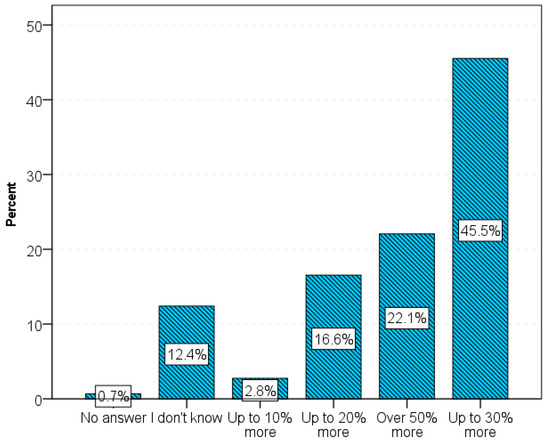
Figure 14.
How much more does certified organic food cost compared to regular conventional food?
Respondents were asked to specify what proportion of the food served in the school canteen should be organic food. The average result was 61.6%. The median of the distribution of indications was 60%, with respondents most often indicating a value of 50%. The distribution of indications ranged from 5% to 100% (Table 5).

Table 5.
What proportion of the food served in the school canteen should be organic food?
3.4. Nutritional Awareness
3.4.1. Macro-Nutrient
Most people were able to assign the main macro-nutrient to specific food groups, the percentage of correct indications in all cases being greater than 80% (Table 6).

Table 6.
Assignment of the main nutrient to food groups (correct answers are marked in red).
3.4.2. Source of Information on Diet
The main sources of information on proper diet were blogs and websites of experts related to this field (56%), or less frequently magazines and TV programmes (31%), nutritionists (25%), Instagram or Facebook (24%), family and friends (18%), professional literature (12%), GP (8%), school or university (5%) (Figure 15).
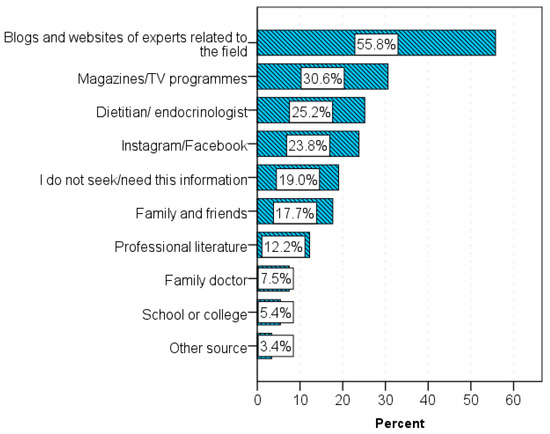
Figure 15.
Sources of information on proper diet.
3.5. An Assessment of the Institution’s Public Catering Services
In the following part of the study, only those respondents who use the canteen or whose children eat in the canteen, or those who are employed as a school canteen worker, were analysed. The evaluation of these meals was most often good (56%) or very good (36%), but rarely bad (6%) or very bad (3%) (Figure 16a).
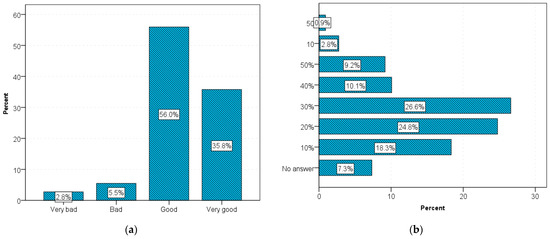
Figure 16.
Meals in canteens: (a) evaluation of meals served in the canteen of the public institutions; (b) percentage of food discarded in the school canteen kitchen / social care home.
Correlation analysis showed no statistically significant relationship between the level of knowledge about ecology, agriculture and health and the evaluation of the meals served (p = 0.564) (Table 7).

Table 7.
Spearman’s rank correlation coefficient values. Relationship between the level of knowledge about ecology, agriculture, health and the evaluation of the meals served in the canteen.
Teachers rated the meals served most often very good (57%), slightly less often good (40%), and only 3% of teachers rated the meals served very bad or bad (3%). In contrast, most parents rated the meals well (72%), fewer rated them very well (19%), and there was a higher proportion who rated the meals very bad (9%). In the Social care home employees’ group there was the highest proportion of people rating the meals very badly and badly (13%), but 47% of staff rated the meals well and 41% rated them very well. The differences discussed between the groups are statistically significant (p = 0.010) (Table 8).

Table 8.
Evaluation of meals consumed in each study group (teachers + others, parents, social care home employees).
The most common changes suggested by respondents to be made to the menu were: more vegetables and vegetable dishes (15%), more fruit (8%), more variety of dishes (6%) and smaller portions (5%). A full list of suggested changes can be found in Table S1 in the Supplementary Materials.
The most popular dishes served in the canteen or by the kitchens were: tomato soup (26%), spaghetti (25%), frikadelle (16%), crepes (13%), broth (11%), pork chop (9%), and soups (9%). A full list of popular dishes is provided in Table S2 in the Supplementary Materials.
Respondents considered “surówki” (raw vegetable salads) (32%), soups (25%), fruit (12%), fish (12%), salads (12%), vegetables (10%) and cereals (9%) to be the healthiest (Table S3 in the Supplementary Materials).
Respondents considered fruit (15%), vegetables (14%), soups (12%), and salads (10%) to be the most environmentally friendly dishes. The full list of environmentally friendly dishes according to respondents is shown in Table S4 in the Supplementary Materials.
The respondents had to use a scale from 1 to 10 to indicate how important it was to introduce better quality organically certified fruit and vegetables into the menu. The mean score was 6.7, with a standard deviation of 2.53; the median score was 7 and the most frequently given score was 5 (Table 9).

Table 9.
How important is it to introduce better quality organically certified fruit and vegetables into your menu (from 1 to 10)?
No statistically significant correlations were found between the level of knowledge about ecology, agriculture, environmental protection, and the willingness to introduce better quality organically certified fruit and vegetables into the menu (p = 0.072) (Table 10). However, there is an apparent trend towards a positive correlation between knowledge and willingness to introduce organic fruit and vegetables to the menu.

Table 10.
Spearman’s rank correlation coefficient values. Relationship between the level of knowledge about ecology, agriculture, environmental protection and the willingness to introduce better quality organically certified fruit and vegetables into the menu.
Respondents most often thought that the percentage of food thrown away in the kitchen or canteen was 30% (27%), while a large percentage of people thought that 20% (25% of people) or 10% (21% of people) of food was thrown away (Figure 16b).
The correlation analysis showed a statistically significant relationship between the level of knowledge about ecology, agriculture, environmental protection and the estimation of the amount of food thrown away. Respondents giving more correct answers in the knowledge test were more likely to mark higher percentages of wasted food (p = 0.003) (Table 11).

Table 11.
Spearman’s rank correlation coefficient values. Relationship between the level of knowledge on ecology, agriculture, environmental protection, and the estimate of the amount of food discarded.
Teachers most often thought that the percentage of food wasted was 30% (46% of them), less often that the percentage was 10% and 20%. Parents most often thought that the percentage was either 30% (35% of them) or 40–50% (35% of them). In contrast, Social care home employees thought the percentage was lower at 10% (37% of them) and 20% (47% of them). The differences discussed are statistically significant (p = 0.010) (Table 12).

Table 12.
Percentage of wasted food—opinion of the respondents (teachers + others, parents, residential care workers).
3.6. An Assessment of the Environmental Knowledge of the Respondents
The Level of Knowledge
To determine the level of knowledge the correct answers to each question were counted, with a maximum of 60 correct answers available to respondents. Respondents were awarded 1 point for each correct answer in single-choice questions. Points had to be counted differently in multiple-choice questions, as a respondent could mark all answers, both correct and incorrect, in a question and thus wrongly receive the maximum number of points for that question. This was resolved so that incorrect answers in multiple-choice questions were penalised by a point deduction within that question. When there was a preponderance of incorrect answers in such a question, the respondent was awarded 0 points for that question.
None of the respondents obtained the maximum number of points to be scored; the highest score obtained was 47 points, with such a score only obtained by 1 respondent. The most frequent respondents obtained 32 points (6.1% of respondents), the average number of points obtained was 27.4 points, with a standard deviation of 8.51 points, and the median distribution of points obtained was 28 points. The lowest score was 7 points (1 person) (Table 13, Figure 17).

Table 13.
Environmental knowledge of the respondents—measures of central tendency and dispersion (total points obtained).
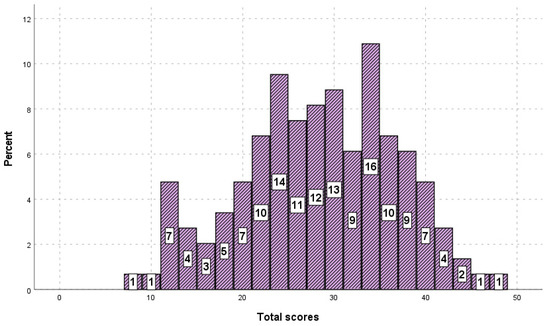
Figure 17.
Environmental knowledge of the respondents—histogram of points obtained.
The points obtained were divided into five knowledge level categories—very low knowledge level (0 to 12 points), low knowledge level (13 to 24 points), sufficient knowledge level (25 to 36 points), high knowledge level (37 to 38 points), very high knowledge level (49 to 60 points).
On this basis, the awareness and knowledge of environmental, agricultural and health problems of the respondents was found to be at a low (29.3%) and sufficient (48.3%) level. A small percentage of respondents had knowledge at a very low (6.1%) or high (16.3%) level. The results of none of the respondents allowed us to conclude that their level of knowledge in research is at a very high level (Figure 18).
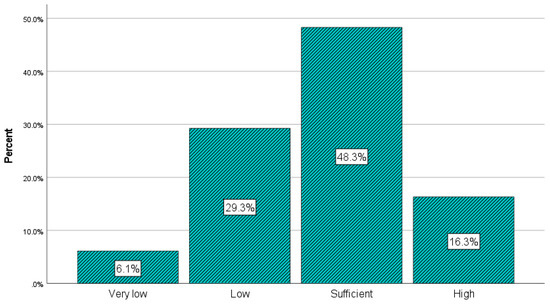
Figure 18.
Evaluation of the level of knowledge.
The highest mean scores were obtained by the group of teachers and other primary schools’ employees (mean 29.3); slightly lower scores were obtained by parents (28.5) and the lowest by Social Care Home Employees (22.9). These differences between the mean scores are statistically significant (p = 0.002). Further post hoc analysis showed that the Social Care Home employees’ scores were significantly different from the teachers’ scores (p = 0.003) and the parents’ scores (p = 0.01) (Table 14).

Table 14.
Evaluation of the level of environmental knowledge in the sub-groups of respondents.
Correlational analysis showed no statistically significant relationships between age, level of education and awareness and level of knowledge of environmental, agricultural and health problems (p > 0.05). However, the level of knowledge of the respondents was found to be correlated with the place of residence (p = 0.047). Respondents living in larger towns of the studied area scored higher (Table 15). It should be made clear that not all respondents working in Rybnik are residents of Rybnik.

Table 15.
Relationship between age, place of residence, level of education, and level of environmental knowledge. Spearman’s rank correlation coefficient values.
Statistically significant correlations were found between the level of knowledge and the assessment of the state of the environment in Poland (p < 0.001) and in Rybnik (p = 0.001). Respondents providing a higher number of correct answers rated the state of the environment in Poland and in Rybnik lower (Table 16).

Table 16.
Relationship between the level of environmental knowledge and the assessment of the state of the natural environment in Poland and in Rybnik. Spearman’s rank correlation coefficient values.
The correlation analysis showed no statistically significant relationship between the level of knowledge about ecology, agriculture and health and the willingness to replace convention food with organic food (p = 0.892) (Table 17).

Table 17.
Spearman’s rank correlation coefficient values. Relationship between level of knowledge and willingness to substitute conventional food for organic food.
4. Discussion
The results show that the level of education and the place of residency have consequently an impact on the assessment of the state of the natural environment in Poland, and the level of environmental, organic, and nutritional knowledge. It is similar to the results from the Tracking Survey on Ecological Awareness and Behaviour of Polish Citizens (Analysis for the Ministry of the Environment, 2018) [21]
There was a statistically significant correlation between the level of education of the Social Care Home employees and the assessment of the state of the natural environment in Poland. Even thought correlation analysis showed no statistically significant relationships between age, level of education and awareness and the level of knowledge of environmental, agricultural and health problems, respondents providing a higher number of correct answers and rated the state of the environment in Poland and in Rybnik lower. Probably, it is connected to the data presented by the 2020 Study on awareness and ecological behaviour of Polish citizens [30] stating that respondents with secondary and higher education are more likely to learn about environmental issues from the media and the Internet than those with primary and lower secondary education.
The level of environmental and nutritional knowledge of the respondents was found to be correlated most with the place of residence. Respondents living in the larger towns scored higher. This finding follows the results presented in other publications differentiating the level of knowledge between rural and urban residents [31], and improvements on their nutritional intake [32] and some environmental action [33]. In Silesian research, the rural inhabitancy was particularly associated with higher obesity risk [34]. Diet of Polish students from the rural areas was also demonstrated to be less healthy than the students from the cities [35].
The study on the environmental awareness and attitudes of Polish farmers suggested designing a model for life-long learning, including formal education and adult education for the rural population to shape enduring pro-environmental attitudes [36].
The awareness and knowledge of environmental, agricultural and health problems of the respondents was found to be at a low (31%) and sufficient (50%) level. A small percentage of respondents had knowledge at a very low (5%) or high (14%) level. The results of none of the respondents allowed us to conclude that their level of knowledge is at a very high level, which means that there is a need of a better educational system. These findings are connected with the research conducted in the Medical University of Silesia, which showed that there is a necessity to increase the awareness and appropriate nutrition intake of future medical workers who will be responsible for public health in their professional life [37].
The public procurement and catering services stakeholders are also important actors in the public health sector, as public canteens can improve or worsen everyday dietary habits, especially in schools and kindergartens [37,38,39]. Not only high-quality nutrition is crucial for childhood growth and development, but it is also greatly relevant to mental well-being [40]. Green public procurement in canteens, as written in the introduction, can greatly influence sustainable and healthy decisions in the public health sector.
An intervention study among students and staff at a Dutch university found that greater knowledge of healthy or sustainable food choices is associated with eating meals with a more environmentally friendly impact. The correlation between pre-intervention knowledge and observed dietary alteration was significant, especially concerning the CO2 and land use impacts of food choices [41]. The study demonstrates that the education program for PPCS stakeholders has to be complex, and it should connect different aspects of sustainability in the food systems. In our research, the majority of the respondents knew the proper definition of climate change, sustainable development, and sustainable fishing, but only a minority were able to recognise the problems associated with the low sustainability of food systems. Only few respondents knew that nitrogen fertilisers (32%) increased industrial livestock breeding (14%), while diet (12%) and agricultural intensification (11%) were also responsible for climate change. The consequences of climate change are connected to difficulties in agriculture was known to only 33% of participants and only 31% linked it to reduced food security. The least important environmental problem to respondents was overfishing of the seas and oceans (3.0). None of the respondents have indicated such an environmental problem as soil degradation due to monocultures, but 31% incorrectly chose the development of agriculture through monocultures as an element of sustainable development.
Sustainable eating is not only about rules and regulations, but it should be an enjoyable and tasty experience with traditional and cultural likings respected [42]. The general knowledge is not the only element of sustainable and healthy choices [43]. Although it is necessary, as the Polish Supreme Audit Office reported a lack of knowledge among employees and decision makers of canteens about balanced school meals and showed that none of the inspected establishments provided lunches that met 100 per cent of the appropriate nutritional standards for children and young people. All assessed menus were found to be too high in protein and carbohydrates, and over 85 per cent also in fat [44].
The most common changes suggested by respondents in the survey for the canteens’ menus were: more vegetables and vegetable dishes (15%); more fruit (8%); more variety of dishes (6%) and smaller portions (5%). Respondents considered fruit (15%), vegetables (14%), soups (12%), and salads (10%) to be the most environmentally friendly dishes, and at the same time raw salads (32%), soups (25%), fruit (12%), fish (12%), salads (12%), vegetables (10%) and cereals (9%) to be the healthiest ones.
A little different was their opinion on the most popular dishes served in the canteen: tomato soup (26%), spaghetti (25%), frikadelle (16%), crepes (13%), broth (11%), pork chop (9%), and soups (9%).
According to FAO, Sustainable Healthy Diets are dietary patterns that promote all dimensions of individuals’ health and wellbeing; have low environmental pressure and impact; are accessible, affordable, safe and equitable; and are culturally acceptable [45]. Green public procurement criteria for food, catering services and vending machines are compatible with this definition, promoting among others, organic food, more environmentally responsible marine and aquaculture food products, plant-based menus, more environmentally responsible vegetable fats [8].
Our correlation analysis showed no statistically significant relationship between the level of knowledge about ecology, agriculture and health and the willingness to replace ordinary food with organic food. The average result was 61.6%, and similarly, 54% of respondents knew what the organic certificate looked like. The reason for that may be a “value and action gap”—a behavior of the consumers concerned about environmental issues but with the difficulties in translating this into their purchasing routine [46]. Based on the Polish studies, it can be also noticed that even people with growing awareness of the environmental and wellbeing issues, are often skeptical about the benefits of organic foods. One of reasons for this disbelief is a distrust in organic certification [47] that may partially explain the low expenditures on organic foods in Poland. Polish consumers spend only around 8EUR per capita on organic foods, while German up to 144 EUR and Danish even more—344 EUR per capita [48].
However, it should be borne in mind that this result may be connected to the region the survey was conducted in [49] and the number of respondents. In another current study on mothers of young children conducted in the western part of Poland [50] it was found that there was a statistically significant correlation between education level and consumption of organic food. It was also previously found in a wider study conducted on Polish citizens [51].
In our assessment, based on the opinions, level of awareness and knowledge of respondents, future sustainable actions and changes in the PPCS should take into account cultural and regional conditions and constraints.
As most of the respondents found nutritional knowledge in blogs and websites, we believe that a wider study is necessary to create an educational program to implement better GPP criteria. The sustainable education is more than just training or qualification, and it should reflect collectively on current societal conditions and consider alternatives without having to engage in some immediate action [52]. What is needed here are long-term strategies and consistent actions.
5. Conclusions and Recommendations
The results of the presented pilot research led to the conclusion that the environmental awareness of people involved in food services in primary schools and in the social care homes may be at an insufficient level and needs to be improved. The main gaps are in the knowledge of the sustainable food system and the importance of organic food. The results already obtained allow for sound recommendations for decision makers in the sector of public food procurement. Training programmes and discussion forums are needed to increase interest in green public procurement (GPP). The UE should put more pressure on the national and local governments, as well as universities, to disseminate and enable the principles of GPP.
In addition, there is a need to educate all those responsible for public catering, such as school headteachers, chefs, caterers and teachers, on the subject of GPP, organic foods and sustainable systems. Of course, it is also important to educate parents as well as the general public.
The knowledge and trust in sustainability and sustainable food systems should be built through the liable education and systemic approach provided to and by public institutions.
Due to the pilot study design and research being limited to a few institutions in one Polish city (Rybnik), it should be recommended to extend the study to a larger group of respondents and in several Polish cities. The extension of the study should consequently involved other cities in the Upper Silesia, which is the most industrially polluted area of Poland. The reason is that the inhabitants of this region are more exposed to health problems compared to other, cleaner regions of Poland [53]. As a result, organic food is strongly recommended as highly nutritious and contaminant-free for the residents of Upper Silesia. According to recent statistical data [54], the highest values of the index of average exposure to PM2.5 dust in agglomerations and cities with more than 100,000 inhabitants was recorded in 2021 in: Rybnicko-Jastrzębska Agglomeration (24 μg/m3) and Kraków and Upper Silesian Agglomerations (23 μg/m3 each). Research should therefore be continued in Rybnik, and additionally conducted in such cities as Wodzisław Śląski, Jastrzębie Zdrój, Katowice, Jaworzno, Piekary Śląskie, Chorzów, Dąbrowa Górnicza. In each of these cities, five primary schools and three residential care homes should be selected and surveys should be carried out in these units, as in the present study.
Limitation of the Study
The important limitation of this study was the different method of filling surveys by all study groups (Figure 1). In fact, the highest mean scores were obtained by the study group 2 (teachers and other primary schools’ employees) followed by study group 3 (parents). Both groups filled the surveys on site or at home. The lowest score was obtained by group 1 (Social Care Home Employees—22.9), who were answering the questions during StratKIT workshops under the supervision of the workshop leader. We believe that the results obtained from Study Group 1 are the most reliable.
An additional limitation of our study is the relatively small sample size of each category of respondents. The larger groups could have shown more statistically significant correlations and a diverse level of awareness and knowledge of environmental, agricultural and health problems.
It also important to proceed with caution while interpreting the obtained results as quantification of such a character often requires strong simplification and assumptions, and as a result, important factors may be ignored.
Supplementary Materials
The following supporting information can be downloaded at: https://www.mdpi.com/article/10.3390/su15043620/s1, Table S1: Respondents’ opinion on important changes to be made to the menu (questionnaire open question); Table S2: Most popular dishes in the menu among respondents (questionnaire open question); Table S3: Respondents’ opinion on dishes considered to be the healthiest (questionnaire open question); Table S4: Respondents’ opinion on dishes considered to be most environmentally friendly (questionnaire open question).
Author Contributions
Conceptualization, R.K., R.G.-W. and E.R.; Data curation, R.K. and R.G.-W.; Formal analysis, R.G.-W., R.K., K.K., D.Ś.-T. and H.D.; Funding acquisition, R.K., R.G.-W. and E.R.; Investigation, R.K., R.G.-W. and D.Ś.-T.; Methodology, R.K. and R.G.-W.; Supervision, R.K.; Visualization, R.G.-W., R.K., K.K., H.D. and D.Ś.-T.; Writing—original draft, R.G.-W.; Writing—review and editing, R.K., E.R., D.Ś.-T., K.K. and H.D. All authors have read and agreed to the published version of the manuscript.
Funding
This research was funded by the Interreg BSR program financed by the European Regional Development Fund with financial support from the Russian Federation (StratKIT Project, Grant No. R088, 2019-2021). The research was financed with the contribution of the international project co-financed by the Polish Ministry of Science and Higher Education Programme “PMW” in 2020–2021; Grant No. 5170/INTERREG BSR/2020/2 to R.G.-W., R.K. and E.R. The funding sources had no role in the design, analysis, or writing of this article.
Institutional Review Board Statement
The study was approved by the Committee for the Ethics of Research Involving Human Participants of the Faculty Human Nutrition of the Warsaw University of Life Sciences. The survey was voluntary and fully anonymized. In accordance with the opinion of the University of Life Sciences Data Protection Officer, the questionnaire does not contain personal data and the results will be protected by passwords in the protected documents.
Informed Consent Statement
Informed consent was obtained from all subjects involved in the study.
Data Availability Statement
Not applicable.
Acknowledgments
The research was conducted within StratKIT project. The authors would like to thank all StratKIT leaders for their support and motivation. We would like to thank Piotr Masłowski, a president of the city of Rybnik for the constant support, Monika Kubisz—public officer from the Municipality of Rybnik for printing and distributing the surveys, headteachers and administration of primary school no. 3 and primary schools no.1, director and administration of Social Care Home in Rybnik, Katarzyna Korba from the Municipality of Rybnik and everybody who took part in the survey. We would like to thank Danuta Gajewska for the expert consultation during the development of the survey.
Conflicts of Interest
The authors declare no conflict of interest.
References
- Mbow, C.; Rosenzweig, C.; Barioni, L.; Benton, T.; Herrero, M.; Krishnapillai, M.; Liwenga, E.; Pradhan, P.; RiveraFerre, M.; Sapkota, T.; et al. Food Security. In Climate Change and Land: An IPCC Special Report on Climate Change, Desertification, Land Degradation, Sustainable Land Management, Food Security, and Greenhouse Gas Fluxes in Terrestrial Ecosystems; IPCC: Geneva, Switzerland, 2019. [Google Scholar]
- Willett, W.; Rockström, J.; Loken, B.; Springmann, M.; Lang, T.; Vermeulen, S.; Garnett, T.; Tilman, D.; DeClerck, F.; Wood, A.; et al. Food in the Anthropocene: The EAT–Lancet Commission on Healthy Diets from Sustainable Food Systems. Lancet 2019, 393, 447–492. [Google Scholar] [CrossRef] [PubMed]
- Ningrum, D.; Malekpour, S.; Raven, R.; Moallemi, E.A. Lessons Learnt from Previous Local Sustainability Efforts to Inform Local Action for the Sustainable Development Goals. Environ. Sci Policy 2022, 129, 45–55. [Google Scholar] [CrossRef]
- Glavič, P. Evolution and Current Challenges of Sustainable Consumption and Production. Sustainability 2021, 13, 9379. [Google Scholar] [CrossRef]
- UNFCCC. United Nations United Nations Framework Convention on Climate Change; UNFCC: Bonn, Germany, 1992. [Google Scholar]
- Scientific Advice Mechanism (SAM). Towards a Sustainable Food System Group of Chief Scientific Advisors Independent Expert Report; European Commission: Brussels, Belgium, 2020.
- European Commission. What Is the European Green Deal; European Commission: Brussels, Belgium, 2019.
- Boyano, A.; Espinosa, N.; Quintero, R. EU GPP Criteria for Food Procurement, Catering Services and Vending Machines; Final Technical Report; European Union: Brussels, Belgium, 2019. [Google Scholar] [CrossRef]
- UN. General Assembly 70/1. Transforming Our World: The 2030 Agenda for Sustainable Development Transforming Our World: The 2030 Agenda for Sustainable Development Preamble; UN: Manhattan, NY, USA, 2015. [Google Scholar]
- European Commission. Public Procurement. 2019. Available online: https://single-market-economy.ec.europa.eu/single-market/public-procurement_en (accessed on 28 November 2022).
- Delre, A.; la Placa, M.G.; Alfieri, F.; Faraca, G.; Kowalska, M.A.; Vidal Abarca Garrido, C.; Wolf, O.; European Commission Joint Research Centre. Assessment of the European Union Green Public Procurement Criteria for Four Product Groups; European Commission: Brussels, Belgium, 2022; ISBN 9789276460565.
- European Commission. EU GPP Criteria for Food, Catering Services and Vending Machines; European Commission: Brussels, Belgium, 2019.
- Cheng, W.; Appolloni, A.; D’Amato, A.; Zhu, Q. Green Public Procurement, Missing Concepts and Future Trends—A Critical Review. J. Clean. Prod. 2018, 176, 770–784. [Google Scholar] [CrossRef]
- European Commission. GPP, In Practice, University of Cagliari (Sardinia, Italy); European Commission: Brussels, Belgium, 2021.
- European Commission. GPP In Practice, City of Vienna (Austria); European Commission: Brussels, Belgium, 2020.
- European Commission. GPP, In Practice, City of Helsingborg (Sweden); European Commission: Brussels, Belgium, 2020.
- European Commission. GPP, In Practice, Gymnasium Plavinu Municipality (Latvia); European Commission: Brussels, Belgium, 2018.
- European Commission. GPP, In Practice, City of Ottignies-Louvain-La-Neuve (Belgium); European Commission: Brussels, Belgium, 2019.
- Public Procurement Office (Urząd Zamówień Publicznych). Sprawozdanie Prezesa Urzędu Zamówień Publicznych z Funkcjonowania Systemu Zamówień Publicznych w 2020r; Urząd Zamówień Publicznych: Warszawa, Poland, 2020.
- Council of Ministers of Poland (Rada Ministrów). Uchwała Nr 6 Rady Ministrów Wsprawie Przyjęcia Polityki Zakupowej Państwa; Council of Ministers of Poland: Warszawa, Poland, 2022.
- Ministry of Climate and Environment. Trackingowe Badania Świadmości i Zachowań Ekologicznych Mieszkańców Polski, Raport z Badania 2018; Ministry of Climate and Environment: Warsaw, Poland, 2018.
- Wierzbiński, B.; Surmacz, T.; Kuźniar, W.; Witek, L. The Role of the Ecological Awareness and the Influence on Food Preferences in Shaping Pro-Ecological Behavior of Young Consumers. Agriculture 2021, 11, 345. [Google Scholar] [CrossRef]
- IQAir. IQAir 2021 World Air Quality Report; IQAir: Goldach, Switzerland, 2021. [Google Scholar]
- Khomenko, S.; Cirach, M.; Pereira-Barboza, E.; Mueller, N.; Barrera-Gómez, J.; Rojas-Rueda, D.; de Hoogh, K.; Hoek, G.; Nieuwenhuijsen, M. Premature Mortality Due to Air Pollution in European Cities: A Health Impact Assessment. Lancet Planet Health 2021, 5, e121–e134. [Google Scholar] [CrossRef] [PubMed]
- Nawrot, T. Summary of a Research in Rybnik: Rybnik, Polnd, 5 October 2020. Available online: https://www.rybnik.eu/fileadmin/user_files/aktualnosci/2020/2020_10/Opis_badan_Tim_Nawrot.pdf (accessed on 5 September 2022).
- Ala-Karvia, U.; Góralska-Walczak, R.; Piirsalu, E.; Filippova, E.; Kazimierczak, R.; Post, A.; Monakhov, V.; Mikkola, M. COVID-19. Driven Adaptations in the Provision of School Meals in the Baltic Sea Region. Front. Sustain. Food Syst. 2022, 5, 750598. [Google Scholar] [CrossRef]
- The European Parliament. The European Parliament I (Legislative Acts) Regulations Regulation (Eu) 2016/679 of the European Parliament and of the Council of 27 April 2016 on the Protection of Natural Persons with Regard to the Processing of Personal Data and on the Free Movement of Such Data, and Repealing Directive 95/46/EC (General Data Protection Regulation); Official Journal of the European Union: Luxembourg, 2016. [Google Scholar]
- Sołtysiak, U. Polish Chamber of Organic Organic Farming and Its Market in Poland from the Perspective of 2020. Current Status and Prospects; Warsaw, Poland, 2021. [Google Scholar]
- Pawlewicz, A. Change of Price Premiums Trend for Organic Food Products: The Example of the Polish Egg Market. Agriculture 2020, 10, 35. [Google Scholar] [CrossRef]
- The Ministry of Climate and Environment (Ministerstwo Klimatu i Środowiska). Badanie Świadomości i Zachowań Ekologicznych Mieszkańców Polski, Raport z Badania Trackingowego 2020; The Ministry of Climate and Environment: Warsaw, Poland, 2020.
- Zadka, K.; Pałkowska-Go, E.; Rosołowska-Huszcz, D. The State of Knowledge about Nutrition Sources of Vitamin D, Its Role in the Human Body, and Necessity of Supplementation among Parents in Central Poland. Int. J. Environ. Res. Public Health 2018, 15, 1489. [Google Scholar] [CrossRef]
- Xiang, R.; Zhai, X.; Zhang, Q.; Wang, Z. Relationship Between Dietary Knowledge, Socioeconomic Status, and Stroke Among Adults Involved in the 2015 China Health and Nutrition Survey. Front. Nutr. 2021, 8, 728641. [Google Scholar] [CrossRef]
- Berenguer, J.; Corraliza, J.A.; Martin, R. Rural-Urban Differences in Environmental Concern, Attitudes, and Actions. Eur. J. Psychol. Assess. 2005, 21, 128–138. [Google Scholar] [CrossRef]
- Zdrojowy-Wełna, A.; Zatońska, K.; Bednarek-Tupikowska, G.; Jokiel-Rokita, A.; Kolačkov, K.; Szuba, A.; Bolanowski, M. Determinants of Obesity in Population of PURE Study from Lower Silesia. Endokrynol. Polska 2018, 69, 644–652. [Google Scholar] [CrossRef] [PubMed]
- Suliga, E.; Cieśla, E.; Michel, S.; Kaducakova, H.; Martin, T.; Śliwiński, G.; Braun, A.; Izova, M.; Lehotska, M.; Kozieł, D.; et al. Diet Quality Compared to the Nutritional Knowledge of Polish, German, and Slovakian University Students—Preliminary Research. Int. J. Environ. Res. Public Health 2020, 17, 9062. [Google Scholar] [CrossRef] [PubMed]
- Kowalak, A. Environmental Awareness and Attitudes of Farmers with Environmental Commitments. Eduk. Biol. I Sr. 2014, 1, 64–65. [Google Scholar]
- Likus, W.; Milka, D.; Bajor, G.; Jachacz-Łopata, M.; Dorzak, B. Dietary Habits and Physical Activity in Students From The Medical University of Silesia in Poland. Rocz. Państwowego Zakładu Hig. 2013, 64, 317–324. [Google Scholar]
- Schwartz, M.B.; Novak, S.A.; Fiore, S.S. The Impact of Removing Snacks of Low Nutritional Value from Middle Schools. Health Educ. Behav. 2009, 36, 999–1011. [Google Scholar] [CrossRef] [PubMed]
- Mensink, F.; Schwinghammer, S.A.; Smeets, A.; Kremers, S.P.J. The Healthy School Canteen Programme: A Promising Intervention to Make the School Food Environment Healthier. J. Environ. Public Health 2012, 2012, 415746. [Google Scholar] [CrossRef]
- Hayhoe, R.; Rechel, B.; Clark, A.B.; Gummerson, C.; Smith, S.J.L.; Welch, A.A. Cross-Sectional Associations of Schoolchildren’s Fruit and Vegetable Consumption, and Meal Choices, with Their Mental Well-Being: A Cross-Sectional Study. BMJ Nutr. Prev. Health 2021, 4, 447–462. [Google Scholar] [CrossRef]
- Morren, M.; Mol, J.M.; Blasch, J.E.; Malek, Ž. Changing Diets—Testing the Impact of Knowledge and Information Nudges on Sustainable Dietary Choices. J. Environ. Psychol. 2021, 75, 101610. [Google Scholar] [CrossRef]
- Birt, C.; Buzeti, T.; Grosso, G.; Justesen, L. Healthy and Sustainable Diets for European Countries; Report of a Working Group; EUPHA: Utrecht, The Netherlands, 2017. [Google Scholar]
- Traczyk, I.; Respondek, W.; Szostak-Wę Gierek, D.; Raciborski, F. Nutritional Knowledge and Practice Preliminary Results of the Nationally Representative Study on Nutrition of Polish Population. Proc. Nutr. Soc. 2020, 514, E514. [Google Scholar] [CrossRef]
- The Supreme Audit Office. Wdrażanie Zasad Zdrowego Żywienia W Szkołach Publicznych; The Supreme Audit Office: Cracow, Poland, 2017.
- FAO; WHO. FAO and WHO Sustainable Healthy Diets—Guiding Principles; WHO: Rome, Italy, 2019.
- Young, W.; Hwang, K.; McDonald, S.; Oates, C.J. Sustainable Consumption: Green Consumer Behaviour When Purchasing Products. Sustain. Dev. 2010, 18, 20–31. [Google Scholar] [CrossRef]
- Zakowska-Biemans, S. Polish Consumer Food Choices and Beliefs about Organic Food. Br. Food J. 2011, 113, 122–137. [Google Scholar] [CrossRef]
- Willer, H.; Trávníček, J.; Meier, C.; Schlatter, B. The World of Organic Agriculture Statistics and Emerging Trends 2022; FiBL & IFOAM—Organics International: Hachenburg, Germany, 2022. [Google Scholar]
- Wojciechowska-Solis, J.; Soroka, A. The Attitude of Polish Consumers to Organic Food. Res. Pap. Wrocław Univ. Econ. 2017, 475, 380–389. [Google Scholar] [CrossRef]
- Woś, K.; Dobrowolski, H.; Gajewska, D.; Rembiałkowska, E. Organic Food Consumption and Perception among Polish Mothers of Children under 6 Years Old. Int. J. Environ. Res. Public Health 2022, 19, 15196. [Google Scholar] [CrossRef]
- IMAS International Sp. z o.o. Organic Food in Poland; IMAS International Sp. z o.o.: Wroclaw, Poland, 2017. [Google Scholar]
- Holfelder, A.-K. Towards a Sustainable Future with Education? Sustain. Sci. 2019, 14, 943–952. [Google Scholar] [CrossRef]
- Zieliński, M.; Gąsior, M.; Jastrzębski, D.; Desperak, A.; Ziora, D. Influence of Particulate Matter Air Pollution on Exacerbation of Chronic Obstructive Pulmonary Disease Depending on Aerodynamic Diameter and the Time of Exposure in the Selected Population with Coexistent Cardiovascular Diseases. Adv. Respir. Med. 2018, 86, 227–233. [Google Scholar] [CrossRef]
- Statistic Poland. Spatial and Environmental Surveys Department Environment 2022; Statistic Poland: Warszawa, Poland, 2022.
Disclaimer/Publisher’s Note: The statements, opinions and data contained in all publications are solely those of the individual author(s) and contributor(s) and not of MDPI and/or the editor(s). MDPI and/or the editor(s) disclaim responsibility for any injury to people or property resulting from any ideas, methods, instructions or products referred to in the content. |
© 2023 by the authors. Licensee MDPI, Basel, Switzerland. This article is an open access article distributed under the terms and conditions of the Creative Commons Attribution (CC BY) license (https://creativecommons.org/licenses/by/4.0/).