Abstract
Using the data of Chinese A-share listed companies in the construction industry from 2010 to 2021, this paper conducts an empirical analysis of the green innovation mechanism of firms under the system formed by target-level elements, resource-level elements, and network-level elements. By using a fixed-effect model, coupling mechanism analysis and heterogeneity testing, we find that: (1) Government environmental targets and enterprise environmental targets as the target-level elements simultaneously promote enterprise green innovation, and there is a lag in this promotion effect. The mechanism analysis shows that the target-level elements will promote green innovation through government subsidies and enterprise R&D resources as the resource-level elements, while the political networks and the enterprise networks as the network-level elements can optimize the allocation of resources and promote innovation. (2) On the basis of a “target-resource-network” coupling coordination mechanism, the study reveals that the Chinese construction enterprises are currently slightly dysfunctional when it comes to the coupling of environmental targets, resource input, and relationship networks, which leads to a low level of green innovation in the construction industry as a whole. (3) Based on heterogeneity analysis, it is found that the internal characteristics of enterprises, regional differences, and policy changes all affect the relationship between the government’s environmental targets, enterprises’ environmental targets, and enterprises’ green innovation.
1. Introduction
As one of the three major areas of energy consumption, the construction industry has large carbon emissions. According to the Research Report on China Building Energy Consumption (2021), the total carbon emissions from the construction industry in China accounted for 50.6% of the country’s total carbon emissions in 2019. Therefore, it is clear that emission reduction of the construction industry is particularly important for achieving carbon peaking and carbon neutrality targets. However, construction enterprises belong to traditional industries and are relatively slow to update green technologies compared to new industries, which has led to a low level of attention to construction enterprises in related research [1]. Although the green innovation efficiency of construction enterprises is generally improving, their production frontier and technology conversion rate have failed to develop in parallel. The production technology conversion rate of enterprises is still at a low level, and the green innovation efficiency among enterprises is polarized [2]. In the report of the 20th National Congress of the Communist Party of China, it is proposed that “we should accelerate the green transformation of the development mode, implement the comprehensive conservation strategy, develop green and low-carbon industries, advocate green consumption, and promote the formation of a green and low-carbon mode of production and lifestyle” [3]. The production and operation of construction enterprises are closely related to people’s production and life, occupying an important position in promoting a low-carbon economy. In order to solve the contradiction between the large carbon emissions of construction enterprises and the urgent need to conduct green transformation at the stage of high-quality development, the formation mechanism of green innovation in construction enterprises should be thoroughly revealed. Exploring the complete chain and empirical rules of green innovation carried out by construction enterprises is conducive to improving the efficiency of green innovation of enterprises.
The Statistical Monitoring Report on the Innovation Capacity of Chinese Firms 2020 reveals that the existing innovation of Chinese enterprises is typically characterized by weak fundamental research, solitary funding channels, and low efficiency in the transfer and industrialization of results [4]. These problems are particularly acute in China’s construction industry businesses, where companies place emphasis on establishment at the expense of management. This is essentially reflected in the following three aspects: First, the lack of motivation in driving enterprises to encourage green innovation. Most enterprises are unwilling to invest in risky and costly green innovation, despite the fact that both the government’s target-driven effect and companies’ own strategic targets push the companies to undertake green innovations. Second, the utilization rate of resource input is not high. The government’s policy support system has failed to support enterprise innovation in a timely and effective manner, and financial support has not been accurate and sufficient to support enterprises’ basic research and innovation. However, the efficient use of resources is the only way to change the traditional production and consumption mode and break the bottleneck of energy, resources, and environment [5]. Third, the innovation network of the industry is incomplete and poorly connected, with a low level of technological innovation cooperation, and a lack of ”linkage” between the various implementing agents. However, the interaction between industries and the complementarity of heterogeneous knowledge is of great significance to the overall improvement of innovation efficiency [6].
Enterprise green innovation is a complex technical process. Therefore, it is difficult to break through the multiple dilemmas in this process if we only address the problems at a single level of targets, resources, and networks, or merely focus on one of the factors. In other words, the overall consideration of target design, resource input and relationship networks are conducive to the integration of enterprise green innovation and allow for better alignment with national policies and market competition. This paper builds a “target-resource-network” system to analyze the systemic influences on green innovation in a complex internal and external environment, and thus reveals an efficient path for enterprises to conduct green innovation. The marginal contribution of this paper lies in: (1) This study integrates the target setting, resource input, and network relationship of the government and enterprises in green innovation into the same theoretical and empirical analysis framework of enterprise green innovation. Through the fixed effect model, the main role of target-level elements in green innovation and the intermediary role of resource-level elements in target-level elements and green innovation are investigated. Moreover, with the same model, this paper systematically examines the multi-level impact of enterprise green innovation in the policy and organizational context, and uncovers the complete mechanism of enterprise green innovation, thereby providing a holistic idea for the enterprise green innovation practice and a reference for building a green innovation system between the government and enterprises. (2) By building the coupling coordination model of a “target-resource-network” system, it is found that the low efficiency of green innovation and the large gap between enterprises in the construction industry are related to the mild dysfunction of the coupling of the “target-resource-network” system, which provides new theoretical analysis and empirical evidence to explain the problems of green innovation in enterprises.
2. Literature and Theoretical Hypotheses
China’s economic system reform in the new era has consistently boosted the direction and control of the national regulatory system and implemented policies helpful to supporting the low-carbon development of traditional industries [7], which has fundamentally influenced the green innovation practices of Chinese enterprises. Based on the institutional theory, researchers have examined how government regulation affects the green innovation of enterprises [8]. While some studies have quantified local government’s environmental targets to examine the mechanisms of policy effects on enterprise’s green innovation [9]. These studies show that the government policy as an external driving force is essential for the green innovation of enterprises. However, very few studies have examined how enterprises’ internal environmental awareness influences green innovation, and even fewer studies have been able to bring together government’s environmental targets and corporate environmental targets to explore the green innovation mechanisms of enterprises. After all, both government involvement and enterprises’ participation are essential for company innovation in the Chinese context. In addition to studying the role of environmental objectives in driving the green innovation of enterprises, stable resource input as a necessary condition for promoting green innovation has also received much attention in relevant studies. Considering the level of resource input, we mainly concern the impact of capital investment. The first is to consider the input of enterprises themselves, and more studies have proved that the innovation resource input of enterprises plays an intermediary role in green innovation [10,11]; the second is to take into account government subsidies [12]. It is difficult for enterprises to implement green innovation if resource inputs are excluded from motivation; conversely, it is also difficult to make green innovation if it only focuses on resource input without delving into the policy targets and strategic targets as motivation. However, the mechanism of resource allocation based on a target-driven manner to stimulate green innovation of enterprises is still not clear, and few studies have seen changes in the resource input of governments and businesses on a target-driven basis. Meanwhile, Chinese enterprises are grounded in a strong relationship culture, and it might be challenging for them to innovate in a sustainable way without being influenced by external relationships. Enterprises can acquire diverse resources from the aid of reciprocal partnerships [1]. In conclusion, although some researchers have recognized the significance of environmental target, resource input, and relationship networks in green innovation, they have not thoroughly uncovered the mechanisms underlying these three layers of components.
2.1. Government and Enterprise Target Driving and Enterprise Green Innovation
Green innovation differs from traditional innovation in that it takes on an environmental responsibility while balancing economic benefits, which makes it require a greater drive to put it into practice. Studies have shown that corporate decision-making [13,14], capabilities [10,15], performance [16], and efficiency [2,17] will drive green innovation. Through further about the sources of these drivers, it is easy to see that they are closely related to whether environmental protection targets are included in the corporate strategy. Similarly, it is the emphasis on achieving environmental targets in government governance that has led to a series of behaviors, such as government behavior choices [18] and environmental regulation [8], to promote corporate green innovation. From an external perspective, existing research primarily views government environmental policies as command-driven and target-oriented, mainly expressed in the form of environmental regulation, and studies demonstrate that enterprises’ low-carbon innovation, subject to environmental regulation, is enhanced [19]. In addition, based on the Chinese context, some scholars have paid attention to the overall and systematic impact of government planning on green innovation in enterprises, discussing the impact of local government actions [18], environmental decentralization, and political competition on enterprises’ green technology innovation [20], which reflect the top-level design of the government in achieving green development. Although these external factors reflect the government’s concern for enterprises to achieve green innovation, they cannot fully represent the government’s environmental targets. The relationship between the intensity of government’s environmental targets and enterprises’ green innovation has not been directly reflected. In addition, enterprise is the main body of green innovation which is mainly achieved through energy conservation and emission reduction. Therefore, many studies have found that enterprises’ green innovation strategies can significantly improve the efficiency of green innovation by organizing part of the mediating role of green learning [21]. In addition, it has also been found that increasing the ambition of the enterprises’ environmental targets can improve both economic benefits and environmental performance to a certain extent [22]. Based on the above analysis, the current research has shown that environmental targets under government planning and an enterprise strategy regulate the development of green innovation, but few studies have linked the two. Since 2012, China’s green development has upgraded by combining government administrative instructions with market-based methods [23]. China has adopted a new system for mobilizing the resources nationwide to achieve breakthroughs in core technologies, and advocates the integration of government, market, and society as a whole [24]. In this context, there is a realization of the target of “double carbon”, which means that enterprise green innovation is affected by both government’s environmental targets and enterprises’ environmental targets. Therefore, when analyzing the formation mechanism of green innovation in enterprises, both elements should be included at the target level to consider the driving effect of environmental targets.
Therefore, this paper puts forward:
Hypothesis 1a.
The target level, constructed by both the government environmental targets and the enterprise environmental targets, will have a positive impact on the green innovation of enterprises.
Considering that there is a certain cumulative effect and time lag between the sinking of environmental protection targets and the implementation of green innovation, this paper further puts forward:
Hypothesis 1b.
There is a lagging effect of the target-level elements on the impact of enterprise green innovation.
2.2. Resource Input and Enterprise Green Innovation
As China strives to achieve target carbon neutrality by 2060, national policies have focused more on environmental governance, resulting in a shift in the allocation of policy resources, market resources, and social resources toward green innovation. However, it is impossible for any firm alone to take green innovation initiatives due to the high risks and costs of green R&D [25]. It can be seen that not only is the awareness of setting environmental targets necessary for the government and enterprises, but also that resources are invested from within and from the external. From a policy-oriented perspective, scholars analyzed the positive effect of government subsidies which actively regulate internal control on green innovation [26]; in other words, government subsidies for retailers and manufacturers can ease the pressure of increased production costs brought about by green innovation, and then improve the level of green innovation [27]. Taking China’s construction enterprises as an example: scholars have found that direct government investment has the greatest impact on the green technology innovation behavior of enterprises [1]. The above research results show that the subsidies invested by the government for enterprises can effectively promote green innovation, and the government’s subsidies essentially originate from the policy targets of environmental protection. At the same time, with the policy targets of environmental protection, enterprises are willing to increase their R&D investment in technological innovation [28] so that the enterprise green innovation can achieve results faster.
Therefore, this paper makes the following assumptions:
Hypothesis 2a.
Government subsidies promote the firm’s green innovation, and the government’s environmental targets promote the green innovation of enterprises by increasing government subsidies.
Hypothesis 2b.
R&D resources of enterprises promote the firm’s green innovation, and the government’s environmental targets promote green innovation through the increase of R&D resources of enterprises.
From the micro perspective, the research found that the R&D investment covering both personnel and funds is closely related to the green innovation of enterprises [29]. Hamamoto found that R&D input based on “compensation effect” and “induced effect” has obvious positive effects on green innovation efficiency [30]. Combined with the above analysis, it can be further inferred that after the enhancement of enterprises’ environmental targets, enterprises will have greater enthusiasm to apply for government subsidies, and they will increase investment to achieve green innovation.
Therefore, this paper makes the following assumptions:
Hypothesis 2c.
Enterprises’ environmental targets promote green innovation by obtaining government subsidized resources.
Hypothesis 2d.
Enterprises’ environmental targets promote green innovation by increasing corporate R&D resources.
2.3. Interaction of Network Relationships and Target-Driven and Resource Input
The theoretical premise of green development is the symbiosis of economic, natural, and social systems, which also determines the complex interaction between systems [31]. When targets are set and resources are matched, enterprises need to link up with various relationship networks to give full play to resources and complete the target of green innovation. As a result, the construction and evolution of enterprise innovation networks can effectively promote breakthroughs in key core technologies [32]. The main relationship networks of enterprises in production and operation include the government relationship networks and the relationship networks with other enterprises. Therefore, the network relationship of joint innovation in green innovation between enterprises is particularly important. Cooperation between different enterprises, and between enterprises and universities, can effectively condense external network resources and increase the stock of knowledge resources and organizational resources [32], which means adding more elements of green innovation to the resources that enterprises already have. In addition to reciprocal partnership in the market, the association between enterprises and the government also plays an important role in the green innovation of enterprises. Enterprises connected with the government are more likely to obtain the corresponding policy preferences and financial support [33]. When enterprises have a strong target of green and environmental development, it is bound to accumulate subsidies from the government for green innovation with the help of political relationship networks.
Therefore, this paper makes the following assumptions:
Hypothesis 3a.
The closer the joint networks of enterprise innovation, the more it will strengthen the positive correlation between government subsidies and enterprise green innovation.
Hypothesis 3b.
The closer the joint networks of enterprise innovation, the more it will strengthen the positive correlation between enterprise R&D resources and enterprise green innovation.
Hypothesis 3c.
The closer the political networks, the more it will strengthen the positive correlation between corporate environmental targets and corporate green innovation.
2.4. The “Target-Resource-Network” System
From the perspective of systems thinking, sustainable development should have a high degree of coordination effect in terms of scientific mechanism, target indicators, and response measures [25]. To a certain extent, the establishment of target indicators requires the coordination of corresponding resources to promote green innovation. Meanwhile, it is necessary to take the social network relationship into account that innovation is not something that can be achieved only by enterprises [27]. With the consideration of targets, resources, and networks synchronously, green innovation forms a logical innovation chain. Clear government environmental targets help companies value green innovation. Forward-looking companies also set their own environmental targets to ensure sustainability. In order to achieve the environmental targets required by the government and the green innovation targets required by their own development, enterprises need to implement the targets with the help of government subsidies and enterprise innovation investment [27,28]. They are actively or passively mobilizing their networks to accelerate green innovation at the same time [32,33]. In summary, it can be seen that the targets are prerequisite for green innovation. Second, resources are necessary conditions for realizing green innovation for enterprises. In addition, network relationships may bring some invisible convenience to enterprise green innovation.
3. Methods and Indicators
3.1. Sample Selection and Data Sources
The sample range of this paper is the micro data of listed companies in China A-share construction industry and macro data at the national level from 2010 to 2021. The samples of ST stocks and *ST stocks and companies with seriously missing data were excluded on the basis of the original data, and a 1% tail shrinkage is done for continuous variables to finally filter to 886 samples.
3.2. Variable Definition and Indicator Construction
- (1)
- Dependent Variable: green innovation. In this paper, we select the green patent applications of listed construction companies to measure the green innovation level of enterprises, which is expressed by Green. Compared with authorized data, green patent application data have the advantage of timeliness and stability, and are less affected by external factors such as the testing process and political intervention [34], which is more accurate in reflecting the green innovation level of enterprises. This paper selects the green invention and green new utility patent application data because the WIPO green patent list does not include the appearance design patent [9]. All kinds of patent application data are obtained from the CNRDS platform, and given that the number of patent applications of some enterprises in some years is 0— refer to Li Xuesong et al. (2022)—the dependent variable is constructed by adding 1 and taking the logarithm to the corresponding data [35].
- (2)
- Independent variable: target-level indicators. The target proposed in this paper refers to the expectation of the internal and external environment of enterprises to achieve green development. For the treatment of this abstract element of the target level, this paper decomposes it into the government’s environmental targets and the enterprises’ environmental targets from the macro and micro perspectives, which are expressed by Tar1 and Tar2, respectively. According to Zhang G et al. (2022) [36], a machine learning algorithm was applied to evaluate the policy intensity. Compared with the pollutant emission data or policy quantity, the data results obtained by this method can effectively reduce the endogenous problems and represent the actual intensity of China’s environmental policies. The government’s environmental targets data for 2010–2019 were derived from the policy strength scores of the learning-based model provided by Zhang G et al. (2022). The data for 2020 and 2021 were also processed with the same methods provided by the scholars, and will not be repeated here. Finally, the data were standardized and used as the government’s environmental target index.
Enterprises’ environmental targets draw on the treatment method of Zhao Chenyu et al. (2021), and the enterprises’ environmental targets index was constructed based on the annual report of listed companies in the construction industry. The textual analysis method and expert evaluation method are used to construct it [35,37]. The specific steps are as follows: ① Based on literature research and related policy documents, 23 high-frequency words were manually screened out, such as low carbon, emission reduction, circular economy, ecology, and greening, which can best reflect the enterprises’ attention to environmental protection and green development, covering three dimensions of manufacturing, business philosophy, and strategic transformation. ② Python was used to extract the occurrence frequency of the above high-frequency words in the annual report of listed companies, and the entropy value method was applied to construct the enterprises’ environmental target index (target1-text). ③ The degree of environmental protection concern of enterprises was divided into 7 levels: namely, no environmental protection concerns, involving some environmental concerns, repeatedly mentioning environmental protection issues, stressing environmental protection concepts, clarifying environmental targets, emphasizing environmental targets, and advocating the implementation of clean production. The scoring was from 0–3, with an interval of 0.5 per gear. ④ Based on the production and operation situation in the annual report, experts scored each enterprise’s environmental concerns reflected in the annual report according to the above 7 levels, forming the enterprise environmental target index (Target1-score) under the expert evaluation method. ⑤ The above two indices (Target1-text and Target1-score) were standardized, and these two indicators were synthesized into the enterprises’ environmental targets index with a weight of 50%.
- (3)
- Mediation variable: resource-level indicators. The resources proposed in this paper refer to the investment of enterprises themselves and the investment of the government in green innovation and environmental protection governance, so the resource level includes government subsidies and enterprise research and development resources, which are expressed in Res1 and Res2, respectively. Regarding the measurement of indicators in the resource level, since it is difficult to separate green R&D personnel from traditional R&D personnel, and statistics for green innovation personnel and green R&D funding are not yet available in the current statistics [6], the two indicators of the resource level are constructed by adding one to the logarithm of both enterprise R&D investment and government subsidies, and the data are obtained from the CNRDS platform.
- (4)
- Adjustment variables: network-level indicators. The network proposed in this paper refers to the density of joint innovation between enterprises and other enterprises or universities and the degree of association between enterprises and the government. Therefore, the network level includes political networks and the joint networks of enterprise innovation, expressed in Net1 and Net2, respectively. The density of the joint networks of enterprise innovation is measured by logarithm of the number of enterprise joint patent applications add 1, with the data obtained from China National Intellectual Property Administration. The networks of business–government associations sets the ranking variables in terms of the nature of the enterprise and the degree of political association of the executives (the value for section-level cadres is 1, the value for division-level cadres is 2, the value for department-level cadres is 3, the value for ministerial-level cadres is 4, and the value for non-political affiliation is 0; the value for state-owned enterprises is 1, and the value for non-state-owned enterprises is 0. For example, if the senior executive of an enterprise is a ministerial-level cadre and the enterprise is a state-owned enterprise, the value is 5). The employment information of enterprise executives mainly comes from CSMAR, and the missing values are manually filled through websites such as Oriental Fortune and other websites.
- (5)
- Control variables. The practice of drawing on relevant literature mainly includes the following control variables: enterprise age (FirmAge), which is the logarithm of the current year minus the year of incorporation plus one; cash flow levels (Cashflow), which is the net cash flow from operating activities divided by total assets; independent director ratio (Indep), which is the number of independent directors divided by the number of directors; whether loss (Loss), if the net profit of the year is less than 0 take 1, otherwise take 0; and equity concentration (Top1), which is the ratio of the number of shares held by the largest shareholder to the total number of shares. The data are obtained from the Cathay Security Database (CSMAR). In addition, this article also controls the year dummy variable and the province dummy variable.
3.3. Model Building
The target is based on the results of the Hausman test, and we chose a fixed-effect model with good robustness to verify the major impact of target-level elements [38]. This paper refers to the practices of Liu Zhiming (2022) [9] and others to construct the following model:
where i and t represent the listed company and year, respectively, and εi,t are the residual terms. Model (1) is used to measure the impact of government’s environmental targets and enterprises’ environmental targets on enterprise green innovation at the target level. Considering that there may be a time lag between target sinking and green innovation results, this paper further constructs Models (2) and (3) to measure the impact of the government’s environmental targets and enterprises’ environmental targets on enterprise green innovation.
4. Empirical Analysis
4.1. Descriptive Statistics
Table 1 shows the descriptive statistical results of the main variables. The wide difference in the number of green patent applications among listed companies in the construction industry indicates that there is a certain gap in the green innovation level of enterprises. Compared with enterprises’ environmental targets, the fluctuation of government’s environmental targets is relatively mild, and the standard deviation between the government subsidies and the enterprise R&D resources in the resource level is large, indicating that there is a large difference in the R&D investment of listed companies in the construction industry. The average value of the political networks and the joint networks of enterprise innovation at the network level is small, indicating that the construction companies do not have a close cooperative network.

Table 1.
Descriptive statistics for major variables.
4.2. Target-Level Elements and Enterprise Green Innovation
The relationship between government’s environmental targets, enterprises’ environmental targets and enterprise green innovation in the target level was examined by adding control variables and controlling for the year and province. Table 2 displays the results of the regression. Both government’s environmental targets and enterprises’ environmental targets have a significant positive effect on promoting green innovation. After adding control variables, the government’s environmental targets have a more pronounced beneficial influence on fostering enterprise green innovation. This suggests that strict environmental targets will motivate enterprises to conduct more innovative activities, which confirms the Porter hypothesis on the relationship between environmental regulation and technological innovation [39]. In the column (3) and (4) of Table 2, when the government’s environmental targets and enterprises’ environmental targets are lagged by one phase, it is found that the two indicators of the target level are still significant. However, the coefficients all decrease, indicating that the impact of the target intensity on the green innovation of enterprises has a time lag, but the effect will be weakened. The Hypothesis 1a and 1b are proved.
Table 2.
Examination of the relationship between government’s environmental targets, enterprises’ environmental targets, and enterprise green innovation.
4.3. Robustness Test
4.3.1. Replace the Measurement Model
This paper uses the number of green patent applications to measure the green innovation of enterprises, which has a left-hand-side constrained feature that may lead to biased results of the regression using a fixed-effect model. Therefore, this paper draws on Liu Zhiming et al. (2022) and uses the Tobit model to re-estimate the results [9]. The regression results are shown in Table 3. The government and enterprises’ environmental targets at the target level still have a significant positive impact on the green innovation of enterprises, which is consistent with the previous conclusion.
Table 3.
Robustness test.
4.3.2. Replacement of Variable Measurement Method
To further verify the robustness of the conclusions, this paper replaced the measurement indicators of the explained variables. Among them, the green innovation of enterprises is measured separately by the number of green inventions applied by the company in the current year plus 1 to take the logarithm (Green1), as well as the number of green utility models applied by the enterprise in that year plus 1 to take the logarithm (Green2). The results are consistent with the previous conclusion.
4.3.3. Endogenous Testing
The fixed-effect model adopted in this paper can alleviate the endogenous problem caused by missing variables to a certain extent. However, the level of green innovation of enterprises may conversely affect the government and enterprises to pay attention to environmental targets. Referring to the approach of Zhou Zejiang et al. (2018), we lagged the independent variables by one period to alleviate the endogenous problem of mutual causation that may exist in this model [40]. The results show that the coefficients of Tar1 and Tar2 in the lagging period are still significant, indicating that the positive effect of target-level elements on enterprise green innovation still exists after controlling the endogenous relationship of mutual causation.
5. Further Analysis
5.1. The Mediating Effect of Resource-Level Elements in the Relationship between Target-Level Elements and Enterprise Green Innovation
Environmental targets for governments and enterprises have an impact on the green innovation of enterprises [18,20,21]. At the same time, the investment of the government and enterprises is also related to the green innovation of enterprises [27,28]. Furthermore, from target setting to the realization of green innovation, certain resources are required. Therefore, this paper attempts to test whether the target-level elements can promote enterprise green innovation through the increase of government and enterprise resource input in the resource level, so the following model is set:
In the model, M represents the intermediary variable, government subsidy resource (Res1), enterprise R & D resource (Res2), and controlled variable (CV) is the same as above. Columns (1) and (2) in Table 4 report that the enhancement of government environmental target reduces government-subsidized resources, and when government subsidies are used as an intermediary variable, the government’s environmental targets have a positive effect on the green innovation of enterprises, which illustrates that Hypothesis 2a is partially true. It demonstrates that as the government’s attention on environmental protection improves, it is more likely to encourage enterprises to invest actively in promoting green innovation rather than relying on government subsidies. Column (3) and (4) report that the enhanced awareness of enterprises’ environmental targets will help enterprises to obtain more government subsidies and thus promote green innovation, indicating that the government is more willing to allocate resources to enterprises with strong environmental targets. Hypothesis 2c is proved. Columns (5) to (8) show that stronger government environmental targets and greater awareness of enterprises’ environmental targets encourage enterprises to invest more in R&D resources, which in turn help enterprises to achieve their environmental targets. Hypotheses 2b and 2d are proved.
Table 4.
Mediation effect test.
5.2. Moderating Effect of Network-Level Elements in the Relationship between Target-Level Elements and Enterprise Green Innovation
After clarifying the causal mechanism between the target-level and the resource-level elements in enterprise green innovation, Models (8)–(12) further analyze the modulating effect of the political networks and the joint networks of enterprise innovation in realizing the enterprise green innovation mechanism. Table 5 reports the mechanism of action of the network-level elements in each of the five pathways. The adjustment effect of the joint networks of enterprise innovation on the relationship between government subsidies and enterprise green innovation in Models (8) and (10) is verified in columns (1) and (3) of Table 5. The coefficients of the interaction terms between the joint networks of enterprise innovation and the government subsidies were significantly positive when the regression equation included the government’s environmental targets and the enterprises’ environmental targets, respectively. This shows that after the government’s environmental targets reduces subsidy resources, the government subsidies can rely on a stronger enterprise innovation network to further promote enterprise innovation, while the increased government subsidies available to enterprises with enhanced environmental targets are more conducive to the green innovation of enterprises in the case of a closer joint networks of enterprise innovation. In Model (12), the moderating effect of the joint networks of enterprise innovation on the relationship between enterprise R&D resources and enterprise green innovation is verified in column (5) of Table 5. The interaction coefficient between the joint networks of enterprise innovation and enterprise R&D resources is significantly positive, which indicates that with a closer joint network, it is more favorable to green innovation for enterprises to enhance their environmental protection targets and invest more in R&D resources. Hypotheses 3a and 3b are proved. In Models (9) and (11), the moderating effect of the political networks on the relationship between enterprises’ environmental targets and enterprise green innovation is verified in columns (2) and (4) of Table 5. The interaction term coefficient between political networks and enterprises’ environmental targets is significantly positive, which shows that with strong political networks, enterprises’ environmental targets can effectively promote green innovation either by obtaining more government subsidies or investing more R&D resources. Hypothesis 3c,d is proved. By examining the moderating effects of joint corporate innovation networks and political relationship networks, it is shown that in the political context of China, political connection will tilt the government’s incentive policies and green innovation resources to the familiar enterprises, which brings an invisible competitive advantage for enterprises to carry out green innovation. In the Chinese organizational scenario, joint networks of enterprise innovation can reduce the R&D barriers between enterprises and effectively alleviate the input–reward mismatch in the process of green innovation [41], which stimulates the green innovation of enterprises and boosts their green innovation capabilities at the same time.
Table 5.
Tests of moderating effects.
5.3. Analysis of the Coupling Mechanism
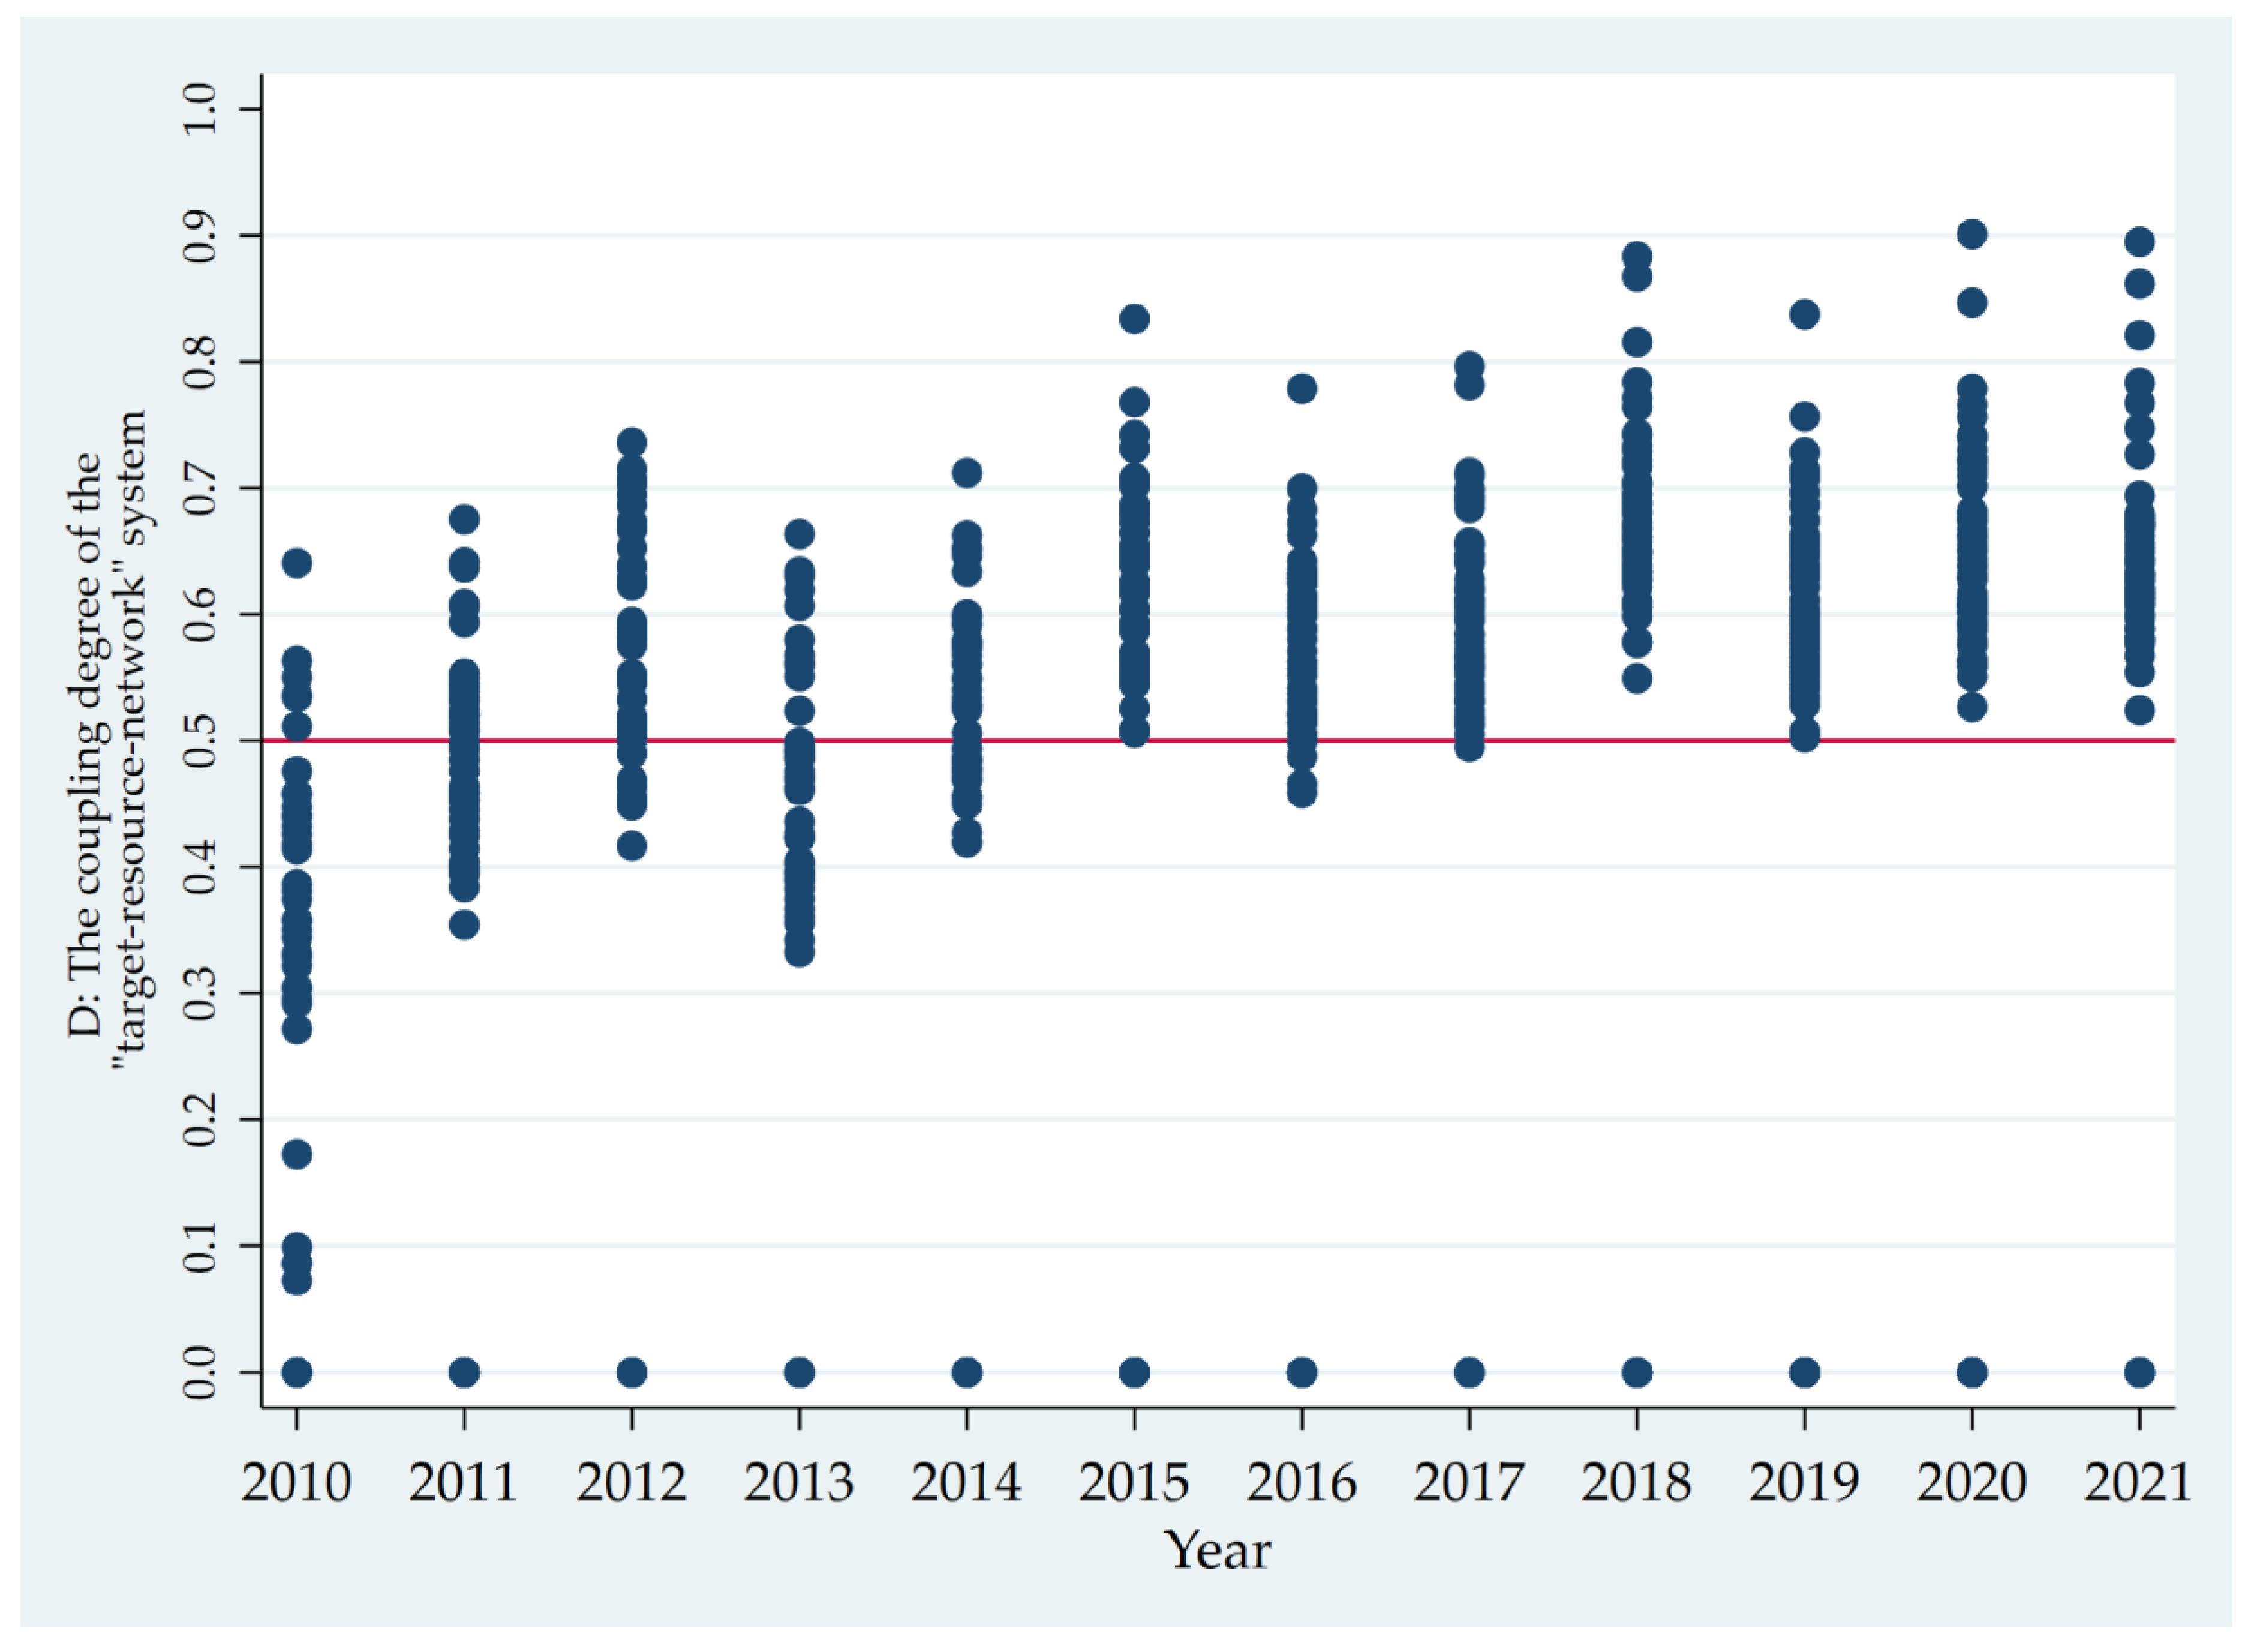
In order to further analyze the influence mechanism of the overall system of targets, resources, and networks on enterprise green innovation, this paper further constructs a coupling coordination model of “target-resource-network”. Coupling coordination models is mainly used to directly reflect the degree of coordinated development between things, and can quantitatively reflect the coupling coordination between elements [42]. Referring to the method of Wang Zhaohua et al. (2022), the steps to construct the coupled coordination models of “targets-resources-networks” are as follows: ① The extreme difference standardization method is adopted for the government’s environmental targets and the enterprise environmental target in the target level. The mean value of the two newly obtained values is the score of the target level, which is expressed by μ1i,t. The data of resource level and network level are processed in the same steps to get the resource-level score μ2i,t and the network-level score μ3i,t. ② Calculate the comprehensive score of μ1i,t, μ2i,t, and μ3i,t and the result is represented by Ci,t. ③ Ti,t represents the comprehensive coordination index of the three subsystems of the target level, resource level, and network level. Fixed-effects model tests are performed for Green, μ1i,t, μ2i,t, and μ3i,t (with controlled variables added, year and province fixed). Then, the model shows that the coefficients of μ1i,t, μ2i,t, and μ3i,t are 4.2424, 2.3104, and 1.4093, respectively (the three coefficients are significant at the statistical level of 1%), which shows that the three subsystems have different effects on enterprise green innovation. λ, β, and χ indicate their importance. According to the proportion of regression coefficients, λ is assigned to 0.5328, β is assigned to 0.2902, and χ is assigned to 0.1770. ④ Finally, coupling degree Di, t of the “target-resource-network” system is obtained, according to Ci,t, Ti,t. The specific calculation formula from (13)–(15) is:
Figure 1 reports the evolution of the coupling degree of the “target-resource-network” system of listed companies in the construction industry from 2010 to 2021. In general, the coupling degree develops from extreme disorder to high coupling. Since 2015, most enterprises have been in the coordination of the “target-resource-network” system, but the average coupling coordination degree of enterprises over the years is in the state of dissonance (see Table 6), which is caused by the wide disparity in coupling coordination levels between enterprises. For instance, in 2020 and 2021, more than 30% of enterprises had severely imbalanced “target-resource-network” systems, while all other enterprises—aside from those with extremely dysfunctional systems—were in a good coupling state, indicating a polarization tendency.
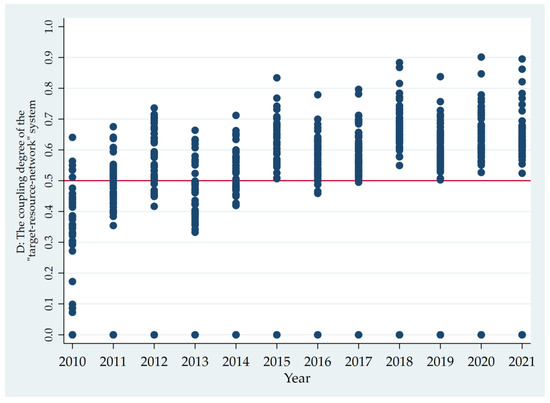
Figure 1.
Target-resource-network coupling test results. Note: Coupling coordination Di,t is extremely out of balance between 0–0.09 (denoted by D−−−−−), severe dysregulation between 0.1–0.19 (denoted by D−−−−), moderate dysregulation between 0.2–0.29 (denoted by D−−−), mild dysregulation between 0.3–0.39 (denoted by D−−), borderline dysregulation between 0.4–0.49 (denoted by D−), barely coupling between 0.5–0.59 (denoted by D), primary coupling between 0.6–0.69 (denoted by D+), moderate coupling between 0.7–0.79 (denoted by D++), highly coupling between 0.8–0.89 (denoted by D+++), and excellent coupling between 0.9–1.0 (denoted by D++++) [43]. Furthermore, “−” indicates an imbalance, and more numbers of the “−” indicates a greater imbalance. “+” means coupling, and more numbers of the “+” means better coupling.
Table 6.
Average level of “target-resource-network” coupling of enterprises by region.
Table 6 reports the coupling degree of the “target-resource-network” system for listed construction companies in the seven major regions in China from 2010 to 2021. The values in the table are the mean value of the coupling degree Di,t for all enterprises in the region in a certain year. Enterprises in south China have a high frequency of coupling degree with a value of 0, and the gap between enterprises is obvious, leading to a moderate imbalance of the overall coupling degree in this region. The phenomenon is related to the strong growth of state-owned enterprises in China’s construction industry and the slowdown in the development of private enterprises. National policies and resources provide advantages for promoting the green development of state-owned enterprises. At the same time the rapid growth of state-owned enterprises has made them occupy more and more markets, and their leading position in the industry is increasing, which makes them more capable to coordinate and allocate environmental targets, resource input, and network relationships. In contrast, private enterprises are prone to “let things slip”. The absence of any part in the target, resource, and network relationship will greatly reduce the efficiency of green innovation. The same problem exists in the east, north-east, and south-west regions of China, but the gap among enterprises is not as obvious as in south China. This mild imbalance suggests that the “target-resource-network” system of enterprises is not well coordinated, which will negatively affect the efficiency of green innovation. The “target-resource-network” system of enterprises in central China, north-west China, and north China are relatively well coordinated, and in some years, they are almost coupled or initially coupled but have not yet formed a stable coupling pattern. As a result, it is on the verge of dysfunction.
5.4. Analysis of Heterogeneity
5.4.1. Considering Enterprise’s Own Characteristics
Considering the heterogeneity of enterprise property rights, group regression was carried out for enterprises with different property rights. Private enterprises have the advantage of higher productivity, while state-owned enterprises have more resources needed for innovation activities, providing more high-tech value products for the market [44]. The regression results in Table 7 show that the government’s environmental targets have a greater impact on the green innovation of state-owned enterprises, while the impact on that of non-state-owned enterprises is not significant, indicating that the green innovation of state-owned enterprises is closely aligned with the national environmental policy. National policies have a greater impact on the innovation of state-owned enterprises. Since the environmental targets are included in the performance ratings of the executives in state-owned enterprises, state-owned enterprises are more motivated to green innovation when government environmental targets are stronger [45]. Considering that the characteristics of managers themselves may also have a certain impact on corporate green innovation, group regression was made according to the difference in the age of managers and the proportion of women in management. The regression results in Table 7 show that enterprises with older managers are more capable of implementing green innovation targets more effectively. Enterprises with more female managers are better at implementing government environmental targets and corporate environmental targets of green innovations, suggesting that female managers in the executive team are more conducive to achieving green innovation [46] and facilitating the implementation of corporate green innovation targets.
Table 7.
Heterogeneity tests that distinguish the nature of enterprise ownership, the age of managers, and the proportion of women in management.
5.4.2. Considering the External Innovation Environment of Enterprises
There are obvious differences in the level of economic development among the eastern, central, and western regions of China, and there are geographical disparities in the response and attention to government policies. In addition, given China’s management system, the disparities in policy support and government regulation style between high- and low-innovation cities will also have different effect on the green innovation. Table 8 reports the impact of regional heterogeneity on government environmental targets and enterprises’ environmental targets on the green innovation of local enterprises. The results find that the government’s environmental targets have a statistically significant effect on green innovation of enterprises in the eastern region, while the influence on enterprise in the central and western regions is not statistically significant, indicating that enterprises in the eastern region are more affected by government policies. However, in the central and western regions, the green innovation of enterprises is only significantly and positively influenced when the environmental targets of enterprises are clear. Similarly, high-innovation cities are mainly located in the east, and these cities have more strength to balance economic and ecological benefits. As a result, they tend to synchronize with national environmental targets in terms of enterprise green innovation, and the enterprises themselves also have a strong environmental awareness. However, the green innovation of enterprises in low-innovation cities is not statistically affected by the target factors. In general, cities with abundant innovation resources have more established internal innovation networks, which bring policy support and resource advantages to the enterprises in the region and gives them greater strength and drive to meet the nation’s environmental targets.
Table 8.
Tests for heterogeneity by region.
5.4.3. Considering the Policy Context of Green Innovation
In 2015, the Fifth Plenary Session of the 18th CPC Central Committee included green development and ecological civilization in the development target for the first time. Based on this change in policy context, the group return of the green innovation stage of enterprises with 2015 as the time division point was carried out. Before 2015, although China had taken the development of green economy as a policy of governance, China’s environmental policies had not played a greater role in promoting green innovation for enterprises, due to the international environment and enterprises’ internal environment. The green innovation results of enterprises mainly come from their own resource investment in research and development. After 2015, the positive promotion of the government’s environmental targets on enterprise green innovation increased from 0.2995 to 0.8691 (Table 9), and the positive promotion of enterprise environmental targets on enterprise green innovation increased from 0.0358 to 0.2624 (Table 9), indicating that, under the guidance of national policies for many years, enterprises’ own awareness of green environmental innovation has gradually increased, and is gradually reflected in the results.
Table 9.
Tests for heterogeneity by time period.
6. Conclusions and Implications
6.1. Conclusions
The main conclusions are summarized as follows: (1) The government’s environmental targets and the enterprises’ environmental targets in the target level have a significant positive effect on promoting the green innovation of enterprises, and there is a certain lag in this promotion effect. (2) The government’s environmental targets will promote green innovation of enterprises by reducing government subsidy resources and increasing enterprise R&D resources. Enterprises’ environmental targets can promote the green innovation of enterprises by obtaining government subsidies and increasing investment in research and development resources. (3) When the political networks and the joint networks of enterprise innovation are closer, the positive effect of enterprises’ environmental targets on green innovation is more significant; the government subsidies will be more conducive to enterprise green innovation with the help of the joint networks of enterprise innovation. (4) At present, the “target-resource-network” coupling system of Chinese construction enterprises is generally in a state of mild imbalance, which in turn leads to a poor level of green innovation in the construction industry. (5) There is a need to further discuss the heterogeneity of the impact of government’s environmental targets and enterprises’ environmental targets on the green innovation of enterprises. It is found that state-owned enterprises with older average age of managers and more proportion of women in management are more likely to implement the environmental targets into the green innovation of enterprises; in addition, the green innovation of enterprises in China’s eastern regions or cities with high innovation resources will be more significantly affected by the environmental targets. Further considering the policy context, it has been found that the effect of government’s environmental targets and enterprises’ environmental targets on the green innovation of enterprises is more obvious after 2015.
6.2. Implications
First of all, the government needs to further strengthen top-level design and overall coordination, including increasing financial support, improving the policy support system, creating a good environment for innovation-led development, and providing a strong impetus and strong guarantee for the innovation and development of enterprises. The green innovation of enterprises should not only consider market demand, social responsibility, and national policies, but also be carried out under the specific, targeted, focused, and precise innovation and development planning of the government. At the same time, it is necessary to further strengthen the dual driving force of government targets and enterprise targets, and to form a joint force between government system guidance and enterprise strategy implementation so that enterprises can maximize their efforts to promote the efficiency of green innovation. Secondly, in terms of resource investment, it is necessary to provide stable financial support for the basic research of enterprises. Government investment should be “steady in process” and focus on precision and efficiency. Enterprise investment should be accelerated and effectively guided with the resources efficiently invested under the direction and supervision of target-based design. In addition, in terms of network relationships, the resource-sharing mechanism of industry–university–research cooperation should be strengthened [4], and the implementation subjects should be strengthened to build a closer political network and the joint networks of enterprise innovation for improving the efficiency of green innovation. Finally, for the enterprise, it is necessary to further adjust the management structure, especially for construction enterprises. To increase the proportion of female managers and pay attention to the opinions and instructions of the elderly may help to create favorable conditions for green innovation. As for the government, it should pay attention to the implementation of the government’s environmental targets in the central and western regions and the cities with lower innovation resources, and the innovation resources should be inclined towards the enterprises in these regions, to a certain extent. Enterprises in these regions should establish networks with the government, other enterprises, and universities, and attach great importance to the coupling and coordination between targets, resources, and networks to facilitate their green innovation.
In summary, the green innovation of enterprises needs to establish a coupling system that is driven by environmental targets, which should focus on precise investment of resources and be assisted by building a relationship network; borrowing the institutional advantages of socialist countries with Chinese characteristics to promote the integration of targets, resources, and networks; and forming an organized matrix structure among enterprises so as to promote the core technology research of green innovation.
Author Contributions
Data curation, J.W.; methodology, S.C.; software, J.W.; writing—original draft, J.W. and S.C.; writing—review & editing, J.W. and Z.Z. All authors have read and agreed to the published version of the manuscript.
Funding
Special Task Project of Humanities and Social Science Research of the Ministry of Education (Project No.: 18JD710002); This study is sponsored by the BUCEA Post Graduate Innovation Project (Project No.: PG2022101).
Institutional Review Board Statement
Not applicable.
Informed Consent Statement
Not applicable.
Data Availability Statement
Not applicable.
Conflicts of Interest
All the authors declare that they have no conflict of interest.
References
- Xing, L.Y.; Yu, H.X. Cross-level Analysis on Driving Factors of Enterprise’s Green Innovation: Example of Construction Enterprises. J. Technol. Econ. 2018, 37, 49–55+115. [Google Scholar]
- Yuan, M. Analysis of the Dynamic Evolution of Time and Space and Influencing Factors of Green Innovation Efficiency of Construction Enterprises. Master’s Thesis, Zhengzhou University of Aeronautics, Zhengzhou, China, May 2021. [Google Scholar]
- People’s Daily. Hold High the Great Banner of Socialism with Chinese Characteristics and Work Together for Building a Modern Socialist Country in An All-Round Way—From the Report Delivered on Behalf of the 19th CPC Central Committee. Available online: http://paper.people.com.cn/rmrb/html/2022-10/17/nw.D110000renmrb_20221017_1-02.htm (accessed on 17 October 2022).
- Department of Statistics of Social, Scientific and Cultural Industries, National Statistical Office. Statistical Monitoring Report on the Innovation Capacity of Chinese Enterprises; China Statistics Press: Beijing, China, 2020; pp. 10–100. [Google Scholar]
- Han, J.; Lan, Q.X. Green Development in the New Development Stage: Theoretical Logic and Practical Path. J. Beijing Norm. Univ. (Soc. Sci.) 2022, 290, 5–16. [Google Scholar]
- Xiao, R.Q.; Qian, L. Heterogeneous Techniques, Network Structure Characteristics and Green Innovation Efficiency of Enterprises; Economic & Management Publishing House: Beijing, China, 2021; pp. 100–101. [Google Scholar]
- Zhang, D.G. Comprehensively Deepening Reform of the Economic System of China for A New Era—The Historical Pathway and Practical Logic of Economic System Innovation Since New China (4). Shanghai J. Econ. 2022, 410, 5–25. [Google Scholar] [CrossRef]
- Dong, B.K.; Chang, X.F.; Yang, Y.F. Research on the Influence of Manufacturing Firms’ Internal Capabilities on Their Green Innovation Cooperation Under Institutional Pressure. J. Beijing Univ. Technol. (Soc. Sci. Ed.) 2022, 22, 171–186. [Google Scholar]
- Liu, Z.M.; Liu, Y.Q.; Yang, Z.J. Whether Environmental Targets of Local Governments Affect Enterprises Green Technology Innovation: An Empirical Study Based on the Data of Listed Companies in China’s Manufacturing Industry. J. South China Norm. Univ. (Soc. Sci. Ed.) 2022, 259, 126–138+207. [Google Scholar]
- Bi, K.X.; Wang, Y.H.; Yang, C.J. Effect of Innovation Resources Input on Green Innovation Capability of Green Innovation System: Empirical Research from the Perspective of Manufacturing FDI Inflows. China Soft Sci. 2014, 279, 153–166. [Google Scholar]
- Xiao, J.; Zeng, P. Does Digitalization Improve the Quality and Quantity of Enterprise Green Innovation?—Based on Resource Perspective. Available online: https://kns.cnki.net/kcms/detail/detail.aspx?doi=10.16192/j.cnki.1003-2053.20220905.001 (accessed on 5 September 2022).
- Li, X.; Huang, Y.; Li, J.; Liu, X.; He, J.; Dai, J. The Mechanism of Influencing Green Technology Innovation Behavior: Evidence from Chinese Construction Enterprises. Buildings 2022, 12, 237. [Google Scholar]
- Yang, X.H.; You, D.M. Research on Enterprises Green Technology Innovation Decisions-Under the Perceptive of Consumer Environmental Awareness and Government Subsidies. Chin. J. Manag. Sci. 2022, 30, 263–274. [Google Scholar]
- Lou, G.X.; Xiang, L. Supplier-led Compound Green Innovation Decision-making Under Fairness Concern. Sci. Technol. Manag. Res. 2020, 40, 210–216. [Google Scholar]
- Pan, C.C.; Wang, F. How does Digital Empowerment Affect Green Transformation of Enterprises? Analysis on Dual Influence of Green Innovation Ability and Organizational Inertia. J. Nanjing Technol. Univ. (Soc. Sci. Ed.) 2022, 21, 89–100+116. [Google Scholar]
- Pan, C.L.; Tian, H. Environmental Leadership, Green Organizational Identity and Corporate Green Innovation Performance. Chin. J. Manag. 2017, 14, 832–841. [Google Scholar]
- Luo, L.W.; Liang, S.R. Green technology innovation efficiency and factor decomposition of China’s industrial enterprises. China Popul. Res. Environ. 2016, 26, 149–157. [Google Scholar]
- Zhang, D.T.; Zhang, J.J. Behavioral choices of local governments and corporate green technology innovation. China Popul. Resour. Environ. 2022, 32, 86–94. [Google Scholar]
- Calel, R.; Dechezlepretre, A. Environmental Policy and Directed Technological Change: Evidence from the European Carbon Market. Rev. Econ. Stat. 2016, 98, 173–191. [Google Scholar]
- Deng, Y.; You, D.; Wang, J. Optimal Strategy for Enterprises’ Green Technology Innovation from the Perspective of Political Competition. J. Clean. Prod. 2019, 235, 930–942. [Google Scholar]
- Wang, N.; Zhang, J.; Zhang, X.; Wang, W. How to Improve Green Innovation Performance: A Conditional Process Analysis. Sustainability 2022, 14, 2938. [Google Scholar]
- Liu, Y.; Zhang, G.T. The closed-loop supply chain network decision based on corporate environmental criteria and consumer’s environmental consciousness. China Popul. Resour. Environ. 2019, 29, 71–81. [Google Scholar]
- Yu, Y.Z.; Yin, L.P. The Evolution of Chinese Environmental Regulation Policy and Its Economic Effects: A Summary and Prospect. Reform 2022, 337, 114–130. [Google Scholar]
- People’s Daily. Xi Jinping Presided over the 27th Meeting of the Commission for Deepening Overall Reform of the CPC Central Committee We Will Improve the New Nationwide System for Tackling Key and Core Technologies and Comprehensively Strengthen Resource Conservation. Available online: http://paper.people.com.cn/rmrb/html/2022-09/07/nw.D110000renmrb_20220907_1-01.htm (accessed on 7 September 2022).
- Cong, X.N.; Wang, L.J. Thoughts on Promoting the Synergy Performance between the Double-carbon Goals and the Ecological Improvement, Environment Protection and Resource Utilization. Environ. Prot. 2022, 50, 33–36. [Google Scholar]
- Wang, P.; Bu, H.; Liu, F. Internal Control and Enterprise Green Innovation. Energies 2022, 15, 2193. [Google Scholar]
- Ma, W.; Zhang, R.; Chai, S. What Drives Green Innovation? A Game Theoretic Analysis of Government Subsidy and Cooperation Contract. Sustainability 2019, 11, 5584. [Google Scholar]
- Yang, C.-H.; Tseng, Y.-H.; Chen, C.-P. Environmental Regulations, Induced R&D, and Productivity: Evidence from Taiwan’s Manufacturing Industries. Resour. Energy Econ. 2012, 34, 514–532. [Google Scholar]
- Paniagua, J.; Sapena, J. Is FDI Doing Good? A Golden Rule for FDI Ethics. J. Bus. Res. 2014, 67, 807–812. [Google Scholar]
- Hamamoto, M. Environmental regulation and the productivity of Japanese manufacturing industries. Resour. Energy Econ. 2006, 28, 299–312. [Google Scholar] [CrossRef]
- Hu, A.G.; Zhou, S.J. Green Development: Functional Definition, Mechanism Analysis and Development Strategy. China Popul. Resour. Environ. 2014, 24, 14–20. [Google Scholar]
- Zheng, G.; Deng, W.R.; Wang, S.; Zheng, J. Construction and evolution of enterprise innovation network and breakthrough of key core technologies. Sci. Res. Manag. 2022, 43, 85–95. [Google Scholar]
- Faccio, M. Politically-Connected Firms: Can They Squeeze the State? Am. Econ. Rev. 2006, 96, 369–386. [Google Scholar]
- Zhou, X.; Cheng, L.R.; Wang, H. Is Higher the Level of Technological Innovation, Better the Financial Performance?—An Empirical Analysis of Patent Applications of the Listed Chinese Pharmaceutical Company. J. Financ. Res. 2012, 386, 166–179. [Google Scholar]
- Li, X.S.; Dang, L.; Zhao, C.Y. Digital Transformation, Global Innovation Network and Innovation Performance. China Ind. Econ. 2022, 415, 43–61. [Google Scholar] [CrossRef]
- Zhang, G.; Gao, Y.; Li, J.; Su, B.; Chen, Z.; Lin, W. China’s Environmental Policy Intensity for 1978–2019. Sci. Data 2022, 9, 75. [Google Scholar] [CrossRef]
- Zhao, C.Y.; Wang, W.C.; Li, X.S. How Does Digital Transformation Affect the Total Factor Productivity of Enterprises? Financ. Trade Econ. 2021, 42, 114–129. [Google Scholar]
- Chen, Q. Advanced Econometrics and Stata Applications, 2nd ed.; Higher Education Press: Beijing, China, 2014; p. 257. [Google Scholar]
- Porter, M.E.; Linde, C.V.D. Toward a New Conception of the Environment-Competitiveness Relationship. J. Econ Perspect. 1995, 9, 97–118. [Google Scholar]
- Zhou, Z.J.; Ma, J.; Hu, L.F. Research on Risk Offset Effect of Executive Compensation in Incentive System Design. China Ind. Econ. 2018, 369, 152–169. [Google Scholar] [CrossRef]
- Yang, R.S.; Chen, J. The Impact of Executives’ Political Affiliation on Corporate Green Innovation: From the Perspective of Government-Enterprise-Society Interaction. J. Hum. 2022, 315, 105–116. [Google Scholar] [CrossRef]
- Wang, Z.H.; Zou, P.Y.; Li, H.; Zhang, B.; Gao, J.Q. Path of regional coordinated development in the Yellow River Basin from the perspective of economy-energy-water nexus. China Popul. Resour. Environ. 2022, 32, 10–19. [Google Scholar]
- Li, J.L. The Study upon the Value Contribution of Enterprise’ S Intellectual Capital—Based on the Coupling Perspective. Soft Sci. 2013, 27, 108–113. [Google Scholar]
- Agrawal, A.; Knoeber, C.R. Do Some Outside Directors Play a Political Role? J. Law. Econ. 2000, 44, 179–198. [Google Scholar]
- Wang, B.B.; Qi, S.Z. The Effect of Market-Oriented and Command-and-Control Policy Tools on Emissions Reduction Innovation—An Empirical Analysis Based on China’s Industrial Patents Data. China Ind. Econ. 2016, 339, 91–108. [Google Scholar] [CrossRef]
- Shao, J.B.; Wu, S. Female CTO Executives and Innovation Investment of Enterprise. Commun. Financ. Accoun. 2019, 806, 57–63. [Google Scholar] [CrossRef]
Disclaimer/Publisher’s Note: The statements, opinions and data contained in all publications are solely those of the individual author(s) and contributor(s) and not of MDPI and/or the editor(s). MDPI and/or the editor(s) disclaim responsibility for any injury to people or property resulting from any ideas, methods, instructions or products referred to in the content. |
© 2023 by the authors. Licensee MDPI, Basel, Switzerland. This article is an open access article distributed under the terms and conditions of the Creative Commons Attribution (CC BY) license (https://creativecommons.org/licenses/by/4.0/).