Abstract
The continuous development of sensors and the Internet of Things has produced a large amount of traffic data with location information. The improvement of traffic safety benefits from the availability of traffic accident data. Managers can patrol and control relevant areas in advance with limited police resources, according to the short-term traffic accident predictions. As a result, the possibility of accidents can be reduced, and the level of traffic safety can be improved. The traditional approach to accident prediction relies too much on the subjective experience of traffic managers. Inspired by the deep learning technology in the field of computer vision, this study first divides the road network into regular grids and takes the number of traffic accidents in each grid as the pixel value of an image. Then, a traffic accident prediction approach based on a bi-directional ConvLSTM U-Net with densely connected convolutions (BCDU-Net) is proposed. This method mines the regular information hidden in the accident data and introduces densely connected convolutions to further extract the deep spatial-temporal features contained in the traffic accident sequence. Thus, the issues of gradient disappearance and model over-fitting caused by the traditional model in model training can be avoided. Finally, the simulation experiment is carried out on the historical traffic accident data of Yinzhou District, Ningbo City. Results show that BCDU-Net has better accuracy and precision than other models in three data sets: motor vehicle accidents, non-motor vehicle accidents, and single-vehicle accidents. Therefore, the BCDU-Net is more suitable for traffic accident prediction and has good application prospects for improving road safety.
1. Introduction
Traffic accidents have always been one of the most essential public security issues. Statistics from the World Health Organization (WHO) show that more than 1.25 million people die from traffic accidents annually [1]. Currently, traffic accidents have become the main cause of casualties. Thus, reducing the occurrence of traffic accidents has become a crucial social concern [2]. The purpose of accident prediction is to know the development tendency of traffic accidents, reasonably evaluate the feasibility and implementation effect of traffic safety measures, and effectively reduce the risk of accidents. The goal is to accurately and timely predict traffic accidents in local areas. Therefore, mastering and predicting the potential for traffic accidents in road networks has become a key branch in the field of traffic safety. Precise prevention and control can not only enable the traffic police to investigate the potential hazards of relevant roads or intersections in advance but also to take timely and effective actions in case of emergencies. In such cases, the safety of travelers could be maximized, and the safe, smooth, and efficient operation of the road network could be guaranteed.
However, currently, the early warning and prevention of traffic accidents rely on the simple statistics of historical accident data or on the experience of the traffic police [3,4]. It is still impossible to comprehensively and reasonably find out the potential locations with high accident risks in the road network and take prevention measures. The prediction of traffic accidents is still challenging and has been a research focus. On the other hand, the rapid development of data collection and the popularity of big data platforms make it possible to collect and record massive data related to traffic accidents, laying a reliable data foundation for accident prediction [5].
Many scholars have conducted related research on this issue. Lim et al. [6] realize a warning system for vehicle speed and collision time by using a nested Kalman filter and the YOLO (You Only Look Once) vehicle detection algorithm. However, the false alarm rate still needs to be reduced. Aung et al. [7] regard collision risk as a dependent variable and treat multiple factors, including driving speed, weather conditions, location, vehicle density, and driver fatigue degree, as independent variables. They further chose a hidden Markov model to model the correlation between these independent variables and the dependent variables. Comparative experiments show that the proposed method has better performance in terms of sensitivity and accuracy. Combined with traffic accidents, weather information, the height difference between the accident site and the surroundings, and whether there are tunnels and bridges, Kim et al. [8] use models such as random forest, XGBoost, neural networks, and logical regression to deeply mine the data and predict the risk of accidents caused by weather conditions in the winter. But the accuracy of various influencing factors remains to be improved. Dias et al. [9] simultaneously adopt machine learning and neural networks to predict accident frequency within the predefined time range. Experiments show that the effect obtained by a neural network is the best. Further research has found that rainfall is the meteorological factor with the highest probability of increasing accident risk, and the time period with the highest probability of accidents is between 17 and 20 in the evening. However, data collection is still a bottleneck that needs to be broken in this study.
Generally, traffic accident prediction can be described as a classification issue or a regression issue. For example, some scholars aim to predict whether accidents will occur in a specific spot (e.g., a road section) during a certain period (e.g., hours, days) [10,11,12]. Others use regression models to predict the number of accidents at a given time and place [13,14]. However, in the above-mentioned work, classical data mining methods are used while the uniqueness of traffic accident data is neglected, such as spatial heterogeneity and temporal auto-correlation, resulting in poor prediction results. Recently, researchers have been trying to solve this problem by using deep learning frameworks, such as convolutional neural networks. Zhao et al. [15] construct an LSTM encod-decoder prediction model that reconstructs input sequences and predicts future sequences simultaneously. Although their method can make predictions on spatio-temporal series, the fully connected LSTM (FC-LSTM) layer adopted by their model does not take spatial correlation into account. Shi et al. [16] propose a convolutional LSTM (ConvLSTM) and develop an end-to-end trainable model for the precipitation nowcasting issue by extending the fully connected LSTM (FC-LSTM) with convolutional structures in both input-to-state and state-to-state transitions. Experiments show that the ConvLSTM network captures spatiotemporal correlations better and consistently outperforms FC-LSTM. In later research, this issue is expressed as an image prediction issue [17]. Specifically, the traffic risk map is generated by learning spatial characteristics from accident records and related data. These works, however, either ignore time information or select data sets with very limited characteristics. They cannot predict accidents on a larger scale with spatial heterogeneity.
Given the typical spatiotemporal characteristics of accidents, the traditional time series prediction model can no longer play a good role in the prediction of traffic accidents. It is necessary to build a more complex network to effectively capture the spatiotemporal characteristics of the data. Recently, the rapid development of deep learning, especially with the birth of U-Net and the long short-term memory network models, has provided more useful tools and models for the effective prediction of traffic accidents.
In this study, the prediction of the traffic accident is turned into the prediction of a spatiotemporal series. Meanwhile, a deep learning framework for predicting traffic accidents is proposed by adopting a bi-direction ConvLSTM U-net model. To make it more specific, the whole research area is divided into regular grids first, and then the environmental features related to traffic accidents, such as road conditions, lighting, weather, etc., are collected. These features are mapped to each grid. Finally, a Bi-direction ConvLSTM U-net network model is developed and trained to predict the probability of accidents in each grid in the near future.
The rest of this paper is organized as follows:
Section 2 introduces some preparations for the experiment. In Section 3, the detailed implementation scheme for traffic accident prediction combined with the Bi-direction ConvLSTM U-net model is introduced in detail. In Section 4, the training of the network model by using historical traffic accidents from the road network in Ningbo, China, and the usage of the trained model to predict accidents are introduced. Compared with the results predicted by other network models, the performance of this method is further verified. The last part is about the conclusion and assumptions.
2. Related Work
2.1. Data Source
2.1.1. Accident Data
The accident data are collected from Yinzhou District (covering an area of about 1346 square kilometers) and Ningbo City. The total economy of Yinzhou District tops all other districts and counties in Ningbo City. The accident data were collected from 10 April 2020 to 31 October 2021.
The data were collected by the traffic police from the Yinzhou Branch of the Ningbo Public Security Bureau. Each record includes such information as the time, longitude and latitude coordinates, location, type, the causes of the accident, weather, and environment. A total of 137,931 accidents were collected through related mobile applications (APP), of which 134,394 records were valid with complete GPS coordinates, while the remaining 3537 were invalid and were eliminated (the invalid samples are records without geographic coordinate information, or longitude and latitude coordinates are not within the scope of the study area, which is generally due to the mis-operation of the mobile phone or GPS positioning failure).
The accident data were collected by the police or the co-police, who are responsible for handling the accidents. This duty has been included in their daily assessment management. As long as they receive the alarm command, they will collect the accident data, whether they are at the scene of the accident or not, which can guarantee the collection rate of the accident data. Moreover, the accident data were collected through the WeChat applet. This method is characterized by high positioning accuracy, the full collection of samples, and high efficiency. To further verify the quality of the data set, data from the command center in the same period were taken for comparison, and 251,861 effective alarm records were found. The effective accident samples collected from the WeChat applet account for 50–60% of the actual cases, which can fulfill the requirements of accident data analysis in terms of accuracy and quality.
2.1.2. Road Network Data
The road network data of Yinzhou District, Ningbo City were downloaded from OpenStreetMap (source: HTTPS://www.openstreetmap.org (accessed on 30 December 2021)). However, data from this coordinate system is inconsistent with those from the WeChat applet. Therefore, the coordinate transformation is required for road network and accident data to make data from different sources have the same coordinate system, as shown in Figure 1.
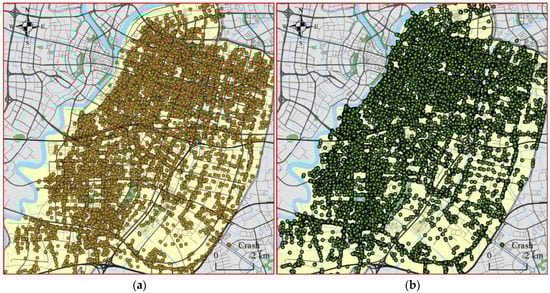
Figure 1.
Accident data and road network matching. (a) Original data; (b) Data after coordinate conversion.
2.1.3. Photos from Accident Scenes
Photos of the accident scene can be obtained from the collected accident data, in which the details of casualties and collision positions can be found. As a result, the accident scene can be completely preserved, enabling the traffic police or the co-police to trace, measure, and analyze the accident at any time, as shown in Figure 2.
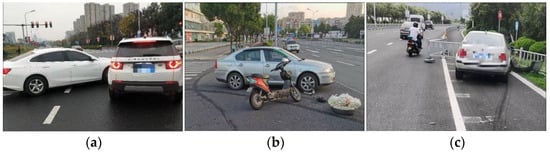
Figure 2.
Photos from accident scenes. (a) Motor vehicle accidents; (b) Non-motor vehicle accidents; (c) Single-vehicle accidents.
2.2. Model Architecture
Inspired by U-Net and ConvLSTM, we adopted the BCDU-Net model [18], as shown in Figure 3. The network model is mainly composed of a down-sampling layer, an up-sampling layer, and a skip connections layer.
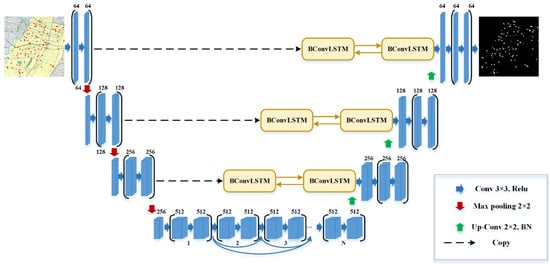
Figure 3.
Structure of the U-net.
2.2.1. Down-Sampling Layer and the Dense Connections Layer
There are four stages in the process of down-sampling. Each stage consists of two convolution filters of 3 × 3. After each convolution filter, there is a maximum pooling function with kernel size 2 × 2 and a ReLU activation function. After each down-sampling process, the number of feature channels will be doubled. This process will gradually abstract the data representations and increase the dimension of these representations. Finally, a high-dimensional data representation with high semantic information will be produced in the last layer of down-sampling.
As a series of convolutional layers in the traditional U-Net will learn redundant features in the down-sampling process, this study also adopts the densely connected convolution structure proposed in Densely Connected Convolutional Networks [19]. This means that all feature maps learned from the previous convolution layer are merged with those from the current layer and treated as the input of the next convolution layer, which will enable the network to learn diversified features and improve its performance and expression ability by reusing the feature map.
The idea of dense connections derives from DenseNet [20], in which a new connection structure was proposed by reusing features, which not only slows down the phenomenon of gradient disappearance but also reduces the number of model parameters. It establishes dense connections between all the preceding layers and the following layers and realizes the reuse of features through their connection on the channel. These characteristics enable DenseNet to achieve better performance with fewer parameters and lower computing costs. Dense connection convolution can make the network benefit from all the features generated before and avoid the risk of gradient explosion or disappearance.
2.2.2. Up-Sampling Layer and Skip Connections Layer
Each step in the up-sampling layer is to up-sample the output of the previous layer. The corresponding feature mappings in the down-sampling process are copied to the up-sampling process in the standard U-Net. These feature mappings are then connected to the output of the up-sampling function. The traditional LSTM network does not consider the spatial correlation of data since it adopts a fully connected structure to connect hidden layers. ConvLSTM is developed to solve this problem [21]. It retains an input gate, an output gate, a forget gate, and a storage cell as in the traditional LSTM model. Meanwhile, the convolutional operation is adopted to replace the fully connected structure in the traditional LSTM model.
In this paper, we adopt bi-directional ConvLSTM to encode the input tensor. The bi-directional ConvLSTM uses two ConvLSTM cells to process the input data into forward and backward paths. Then decisions on the current input are made by processing the data dependencies of both paths. It has been proved that analyzing data from the forward and backward perspective can improve the prediction performance of the model.
3. Proposed Method
The issue of accident prediction is modeled in this part. The research object is described as a continuous spatiotemporal domain S × T (where is a spatial grid while is an interval that is equally divided by the study period) and the traffic accident statistics N (s, t) in this time-space domain (N (s, t) is the total number of accidents in grid s ∈ S during t ∈ T). It is supposed that there are P measurements in each grid. The observation values at any time can be expressed by a tensor , where R is the structure domain of the observed characteristics and M and N are the number of rows and columns of the grid, respectively. If the traffic accidents are sampled in each grid according to a fixed timestamp, a tensor sequence will be obtained. The goal is to train a model that predicts the probability accidents occurred in grid S in the next time span t + 1 for each time period t ∈ T by taking advantage of historical traffic accidents and the associated attributes. Then this issue is converted to predict the most likely data series of the same length in the near future based on the K data series, as shown in Formula (1).
If we further regard the value of the feature in each grid as the pixel value of an image, then the feature sampled in each timestamp corresponds to a gray image. A new image data set with a time series is formed by superimposing multiple gray images in time order, as shown in Figure 4. The issue of accident prediction naturally transforms into the issue of predicting a spatiotemporal sequence that includes both spatial and temporal structures. Our goal is to train a network model by using the image data set of this time series, and then predict the image sequence in the near future, and finally convert the predicted gray image into the probability of traffic accidents.
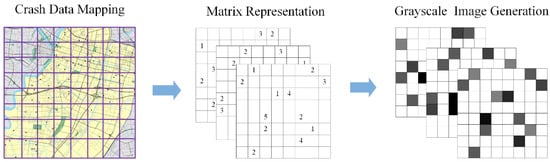
Figure 4.
Serialization of traffic accidents.
To sum up, short-term traffic accident prediction is essentially an issue of spatiotemporal sequence. Because of the spatial information involved, the traditional U-Net network only captures the temporal correlation but cannot effectively mine the spatial information hidden in the data. For traffic accidents, characteristics of time series and spatial information are important identifiers. Adding ConvLSTM and dense connection structures to the traditional U-Net network model can effectively capture the spatial correlation. Therefore, the BCDU-Net model can perfectly fit the spatiotemporal characteristics of the data.
4. Experiment and Analysis
In the experiment, a regular grid with grid size of 200 m × 200 m was used to divide the core area of Yinzhou district into a 64 × 64 grid array. Then, the number of historical accidents and factors that affect the occurrence of traffic accidents are matched with the grid based on the spatial relationship. Since the occurrence of traffic accidents is affected by human travel activities, there is an obvious travel pattern that takes a day as a cycle. In this study, we choose 24 h as the length of the time stamp t and sample the number of traffic accidents in each grid within the specified time stamp. The training and testing samples with a continuous 1 + 1 day are created from the pre-processed accident data according to the time tag. The samples will be put into the BCDU-Net as a sequence for training. In other words, the accidents of the next day are predicted according to the accidents of the previous day. In this way, the entire data set is converted into 570 sequences. 90% of all data is divided into training sets, while the rest 10% into test sets. Then we use the offset with a step size of one to obtain the next input and its corresponding output circularly. Our model is implemented by Keras with a TensorFlow backend.
In our experiment, cross entropy (CE), mean square error (MSE), and root mean square error (RMSE) were adopted to evaluate the model. The definitions of these three indicators are shown in Formulas (2)–(4).
where C represents the number of categories, m is the number of samples, is the truth, and is the prediction.
The critical success index (CSI), false alarm rate (FAR), probability of detection (POD), and correlation metrics are employed to further evaluate the accuracy of the prediction results. CSI, FAR, and POD are commonly used indicators of precipitation forecasts in the meteorological field. We convert the predictions and the truth into a 0/1 matrix and calculate the hit cases (H), miss cases (M), and false prediction cases (F). Their definitions are shown in formulas (5)–(7).
The definition of the correlation coefficient between the prediction P and the truth T is shown in Formula (8).
where .
To evaluate the prediction effect of the BCDU-Net network on the accident data set, the accident data are further divided into accidents involving motor vehicles, non-motor vehicles, and single-vehicles according to their type labels. This is not only helpful for the traffic police to investigate areas prone to different types of traffic accidents, but it can also more pertinently rectify the relevant road sections and reduce the risk of accidents on the road network.
4.1. Motor Vehicle Accidents
A motor vehicle accident is an event in which a motor vehicle is involved in a collision with another motor vehicle, a pedestrian, an animal, or a stationary object. Figure 5 shows the comparison between the prediction of the proposed model and the true value. The first row is the distribution of traffic accidents that occur on the road network. The second row is the distribution of traffic accidents predicted by BCDU-Net. The third row is the matching effect of the predicted traffic accidents with the road network. The fourth row is the heat map of traffic accidents predicted by the model (the same below). Meanwhile, the quantitative results of the predictions from BCDU-Net were compared with other models, as listed in Table 1. Obviously, the BCDU-Net performs better than other models.
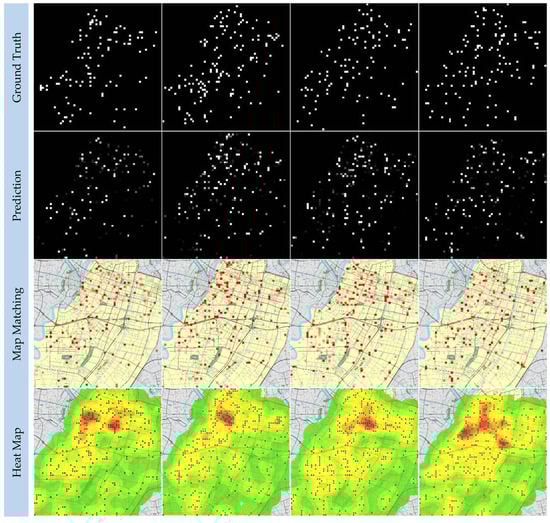
Figure 5.
The predictions of the motor vehicle accidents.

Table 1.
Performance comparison of the proposed network with other models on the data set of motor vehicle accidents.
To verify the convergence of the BCDU-Net, the training and verification accuracy of the data set of motor vehicle accidents is shown in Figure 6a, which demonstrates that the convergence speed of the BCDU-Net is very fast. To be more specific, the network almost converges after the 20th iteration. The changing trend of the model loss value with the number of iterations further validates this conclusion, as shown in Figure 6b. To demonstrate the overall performance of BCDU-Net on the data set of motor vehicle accidents, the ROC curve is shown in Figure 6c, which shows the relationship between the true positive rate (TPR) and the false positive rate (FPR) [22]. The area below the ROC curve is used to indicate the accuracy of the prediction. In other words, the area below the curve is positively correlated with the prediction accuracy of the model.
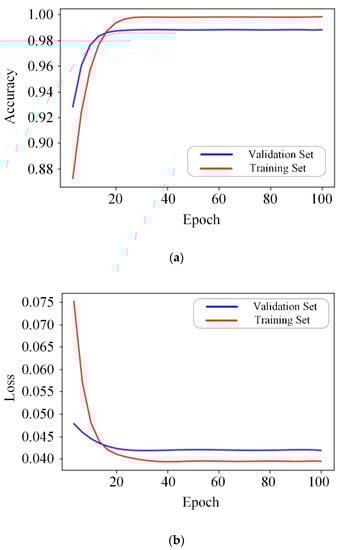
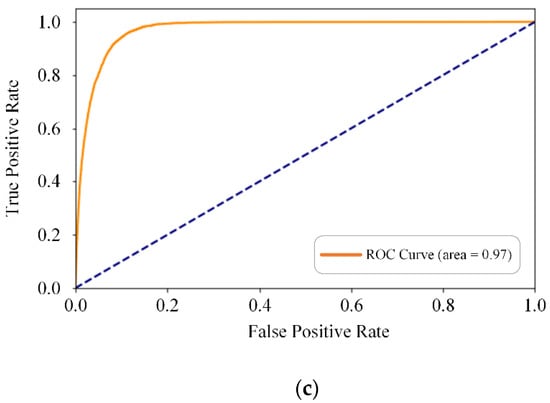
Figure 6.
Change the trends of relevant indicators of BCDU-Net with the number of iterations on the motor vehicle accident data set. (a) Accuracy; (b) Loss Function; (c) ROC curve.
4.2. Non-Motor Vehicle Accidents
Non-motor vehicle accidents refer to the casualties or property losses caused by drivers of bicycles, tricycles, rickshaws, animal-drawn vehicles, and special vehicles for persons with disabilities and persons with reduced mobility, as well as pedestrians, passengers, and those who carry out traffic activities on roads, due to their acts and negligence in violation of the “Road Traffic Safety Law” and other traffic laws and regulations. Figure 7 shows some promising outputs of BCDU-Net on the data set of non-motor vehicle accidents. Table 2 lists the quantitative results from different models and the proposed network. BCDU-Net has made great improvements and is superior to the alternative schemes in terms of all evaluation indicators.
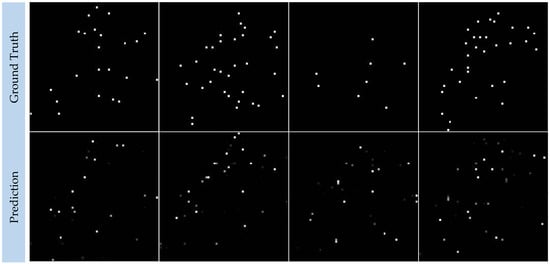
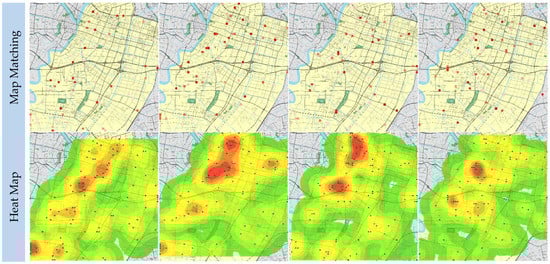
Figure 7.
The predictions of the non-motor vehicle accidents.
Table 2.
Performance comparison of the proposed network with other models on the data set of non-motor vehicle accidents.
4.3. Single-Vehicle Accidents
A single-vehicle accident is a traffic accident in which only one party is involved. The prediction results of single-vehicle accidents in the road network using the BCDU-Net developed in this study are shown in Figure 8. Table 3 lists the results of quantitative analysis on this data set using different models and the BCDU-Net developed in this paper. The results show that most evaluation indices of BCDU-Net are superior to those of other models.
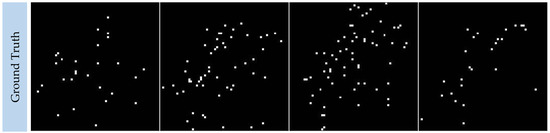
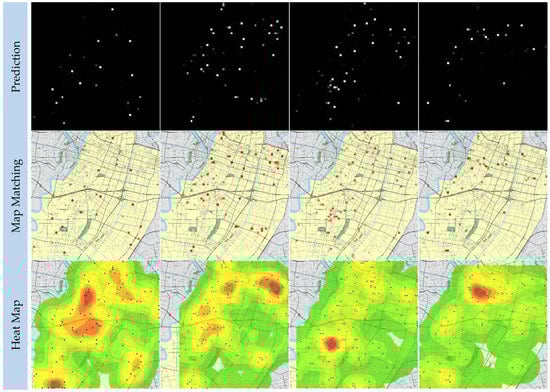
Figure 8.
The predictions of the single-vehicle accidents.
Table 3.
Performance comparison of the proposed network with other models on the data set of single-vehicle accidents.
4.4. Discussion
4.4.1. Model Prediction Effect Analysis
BCDU-Net is modified from the original U-Net. We compared the “accuracy” and “F1-Score” of the U-Net and BCDU-Net in three different data sets of a traffic accident in Table 4, which demonstrates that the prediction results of the original U-Net have been effectively improved by inserting bi-directional ConvLSTM into the skip connections layer.
Table 4.
Comparison of F1-score and accuracy of U-Net and its modifications.
The original U-Net model only uses a simple connection function to fuse the features from the coding layer and the decoding layer, while BCDU-Net uses a set of bi-directional ConvLSTM structures to combine features from the coding layer and the decoding layer. These two kinds of features are fused to form a set of feature maps with sufficient local and semantic information, enabling the network to learn more complex data structures. What’s more, dense connection structures share feature mapping among convolutional blocks through a direct connection and generate more diversified and richer feature information, granting the network stronger feature propagation ability. Therefore, the introduction of a dense connection layer can improve the prediction accuracy and f1 score of the three data sets.
4.4.2. Accident Prediction Results Analysis
The heat map of motor vehicle accidents shows that the number of motor vehicle accidents, mainly concentrated along roads with large traffic flows and nearby intersections, is relatively higher than that of other accidents. It is observed from the distribution map that motor vehicle accidents form relatively concentrated black-spot areas that are relatively fixed. The traffic management department can carry out risk investigation and accident prevention and control in advance for these areas. The heat map of non-motor vehicle accidents shows that non-motor vehicle accidents are mainly distributed at intersections and the areas nearby. In general, the distribution of the hot spot is relatively scattered and random. Further analysis shows that the hot spot of non-motor vehicle accidents is relatively scattered and unfixed and not as centralized and obvious as that of motor vehicle accidents. It is difficult for the traffic management department to prevent or control non-motor vehicle accidents in advance. The heat map of single-vehicle accidents shows that the number of single-vehicle accidents accounts for a relatively small percentage of the three types of accidents. Single-vehicle accidents mainly occur in areas with crisscrossing roads where the distribution of roads is relatively dense or there are many intersections. Further analysis shows that the distribution of single-vehicle accidents is relatively loose and that there is no relatively concentrated “hot spot” area. It forms a scattered pattern.
Although it is impossible to accurately locate the location of each accident by using the accident prediction method proposed in this study, it is possible to accurately predict a series of traffic accidents, including motor vehicle accidents, non-motor vehicle accidents, and single-vehicle accidents, within a local scope. For the traffic management department, it has already played the role of early prevention and early warning; meanwhile, it also enables the management department to mine the hot spots of accidents in the road network. By understanding the distribution of accidents on the road network, effective prevention and control of relevant road sections in advance can be carried out to minimize the risk of traffic accidents.
5. Conclusions
This paper applies Bi-ConvLSTM U-net neural network to the prediction of traffic accidents. We first define short-term traffic accidents prediction as the prediction of spatiotemporal sequence. The BCDU-Net model was trained using historical traffic accident data and then used to predict traffic accidents occurring in the road network of Yinzhou District, Ningbo. ConvLSTM is suitable for mining and analyzing spatiotemporal characteristics in accident data as it retains the advantage of traditional LSTM in memorizing time series. Besides, its inherent convolution structure can extract the spatial characteristics of data. The experimental results show that BCDU-Net can effectively extract the spatiotemporal distribution characteristics of traffic accident data to mine the deeper characteristics and predict the possibility of traffic accidents more accurately. Compared with the traditional neural network [23], the prediction results of the method proposed in this study are more accurate, which is of great significance for traffic safety and transportation.
Meanwhile, traffic accidents are divided into three types, namely, accidents of motor vehicles, non-motor vehicles, and single vehicles, according to their attributes. These three types of accidents are trained on BCDU-Net, respectively. From the prediction results of the three models, it can be seen that motor vehicle accidents are mainly concentrated along some sections with large traffic flows or intersections nearby, forming relatively concentrated “black-spot” areas. These black-spot areas are relatively fixed; non-motor vehicle accidents are mainly distributed at intersections and nearby areas, showing a relatively scattered and random distribution. The distribution hot spots of non-motor vehicle accidents are relatively scattered and unfixed. Single-vehicle accidents mainly occur in areas crisscrossed by roads with a relatively dense distribution and many intersections. The distribution of single-vehicle accidents is relatively loose, and there is no relatively concentrated “hot-spot” area.
However, there are some deficiencies in this study. Firstly, the occurrence rate of traffic accidents is low, so the accurate prediction of traffic accidents is extremely challenging. Due to the lack of sufficient sample data, there is some deviation between the predicted results and the real values. Although we can continue to collect traffic accident data as a supplement to the experimental data set, the construction of road networks in many cities is still undergoing continuous reconstruction. As a result, the road network in urban areas is still expanding and updating. Therefore, it is difficult to collect a large and stable data set on traffic accidents. Secondly, each grid is regarded as the basic unit of prediction in our experiment. The finer the grid is divided, the higher the prediction accuracy is. However, since traffic accidents do not occur frequently, the finer the road network space is divided, the rarer the sequence matrix is, which in turn will reduce the accuracy of prediction. Therefore, the best partition granularity to obtain the best prediction effect is also an issue requiring further study in the follow-up research.
Our team will also use different in-depth learning network models (such as ConvGRU [24]) to conduct more comparative experiments to achieve better experimental results and prediction accuracy. Meanwhile, we will adjust the model structure and parameters appropriately to further improve and optimize the computational performance of the model.
Author Contributions
Conceptualization, Z.H., J.Z. and E.Z.; methodology, Z.H.; software, J.Z.; validation, Z.H., J.Z. and E.Z.; formal analysis, Z.H.; investigation, J.Z.; resources, Z.H.; data curation, J.Z.; writing—original draft preparation, Z.H.; writing—review and editing, J.Z.; visualization, E.Z.; supervision, E.Z.; project administration, J.Z.; funding acquisition, Z.H. All authors have read and agreed to the published version of the manuscript.
Funding
This work was supported in part by the National Natural Science Foundation of China (No. 52002282) and the Philosophy and Social Science Foundation of Zhejiang Province (No. 21NDJC163YB and 22NDQN279YB).
Data Availability Statement
The data set generated during and/or analyzed during the current study is available from the corresponding author upon reasonable request.
Acknowledgments
The authors thank the kind help from the editor and anonymous referees, whose comments improve the quality of this paper.
Conflicts of Interest
The authors declare no conflict of interest.
References
- Ravikanth, K.; Chandra Shekar, K.; Shashi Kethana, K.; Sai Praveena, V.; Sharon Rachel, C.H. Identification of Accident Hotspots Using Clustering Algorithms in Machine Learning. In Innovations in Computer Science and Engineering: Proceedings of the Ninth ICICSE, 2021; Springer: Singapore, 2022; pp. 609–616. [Google Scholar]
- Mohammed, A.A.; Ambak, K.; Mosa, A.M.; Syamsunur, D. A review of traffic accidents and related practices worldwide. Open Transp. J. 2019, 13, 65–83. [Google Scholar] [CrossRef]
- Chen, H.; Feng, S.; Pei, X.; Zhang, Z.; Yao, D. Dangerous driving behavior recognition and prevention using an autoregressive time-series model. Tsinghua Sci. Technol. 2017, 22, 682–690. [Google Scholar] [CrossRef]
- Gopalakrishnan, S. A public health perspective of road traffic accidents. J. Fam. Med. Prim. Care 2012, 1, 144. [Google Scholar] [CrossRef] [PubMed]
- Sun, N.; Zhang, J.; Rimba, P.; Gao, S.; Zhang, L.Y.; Xiang, Y. Data-driven cybersecurity incident prediction: A survey. IEEE Commun. Surv. Tutor. 2018, 21, 1744–1772. [Google Scholar] [CrossRef]
- Lim, Q.; He, Y.; Tan, U.X. Real-time forward collision warning system using nested Kalman filter for monocular camera. In Proceedings of the 2018 IEEE International Conference on Robotics and Biomimetics (ROBIO), Kuala Lumpur, Malaysia, 12–15 December 2018; pp. 868–873. [Google Scholar]
- Aung, N.; Zhang, W.; Dhelim, S.; Ai, Y. Accident prediction system based on hidden Markov model for vehicular ad-hoc network in urban environments. Information 2018, 9, 311. [Google Scholar] [CrossRef]
- Kim, D.; Jung, S.; Yoon, S. Risk prediction for winter road accidents on expressways. Appl. Sci. 2021, 11, 9534. [Google Scholar] [CrossRef]
- Dias, D.; Silva, J.S.; Bernardino, A. The prediction of road-accident risk through data mining: A case study from Setubal, Portugal. Informatics 2023, 10, 17. [Google Scholar] [CrossRef]
- Thapa, D.; Paleti, R.; Mishra, S. Overcoming challenges in crash prediction modeling using discretized duration approach: An investigation of sampling approaches. Accid. Anal. Prev. 2022, 169, 106639. [Google Scholar] [CrossRef] [PubMed]
- Vazirizade, S.M.; Mukhopadhyay, A.; Pettet, G.; Said, S.E.; Baroud, H.; Dubey, A. Learning incident prediction models over large geographical areas for emergency response systems. arXiv 2021, arXiv:2106.08307. [Google Scholar]
- Roland, J.; Way, P.D.; Firat, C.; Doan, T.-N.; Sartipi, M. Modeling and predicting vehicle accident occurrence in Chattanooga, Tennessee. Accid. Anal. Prev. 2021, 149, 105860. [Google Scholar] [CrossRef] [PubMed]
- Jindal, R.K.; Agarwal, A.K.; Sahoo, A.K. Envisaging the road accidents using regression analysis. Int. J. Adv. Sci. Technol. 2020, 29, 1708–1716. [Google Scholar]
- Kuang, L.; Yan, H.; Zhu, Y.; Tu, S.; Fan, X. Predicting duration of traffic accidents based on cost-sensitive Bayesian network and weighted K-nearest neighbor. J. Intell. Transp. Syst. 2019, 23, 161–174. [Google Scholar] [CrossRef]
- Zhao, X.; Han, X.; Su, W.; Yan, Z. Time series prediction method based on convolutional autoencoder and LSTM. In Proceedings of the 2019 Chinese Automation Congress (CAC), Hangzhou, China, 22–24 November 2019; pp. 5790–5793. [Google Scholar]
- Shi, X.; Chen, Z.; Wang, H.; Yeung, D.Y.; Wong, W.K.; Woo, W.C. Convolutional LSTM network: A machine learning approach for precipitation nowcasting. Adv. Neural Inf. Process. Syst. 2015, 28, 802–810. [Google Scholar]
- Hu, Z.; Zhou, J.; Huang, K.; Zhang, E. A Data-Driven Approach for Traffic Crash Prediction: A Case Study in Ningbo, China. Int. J. Intell. Transp. Syst. Res. 2022, 20, 508–518. [Google Scholar] [CrossRef]
- Azad, R.; Asadi-Aghbolaghi, M.; Fathy, M.; Escalera, S. Bi-directional ConvLSTM U-Net with densley connected convolutions. In Proceedings of the IEEE/CVF International Conference on Computer Vision Workshops, Seoul, Republic of Korea, 27–28 October 2019. [Google Scholar]
- Huang, G.; Liu, Z.; Van Der Maaten, L.; Weinberger, K.Q. Densely connected convolutional networks. In Proceedings of the IEEE Conference on Computer Vision and Pattern Recognition, Honolulu, HI, USA, 21–26 July 2017; pp. 4700–4708. [Google Scholar]
- Zhu, Y.; Newsam, S. Densenet for dense flow. In Proceedings of the 2017 IEEE International Conference on Image Processing (ICIP), Beijing, China, 17–20 September 2017; pp. 790–794. [Google Scholar]
- Kim, S.; Hong, S.; Joh, M.; Song, S.K. Deeprain: Convlstm network for precipitation prediction using multichannel radar data. arXiv 2017, arXiv:1711.02316. [Google Scholar]
- Hoo, Z.H.; Candlish, J.; Teare, D. What is an ROC curve? Emerg. Med. J. 2017, 34, 357–359. [Google Scholar] [CrossRef] [PubMed]
- Yuan, Z.; Zhou, X.; Yang, T. Hetero-convlstm: A deep learning approach to traffic accident prediction on heterogeneous spatio-temporal data. In Proceedings of the 24th ACM SIGKDD International Conference on Knowledge Discovery & Data Mining, London, UK, 19–23 August 2018; pp. 984–992. [Google Scholar]
- Zhao, J.; Zhu, W.X. Deep Conv-GRU Network for Traffic Flow Prediction. In Proceedings of the 2021 China Automation Congress (CAC), Beijing, China, 22–24 October 2021; pp. 5783–5788. [Google Scholar]


Disclaimer/Publisher’s Note: The statements, opinions and data contained in all publications are solely those of the individual author(s) and contributor(s) and not of MDPI and/or the editor(s). MDPI and/or the editor(s) disclaim responsibility for any injury to people or property resulting from any ideas, methods, instructions or products referred to in the content. |
© 2023 by the authors. Licensee MDPI, Basel, Switzerland. This article is an open access article distributed under the terms and conditions of the Creative Commons Attribution (CC BY) license (https://creativecommons.org/licenses/by/4.0/).