Abstract
The aim of this study is to analyze and model the geotechnical characteristics of soils in Erbil city using Geographic Information Systems (GIS) and Artificial Neural Networks (ANNs). The study used GIS to analyze the geotechnical properties of soils by collecting data from 102 boreholes in three different depth levels (1.5 m–3.5 m, 3.5 m–6.5 m and 6.5 m–9.5 m) to visualize and analyze soil characteristics such as fines content, moisture content, soil plasticity, shear strength parameters, compressibility, Standard penetration test (SPT), and bearing capacity. The paper also establishes the prediction of SPT-N value and bearing capacity based on geotechnical properties of soils using ANN methods and made correlations between SPT values and shear strength parameters with the bearing capacity of the soil. The results analyzed via GIS indicated that the soil classification was silty clay with a small amount of sandy gravel (CL) in most of the study area. According to the SPT–N values, most of the soils in Erbil City ranged between 33 and 50; a higher SPT value generally indicates denser and stronger soil. The value of the shear strength parameter for the maximum friction angle of the soil layers was found to be 36°, and the predominant cohesion was approximately 100 kPa. The compression index of soils ranged between 0.11 to 0.31. The results showed that the ANN models were able to accurately predict the geotechnical parameters of the soil types in the study area. In addition, the use of GIS and ANN techniques allowed for a comprehensive analysis of the geotechnical characteristics of the soils in Erbil, providing valuable information for future construction and development projects.
1. Introduction
One of the most important steps before constructing infrastructure is the geotechnical site investigation. It provides information on the site suitability for design criteria and possible construction problems such as time and resources. There are many methods for site investigations and in-situ tests, including pressure meter test, dilatometer test, SPT, cone penetration test (CPT), and plate load test [1]. For the construction of multistory buildings, highways, bridges, and industrial facilities, a soil survey is required to determine the type of soil, consistency, index properties, relative density, groundwater level, shear strength parameters, (SPT) value and bearing capacity [2]. It is necessary to know the bearing capacity of the soil layers for design, the choice of the foundation type, and the foundation depth for any superstructure [2,3,4]. A geotechnical investigation provides valuable information on the physical and mechanical properties of the soil and rock at a site, which is necessary for safe and durable engineering structures. The information collected from a geotechnical investigation is used to make informed decisions about the design and construction of the foundation, and to identify potential hazards, such as soil liquefaction or instability of slopes, that could compromise the safety of the structure. Therefore, to obtain the geotechnical parameters required for the calculation of the soil bearing capacity and settlement, in situ testing is required in addition to the collecting of disturbed and undisturbed specimens at different depths. Thus, several geotechnical experiments are conducted on these specimens to determine various parameters that are typically used to design the foundations [5]. Researchers have studied the reliability of SPT to determine the bearing capacity of soil [6,7,8]. Currently, the SPT test is used to evaluate the bearing capacity to design foundations [9,10].
GISs and ANNs could be used together in analyzing the geotechnical characteristics, and to predict the shear strength, settlement, and bearing capacity of the soil from the index properties of soils. The GISs provide an analytical function that is time–consuming for developing model entry data at different spatial scales [10,11]. A GIS is an organization of data that people interact with to integrate, analyze, and visualize data, to identify relationships, patterns and trends, and to resolve complicated issues; GIS has been used by many researchers to analyze various data [12,13,14,15]. ArcGIS was designed to capture data, store, update, process and present data, and to conduct analyses [16]. GIS can help to recognize possible challenges to the completion of the project early in the design process, which can help to avoid time losses for a construction project. Therefore, a GIS is a modular instrument that can be used to support geotechnical site assessments. It has been used to guide land preparation and to integrate field data with existing data [17].
ANN is one of the prevalent algorithms among researchers nowadays, specifically in geotechnical issues. ANN holds three significant advantages: first, the counting speed is high. Second, it has a strong fault-tolerant capability. Third, it is proficient in dealing with problems with complicated problem-solving rules [18]. The technique of utilizing ANN could be a suggestion for predictions, especially in cases where theoretical modeling does not give foreseen outcomes [19]. ANN aims to model the behavior of the nervous system in the human brain. ANN is an adequate solution for solving complex and nonlinear data modeling. Ref. [20] presents the estimation of standard penetration test values on cohesive soil using an artificial neural network without data normalization. Some previous studies investigated the assessment of geotechnical properties and determination of shear strength parameters by unitized ANN [21,22,23]. In the geotechnical domain, the development situations generally have multiple variables, making them challenging to model employing conventional mathematics [24].
In this study, the test results of 102 boreholes were gathered, categorized, and analyzed and modeled using ArcGIS10.7 software. These data were used to construct models using ANNs to predict the SPT values and bearing capacity of soils. The data represent the area of Erbil City in Iraq, covering a depth of 9.5 m below the ground surface. Data were collected from the Andrea Engineering Test Laboratory and the construction laboratory in Erbil. Therefore, for a geotechnical engineer, this information can be used to classify areas into zones according to GIS results. The purpose of this study is to analyze and model the geotechnical parameters such as the fines content, moisture content, soil plasticity, shear strength parameters, compressibility parameters, SPT–N values and soil bearing capacity via GIS to create a group of maps in different layers. In addition, the prediction of SPT-N value and bearing capacity based on geotechnical parameters were modeled by ANN methods. Correlations between shear strength parameters, SPT values and bearing capacities of soils were made by Minitab 17 programming.
By combining the capabilities of GIS and ANNs, researchers can develop models to analyze geotechnical issues at different spatial scales, producing results that are more accurate and efficient compared to manual methods In summary, GIS and ANNs complement each other by providing an analytical function that is efficient for developing model data entry at different spatial scales for geotechnical issues, allowing for more accurate predictions and a better understanding of the relationships between soil properties and other factors. To the best of our knowledge, this is the first study to cover mapping and modelling all the geotechnical characteristics of soil in Erbil city.
2. Study Area
Erbil is located in the northwestern region of Iraq. Geologically, it is in the low–folded belt of northern Iraq in the structural trough with a NW–SE axial trend, and within the foothill zone, which is part of the stable shelf tectonic unit of Iraq. Erbil City has an area of approximately 250 km2 and GPS coordinates of 36°11′27.4″ N 44°00′33.7″ [25]. A location map of Erbil City is shown in Figure 1. From a geomorphological perspective, the area is flat with uncommon low–lying hills. In addition, Erbil City is stratigraphically covered by quaternary and Pleistocene deposits, which are dominated by clay, silt, and sand [26]. Erbil City is mainly covered by soils such as gravel and conglomerates with sand, clay, and silt. Conglomerates cover more than 80% of the study area [27].
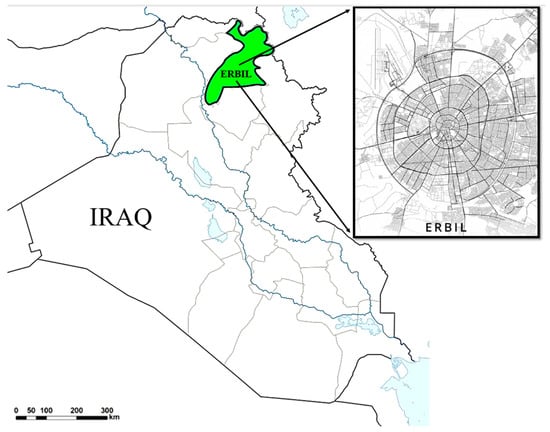
Figure 1.
Location of Erbil City, Iraq.
In the last decade, Erbil city had extensive development in the construction of railways, internal and ring roads. Therefore, collecting data, building a database, producing GIS maps for soil properties, and developing a model for soil behaviors and the bearing capacity of the foundations would be very useful for site engineers to make immediate decisions regarding the selection of project positions. Finally, the geotechnical properties at different depths were collected from the study area (Erbil city), analyzed and tabulated for the 102 boreholes. The locations of the boreholes were selected to ensure a uniform distribution throughout the study area. The borehole locations are shown in Figure 2.
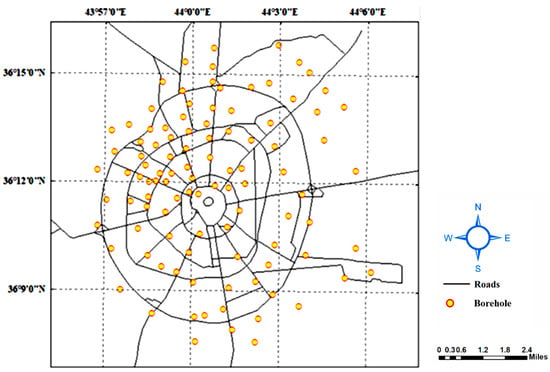
Figure 2.
Borehole locations in the study area.
3. Methodology
The methodology of the study involved collecting data from the field in Erbil city center and analyzing it using both GIS and ANNs. The data was processed and analyzed using these tools to gain insights and conclusions about the study area. The flow chart represents in Figure 3 the methodology of this study as a tool to help readers understand the process used. A flow chart can show the different steps involved in integrating GIS, ANN, and lab analyses, making it easier for readers to follow and comprehend the study’s methodology.
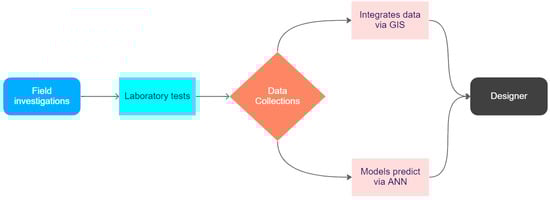
Figure 3.
Flow chart showing in a simple way the methodology adopted in the present study.
3.1. Data Collection
In this study, the results of site investigations and numerous series of soil laboratory tests were collected from 102 borehole locations that cover the main part of the region. Soil investigation included drilling boreholes, taking both disturbed and undisturbed soil samples at 1–meter intervals from 1.0 m to 9.5 m depth, and various field tests. Laboratory work included a series of geotechnical tests to determine the soil index properties, sieve analysis, compressibility, settlement, and shear strength.
A sample of the data collected from the laboratory and field tests is presented in Table 1. This table includes some statistical information (e.g., min. values, max. values, average values, and standard deviation of the input and output data). All data of the study could find in Appendix A as a Table A1.

Table 1.
Inputs and output of the present study.
3.2. Geographical Information Systems (GISs)
The results of the soil investigation and field and laboratory tests were employed to create a digital database for the study region. A database of geotechnical properties was used to provide the input values for the mapping software. In this study, the data were analyzed and presented as maps using ArcGIS (10.7) software. Deterministic methods (inverse distance weighting) were used to create maps and models of spatial data, which rely on probability and uncertainty. Deterministic methods use a fixed set of rules or algorithms to create maps and models, unlike geostatistical methods used for analyzing and modeling spatial data [11]. These methods are commonly used to analyze patterns, relationships, and trends in large, complex datasets.
Some of the most commonly used deterministic methods in ArcGIS include:
- Interpolation: This method is used to predict values at unsampled locations based on observed data. Interpolation methods in ArcGIS include inverse distance weighting, spline, and triangulated irregular network (TIN) interpolation.
- Buffering: This method is used to create a polygon around a feature that represents a specified distance. Buffers are commonly used in spatial analysis to identify areas that are within a certain distance of a feature of interest.
- Overlay: This method is used to combine two or more maps based on a set of rules or conditions. Overlays can be used to create a new map that shows the spatial relationships between features in the input maps.
- Reclassification: This method is used to change the values of a raster or vector layer based on a set of rules or conditions. Reclassification is often used to simplify complex data or to create new data layers based on existing data.
- Extraction: This method is used to select features from a map based on a set of conditions or rules. Extractions can be used to create new data layers that contain only the features that meet specific criteria [11].
The resulting digital maps illustrate the soil formation patterns, distribution, and geotechnical properties of soils at different depths. These maps simplify and help designers and site engineers make the right decisions in the construction of projects. The aim of drawing digital maps using the GIS method was to illustrate the bearing capacity of foundations at three different depths. In this study, the bearing capacity was estimated using two methods. The first Meyerhof method (1963) used shear strength parameters for (10 × 10 m). In the second method, standard penetration numbers were used for bearing capacity estimation [28].
3.3. Statistical Analysis
To make a correlation between the geotechnical properties, the data obtained from the soil investigation of all boreholes in the study area were correlated by MINITAB 17 software. For instance, correlations were made between the SPT values of soil strata with the shear strength parameters of soils and the ultimate bearing capacity. This method is used to find a correlation between the response (Y) and predictor (X) using regression analysis, which is an extensively used method for analyzing multifactor data.
3.4. Neural Network Model
The process for creating an artificial neural network is assumed by using the Matlab application. This study aims to make models by an artificial neural network. The network model developed was formed from data collection of geotechnical properties of soils in the study area. The ANN analysis result aims to predict SPT N-value and bearing capacity using the identical algorithm, the Back-propagation algorithm, and the same activation function. The network architecture was chosen using hidden layers and varying the number of neurons in the hidden layer. The relation number of neurons in the hidden layer is between 15 and 18 according to previous researches [29,30]. The network performance that has the smallest error and the correlation coefficient value that is proximate to 1 is most suitable for data predictions. Root Mean Squared Error (RMSE) is a commonly used evaluation metric in ANN models. RMSE measures the difference between the predicted and actual values, and it is expressed in the same units as the target variable. A low RMSE value indicates that the predictions are close to the actual values, while a high RMSE value displays that the predictions are far from the actual values. In ANN models, RMSE is used to evaluate the performance of the model and determine the quality of the predictions. A lower RMSE value shows a better fit between the predictions and the actual values and a more accurate model. In this research, the R2, RMSE, and MAE values of the estimated and actual target parameters are computed in the implementation evaluation of regression models. The R2, RMSE, and MAE represented mathematically as Equations (1)–(3):
where ymea, ypre, and ym represent the average of existing output, predicted output, and actual output, respectively. N denotes for all number of data. The degree of fitting is raised with R2 immediacy to 1. RMSE and MAE are utilized to assess the model’s prediction capability. For the RMSE and MAE, the prediction model will be more exact and its accuracy will be higher with a smallish value.
Figure 4 illustrates the structure of neural network models to predict SPT N value as output with two models: (a) using input as (LL%, PL%, PI%, WC, cohesion, ϕ, Fine content) and (b) using inputs as (LL%, PL%, PI%, WC, ϕ, Fine content). The structures of neural network models to predict ultimate bearing capacity are presented in Figure 5. The parameters were used as input in two models: (c) (LL%, PL%, PI%, WC, cohesion, ϕ, Fine content) and (d) (LL%, PL%, PI%, WC, ϕ, Fine content).
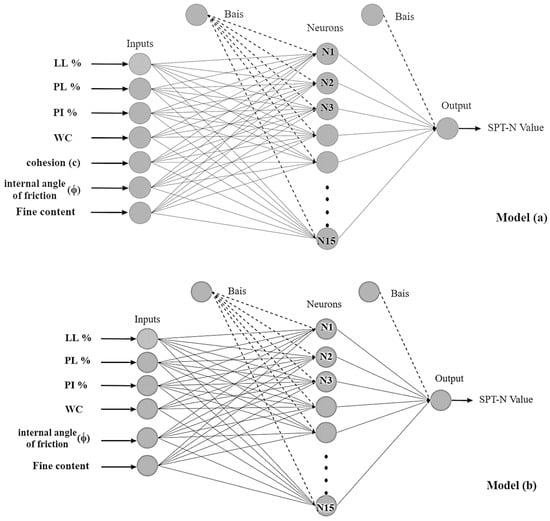
Figure 4.
Structure of neural network models (a) and (b) to predict SPT-N value.
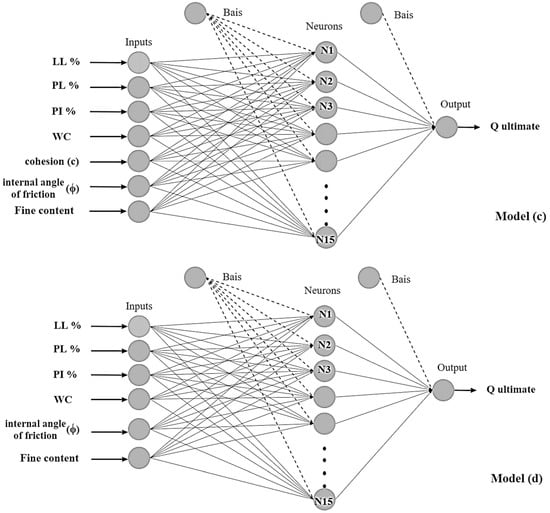
Figure 5.
Structure of neural network models (c) and (d) to predict Q-ultimate.
4. Results and Discussions
4.1. Modeling of Soil Properties Using GIS Maps
GIS maps of the soil properties of the study area were produced. These maps included the distribution of the soil fines content, natural water content, liquid limit, plastic limit, cohesion, angle of internal friction, compression index, rebound index, SPT–N values, and bearing capacity of foundations at three different levels (1.5 m–3.5 m, 3.5 m–6.5 m, and 6.5 m–9.5 m). The soil characteristics at different depths were interpolated for the survey area to show the distribution of these properties in a clear way. In general, the soil characteristics in all the maps were divided into six major legends, each of which was represented by a unique color.
4.1.1. Fines Content Model
Fines content in soils is one of the most significant parameters that affect soil behaviors such as shear strength, compressibility, plasticity, and indirectly, the bearing capacity of foundations [31]. The results presented in Figure 6 indicate that the majority of the study area in Erbil city center has a high fines content. According to the figure, the fines content in most of the area is greater than 81%, meaning that the proportion of soil particles that are smaller than 0.075 mm in diameter is high. This high fine content will likely have significant effects on the soil’s engineering properties, such as its shear strength, compressibility, and plasticity. The impact of soil properties on its ability to support loads, resist deformation, and transmit loads must be carefully considered in future construction and development projects in the area. The results from Figure 6 provide crucial information for engineers and planners in Erbil city center, emphasizing the need to consider the fines content of soil in decision-making for development projects. The compression level of soil becomes crucial when large particles are replaced by fine particles, and the impact of fines content is more pronounced when the soil is near saturation. This has been noted by other researchers in the field [31,32,33]. The relationship between natural water content and fines content is intertwined and cannot be evaluated separately. Sometimes, improving natural water content weakens the effect of fines content on soil shear strength, due to the sensitivity of fines to changes in natural water content. In dry conditions, fines do not significantly affect soil behavior due to the influence of suction [34,35].
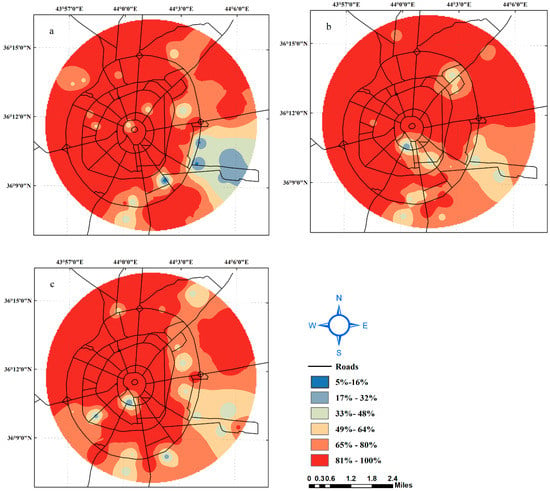
Figure 6.
Fines content at depths (a) 1.5–3.5 m. (b) 3.5–6.5 m. (c) 6.5–9.5 m.
4.1.2. Atterberg Limits
Atterberg limits can be used to characterize soil behavior and classification, including the swelling potential of expansive soils, the consistency and plasticity of the soil. Two essential index properties can be obtained from the values of the natural water content: liquid limit and plastic limit [36]. Soil water content affects its consistency. A high water content in clay makes it behave like a liquid due to the reduction of attraction between clay particles caused by the excess water between the particles [37]. The liquid limit was used to determine the consistency of the fine-grained soil. This measure of soil consistency is useful for estimating soil consolidation properties and calculating the acceptable bearing capacity and settlement of foundations [38].
The variations in the soil liquid limit throughout the study area at the three different depths are illustrated in Figure 7. The results of the analysis of liquid limit values in the study area show that a significant portion of the soils have a liquid limit range between 40% and 52%. This range indicates the presence of low plastic clay, which is a type of soil that has low resistance to deformation when subjected to stress and is prone to collapsing. The presence of low plastic clay in high percentages in the study area is an important factor to consider in construction and development projects, as it may impact the stability and integrity of structures built on these soils. Additionally, the observation of soils with high liquid limit values (greater than 53%) in relatively central regions is also important. These central zones are considered critical points in the study area, as soils with high liquid limit values are prone to deformation and instability. These critical points need to be carefully evaluated and addressed in any future construction and development projects in the area to ensure the stability and integrity of the structures built on these soils. Numerous researchers have investigated the relationship between the liquid limit of soils and swelling potential. Some types of clay minerals with a high cation exchange capacity (CEC) suffer from expansion and an increase in the volume of the available water [38,39,40,41].
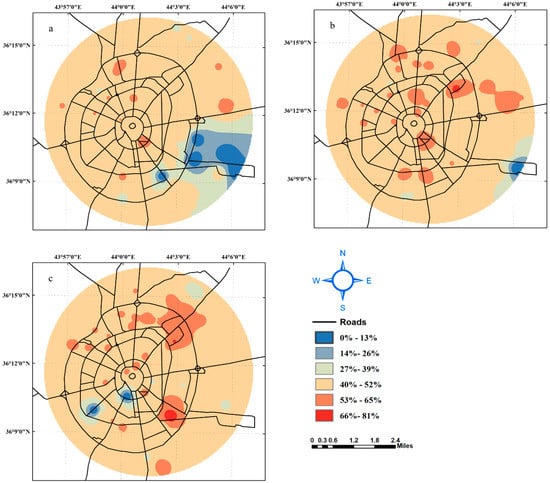
Figure 7.
Liquid limit of soils at depths (a) 1.5–3.5 m. (b) 3.5–6.5 m. (c) 6.5–9.5 m.
Plasticity is one of the most important features of clay, and the crystallinity of clay minerals is the primary source of this plasticity [39,40,41]. Soil is plastic when the water content is below the liquid and plastic limits. The plastic range, which is the difference between the two limit values, is called the plasticity index [42]. The plastic limit provides geotechnical engineers with indirect information about the activity, toughness index, and optimum moisture content of soils. Figure 8 shows the plastic limit variation in the study area at different depths. The analysis of the figure reveals that half of the study area has a plastic limit of soils that ranges between 19% and 24%, while the other half has a plastic limit ranging between 25% and 30%. This indicates that the soils in the study area have different levels of plasticity, which is a measure of the soil’s ability to change shape without breaking under stress. The presence of soils with low plastic limits (Figure 8a) in small zones in the southeast direction is also an important observation. Soils with low plastic limits are less plastic and more brittle, making them more prone to cracking and failure under stress. These areas need to be carefully assessed and addressed in future construction projects in the area to ensure the stability and reliability of the structures built on these soils.
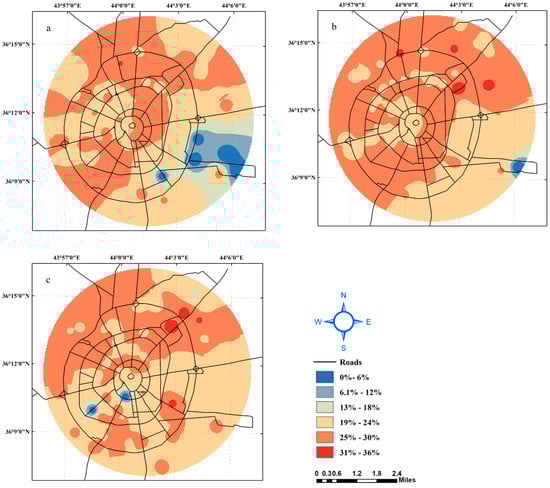
Figure 8.
Plastic limit of soils at depths (a) 1.5–3.5 m. (b) 3.5–6.5 m. (c) 6.5–9.5 m.
4.1.3. Natural Water Content Model
The natural water content can be considered a parameter that profoundly affects the geotechnical properties [43,44]. Figure 9 shows the variations in the natural water content in Erbil City. The figure presents the water content at depths of 1.5 m–3.5 m, 3.5 m–6.5 m, and 6.5 m–9.5 m. The results show that the natural water content in the study area is mostly found to range between 16% and 20% at the three levels of investigation depths. The natural water content of soils is an important factor to consider in construction and development projects, as it affects the soil’s stability, bearing capacity, and compressibility. Soils with high natural water content are more susceptible to instability, while soils with low natural water content are more prone to drying and cracking.
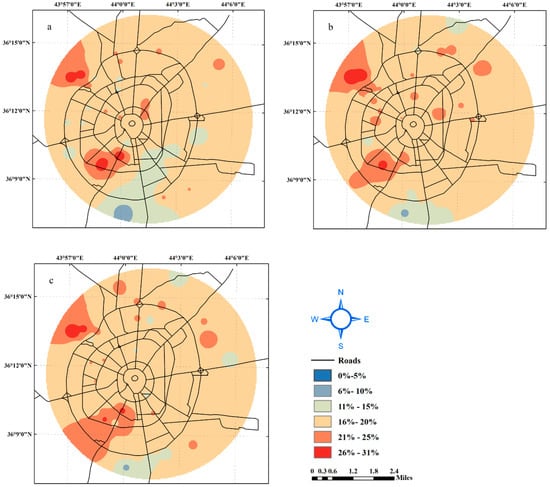
Figure 9.
Natural water content of soils at depths (a) 1.5–3.5 m. (b) 3.5–6.5 m. (c) 6.5–9.5 m.
This is consistent with the findings of many researchers working in this region [43,44]. The water table, during the time of exploration, was in very high depths below the natural ground level (NGL), meaning the groundwater was relatively shallow. The water table fluctuates seasonally, with an increase during spring. The soil above the water table affects its strength and compressibility, as more moisture results in decreased strength and increased compressibility. Saturated soil below the water table creates settling issues as the consolidation process reduces the natural water content under stable load.
4.1.4. Shear Strength Parameters
The shear strength of soils is a crucial parameter in many foundation engineering designs. It refers to the ability of soil to resist forces that cause slipping or sliding along a plane within the soil. The shear strength of soils is important in determining the bearing capacity of shallow and deep foundations, slope stability, tunnels, and lateral pressure on structures [28]. The soil’s shear strength comes from its cohesive strength (c) and frictional strength, represented by the angle of internal friction (ϕ). Cohesive strength is due to the bonding force between soil grains and the binding material, while frictional strength arises from the friction, interlocking, and rolling of soil grains [44,45,46,47]. The strength of any soil decreases as the shear strain and expansion or contraction increase or decrease, respectively, with respect to the soil density due to applied loads. Shear strength parameters are widely utilized by different standard equations in the design of foundations, particularly in empirical equations. [48].
Figure 10 and Figure 11 show the variations in the cohesion and angle of internal friction, respectively. The combination of these two parameters produces the shear strength of the soil, its variation throughout the study area, and the soil depth. Most of the soils in the study area at shallow depths (1.5 m–3.5 m) had cohesion values between 76 kPa and 100 kPa. However, there were relatively small regions with cohesion values greater than 100 kPa and less than 50 kPa. The area covered with soil had cohesion values greater than 100 kPa, which increased with the depth. The results of the figures are in agreement with the distribution of the fines content in the study area. The fines content of soils in the majority of the study area was found to be greater than 80%, and this high fine content is likely contributing to the high cohesion values in the area.
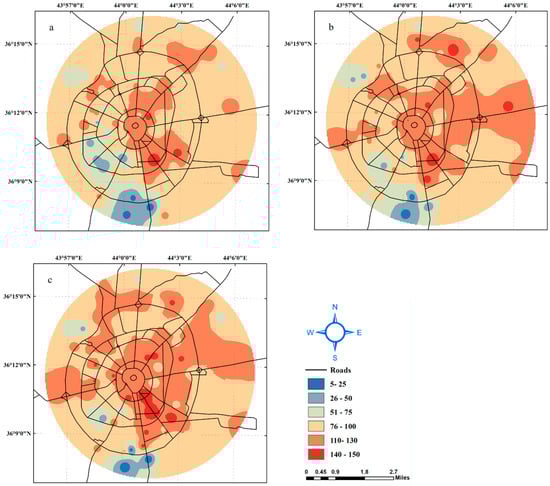
Figure 10.
Cohesion of soils (kPa) at depths (a) 1.5–3.5 m. (b) 3.5–6.5 m. (c) 6.5–9.5 m.
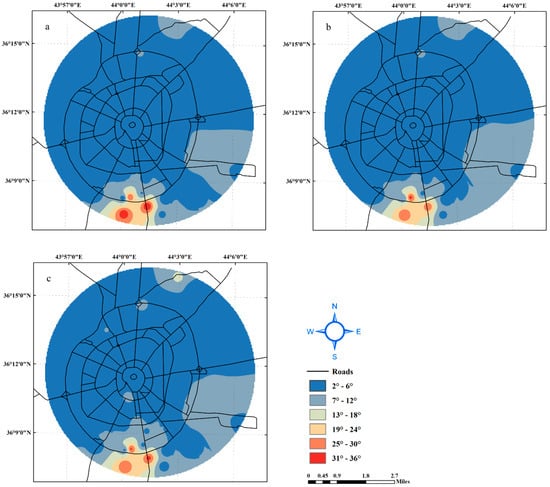
Figure 11.
Angle of internal friction of soils at depths (a) 1.5–3.5 m. (b) 3.5–6.5 m. (c) 6.5–9.5 m.
Soils with high fines content produce higher cohesion values [49]. The angle of internal friction is a parameter of the soil shear strength and is employed in bearing capacity estimation, slope stability analyses, and estimation of soil lateral earth pressures. The soils in the study area were found to have an angle of internal friction between 2° and 6°, which was found to be similar at all three depths in this investigation. The east-south part of the study area had soils with an angle of internal friction ranging from 7° to 12°. These results indicate that the angle of friction values found in the study area are consistent with those found in similar studies in the region. The angle of internal friction is an important parameter in determining the shear strength of the soil, and these results suggest that the soils in the study area have moderate to low shear strength values. The results of the figures can be used to identify zones of high and low shear strength, which are important in determining the suitability of the soil for different types of structures. The information can also be used to design and construct structures that are appropriate for the soil conditions in the area [47,50].
4.1.5. Consolidation Parameter Model
The consolidation parameters (compression index and swelling index) of saturated clayey soil should be checked during the analysis and design of the foundations [51]. In this study, the distribution of the compression index and swelling index throughout the study area and their variation with the soil depth were investigated. Figure 12 shows that the compression index of soils in the study area, Erbil city center, has a range of values between 0.17 and 0.22, with a lower value found at greater depths. The compression index is an important factor in determining soil compression and consolidation. The results suggest that the shallow soil strata in the study area have high consolidation and settlement potential, while the settlement potential is expected to decrease with depth due to the variation in compression indices.
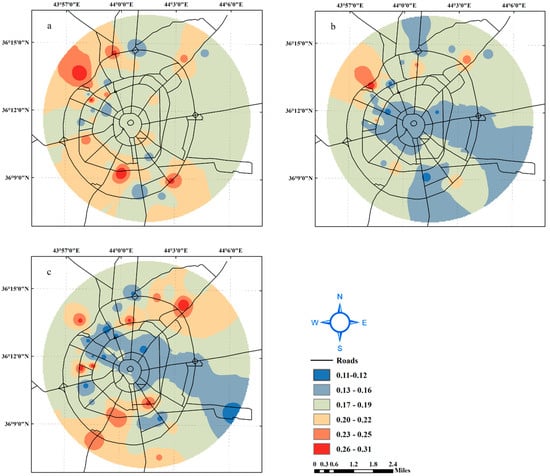
Figure 12.
Compression index, Cc, of soils at depths (a) 1.5–3.5 m. (b) 3.5–6.5 m. (c) 6.5–9.5 m.
The rebound index is an important parameter in geotechnical engineering as it represents the soil’s tendency to expand or contract under changes in moisture content. A high rebound index value designates that the soil is more susceptible to expansion and contraction, whereas a low value indicates that the soil is more stable. The results shown in Figure 13 suggest that the soil in the study area has moderate to low rebound index values in the range 0.015–0.078, indicating that the soil is relatively stable and less likely to expand or contract under changes in moisture content. This indicated that there was no soil swelling or shrinkage potential in the study area. The minimum values showed a consistent trend across all levels in the study area (Figure 13a), with the highest swelling index values located north of Erbil at the first level and in the south at the second and third levels. Most of the study area had moderate parameter values of 0.015–0.078. The consolidation parameters were consistent with previous studies [47,50,52].
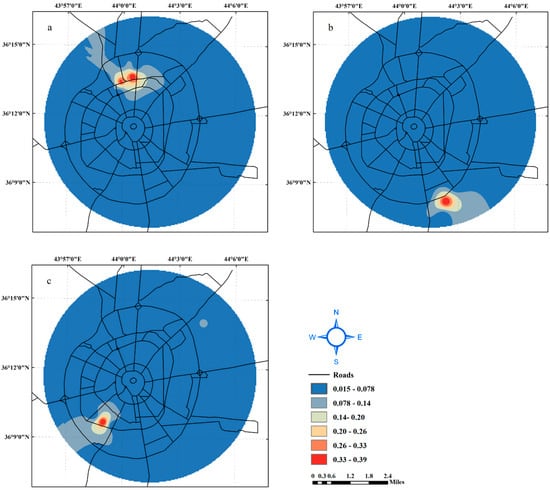
Figure 13.
Rebound index, Cr, of soils at depths (a) 1.5–3.5 m. (b) 3.5–6.5 m. (c) 6.5–9.5 m.
4.1.6. Standard Penetration Test Model
The SPT is one of the many standard in situ tests used to identify soil type, stratigraphy, and relative strength measures during site investigations [53,54]. The eastern part of Erbil had higher SPT values, which is attributed to the higher unit weight of soils and the presence of stiffer and stronger soil layers as shown in Figure 14. The SPT values of soils at a depth of 6.5 m–9.5 m was mostly between 35 and 60, and the range increased from the west to the east of the study area. The increase in the SPT values with increasing depth is due to the influence of several factors. Soil type affects the SPT values as different soil types have different characteristics such as density, porosity, and strength, which all impact the SPT results. Unit weight, or the weight per unit volume of soil, is also a factor, as a higher unit weight results in higher SPT values. Confining pressure, the pressure applied to the soil from the surrounding material, also increases with depth, leading to higher SPT values. Overall, the results of SPT tests provide a good indication of the soil strength and its variation throughout the study area. To confirm the relationship between the SPT values and shear strength parameters (cohesion and angle of internal friction), data obtained from the boreholes were correlated. Figure 15 and Figure 16 illustrate the correlation between the SPT values and shear strength parameters for the soils within the study area. The figures evidently show that there is a good correlation between the SPT values, cohesion, and angle of internal friction. Generally, most values of SPT–N distribution from the center to the west of Erbil City were found to be between 17 and 48, while in the northeast and southeast, the values were higher than 50. As mentioned in various studies [55,56,57], the results of SPT–N showed that the soil in Erbil city is medium to very dense.
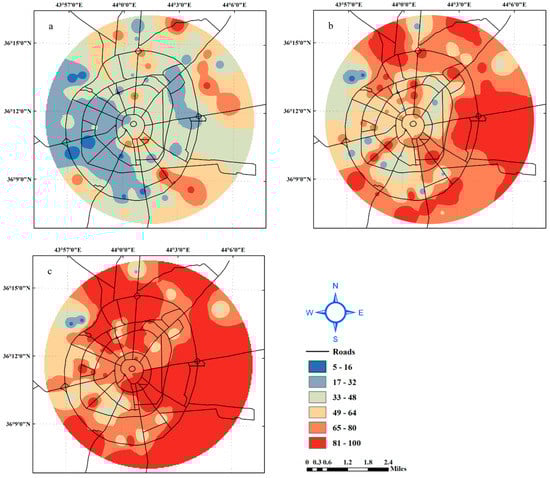
Figure 14.
SPT-N values in site at depths (a) 1.5–3.5 m. (b) 3.5–6.5 m. (c) 6.5–9.5 m.
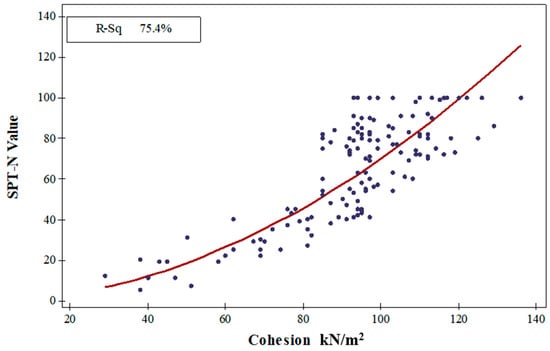
Figure 15.
Correlation of SPT-N values with cohesion of soils in the study area.
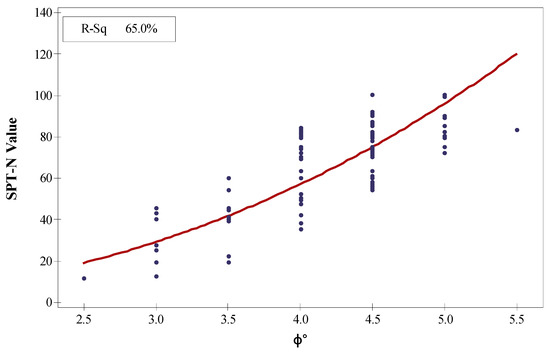
Figure 16.
Correlation of SPT-N values with angle of internal friction (ϕ) of soils in the study.
4.1.7. Bearing Capacity
The design of a footing depends on its soil’s bearing capacity. Many methods for estimating soil bearing capacity exist, relying on factors such as soil shear strength, footing type, and SPT value [58]. In this study, the soil strata’s ultimate bearing capacity was estimated using two methods, one based on shear strength parameters using Meyerhof’s equation, and the other based on SPT-N values. The variation in the soil strata’s ultimate bearing capacity based on Meyerhof’s equation is shown in Figure 17.
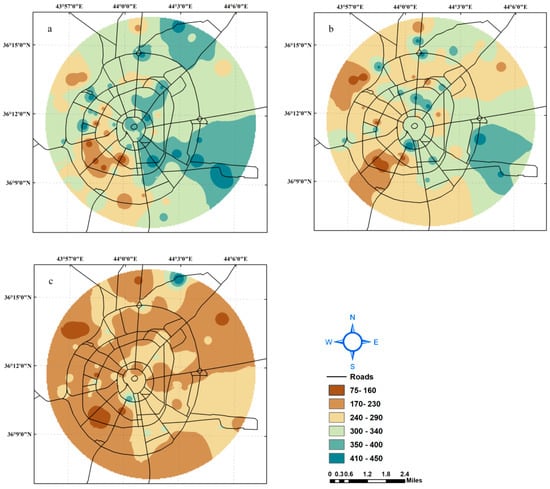
Figure 17.
Ultimate bearing capacity according to Meyerhof’s equation at depths (a) 1.5–3.5 m. (b) 3.5–6.5 m. (c) 6.5–9.5 m.
Figure 18 shows the ultimate bearing capacity of the soil strata in the study area at three different depths that were estimated from the SPT values. Changes in the ultimate bearing capacity were observed throughout the study area. The ultimate bearing capacity of the soil strata in the study area is a significant factor in the design of shallow and deep foundations. The results from Figure 18 indicate that the majority of the study area at shallow depths had an ultimate bearing capacity be-tween 170 kPa and 940 kPa. However, there were some small areas with lower ultimate bearing capacities. The ultimate bearing capacity increased with increasing depth, which can be attributed to the increase in soil confining pressure and soil unit weight. These findings are useful in determining the design and load-bearing capacity of foundations in the study area.
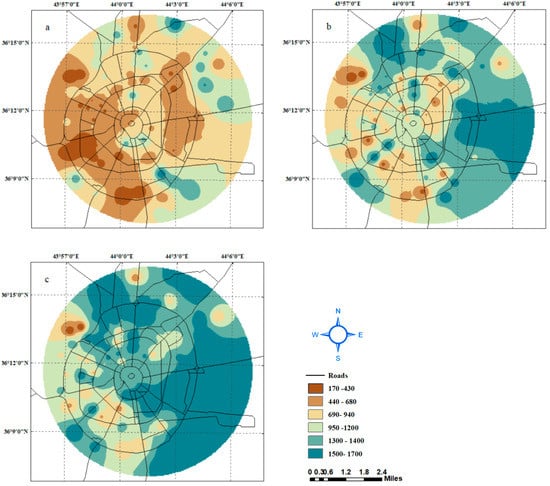
Figure 18.
Ultimate bearing capacity from SPT-N value at depths (a) 1.5–3.5 m. (b) 3.5–6.5 m. (c) 6.5–9.5 m.
Figure 19 presents the correlation between the ultimate bearing capacity from Meyerhof’s equation and the SPT values of the soils within the study area. This figure indicates a good correlation between the SPT values and the ultimate bearing capacity of the foundations. The correlation between the ultimate bearing capacity from the SPT values of the soil strata within the study area and soil cohesion (shear strength parameter). The ultimate bearing capacity from Meyerhof’s equation and the ultimate bearing capacity from the SPT values of the soil strata within the study area were correlated, and the results are presented in Figure 20. The estimation of ultimate bearing capacity from the Standard Penetration Test (SPT) values is a relatively simple method compared to other methods that require more experimental tests and complex equations established on the shear strength parameters of the soil. The estimation of ultimate bearing capacity from SPT values is based on empirical correlations and has been widely used in the field of geotechnical engineering. The advantage of this method is its simplicity; however, it may not accurately reflect the actual soil conditions, which can be affected by factors such as soil type, stratigraphy, and loading conditions [59].
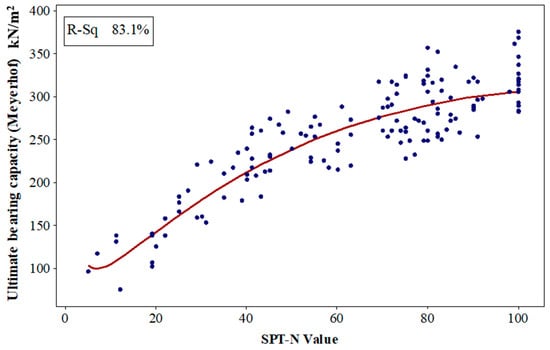
Figure 19.
Correlation of ultimate bearing capacity (Meyerhof) with SPT-N values of soils in study area.
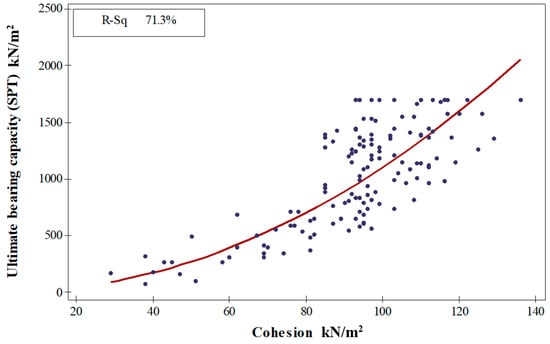
Figure 20.
Correlation of ultimate bearing capacity (SPT-N) with soil cohesion of soils in study area.
4.2. Artificial Neural Network Models
ANN models are commonly used for regression and classification tasks, including prediction problems. ANN models consist of interconnected nodes, or artificial neurons, that process and transmit information. The nodes are organized into layers, and the connections between them can be adjusted during the training process to minimize the error between the predicted and actual outcomes. ANN models have been widely used in various fields due to their ability to handle complex relationships and make accurate predictions. The relationship between the predicted original SPT values and bearing capacity in the training data and test data was demonstrated in four models that have an acceptable R2 and the smallest error. After input and output data are gathered and structured, training and test sets were established. 70% of the data were used for training and 15% used for testing and 15% for validation of the total data of boreholes. Predictions for SPT-N value from two models were developed.
4.2.1. Validation of Interpolations Based on Semivariograms
The transformed data’s spatial autocorrelation is modeled using semivariograms/covariance modeling for SPT-N values at depth 1.5–3.5 m, depicting the similarity decrease between data points as their distance increases. Binned values (red dots) are generated by grouping semivariograms/covariance points using square cells, while average points (blue crosses) are generated by binning empirical points in angular sectors. Binned points show local variation, while average values show smooth variation. A stable type model (dark blue line) is fitted to the empirical variogram for the measured data points.
At h = 0, the semivariogram should be 0. However, at an infinitesimally small separation distance, the semivariogram often exhibits a nugget effect, which is some value greater than zero. In this case, the nugget effect exists which is zero. The range is the distance at which the model levels out (5750.634). Locations closer than the range are spatially auto correlated, while farther locations are not. The partial sill is the sill minus the nugget (462.1716). The lag size is the distance class size (674.7548) with 12 lags. Semivariogram values are shown in Figure 21 with higher values in orange/red and lower values in blue/green.
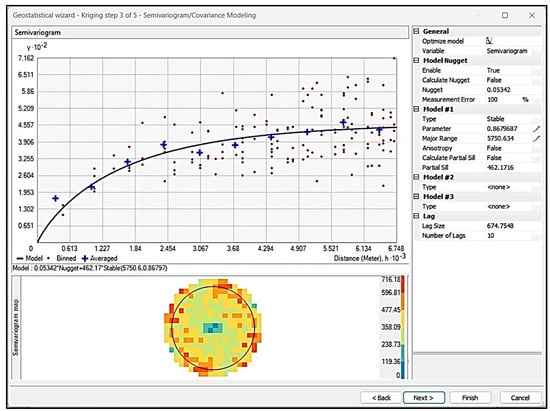
Figure 21.
Semivariograms/Covariance Modeling.
Kriging estimates unknown spatial values. The search neighborhood step involves selecting nearby points with significant influence on the prediction location, determined by spatial auto-correlation. The method eliminates irrelevant points and weights nearby points using a search neighborhood of adjacent points, radius, and number of sectors to estimate values at the unknown location. Accurate neighborhood identification and selection of nearby points are crucial for successful kriging. As shown in Figure 22, five neighboring points are selected and a circle with four sectors is selected. The points highlighted in the data give an indicator of the weights associated with each point, and these weights are used to estimate the value at the unknown location, which is at the center of the crosshair.
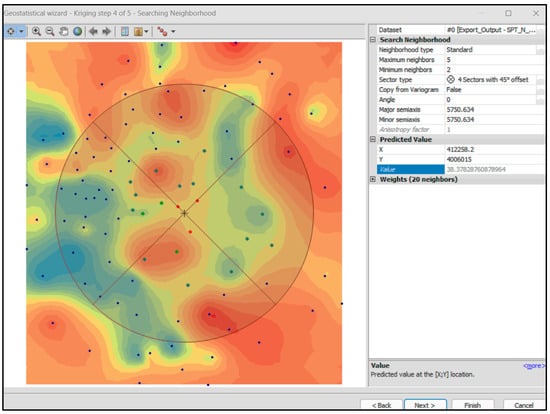
Figure 22.
Searching Neighborhood Dialog Box of Ordinary Kriging.
4.2.2. Prediction for SPT-N Value
In Figure 23 and Figure 24 the results of the ANN model (a) show a good agreement between the predicted and measured SPT-N values, with an R2 of 0.92 for the training data and 0.81 for the testing data. The model uses Atterberg limit values, water content, cohesion, and internal friction as input variables and predicts the SPT value as its output. On the other hand, to predict SPT N value as output with (LL%, PL%, PI%, WC, ϕ, Fine content) as input, the result showed R2 values of 0.90 and 0.8 for training and testing, respectively. As mentioned in previous studies [60], the predictions of the SPT values in model (a) and model (b) were conducted with more superficial R2 values that give a significant agreement for using ANN modeling in geotechnical engineering that helps the engineering to be utilized in the design of infrastructures.
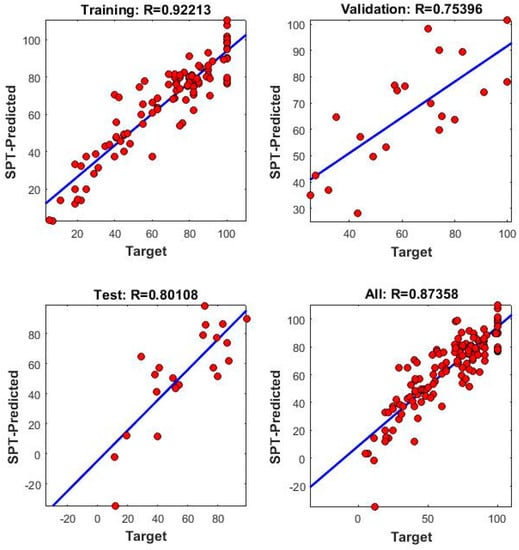
Figure 23.
Model (a): relations between (LL%, PL%, PI%, WC, c, ϕ, Fine content) and SPT-N.
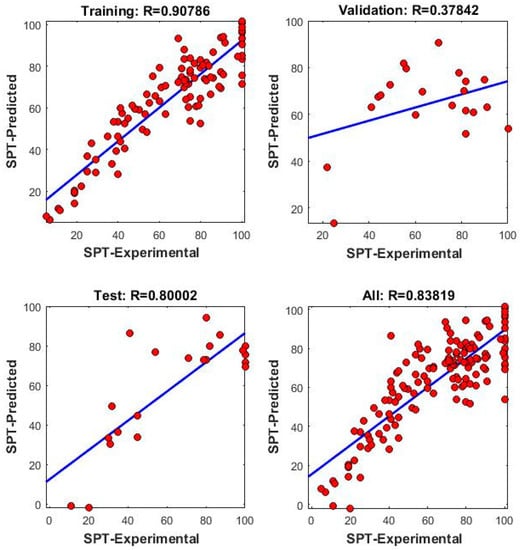
Figure 24.
Model (b): relations between (LL%, PL%, PI%, WC, ϕ, Fine content) and SPT-N.
4.2.3. Prediction of Ultimate Bearing Capacity
The prediction of the ultimate bearing capacity of soil using ANNs is a machine learning approach that involves training a neural network model with a dataset of soil properties and corresponding ultimate bearing capacity values. The trained model can then be used to predict the ultimate bearing capacity of new soil samples based on their properties. Advantages of ANN prediction include the handling of non-linear relationships between soil properties and ultimate bearing capacity, the ability to incorporate complex relationships between soil properties and ultimate bearing capacity, and the ability to handle large datasets with many input variables.
To determine the best prediction results for the ultimate bearing capacity, two models were used. The inputs and outputs of the models are listed in Table 2 along with the value of R2, which is a measure of the goodness of fit of the model to the data. R2 ranges from 0 to 1, with a higher value indicating a better fit between the model and the data. The R2 value provides an indication of how well the models are able to predict the ultimate bearing capacity based on the inputs.
Table 2.
ANN models for Q-Ultimate prediction.
The results of bearing capacity prediction using ANN modeling show similarities with the results of previous studies [60]. In Figure 25 and Figure 26 the relationship between the predicted ultimate bearing capacity and the original ultimate bearing capacity on the training and testing data are illustrated.
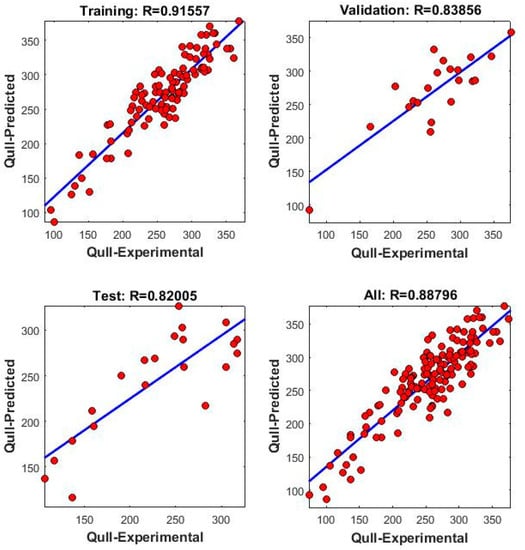
Figure 25.
Model (c): relations between (LL%, PL%, PI%, WC, c, ϕ, Fine content) and Q ultimate.
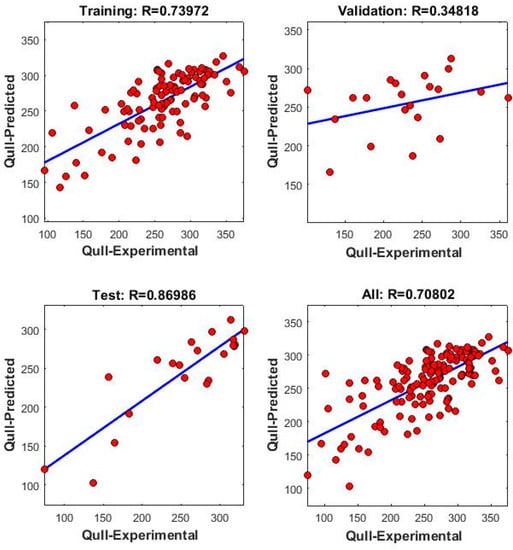
Figure 26.
Model (d): relations between (LL%, PL%, PI%, WC, ϕ) and Q ultimate.
Model (c) has a high R2 value, indicating a strong correlation between the predicted and actual values, and a low variance in the residuals. The high R2 value for the training data (0.91) indicates that the model is able to fit the training data well, while the R2 value of 0.82 for the testing data suggests that the model has good generalization ability and can predict unseen data with a certain degree of accuracy. In Model (d), the decrease in R2 value is likely due to the absence of the cohesion value as an input. Cohesion is an important factor that affects the bearing capacity of soil, so its absence in the input could result in a decrease in the accuracy of the model. This highlights the importance of considering all relevant factors in the input variables of the model to improve its accuracy and predictability.
Soil cohesion is a measure of the shear strength of soil, which determines its ability to support loads. The results of research in geotechnical engineering have shown that soil cohesion is the most important factor in estimating soil bearing capacity. This is because it determines the resistance of soil to sliding or deformation under load, and is essential for ensuring the stability of structures built on the soil. Therefore, accurate determination of soil cohesion is crucial for safe and effective design of geotechnical structures.
4.2.4. Percentage Error of ANN Models
Figure 27 and Figure 28 demonstrate the error percentage lines for model (a) and (b) outcomes referring to the difference between the predicted values and the actual values. It is a measure of the accuracy of the model’s predictions. A lower error percentage indicates a more accurate model, while a higher error percentage means that the model is less accurate. The acceptable error percentage depends on the specific application and the acceptable level of error for that particular field. In some cases, a low error percentage, such as 1–2%, may be acceptable, while in others, a higher error percentage may be acceptable if the cost of a lower error is too high [61]. It is important to note that no model can be 100% accurate and some level of error is always present. The goal is to reduce the error to the lowest possible level while still making predictions that are useful and relevant.
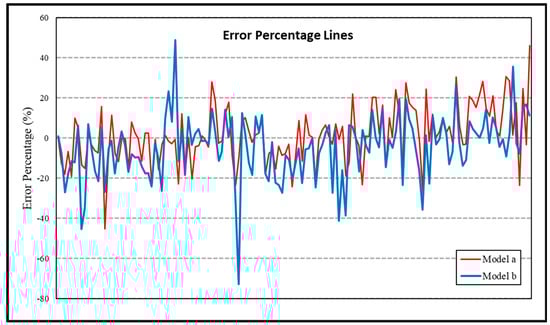
Figure 27.
Error percentage lines of model (a) and (b) for prediction SPT-N value.
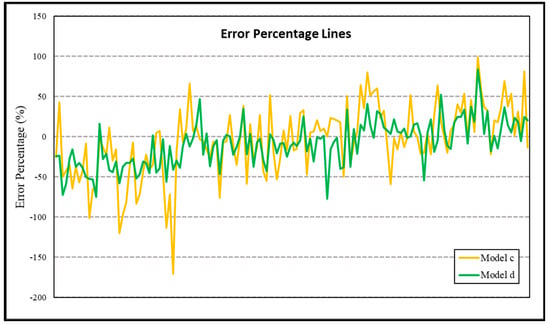
Figure 28.
Error percentage lines of model (c) and (d) for prediction Q ultimate.
4.2.5. Analysis of Models
Sensitivity analysis is an important aspect of model evaluation, as it helps to assess the impact of individual model parameters on the final results. The absence of a sensitivity analysis in the study you are referring to could limit the understanding of the model’s behavior and the confidence in the results obtained. Analysis of models is particularly important when using ANOVA, as the parameters of these models can have a significant impact on the spatial structure of the data. By conducting a sensitivity analysis, the researchers could determine the robustness of the model results. The sensitivity analysis to evaluate the effect of each model parameter based on the semivariograms shown in Table 3.
Table 3.
Analysis of models and effect each parameter on the output of prediction.
A p-value less than 0.05 is commonly used as a threshold for determining statistical significance in hypothesis testing. In this context, a p-value less than 0.05 for a particular model parameter means that the results suggest a statistically significant relationship between the parameter and the outcome variable being modeled.
In this study, a p-value less than 0.05 for a particular model parameter would indicate that the parameter has a significant impact on the model results. This information can be useful in understanding the underlying relationships in the data and in guiding further analysis or interpretation of the results. However, it is important to consider other factors such as the sample size, the quality of the data, and the overall fit of the model in evaluating the reliability and robustness of the results.
5. Conclusions
This study focuses on developing maps for soil geotechnical properties that are widely utilized by geotechnical engineers in foundation design capacity. The main conclusions are as follows. An artificial neural network (NN) model was established for estimating SPT-N value and ultimate bearing capacity:
- GIS is an effective tool that can be used by engineers to analyze the preliminary exploration of geotechnical sites. Information from 102 boreholes, considering the main geotechnical properties, was collected, evaluated, and used as input data for GIS analysis.
- This information suggests that a significant portion of Erbil city has soil with a high proportion of fine-grained materials, such as clay and silt. High fines content can impact the soil’s physical and engineering properties, such as its compressibility, permeability, and shear strength. The presence of high fines content can also increase the susceptibility of soil to swelling and shrinkage, which can lead to instability in structures built on or in the soil. The small zones in the southeast of the study area with lower fine contents may have different soil characteristics and may offer potential sites for structures that require more stable soil conditions. These findings are important for the design of infrastructure and buildings in the city.
- Atterberg limits in most of Erbil City were found to be between 40% and 52%, and 19% and 30% for the liquid and plastic limits, respectively. This indicates the high presence of low–plasticity clay and clayey silt. The results of the analysis of liquid limit and plastic limit values in the study area provide important information for engineers and planners in Erbil city center. They highlight the presence of low plastic clay in high percentages in the study area, as well as the need to carefully evaluate critical points with high liquid limit and plastic limit in future construction and development projects.
- Digital mapping of shear strength parameters showed that most soil strata at three different depths had an internal friction angle between 2° and 6°, and the cohesive strength ranged between 76 kPa and 130 kPa. The results of the cohesion values show that the soils in the study area at shallow depths have moderate to high cohesion values, and that the soils with high cohesion values tend to be located in areas with high fines content. However, the results of the angle of internal friction show that the soils in the study area have moderate to low shear strength values, with the soils in the east-south part of the area having slightly higher shear strength values. These findings are important in determining the suitability of the soil for different types of structures and in designing and constructing structures that are appropriate for the soil conditions in the area.
- The soil in the study area mostly has a moderate compressibility and resilience, with a moderate to low amount of rebound. The compression index decreases with depth, suggesting that the soil becomes less compressible as one moves deeper into the ground. The rebound index indicates that the soil has a moderate to low ability to recover its original volume after being compressed. These findings provide valuable information for designing structures that are built on or into the soil in the study area.
- SPT values in the study area indicate moderate soil strength in the shallow strata, with a range of 17 to 48. As the depth of the soil strata increases, the SPT values increase and become higher, covering large parts of the study area. This suggests that the soil becomes stronger with increasing depth. The SPT is a widely used in-situ test for measuring soil strength, and these results provide valuable information for the design of foundations and other structures that are supported by the soil. The higher SPT values at greater depths indicate improved soil strength characteristics and can influence the design of these structures in terms of load-bearing capacity and stability.
- This conclusion suggests that the soil in Erbil City is not capable of supporting heavy loads without modification or special design measures. The ultimate bearing capacity is a measure of the maximum weight or load that a soil can support without failure. A value lower than 170 kPa indicates that the soil may not be suitable for supporting heavy structures, such as buildings and bridges, without additional treatment or specialized foundation design. Improving the soil, such as through compaction or stabilization, and utilizing special footing designs, such piles, can increase the soil’s bearing capacity and ensure the stability and safety of structures built on the soil.
- At the preliminary design point, the completed digital geotechnical maps are vital. The designer could use the geotechnical parameters, consolidation characteristics and SPT as an effective visual display tool simply by using the digital values of these parameters for the proposed region, where the necessary decisions can be made.
- The correlation between the SPT values and shear strength parameters for the soils within the study area demonstrated a strong relationship between them.
- The results obtained from the models were compared with those measured from the field tests. It was found that predicted SPT-N values and Q-ultimate bearing capacity are quite close to the measured values. In order to check the prediction performance of the ANN model developed, several performance indices, such as R2, MAPE, and RMSE were also calculated. The ANN model has shown good prediction performance based on the performance indices. Thus, the developed ANN model can be used to predict SPT-N and Q-ultimate bearing capacity from the soil parameters and borehole coordinates. The ANN model’s implementation has also demonstrated that the neural network is a valuable tool to minimize the uncertainties encountered during geotechnical engineering projects. Therefore, using Artificial Neural Networks may provide new techniques and methodologies and minimize the potential inconsistency of correlations. ANN prediction is a useful tool for predicting the ultimate bearing capacity of soil, but it should be used in conjunction with other methods and validated with independent data to ensure accurate predictions.
Author Contributions
Conceptualization, K.Z., Z.B.Q. and A.F.C.; methodology, Z.B.Q.; software, Z.B.Q.; validation, Z.B.Q., A.F.C. and Z.K.; formal analysis, Z.B.Q.; investigation, Z.B.Q.; resources, Z.B.Q.; data curation, Z.B.Q.; writing—original draft preparation, Z.B.Q.; writing—review and editing, A.F.C., Z.B.Q. and Z.K.; visualization, Z.B.Q.; supervision, A.F.C. and Z.K.; project administration, A.F.C. All authors have read and agreed to the published version of the manuscript.
Funding
This research received no external funding.
Institutional Review Board Statement
Not applicable.
Informed Consent Statement
Not applicable.
Data Availability Statement
The data are available from the conforming author upon request.
Conflicts of Interest
The authors declare no conflict of interest.
Appendix A
The data of all boreholes are provided demonstrated in Table A1.
Table A1.
Full data of all boreholes of study area.
Table A1.
Full data of all boreholes of study area.
| BH NO | DEPTH m | X | Y | LL% | PL% | PI% | WC% | c (kN/m2) | Φ (°) | Fine Content | SPT-N Value (kN/m2) |
|---|---|---|---|---|---|---|---|---|---|---|---|
| 1 | 1.5–3.5 | 406,851.5 | 4,009,570 | 46 | 22 | 24 | 28.3 | 51 | 4 | 62.1 | 7 |
| 2 | 1.5–3.5 | 405,972.9 | 4,009,284.2 | 40 | 22 | 18 | 15 | 96 | 3 | 94.1 | 54 |
| 3 | 1.5–3.5 | 407,487.6 | 4,007,947.1 | 47 | 25 | 22 | 18 | 99 | 5 | 91.5 | 57 |
| 4 | 1.5–3.5 | 406,121.1 | 4,008,204.7 | 40 | 22 | 18 | 15.0 | 96 | 3 | 94.1 | 54 |
| 5 | 1.5–3.5 | 407,443.2 | 4,008,702.7 | 50 | 27 | 23 | 20.8 | 109 | 5 | 92.9 | 41 |
| 6 | 1.5–3.5 | 407,941.4 | 4,009,347.7 | 50 | 28 | 22 | 13.9 | 108 | 4 | 91.8 | 45 |
| 7 | 1.5–3.5 | 408,217.9 | 4,008,512.23 | 35 | 20 | 19 | 20.0 | 96 | 4 | 96 | 41 |
| 8 | 1.5–3.5 | 408,997.4 | 4,008,917.8 | 39 | 21 | 18 | 16.3 | 109 | 5 | 89.4 | 45 |
| 9 | 1.5–3.5 | 408,743.4 | 4,009,398.1 | 47 | 25 | 22 | 18.0 | 99 | 5 | 91.5 | 57 |
| 10 | 1.5–3.5 | 408,026.1 | 4,010,406 | 45 | 24 | 21 | 16.6 | 96 | 5 | 95.5 | 63 |
| 11 | 1.5–3.5 | 409,617.8 | 4,011,321.6 | 46 | 27 | 19 | 20.2 | 99 | 5 | 90.7 | 41 |
| 12 | 1.5–3.5 | 408,588.1 | 4,011,780.2 | 45 | 25 | 20 | 19.0 | 97 | 4 | 91.6 | 60 |
| 13 | 1.5–3.5 | 409,762.1 | 4,012,805.4 | 48 | 26 | 22 | 19.7 | 94 | 5 | 81.3 | 75 |
| 14 | 1.5–3.5 | 411,184.2 | 4,011,787.2 | 49 | 23 | 26 | 19.6 | 108 | 4 | 96.3 | 33 |
| 15 | 1.5–3.5 | 411,184.3 | 4,012,540.7 | 47 | 25 | 22 | 15.6 | 105 | 5 | 97.4 | 30 |
| 16 | 1.5–3.5 | 411,247.7 | 4,013,522.9 | 48 | 26 | 22 | 18.4 | 58 | 3 | 92.7 | 19 |
| 17 | 1.5–3.5 | 409,969.9 | 4,010,643.8 | 58 | 31 | 27 | 20.5 | 91 | 4 | 88.9 | 40 |
| 18 | 1.5–3.5 | 409,662.9 | 4,009,977 | 56 | 30 | 26 | 18.8 | 94 | 4 | 69.1 | 42 |
| 19 | 1.5–3.5 | 409,915.1 | 4,009,232.2 | 45 | 24 | 21 | 13.6 | 77 | 3 | 95.9 | 29 |
| 20 | 1.5–3.5 | 410,862.1 | 4,009,607.35 | 44 | 25 | 19 | 18.3 | 69 | 5 | 94.5 | 30 |
| 21 | 1.5–3.5 | 411,994.6 | 4,009,216.9 | 42 | 23 | 19 | 19.2 | 70 | 4 | 98.2 | 29 |
| 22 | 1.5–3.5 | 411,166.1 | 4,010,438.9 | 50 | 26 | 24 | 17.9 | 95 | 5 | 92.2 | 58 |
| 23 | 1.5–3.5 | 412,126.9 | 4,010,308.3 | 51 | 29 | 29 | 19.8 | 95 | 5 | 96.2 | 70 |
| 24 | 1.5–3.5 | 411,550.5 | 4,011,441.2 | 44 | 23 | 21 | 14.8 | 95 | 7 | 100 | 80 |
| 25 | 1.5–3.5 | 413,143.3 | 4,011,488.9 | 44 | 25 | 19 | 20.5 | 97 | 4 | 93.5 | 41 |
| 26 | 1.5–3.5 | 414,064.7 | 4,011,692.8 | 41 | 23 | 18 | 17.4 | 110 | 4 | 53.6 | 37 |
| 27 | 1.5–3.5 | 415,317.3 | 4,010,885.4 | 50 | 26 | 24 | 15.9 | 116 | 5 | 68.5 | 23 |
| 28 | 1.5–3.5 | 414,149.3 | 4,009,671.4 | 51 | 27 | 24 | 19.1 | 94 | 4 | 87.3 | 19 |
| 29 | 1.5–3.5 | 414,362.5 | 4,008,450.6 | 52 | 24 | 28 | 19.7 | 90 | 4 | 86.4 | 17 |
| 30 | 1.5–3.5 | 416,171.1 | 4,012,249.6 | 45 | 24 | 21 | 15.3 | 98 | 6 | 79.8 | 43 |
| 31 | 1.5–3.5 | 415,609.8 | 4,012,761.8 | 38 | 21 | 17 | 16.0 | 95 | 5 | 70.6 | 45 |
| 32 | 1.5–3.5 | 414,549.1 | 4,013,637 | 38 | 21 | 17 | 70 | 12 | 97 | 100 | |
| 33 | 1.5–3.5 | 417,922.5 | 4,010,462 | 53 | 27 | 26 | 21.6 | 69 | 3 | 92.6 | 25 |
| 34 | 1.5–3.5 | 416,961.1 | 4,011,319.3 | 49 | 23 | 26 | 15.1 | 112 | 5 | 86.7 | 71 |
| 35 | 1.5–3.5 | 416,542.1 | 4,010,233.5 | 43 | 23 | 20 | 17.8 | 91 | 3 | 89.3 | 79 |
| 36 | 1.5–3.5 | 416,909.4 | 4,008,754 | 44 | 24 | 20 | 14.8 | 92 | 4 | 66.2 | 85 |
| 37 | 1.5–3.5 | 406,775.3 | 4,007,107.5 | 50 | 26 | 24 | 18.3 | 82 | 4 | 92.1 | 18 |
| 38 | 1.5–3.5 | 405,227.4 | 4,007,274.3 | 53 | 27 | 26 | 17.3 | 74 | 3 | 96.4 | 25 |
| 39 | 1.5–3.5 | 407,403.9 | 4,006,885.3 | 40 | 22 | 18 | 13.6 | 105 | 5 | 63.8 | 19 |
| 40 | 1.5–3.5 | 407,715.1 | 4,007,488.5 | 43 | 22 | 21 | 19.1 | 90 | 4 | 93.2 | 20 |
| 41 | 1.5–3.5 | 408,445.4 | 4,007,069.4 | 45 | 24 | 21 | 15.8 | 58 | 5 | 95.9 | 19 |
| 42 | 1.5–3.5 | 408,736.7 | 4,005,101.9 | 44 | 25 | 19 | 17.6 | 60 | 4 | 95.5 | 22 |
| 43 | 1.5–3.5 | 408,248.5 | 4,006,694.7 | 43 | 24 | 19 | 19.9 | 69 | 4 | 92.1 | 22 |
| 44 | 1.5–3.5 | 407,872.4 | 4,006,657.22 | 56 | 25 | 31 | 15.6 | 116 | 5 | 95.5 | 28 |
| 45 | 1.5–3.5 | 409,311.9 | 4,005,786 | 46 | 24 | 22 | 17.7 | 112 | 4 | 97.4 | 32 |
| 46 | 1.5–3.5 | 408,775.59 | 4,006,631.24 | 46 | 22 | 24 | 21.1 | 85 | 4 | 95.8 | 19 |
| 47 | 1.5–3.5 | 409,973.4 | 4,006,133 | 53 | 25 | 28 | 20.9 | 87 | 5 | 93.6 | 31 |
| 48 | 1.5–3.5 | 409,048.64 | 4,007,069.39 | 46 | 24 | 22 | 16.6 | 89 | 4 | 96.2 | 29 |
| 49 | 1.5–3.5 | 409,874.19 | 4,007,406.1 | 46 | 24 | 22 | 17.7 | 92 | 5 | 94.1 | 37 |
| 50 | 1.5–3.5 | 408,985.14 | 4,007,907.6 | 54 | 26 | 28 | 15.3 | 99 | 4 | 94.1 | 39 |
| 51 | 1.5–3.5 | 411,015.2 | 4,007,902.7 | 55 | 24 | 31 | 15.3 | 112 | 5 | 95.2 | 82 |
| 52 | 1.5–3.5 | 418,521.8 | 4,007,163.4 | 57 | 25 | 32 | 19.6 | 104 | 4 | 92.9 | 77 |
| 53 | 1.5–3.5 | 409,785.25 | 4,008,333.1 | 48 | 22 | 26 | 14.4 | 97 | 4 | 95.5 | 22 |
| 54 | 1.5–3.5 | 410,998.6 | 4,008,878.3 | 49 | 26 | 23 | 18.8 | 105 | 4 | 92.2 | 32 |
| 55 | 1.5–3.5 | 410,109.1 | 4,006,834.44 | 41 | 19 | 22 | 16.8 | 101 | 4 | 87.3 | 41 |
| 56 | 1.5–3.5 | 410,419.8 | 4,006,001 | 45 | 21 | 24 | 16.3 | 123 | 5 | 52.3 | 28 |
| 57 | 1.5–3.5 | 412,049.02 | 4,007,215.97 | 52 | 24 | 28 | 21.8 | 109 | 5 | 51.8 | 44 |
| 58 | 1.5–3.5 | 411,263 | 4,006,447.5 | 51 | 27 | 24 | 19.4 | 96 | 4 | 94.2 | 33 |
| 59 | 1.5–3.5 | 412,664.18 | 4,007,328.4 | 49 | 25 | 24 | 19.4 | 124 | 4 | 92.6 | 38 |
| 60 | 1.5–3.5 | 411,990 | 4,006,315.2 | 44 | 25 | 19 | 21.7 | 136 | 5 | 95.7 | 39 |
| 61 | 1.5–3.5 | 413,164.9 | 4,008,779 | 43 | 23 | 20 | 18.9 | 119 | 5 | 96.6 | 41 |
| 62 | 1.5–3.5 | 412,846.74 | 4,006,559.81 | 49 | 26 | 23 | 17.4 | 79 | 4 | 93.5 | 39 |
| 63 | 1.5–3.5 | 412,536.5 | 4,005,174.2 | 48 | 27 | 21 | 18.0 | 81 | 4 | 93.5 | 35 |
| 64 | 1.5–3.5 | 415,747.4 | 4,005,960.69 | 48 | 23 | 25 | 16.8 | 96 | 4 | 96.4 | 21 |
| 65 | 1.5–3.5 | 414,814.8 | 4,007,156.9 | 40 | 21 | 19 | 17.9 | 97 | 5 | 39.7 | 31 |
| 66 | 1.5–3.5 | 415,071.9 | 4,004,866.9 | 47 | 24 | 23 | 19.0 | 95 | 5 | 90.8 | 34 |
| 67 | 1.5–3.5 | 417,971.23 | 4,001,685.01 | 48 | 27 | 21 | 17.4 | 88 | 8 | 30 | 61 |
| 68 | 1.5–3.5 | 418,519 | 4,003,222.9 | 0 | 0 | 0 | 17.7 | 85 | 10 | 18 | 37 |
| 69 | 1.5–3.5 | 415,926 | 4,002,878 | 0 | 0 | 0 | 19.0 | 83 | 9 | 14 | 50 |
| 70 | 1.5–3.5 | 416,167 | 4,004,572.3 | 0 | 0 | 0 | 11.0 | 80 | 8 | 15 | 36 |
| 71 | 1.5–3.5 | 419,289 | 4,001,977.6 | 0 | 0 | 0 | 18.6 | 114 | 5 | 25 | 40 |
| 72 | 1.5–3.5 | 411,924.27 | 4,004,297.59 | 57 | 25 | 32 | 16.4 | 116 | 5 | 94.7 | 72 |
| 73 | 1.5–3.5 | 410,482.29 | 4,003,953.63 | 48 | 23 | 25 | 13.4 | 109 | 5 | 91.4 | 74 |
| 74 | 1.5–3.5 | 412,426.98 | 4,002,802.69 | 45 | 21 | 24 | 12.1 | 144 | 4 | 95.6 | 23 |
| 75 | 1.5–3.5 | 414,365 | 4,003,408 | 44 | 21 | 23 | 13.7 | 135 | 4 | 94.6 | 20 |
| 76 | 1.5–3.5 | 411,975.73 | 4,001,202.95 | 47 | 21 | 26 | 13.8 | 118 | 5 | 93.2 | 39 |
| 77 | 1.5–3.5 | 414,022.9 | 4,002,387 | 45 | 22 | 23 | 15.4 | 95 | 4 | 94.7 | 44 |
| 78 | 1.5–3.5 | 411,697.91 | 4,000,107.57 | 41 | 27 | 14 | 11.9 | 55 | 6 | 77.8 | 8 |
| 79 | 1.5–3.5 | 410,200 | 3,999,706 | 35 | 23 | 12 | 12.6 | 47 | 3 | 83.7 | 11 |
| 80 | 1.5–3.5 | 413,372.73 | 4,001,528.38 | 0 | 0 | 0 | 13.7 | 98 | 5 | 8.4 | 100 |
| 81 | 1.5–3.5 | 414,253.79 | 4,000,845.76 | 47 | 22 | 25 | 17.5 | 86 | 5 | 91.7 | 81 |
| 82 | 1.5–3.5 | 415,598.5 | 4,000,259 | 45 | 22 | 24 | 20.1 | 89 | 3 | 93.5 | 83 |
| 83 | 1.5–3.5 | 413,510.13 | 3,999,595.57 | 47 | 25 | 22 | 20.5 | 81 | 3 | 95.6 | 27 |
| 84 | 1.5–3.5 | 412,160.93 | 3,999,051.88 | 41 | 22 | 19 | 12.7 | 12 | 36 | 100 | 45 |
| 85 | 1.5–3.5 | 410,732.9 | 3,999,785 | 40 | 21 | 19 | 10.8 | 15 | 30 | 33 | 47 |
| 86 | 1.5–3.5 | 410,253 | 3,998,445 | 43 | 23 | 20 | 5.7 | 19 | 35 | 42 | 53 |
| 87 | 1.5–3.5 | 413,309 | 3,998,392.5 | 41 | 21 | 20 | 12.3 | 108 | 5 | 81.6 | 60 |
| 88 | 1.5–3.5 | 410,136.16 | 4,001,490.72 | 55 | 26 | 29 | 17.3 | 81 | 3 | 96.2 | 22 |
| 89 | 1.5–3.5 | 409,296.11 | 4,002,026.51 | 46 | 24 | 22 | 22.1 | 96 | 5 | 96.8 | 31 |
| 90 | 1.5–3.5 | 408,932.6 | 4,003,851.9 | 50 | 24 | 26 | 14.8 | 90 | 3 | 97.3 | 29 |
| 91 | 1.5–3.5 | 408,515.58 | 4,002,310.93 | 44 | 30 | 14 | 31.1 | 25 | 2 | 90.1 | 18 |
| 92 | 1.5–3.5 | 409,939 | 4,003,009.6 | 44 | 28 | 16 | 29.2 | 29 | 3 | 89.2 | 12 |
| 93 | 1.5–3.5 | 407,821.05 | 4,002,866.56 | 42 | 21 | 21 | 23.2 | 45 | 4 | 91.6 | 19 |
| 94 | 1.5–3.5 | 407,298.5 | 4,004,255.62 | 49 | 26 | 23 | 16.7 | 38 | 3 | 89.8 | 5 |
| 95 | 1.5–3.5 | 405,937 | 4,003,224 | 43 | 23 | 20 | 13.3 | 90 | 4 | 93.3 | 7 |
| 96 | 1.5–3.5 | 407,774.75 | 4,005,380.1 | 38 | 21 | 17 | 16.9 | 98 | 4 | 96.6 | 39 |
| 97 | 1.5–3.5 | 407,844.33 | 4,005,870.11 | 39 | 22 | 17 | 18.9 | 43 | 4 | 56.7 | 19 |
| 98 | 1.5–3.5 | 406,914.85 | 4,005,671.15 | 45 | 23 | 22 | 14.5 | 121 | 6 | 94.6 | 23 |
| 99 | 1.5–3.5 | 405,242 | 4,004,431.7 | 46 | 25 | 21 | 15.6 | 110 | 4 | 98.1 | 25 |
| 100 | 1.5–3.5 | 405,684.54 | 4,005,717.45 | 43 | 21 | 22 | 14.8 | 95 | 4 | 94.3 | 41 |
| 101 | 1.5–3.5 | 408,025.12 | 3,999,907.5 | 46 | 24 | 22 | 15.7 | 103 | 4 | 96.2 | 54 |
| 102 | 1.5–3.5 | 406,400.4 | 4,001,124 | 42 | 26 | 16 | 15.5 | 94 | 4 | 96.1 | 75 |
| 103 | 3.5–6.5 | 406,851.5 | 4,009,570 | 49 | 23 | 26 | 29.4 | 40 | 4 | 83.5 | 11 |
| 104 | 3.5–6.5 | 405,972.9 | 4,009,284.2 | 48 | 23 | 25 | 29.1 | 45 | 5 | 87 | 9 |
| 105 | 3.5–6.5 | 407,487.6 | 4,007,947.1 | 50 | 24 | 26 | 19.2 | 109 | 5 | 95.1 | 72 |
| 106 | 3.5–6.5 | 406,121.1 | 4,008,204.7 | 46 | 26 | 20 | 19.4 | 85 | 4 | 97.9 | 60 |
| 107 | 3.5–6.5 | 407,443.2 | 4,008,702.7 | 52 | 26 | 26 | 23.2 | 112 | 4 | 94.9 | 70 |
| 108 | 3.5–6.5 | 407,941.4 | 4,009,347.7 | 52 | 29 | 23 | 14.8 | 103 | 4 | 93.7 | 77 |
| 109 | 3.5–6.5 | 408,217.9 | 4,008,512.23 | 40 | 22 | 18 | 20.5 | 113 | 5 | 100 | 90 |
| 110 | 3.5–6.5 | 408,997.4 | 4,008,917.8 | 36 | 23 | 13 | 105 | 5 | 98.4 | 73 | |
| 111 | 3.5–6.5 | 408,743.4 | 4,009,398.1 | 44 | 24 | 20 | 19.3 | 102 | 5 | 95.1 | 86 |
| 112 | 3.5–6.5 | 408,026.1 | 4,010,406 | 42 | 23 | 19 | 15.5 | 102 | 6 | 94.1 | 80 |
| 113 | 3.5–6.5 | 409,617.8 | 4,011,321.6 | 64 | 33 | 31 | 19.5 | 89 | 4 | 80.5 | 97 |
| 114 | 3.5–6.5 | 408,588.1 | 4,011,780.2 | 48 | 25 | 23 | 20.1 | 93 | 5 | 89.1 | 99 |
| 115 | 3.5–6.5 | 409,762.1 | 4,012,805.4 | 46 | 25 | 21 | 17.2 | 98 | 5 | 72.5 | 100 |
| 116 | 3.5–6.5 | 411,184.2 | 4,011,787.2 | 45 | 24 | 21 | 14.3 | 104 | 4 | 95.7 | 50 |
| 117 | 3.5–6.5 | 411,184.3 | 4,012,540.7 | 49 | 28 | 21 | 18.2 | 132 | 6 | 92.9 | 62 |
| 118 | 3.5–6.5 | 411,247.7 | 4,013,522.9 | 45 | 27 | 18 | 19.0 | 62 | 4 | 100 | 25 |
| 119 | 3.5–6.5 | 409,969.9 | 4,010,643.8 | 51 | 27 | 24 | 18.7 | 93 | 5 | 94.3 | 91 |
| 120 | 3.5–6.5 | 409,662.9 | 4,009,977 | 54 | 29 | 25 | 19.3 | 95 | 5 | 94.2 | 89 |
| 121 | 3.5–6.5 | 409,915.1 | 4,009,232.2 | 47 | 23 | 24 | 17.5 | 87 | 5 | 94.6 | 33 |
| 122 | 3.5–6.5 | 410,862.1 | 4,009,607.35 | 46 | 22 | 24 | 20.7 | 82 | 4 | 98.2 | 41 |
| 123 | 3.5–6.5 | 411,994.6 | 4,009,216.9 | 45 | 21 | 23 | 17.0 | 72 | 5 | 97.5 | 35 |
| 124 | 3.5–6.5 | 411,166.1 | 4,010,438.9 | 54 | 25 | 29 | 18.6 | 91 | 4 | 97.8 | 76 |
| 125 | 3.5–6.5 | 412,126.9 | 4,010,308.3 | 55 | 26 | 29 | 19.3 | 93 | 4 | 92.1 | 79 |
| 126 | 3.5–6.5 | 411,550.5 | 4,011,441.2 | 46 | 22 | 24 | 14.8 | 97 | 8 | 100 | 100 |
| 127 | 3.5–6.5 | 413,143.3 | 4,011,488.9 | 46 | 25 | 21 | 21.1 | 99 | 4 | 95.2 | 75 |
| 128 | 3.5–6.5 | 414,064.7 | 4,011,692.8 | 60 | 32 | 28 | 21.2 | 147 | 5 | 86.6 | 50 |
| 129 | 3.5–6.5 | 415,317.3 | 4,010,885.4 | 50 | 28 | 22 | 20.2 | 98 | 5 | 91.9 | 56 |
| 130 | 3.5–6.5 | 414,149.3 | 4,009,671.4 | 42 | 23 | 19 | 19.4 | 95 | 5 | 41.6 | 100 |
| 131 | 3.5–6.5 | 414,362.5 | 4,008,450.6 | 71 | 36 | 35 | 19.7 | 95 | 5 | 59.7 | 43 |
| 132 | 3.5–6.5 | 416,171.1 | 4,012,249.6 | 38 | 21 | 17 | 16.8 | 95 | 5 | 82.6 | 82 |
| 133 | 3.5–6.5 | 415,609.8 | 4,012,761.8 | 44 | 25 | 19 | 16.1 | 97 | 6 | 85.8 | 83 |
| 134 | 3.5–6.5 | 414,549.1 | 4,013,637 | 42 | 23 | 19 | 10.4 | 75 | 11 | 100 | 100 |
| 135 | 3.5–6.5 | 417,922.5 | 4,010,462 | 48 | 26 | 22 | 20.2 | 76 | 5 | 96.1 | 37 |
| 136 | 3.5–6.5 | 416,961.1 | 4,011,319.3 | 48 | 23 | 25 | 114 | 5 | 69.1 | 75 | |
| 137 | 3.5–6.5 | 416,542.1 | 4,010,233.5 | 45 | 26 | 19 | 21.6 | 94 | 5 | 94.9 | 87 |
| 138 | 3.5–6.5 | 416,909.4 | 4,008,754 | 54 | 32 | 22 | 19.6 | 94 | 4 | 89.4 | 83 |
| 139 | 3.5–6.5 | 406,775.3 | 4,007,107.5 | 53 | 28 | 25 | 19.3 | 78 | 3 | 97.9 | 45 |
| 140 | 3.5–6.5 | 405,227.4 | 4,007,274.3 | 54 | 28 | 26 | 16.8 | 82 | 4 | 98.6 | 32 |
| 141 | 3.5–6.5 | 407,403.9 | 4,006,885.3 | 38 | 21 | 17 | 17.3 | 98 | 5 | 92.5 | 39 |
| 142 | 3.5–6.5 | 407,715.1 | 4,007,488.5 | 47 | 23 | 24 | 21.5 | 92 | 5 | 96.1 | 55 |
| 143 | 3.5–6.5 | 408,445.4 | 4,007,069.4 | 44 | 23 | 21 | 19.3 | 81 | 3 | 96.3 | 40 |
| 144 | 3.5–6.5 | 408,736.7 | 4,005,101.9 | 46 | 23 | 23 | 19.2 | 87 | 4 | 93.8 | 38 |
| 145 | 3.5–6.5 | 408,248.5 | 4,006,694.7 | 52 | 26 | 26 | 22.3 | 93 | 5 | 94.6 | 53 |
| 146 | 3.5–6.5 | 407,872.4 | 4,006,657.22 | 57 | 26 | 31 | 18.7 | 106 | 5 | 95.6 | 61 |
| 147 | 3.5–6.5 | 409,311.9 | 4,005,786 | 55 | 26 | 29 | 17.6 | 103 | 4 | 96.9 | 63 |
| 148 | 3.5–6.5 | 408,775.59 | 4,006,631.24 | 47 | 23 | 25 | 15.8 | 96 | 5 | 92.2 | 70 |
| 149 | 3.5–6.5 | 409,973.4 | 4,006,133 | 43 | 21 | 22 | 20.5 | 107 | 4 | 87.9 | 69 |
| 150 | 3.5–6.5 | 409,048.64 | 4,007,069.39 | 46 | 23 | 23 | 17.3 | 90 | 4 | 94.6 | 50 |
| 151 | 3.5–6.5 | 409,874.19 | 4,007,406.1 | 45 | 22 | 23 | 17.5 | 92 | 5 | 94 | 73 |
| 152 | 3.5–6.5 | 408,985.14 | 4,007,907.6 | 56 | 30 | 26 | 18.2 | 110 | 5 | 93.3 | 72 |
| 153 | 3.5–6.5 | 411,015.2 | 4,007,902.7 | 63 | 28 | 35 | 21.8 | 102 | 6 | 94 | 91 |
| 154 | 3.5–6.5 | 418,521.8 | 4,007,163.4 | 56 | 24 | 32 | 16.6 | 129 | 5 | 96.1 | 86 |
| 155 | 3.5–6.5 | 409,785.25 | 4,008,333.1 | 51 | 27 | 24 | 18.2 | 118 | 6 | 96.4 | 40 |
| 156 | 3.5–6.5 | 410,998.6 | 4,008,878.3 | 49 | 26 | 23 | 18.7 | 99 | 5 | 96.3 | 100 |
| 157 | 3.5–6.5 | 410,109.1 | 4,006,834.44 | 46 | 19 | 27 | 17.2 | 98 | 5 | 90.3 | 30 |
| 158 | 3.5–6.5 | 410,419.8 | 4,006,001 | 48 | 20 | 28 | 18.2 | 126 | 5 | 87.2 | 50 |
| 159 | 3.5–6.5 | 412,049.02 | 4,007,215.97 | 54 | 28 | 26 | 17.8 | 134 | 6 | 96.4 | 63 |
| 160 | 3.5–6.5 | 411,263 | 4,006,447.5 | 55 | 24 | 31 | 19.5 | 99 | 5 | 94.2 | 79 |
| 161 | 3.5–6.5 | 412,664.18 | 4,007,328.4 | 46 | 26 | 20 | 17.2 | 118 | 4 | 96.6 | 22 |
| 162 | 3.5–6.5 | 411,990 | 4,006,315.2 | 46 | 25 | 21 | 17.1 | 121 | 5 | 96.5 | 38 |
| 163 | 3.5–6.5 | 413,164.9 | 4,008,779 | 47 | 23 | 24 | 16.3 | 115 | 6 | 69.1 | 36 |
| 164 | 3.5–6.5 | 412,846.74 | 4,006,559.81 | 45 | 24 | 21 | 23.8 | 76 | 4 | 94.7 | 45 |
| 165 | 3.5–6.5 | 412,536.5 | 4,005,174.2 | 47 | 26 | 21 | 18.9 | 89 | 5 | 98.1 | 41 |
| 166 | 3.5–6.5 | 415,747.4 | 4,005,960.69 | 45 | 21 | 24 | 20.4 | 126 | 5 | 98.4 | 100 |
| 167 | 3.5–6.5 | 414,814.8 | 4,007,156.9 | 44 | 22 | 22 | 20.4 | 120 | 5 | 96.4 | 100 |
| 168 | 3.5–6.5 | 415,071.9 | 4,004,866.9 | 46 | 23 | 23 | 18.9 | 117 | 5 | 90.8 | 100 |
| 169 | 3.5–6.5 | 417,971.23 | 4,001,685.01 | 45 | 25 | 20 | 17.4 | 91 | 9 | 39 | 76 |
| 170 | 3.5–6.5 | 418,519 | 4,003,222.9 | 45 | 24 | 21 | 17.7 | 95 | 11 | 64 | 90 |
| 171 | 3.5–6.5 | 415,926 | 4,002,878 | 41 | 23 | 19 | 19.0 | 89 | 11 | 39 | 68 |
| 172 | 3.5–6.5 | 416,167 | 4,004,572.3 | 40 | 20 | 24 | 18.0 | 76 | 9 | 55 | 99 |
| 173 | 3.5–6.5 | 419,289 | 4,001,977.6 | 0 | 0 | 0 | 18.6 | 112 | 5 | 78.8 | 92 |
| 174 | 3.5–6.5 | 411,924.27 | 4,004,297.59 | 62 | 26 | 36 | 16.6 | 125 | 5 | 68.3 | 80 |
| 175 | 3.5–6.5 | 410,482.29 | 4,003,953.63 | 49 | 23 | 26 | 16.6 | 115 | 6 | 17.6 | 69 |
| 176 | 3.5–6.5 | 412,426.98 | 4,002,802.69 | 48 | 25 | 23 | 18.1 | 140 | 5 | 39.9 | 100 |
| 177 | 3.5–6.5 | 414,365 | 4,003,408 | 39 | 21 | 18 | 17.5 | 92 | 4 | 98.1 | 80 |
| 178 | 3.5–6.5 | 411,975.73 | 4,001,202.95 | 61 | 26 | 35 | 16.9 | 137 | 5 | 97.2 | 72 |
| 179 | 3.5–6.5 | 414,022.9 | 4,002,387 | 53 | 26 | 27 | 16.6 | 119 | 5 | 63.6 | 73 |
| 180 | 3.5–6.5 | 411,697.91 | 4,000,107.57 | 44 | 23 | 21 | 20.3 | 98 | 5 | 50.4 | 20 |
| 181 | 3.5–6.5 | 410,200 | 3,999,706 | 37 | 25 | 12 | 17.8 | 60 | 6 | 94.2 | 37 |
| 182 | 3.5–6.5 | 413,372.73 | 4,001,528.38 | 42 | 21 | 21 | 16.3 | 94 | 6 | 87.5 | 29 |
| 183 | 3.5–6.5 | 414,253.79 | 4,000,845.76 | 46 | 22 | 24 | 20.1 | 92 | 4 | 76.5 | 91 |
| 184 | 3.5–6.5 | 408,932.6 | 4,000,259 | 48 | 23 | 25 | 19.2 | 94 | 4 | 94.7 | 100 |
| 185 | 3.5–6.5 | 413,510.13 | 3,999,595.57 | 48 | 24 | 24 | 17.4 | 85 | 3 | 88.6 | 97 |
| 186 | 3.5–6.5 | 412,160.93 | 3,999,051.88 | 39 | 21 | 18 | 14.1 | 38 | 29 | 100 | 100 |
| 187 | 3.5–6.5 | 410,732.9 | 3,999,785 | 38 | 20 | 18 | 10.8 | 8 | 32 | 41 | 100 |
| 188 | 3.5–6.5 | 410,253 | 3,998,445 | 41 | 20 | 21 | 8.7 | 13 | 29 | 44 | 100 |
| 189 | 3.5–6.5 | 413,309 | 3,998,392.5 | 46 | 24 | 22 | 13.4 | 94 | 5 | 61.1 | 63 |
| 190 | 3.5–6.5 | 410,136.16 | 4,001,490.72 | 58 | 27 | 31 | 18.4 | 93 | 5 | 99.1 | 41 |
| 191 | 3.5–6.5 | 409,296.11 | 4,002,026.51 | 50 | 26 | 24 | 21.0 | 108 | 4 | 93.5 | 39 |
| 192 | 3.5–6.5 | 409,707 | 4,003,851.9 | 51 | 28 | 23 | 15.0 | 87 | 3 | 96 | 48 |
| 193 | 3.5–6.5 | 408,515.58 | 4,002,310.93 | 50 | 28 | 22 | 28.2 | 38 | 4 | 95.3 | 20 |
| 194 | 3.5–6.5 | 409,939 | 4,003,009.6 | 41 | 24 | 17 | 25.4 | 40 | 5 | 78.4 | 29 |
| 195 | 3.5–6.5 | 407,821.05 | 4,002,866.56 | 45 | 26 | 19 | 24.7 | 51 | 4 | 87.9 | 100 |
| 196 | 3.5–6.5 | 407,298.5 | 4,004,255.62 | 45 | 23 | 22 | 12.2 | 102 | 5 | 93.4 | 20 |
| 197 | 3.5–6.5 | 405,937 | 4,003,224 | 41 | 23 | 18 | 15.0 | 87 | 3 | 89.8 | 26 |
| 198 | 3.5–6.5 | 407,774.75 | 4,005,380.1 | 48 | 23 | 25 | 19.9 | 128 | 6 | 91.4 | 81 |
| 199 | 3.5–6.5 | 407,844.33 | 4,005,870.11 | 38 | 26 | 12 | 23.7 | 50 | 4 | 66.7 | 31 |
| 200 | 3.5–6.5 | 406,914.85 | 4,005,671.15 | 55 | 26 | 29 | 17.4 | 112 | 5 | 98.7 | 71 |
| 201 | 3.5–6.5 | 405,242 | 4,004,431.7 | 48 | 23 | 25 | 17.2 | 125 | 5 | 93.8 | 70 |
| 202 | 3.5–6.5 | 405,684.54 | 4,005,717.45 | 50 | 27 | 23 | 16.2 | 94 | 3 | 98.1 | 45 |
| 203 | 3.5–6.5 | 408,025.12 | 3,999,907.5 | 48 | 26 | 22 | 17.7 | 81 | 3 | 99.1 | 81 |
| 204 | 3.5–6.5 | 406,400.4 | 4,001,124 | 49 | 26 | 23 | 21 | 85 | 4 | 98.8 | 100 |
| 205 | 6.5–9.5 | 406,851.5 | 4,009,570 | 47 | 23 | 24 | 26.9 | 41 | 3 | 83.5 | 10 |
| 206 | 6.5–9.5 | 405,972.9 | 4,009,284.2 | 51 | 24 | 27 | 30.4 | 51 | 3.5 | 93.8 | 12 |
| 207 | 6.5–9.5 | 407,487.6 | 4,007,947.1 | 56 | 30 | 26 | 19.1 | 107 | 4 | 93.5 | 83 |
| 208 | 6.5–9.5 | 406,121.1 | 4,008,204.7 | 54 | 28 | 26 | 16.4 | 112 | 5 | 95.7 | 80 |
| 209 | 6.5–9.5 | 407,443.2 | 4,008,702.7 | 49 | 27 | 22 | 13.6 | 105 | 4.5 | 94.8 | 96 |
| 210 | 6.5–9.5 | 407,941.4 | 4,009,347.7 | 55 | 26 | 29 | 21.7 | 97 | 4 | 97.5 | 82 |
| 211 | 6.5–9.5 | 408,217.9 | 4,008,512.23 | 42 | 28 | 0 | 18.3 | 117 | 5 | 100 | 100 |
| 212 | 6.5–9.5 | 408,997.4 | 4,008,917.8 | 54 | 26 | 28 | 18.5 | 110 | 5 | 98.4 | 82 |
| 213 | 6.5–9.5 | 408,743.4 | 4,009,398.1 | 42 | 23 | 19 | 17.4 | 108 | 6.5 | 97.3 | 95 |
| 214 | 6.5–9.5 | 408,026.1 | 4,010,406 | 41 | 28 | 13 | 17.4 | 110 | 5.5 | 91.7 | 82 |
| 215 | 6.5–9.5 | 409,617.8 | 4,011,321.6 | 46 | 25 | 21 | 18.4 | 122 | 5.5 | 52.1 | 100 |
| 216 | 6.5–9.5 | 408,588.1 | 4,011,780.2 | 42 | 25 | 17 | 19.1 | 103 | 5.5 | 86.3 | 100 |
| 217 | 6.5–9.5 | 409,762.1 | 4,012,805.4 | 47 | 26 | 21 | 21.4 | 99 | 5 | 90.9 | 100 |
| 218 | 6.5–9.5 | 411,184.2 | 4,011,787.2 | 47 | 26 | 21 | 21.9 | 118 | 4.5 | 91.7 | 80 |
| 219 | 6.5–9.5 | 411,184.3 | 4,012,540.7 | 53 | 25 | 28 | 18.3 | 103 | 4.5 | 90 | 85 |
| 220 | 6.5–9.5 | 411,247.7 | 4,013,522.9 | 47 | 28 | 0 | 19.7 | 67 | 4.5 | 100 | 29 |
| 221 | 6.5–9.5 | 409,969.9 | 4,010,643.8 | 56 | 30 | 26 | 18.8 | 93 | 4 | 90.7 | 85 |
| 222 | 6.5–9.5 | 409,662.9 | 4,009,977 | 39 | 21 | 18 | 18.2 | 95 | 4.5 | 82.4 | 90 |
| 223 | 6.5–9.5 | 409,915.1 | 4,009,232.2 | 44 | 22 | 22 | 16.2 | 91 | 4 | 91.3 | 47 |
| 224 | 6.5–9.5 | 410,862.1 | 4,009,607.35 | 55 | 28 | 27 | 17.4 | 85 | 4 | 96.1 | 80 |
| 225 | 6.5–9.5 | 411,994.6 | 4,009,216.9 | 48 | 23 | 25 | 16.1 | 87 | 4.5 | 98.5 | 78 |
| 226 | 6.5–9.5 | 411,166.1 | 4,010,438.9 | 53 | 25 | 28 | 21.7 | 92 | 4.5 | 90.1 | 100 |
| 227 | 6.5–9.5 | 412,126.9 | 4,010,308.3 | 56 | 26 | 30 | 12.9 | 91 | 4 | 96.6 | 99 |
| 228 | 6.5–9.5 | 411,550.5 | 4,011,441.2 | 47 | 21 | 26 | 15.6 | 108 | 8.5 | 100 | 100 |
| 229 | 6.5–9.5 | 413,143.3 | 4,011,488.9 | 41 | 21 | 20 | 21.7 | 95 | 3.5 | 76.9 | 90 |
| 230 | 6.5–9.5 | 414,064.7 | 4,011,692.8 | 59 | 28 | 31 | 16.6 | 130 | 5 | 93.8 | 47 |
| 231 | 6.5–9.5 | 415,317.3 | 4,010,885.4 | 64 | 33 | 31 | 18.7 | 92 | 4 | 64.2 | 74 |
| 232 | 6.5–9.5 | 414,149.3 | 4,009,671.4 | 56 | 33 | 23 | 18.1 | 92 | 4 | 73.4 | 72 |
| 233 | 6.5–9.5 | 414,362.5 | 4,008,450.6 | 66 | 29 | 37 | 18.2 | 96 | 4.5 | 61.6 | 55 |
| 234 | 6.5–9.5 | 416,171.1 | 4,012,249.6 | 32 | 15 | 17 | 16.1 | 94 | 4.5 | 52.4 | 100 |
| 235 | 6.5–9.5 | 415,609.8 | 4,012,761.8 | 36 | 20 | 16 | 18.2 | 93 | 4.5 | 42.3 | 100 |
| 236 | 6.5–9.5 | 414,549.1 | 4,013,637 | 44 | 21 | 23 | 11.3 | 78 | 14 | 100 | 100 |
| 237 | 6.5–9.5 | 417,922.5 | 4,010,462 | 43 | 25 | 18 | 17.1 | 62 | 3.5 | 94.9 | 40 |
| 238 | 6.5–9.5 | 416,961.1 | 4,011,319.3 | 46 | 22 | 24 | 17.2 | 110 | 4.5 | 74.3 | 81 |
| 239 | 6.5–9.5 | 416,542.1 | 4,010,233.5 | 55 | 31 | 24 | 20.7 | 116 | 4 | 88.7 | 100 |
| 240 | 6.5–9.5 | 416,909.4 | 4,008,754 | 48 | 24 | 24 | 22.7 | 110 | 5 | 86.2 | 100 |
| 241 | 6.5–9.5 | 406,775.3 | 4,007,107.5 | 52 | 27 | 25 | 17.8 | 85 | 4 | 98.4 | 52 |
| 242 | 6.5–9.5 | 405,227.4 | 4,007,274.3 | 51 | 26 | 25 | 18.2 | 85 | 4.5 | 94.3 | 54 |
| 243 | 6.5–9.5 | 407,403.9 | 4,006,885.3 | 45 | 25 | 20 | 20.5 | 103 | 4 | 94.4 | 45 |
| 244 | 6.5–9.5 | 407,715.1 | 4,007,488.5 | 49 | 26 | 23 | 20.1 | 97 | 4.5 | 96.1 | 71 |
| 245 | 6.5–9.5 | 408,445.4 | 4,007,069.4 | 48 | 26 | 22 | 20.7 | 85 | 4 | 93.1 | 82 |
| 246 | 6.5–9.5 | 408,736.7 | 4,005,101.9 | 54 | 25 | 29 | 16.6 | 83 | 3.5 | 94.1 | 83 |
| 247 | 6.5–9.5 | 408,248.5 | 4,006,694.7 | 50 | 27 | 23 | 19.2 | 97 | 5 | 93 | 79 |
| 248 | 6.5–9.5 | 407,872.4 | 4,006,657.22 | 51 | 25 | 26 | 19.4 | 138 | 4 | 93.3 | 60 |
| 249 | 6.5–9.5 | 409,311.9 | 4,005,786 | 49 | 26 | 23 | 18.2 | 130 | 4.5 | 97.5 | 70 |
| 250 | 6.5–9.5 | 408,775.59 | 4,006,631.24 | 48 | 23 | 25 | 17.6 | 97 | 5 | 94.9 | 69 |
| 251 | 6.5–9.5 | 409,973.4 | 4,006,133 | 44 | 24 | 20 | 17.7 | 99 | 5 | 92.2 | 75 |
| 252 | 6.5–9.5 | 409,048.64 | 4,007,069.39 | 48 | 24 | 24 | 18.4 | 97 | 4.5 | 90.4 | 90 |
| 253 | 6.5–9.5 | 409,874.19 | 4,007,406.1 | 46 | 23 | 23 | 15.8 | 98 | 5 | 93.3 | 89 |
| 254 | 6.5–9.5 | 408,985.14 | 4,007,907.6 | 56 | 25 | 31 | 18.8 | 108 | 4.5 | 96.7 | 91 |
| 255 | 6.5–9.5 | 411,015.2 | 4,007,902.7 | 45 | 23 | 22 | 14.5 | 115 | 5 | 93.2 | 99 |
| 256 | 6.5–9.5 | 418,521.8 | 4,007,163.4 | 48 | 23 | 25 | 13.5 | 113 | 4.5 | 93.8 | 100 |
| 257 | 6.5–9.5 | 409,785.25 | 4,008,333.1 | 46 | 24 | 22 | 18.8 | 95 | 3.5 | 94 | 43 |
| 258 | 6.5–9.5 | 410,998.6 | 4,008,878.3 | 49 | 27 | 22 | 18.6 | 103 | 4.5 | 92.9 | 100 |
| 259 | 6.5–9.5 | 410,109.1 | 4,006,834.44 | 42 | 28 | 14 | 17.2 | 108 | 5.5 | 92.1 | 59 |
| 260 | 6.5–9.5 | 410,419.8 | 4,006,001 | 55 | 23 | 32 | 17.1 | 120 | 4.5 | 91.2 | 72 |
| 261 | 6.5–9.5 | 412,049.02 | 4,007,215.97 | 55 | 24 | 31 | 15.4 | 130 | 5 | 82.3 | 89 |
| 262 | 6.5–9.5 | 411,263 | 4,006,447.5 | 55 | 26 | 29 | 18.4 | 102 | 4 | 92.7 | 81 |
| 263 | 6.5–9.5 | 412,664.18 | 4,007,328.4 | 48 | 25 | 23 | 16.4 | 133 | 5.5 | 96.1 | 43 |
| 264 | 6.5–9.5 | 411,990 | 4,006,315.2 | 49 | 26 | 23 | 16.5 | 120 | 5 | 89.7 | 71 |
| 265 | 6.5–9.5 | 413,164.9 | 4,008,779 | 45 | 27 | 18 | 20.2 | 123 | 5.5 | 86 | 69 |
| 266 | 6.5–9.5 | 412,846.74 | 4,006,559.81 | 45 | 24 | 21 | 19.6 | 85 | 4.5 | 94.7 | 75 |
| 267 | 6.5–9.5 | 412,536.5 | 4,005,174.2 | 37 | 18 | 19 | 20.2 | 88 | 4 | 98.0 | 84 |
| 268 | 6.5–9.5 | 415,747.4 | 4,005,960.69 | 46 | 22 | 24 | 18.4 | 89 | 4 | 91.2 | 100 |
| 269 | 6.5–9.5 | 414,814.8 | 4,007,156.9 | 43 | 22 | 21 | 16.3 | 128 | 5 | 42.3 | 87 |
| 270 | 6.5–9.5 | 415,071.9 | 4,004,866.9 | 38 | 21 | 17 | 16.3 | 122 | 4 | 45 | 100 |
| 271 | 6.5–9.5 | 417,971.23 | 4,001,685.01 | 47 | 25 | 22 | 17.2 | 97 | 9.5 | 42 | 100 |
| 272 | 6.5–9.5 | 418,519 | 4,003,222.9 | 37 | 21 | 16 | 16.8 | 90 | 9.5 | 36 | 100 |
| 273 | 6.5–9.5 | 415,926 | 4,002,878 | 44 | 23 | 21 | 17.0 | 93 | 10 | 42 | 100 |
| 274 | 6.5–9.5 | 416,167 | 4,004,572.3 | 43 | 23 | 20 | 20.1 | 80 | 9 | 60 | 100 |
| 275 | 6.5–9.5 | 419,289 | 4,001,977.6 | 44 | 24 | 20 | 17.7 | 109 | 4 | 81.4 | 98 |
| 276 | 6.5–9.5 | 411,924.27 | 4,004,297.59 | 56 | 25 | 31 | 14.4 | 142 | 5 | 96.3 | 100 |
| 277 | 6.5–9.5 | 410,482.29 | 4,003,953.63 | 0 | 0 | 0 | 15.6 | 131 | 7 | 18.1 | 100 |
| 278 | 6.5–9.5 | 412,426.98 | 4,002,802.69 | 43 | 23 | 20 | 20.5 | 136 | 4.5 | 93.1 | 100 |
| 279 | 6.5–9.5 | 414,365 | 4,003,408 | 58 | 32 | 26 | 17.2 | 97 | 5 | 93.7 | 100 |
| 280 | 6.5–9.5 | 411,975.73 | 4,001,202.95 | 51 | 24 | 27 | 18.1 | 129 | 5.5 | 97.6 | 72 |
| 281 | 6.5–9.5 | 414,022.9 | 4,002,387 | 81 | 26 | 55 | 15.3 | 140 | 5 | 95.1 | 79 |
| 282 | 6.5–9.5 | 411,697.91 | 4,000,107.57 | 51 | 28 | 23 | 17.5 | 131 | 4.5 | 94.2 | 40 |
| 283 | 6.5–9.5 | 410,200 | 3,999,706 | 48 | 28 | 22 | 16.8 | 103 | 5 | 61.4 | 45 |
| 284 | 6.5–9.5 | 413,372.73 | 4,001,528.38 | 45 | 21 | 24 | 17.2 | 99 | 6 | 93.7 | 42 |
| 285 | 6.5–9.5 | 414,253.79 | 4,000,845.76 | 49 | 26 | 23 | 18.6 | 96 | 4.5 | 82 | 100 |
| 286 | 6.5–9.5 | 415,598.5 | 4,000,259 | 41 | 23 | 18 | 21.0 | 89 | 4 | 76.5 | 100 |
| 287 | 6.5–9.5 | 413,510.13 | 3,999,595.57 | 43 | 23 | 20 | 13.9 | 87 | 3.5 | 26.6 | 93 |
| 288 | 6.5–9.5 | 412,160.93 | 3,999,051.88 | 36 | 17 | 19 | 13.2 | 6 | 32 | 100 | 80 |
| 289 | 6.5–9.5 | 410,732.9 | 3,999,785 | 43 | 21 | 22 | 17.0 | 16 | 31 | 45 | 100 |
| 290 | 6.5–9.5 | 410,253 | 3,998,445 | 42 | 22 | 20 | 9.0 | 7 | 30 | 41 | 100 |
| 291 | 6.5–9.5 | 413,309 | 3,998,392.5 | 59 | 26 | 33 | 15.7 | 94 | 3.5 | 70.8 | 100 |
| 292 | 6.5–9.5 | 410,136.16 | 4,001,490.72 | 55 | 26 | 29 | 21.8 | 97 | 5 | 95.9 | 79 |
| 293 | 6.5–9.5 | 409,296.11 | 4,002,026.51 | 53 | 25 | 28 | 19.2 | 115 | 4.5 | 95.2 | 42 |
| 294 | 6.5–9.5 | 408,932.6 | 4,003,851.9 | 50 | 28 | 22 | 17.5 | 94 | 4 | 96.8 | 49 |
| 295 | 6.5–9.5 | 408,515.58 | 4,002,310.93 | 45 | 28 | 17 | 25.9 | 33 | 4.5 | 87.9 | 38 |
| 296 | 6.5–9.5 | 409,939 | 4,003,009.6 | 43 | 28 | 15 | 26.4 | 55 | 4.5 | 93 | 33 |
| 297 | 6.5–9.5 | 407,821.05 | 4,002,866.56 | 0 | 0 | 0 | 19.7 | 52 | 3.5 | 25.8 | 100 |
| 298 | 6.5–9.5 | 407,298.5 | 4,004,255.62 | 41 | 23 | 18 | 15.2 | 119 | 4.5 | 94.7 | 40 |
| 299 | 6.5–9.5 | 405,937 | 4,003,224 | 46 | 24 | 22 | 19.3 | 93 | 4.5 | 63.7 | 38 |
| 300 | 6.5–9.5 | 407,774.75 | 4,005,380.1 | 43 | 21 | 22 | 20.5 | 130 | 6 | 94.2 | 89 |
| 301 | 6.5–9.5 | 407,844.33 | 4,005,870.11 | 43 | 23 | 20 | 19.8 | 49 | 3.5 | 98.9 | 38 |
| 302 | 6.5–9.5 | 406,914.85 | 4,005,671.15 | 48 | 23 | 25 | 18.7 | 99 | 4.5 | 94.8 | 100 |
| 303 | 6.5–9.5 | 405,242 | 4,004,431.7 | 50 | 26 | 24 | 15.5 | 115 | 5 | 96 | 73 |
| 304 | 6.5–9.5 | 405,684.54 | 4,005,717.45 | 48 | 23 | 25 | 18.7 | 99 | 5 | 94.8 | 100 |
| 305 | 6.5–9.5 | 408,025.12 | 3,999,907.5 | 45 | 25 | 20 | 22.8 | 105 | 4 | 92.6 | 91 |
| 306 | 6.5–9.5 | 406,400.4 | 4,001,124 | 48 | 25 | 23 | 22.1 | 97 | 5 | 69.7 | 100 |
References
- Clayton, C.R.; Matthews, M.C.; Simons, N.E. Site Investigation; Granada: London, UK, 1982. [Google Scholar]
- Roy, S.; Bhalla, S.K. Role of geotechnical properties of soil on civil engineering structures. Resour. Environ. 2017, 7, 103–109. [Google Scholar]
- Skempton, A. Effective stress in soils, concrete and rocks. Sel. Pap. Soil Mech. 1984, 1032, 4–16. [Google Scholar]
- Lupiezowiec, M. The application of c-φ reduction method to estimate the bearing capacity of subsoil. ACEE Archit. Civ. Eng. Environ. 2013, 6, 35–43. [Google Scholar]
- Patel, A. Geotechnical Investigations and Improvement of Ground Conditions; Woodhead Publishing: Cambridge, UK, 2019. [Google Scholar]
- Bozbey, I.; Togrol, E. Correlation of standard penetration test and pressuremeter data: A case study from Istanbul, Turkey. Bull. Eng. Geol. Environ. 2010, 69, 505–515. [Google Scholar] [CrossRef]
- Yusof, N.Q.; Zabidi, H. Reliability of using standard penetration test (SPT) in predicting properties of soil. J. Phys. Conf. Ser. 2018, 1082, 012094. [Google Scholar] [CrossRef]
- Cabalar, A.F.; Akbulut, N. Evaluation of Actual and Estimated Hydraulic Conductivity of Sands with Different Gradation and Shape; Springer Plus: Berlin/Heidelberg, Germany, 2016; Volume 5, pp. 1–6. [Google Scholar]
- Player, R.S. Geographic information system (GIS) use in geotechnical engineering. In Proceedings of the GeoCongress 2006: Geotechnical Engineering in the Information Technology Age 2006, Atlanta, GA, USA, 26 February–1 March 2006; pp. 1–6. [Google Scholar]
- Ahmed, C.; Mohammed, A.; Saboonchi, A. ArcGIS mapping, characterisations and modelling the physical and mechanical properties of the Sulaimani City soils, Kurdistan Region, Iraq. Geomech. Geoeng. 2022, 17, 384–397. [Google Scholar] [CrossRef]
- Wan-Mohamad, W.N.; Abdul-Ghani, A.N. The use of geographic information system (GIS) for geotechnical data processing and presentation. Procedia Eng. 2011, 20, 397–406. [Google Scholar] [CrossRef]
- Antoniou, A.A.; Papadimitriou, A.G.; Tsiambaos, G. A geographical information system managing geotechnical data for Athens (Greece) and its use for automated seismic microzonation. Nat. Hazards 2008, 47, 369–395. [Google Scholar] [CrossRef]
- Cabalar, A.F.; Canbolat, A.; Akbulut, N.; Tercan, S.H.; Isik, H. Soil liquefaction potential in Kahramanmaras, Turkey. Geomat. Nat. Hazards Risk 2019, 10, 1822–1838. [Google Scholar] [CrossRef]
- Mancini, F.; Stecchi, F.; Gabbianelli, G. GIS-based assessment of risk due to salt mining activities at Tuzla (Bosnia and Herze-govina). Eng. Geol. 2009, 109, 170–182. [Google Scholar] [CrossRef]
- Naji, D.M.; Akin, M.K.; Cabalar, A.F. A comparative study on the VS30 and N30 based seismic site classification in Kahramanmaras, Turkey. Adv. Civ. Eng. 2020, 2020, 1–5. [Google Scholar] [CrossRef]
- ESRI Environmental Systems Research Institute. 2005. Available online: https://www.esri.com/ (accessed on 10 February 2022).
- Arnous, M.O. Geotechnical site investigations for possible urban extensions at Suez City, Egypt using GIS. Arab. J. Geosci. 2013, 6, 1349–1369. [Google Scholar] [CrossRef]
- Chao, Z.; Ma, G.; Zhang, Y.; Zhu, Y.; Hu, H. The application of artificial neural network in geotechnical engineering. In IOP Con-ference Series: Earth and Environmental Science; IOP Publishing: Bristol, UK, 2018; Volume 189, p. 022054. [Google Scholar]
- Sulewska, M.J. Applying artificial neural networks for analysis of geotechnical problems. Comput. Assist. Methods Eng. Sci. 2017, 18, 231–241. [Google Scholar]
- Nugroho, S.A.; Fernando, H.; Suryanita, R. Estimation of standard penetration test value on cohesive soil using artificial neural network without data normalization. Int. J. Artif. Intell. ISSN 2022, 2252, 8938. [Google Scholar] [CrossRef]
- Johora, F.T.; Hickey, C.J.; Yasarer, H. Predicting Geotechnical Parameters from Seismic Wave Velocity Using Artificial Neural Networks. Appl. Sci. 2022, 12, 12815. [Google Scholar] [CrossRef]
- Mermerdaş, K.; Arbili, M.M. Explicit formulation of drying and autogenous shrinkage of concretes with binary and ternary blends of silica fume and fly ash. Constr. Build. Mater. 2015, 94, 371–379. [Google Scholar] [CrossRef]
- Arbili, M.M.; Ghaffoori, F.K.; Mermerdaş, K. Statistical analysis of the performance of the soft computing based prediction model for shrinkage of concrete including mineral admixtures. ZANCO J. Pure Appl. Sci 2016, 28, 574–579. [Google Scholar]
- Ghoreishi, B.; Khaleghi Esfahani, M.; Alizadeh Lushabi, N.; Amini, O.; Aghamolaie, I.; Hashim, N.A.; Alizadeh, S.M. Assessment of geotechnical properties and determination of shear strength parameters. Geotech. Geol. Eng. 2021, 39, 461–478. [Google Scholar] [CrossRef]
- Hameed, H. Water Harvesting in Erbil Governorate, Kurdistan Region, Iraq: Detection of Suitable Sites Using Geographic in-Formation System and Remote Sensing. Master’s Thesis, Lund University, Lund, Sweden, 2013. [Google Scholar]
- Jassim, S.Z.; Goff, J.C. Geology of Iraq: Dolin; Prague and Moravian Museum: Brno, Czech Republic, 2006; p. 408. [Google Scholar]
- Al-Sanjari, M.N.; Al-Tamimi, M.A. Interpretation of water quality parameters for Tigris River within Mosul City by using principal components analysis. Tikrit J. Pure Sci. 2009, 14, 68–74. [Google Scholar]
- Das, B.M.; Sivakugan, N. Principles of Foundation Engineering; Cengage Learning: Belmont, CA, USA, 2018. [Google Scholar]
- Fernando, H.; Nugroho, S.A.; Suryanita, R.; Kikumoto, M. Prediction of SPT value based on CPT data and soil properties using ANN with and without normalization. Int. J. Artif. Intell. Res. 2021, 5, 123–131. [Google Scholar] [CrossRef]
- Chakraborty, A.; Goswami, D. Prediction of slope stability using multiple linear regression (MLR) and artificial neural network (ANN). Arab. J. Geosci. 2017, 10, 385. [Google Scholar] [CrossRef]
- Duong, T.V.; Tang, A.M.; Cui, Y.J.; Trinh, V.N.; Dupla, J.C.; Calon, N.; Canou, J.; Robinet, A. Effects of fines and water contents on the mechanical behavior of interlayer soil in ancient railway sub-structure. Soils Found. 2013, 53, 868–878. [Google Scholar] [CrossRef]
- Ebrahimi, A. Behavior or fouled ballast. In Railway Track and Structures; Simmons-Boardman Publishing Corporation: New York, NY, USA, 2011; Volume 107. [Google Scholar]
- Kim, D.; Sagong, M.; Lee, Y. Effects of fine aggregate content on the mechanical properties of the compacted decomposed gra-nitic soils. Constr. Build. Mater. 2005, 19, 189–196. [Google Scholar] [CrossRef]
- Inam, A.; Ishikawa, T.; Miura, S. Effect of principal stress axis rotation on cyclic plastic deformation characteristics of unsaturated base course material. Soils Found. 2012, 52, 465–480. [Google Scholar] [CrossRef]
- Wang, Q.; Tang, A.M.; Cui, Y.J.; Delage, P.; Barnichon, J.D.; Ye, W.M. The effects of technological voids on the hydro-mechanical behaviour of compacted bentonite–sand mixture. Soils Found. 2013, 53, 232–245. [Google Scholar] [CrossRef]
- Koester, J.P. The influence of test procedure on correlation of Atterberg limits with liquefaction in fine-grained soils. ASTM Geotech. Test. J. 1992, 15, 352–361. [Google Scholar]
- Mitchell, J.K.; Soga, K. Fundamentals of Soil Behavior; John Wiley & Sons: New York, NY, USA, 2005. [Google Scholar]
- Bogati, K. Ground Improvement by Jet Grouting Techniques. Bachelor’s Thesis, HAMK University of Applied Sciences Construction Engineering, Amberg, Germany, 2019. [Google Scholar]
- Carter, M.; Bentley, S.P. Correlations of Soil Properties; Pentech Press Publishers: London, UK, 1991. [Google Scholar]
- Likos, W.J.; Song, X.; Xiao, M.; Cerato, A.; Lu, N. Fundamental challenges in unsaturated soil mechanics. Geotech. Fundam. Addressing New World Chall. 2019, 209–236. [Google Scholar] [CrossRef]
- Spagnoli, G.; Feinendegen, M. Relationship between measured plastic limit and plastic limit estimated from undrained shear strength, water content ratio and liquidity index. Clay Miner. 2017, 52, 509–519. [Google Scholar] [CrossRef]
- Casagrande, A. Notes on the design of the liquid limit device. Geotechnique 1958, 8, 84–91. [Google Scholar] [CrossRef]
- Gardner, C.M.; Robinson, D.; Blyth, K.; Cooper, J.D. Soil water content. In Soil and Environmental Analysis; CRC Press: Boca Raton, FL, USA, 2000; pp. 13–76. [Google Scholar]
- Das, B.M.; Das, B.M. Advanced Soil Mechanics; Taylor & Francis: New York, NY, USA, 2008. [Google Scholar]
- Wu, W.; Mhaimeed, A.S.; Al-Shafie, W.M.; Ziadat, F.; Dhehibi, B.; Nangia, V.; De Pauw, E. Mapping soil salinity changes using re-mote sensing in Central Iraq. Geoderma Reg. 2014, 2, 21–31. [Google Scholar] [CrossRef]
- Khudhur, S.M.; Khudhur, N.S. Soil pollution assessment from industrial area of Erbil City. J. Zankoi Sulaimani 2015, 17, 225–238. [Google Scholar] [CrossRef]
- Aldefae, A.H.; Mohammed, J.; Saleem, H.D. Digital maps of mechanical geotechnical parameters using GIS. Cogent Eng. 2020, 7, 1779563. [Google Scholar] [CrossRef]
- Nam, S.; Gutierrez, M.; Diplas, P.; Petrie, J. Determination of the shear strength of unsaturated soils using the multistage direct shear test. Eng. Geol. 2011, 122, 272–280. [Google Scholar] [CrossRef]
- Bapeer, G.B. The study of infiltration rate and atterberg limits of soils in Koi Sanjaq City, Erbil Governorate, Kurdistan Region, North Iraq. Iraqi Bull. Geol. Min. 2011, 7, 41–55. [Google Scholar]
- Nareeman, B.J.; Fattah, M.Y. Effect of Soil Reinforcement on Shear Strength and Settlement of Cohesive Frictional Soil. Geomate J. 2012, 3, 308–313. [Google Scholar] [CrossRef]
- Gunduz, Z.; Arman, H. Possible relationships between compression and recompression indices of a low-plasticity clayey soil. Arab. J. Sci. Eng. 2007, 32, 179. [Google Scholar]
- Qurtas, S.S. Using groundwater levels and Specific Yield to Estimate the Recharge, South of Erbil, Kurdistan Region, Iraq. Acad. J. Nawroz Univ. 2018, 7, 191–196. [Google Scholar] [CrossRef]
- Bowles, J. Foundation Analysis and Design; McGraw-Hill Book Company: New York, NY, USA, 1982; 816p. [Google Scholar]
- Kumar, R.; Bhargava, K.; Choudhury, D. Estimation of engineering properties of soils from field SPT using random number generation. INAE Lett. 2016, 1, 77–84. [Google Scholar] [CrossRef]
- Hasan, A.M.; Mawlood, Y.; Ahmed, A.A.; Ibrahim, H. Correlation of Shear Wave Velocity with SPT-N for a Tower-Building Site at Erbil City. J. Duhok Univ. 2020, 23, 235–245. [Google Scholar] [CrossRef]
- Mahmoud, M.A. Reliability of using standard penetration test (SPT) in predicting properties of silty clay with sand soil. Int. J. Civ. Struct. Eng. 2013, 3, 545–556. [Google Scholar]
- Myslivec, A.; Kysela, Z. The Bearing Capacity of Building Foundations; Elsevier: Amsterdam, The Netherlands, 2014. [Google Scholar]
- Das, B.M.; Sivakugan, N. Fundamentals of Geotechnical Engineering; Cengage Learning: Belmont, CA, USA, 2016. [Google Scholar]
- Dauji, S.; Rafi, A. Spatial interpolation of SPT with artificial neural network. Eng. J. 2021, 25, 109–120. [Google Scholar] [CrossRef]
- Jasim, M.M.; Al-Khaddar, R.M.; Al-Rumaithi, A. Prediction of bearing capacity, angle of internal friction, cohesion, and plasticity index using ANN (case study of Baghdad, Iraq). Int. J. Civ. Eng. Technol. 2019, 10, 2670–2679. [Google Scholar]
- Ïpek, E.; McKee, S.A.; Caruana, R.; de Supinski, B.R.; Schulz, M. Efficiently exploring architectural design spaces via predictive modeling. ACM SIGOPS Oper. Syst. Rev. 2006, 40, 195–206. [Google Scholar] [CrossRef]


Disclaimer/Publisher’s Note: The statements, opinions and data contained in all publications are solely those of the individual author(s) and contributor(s) and not of MDPI and/or the editor(s). MDPI and/or the editor(s) disclaim responsibility for any injury to people or property resulting from any ideas, methods, instructions or products referred to in the content. |
© 2023 by the authors. Licensee MDPI, Basel, Switzerland. This article is an open access article distributed under the terms and conditions of the Creative Commons Attribution (CC BY) license (https://creativecommons.org/licenses/by/4.0/).