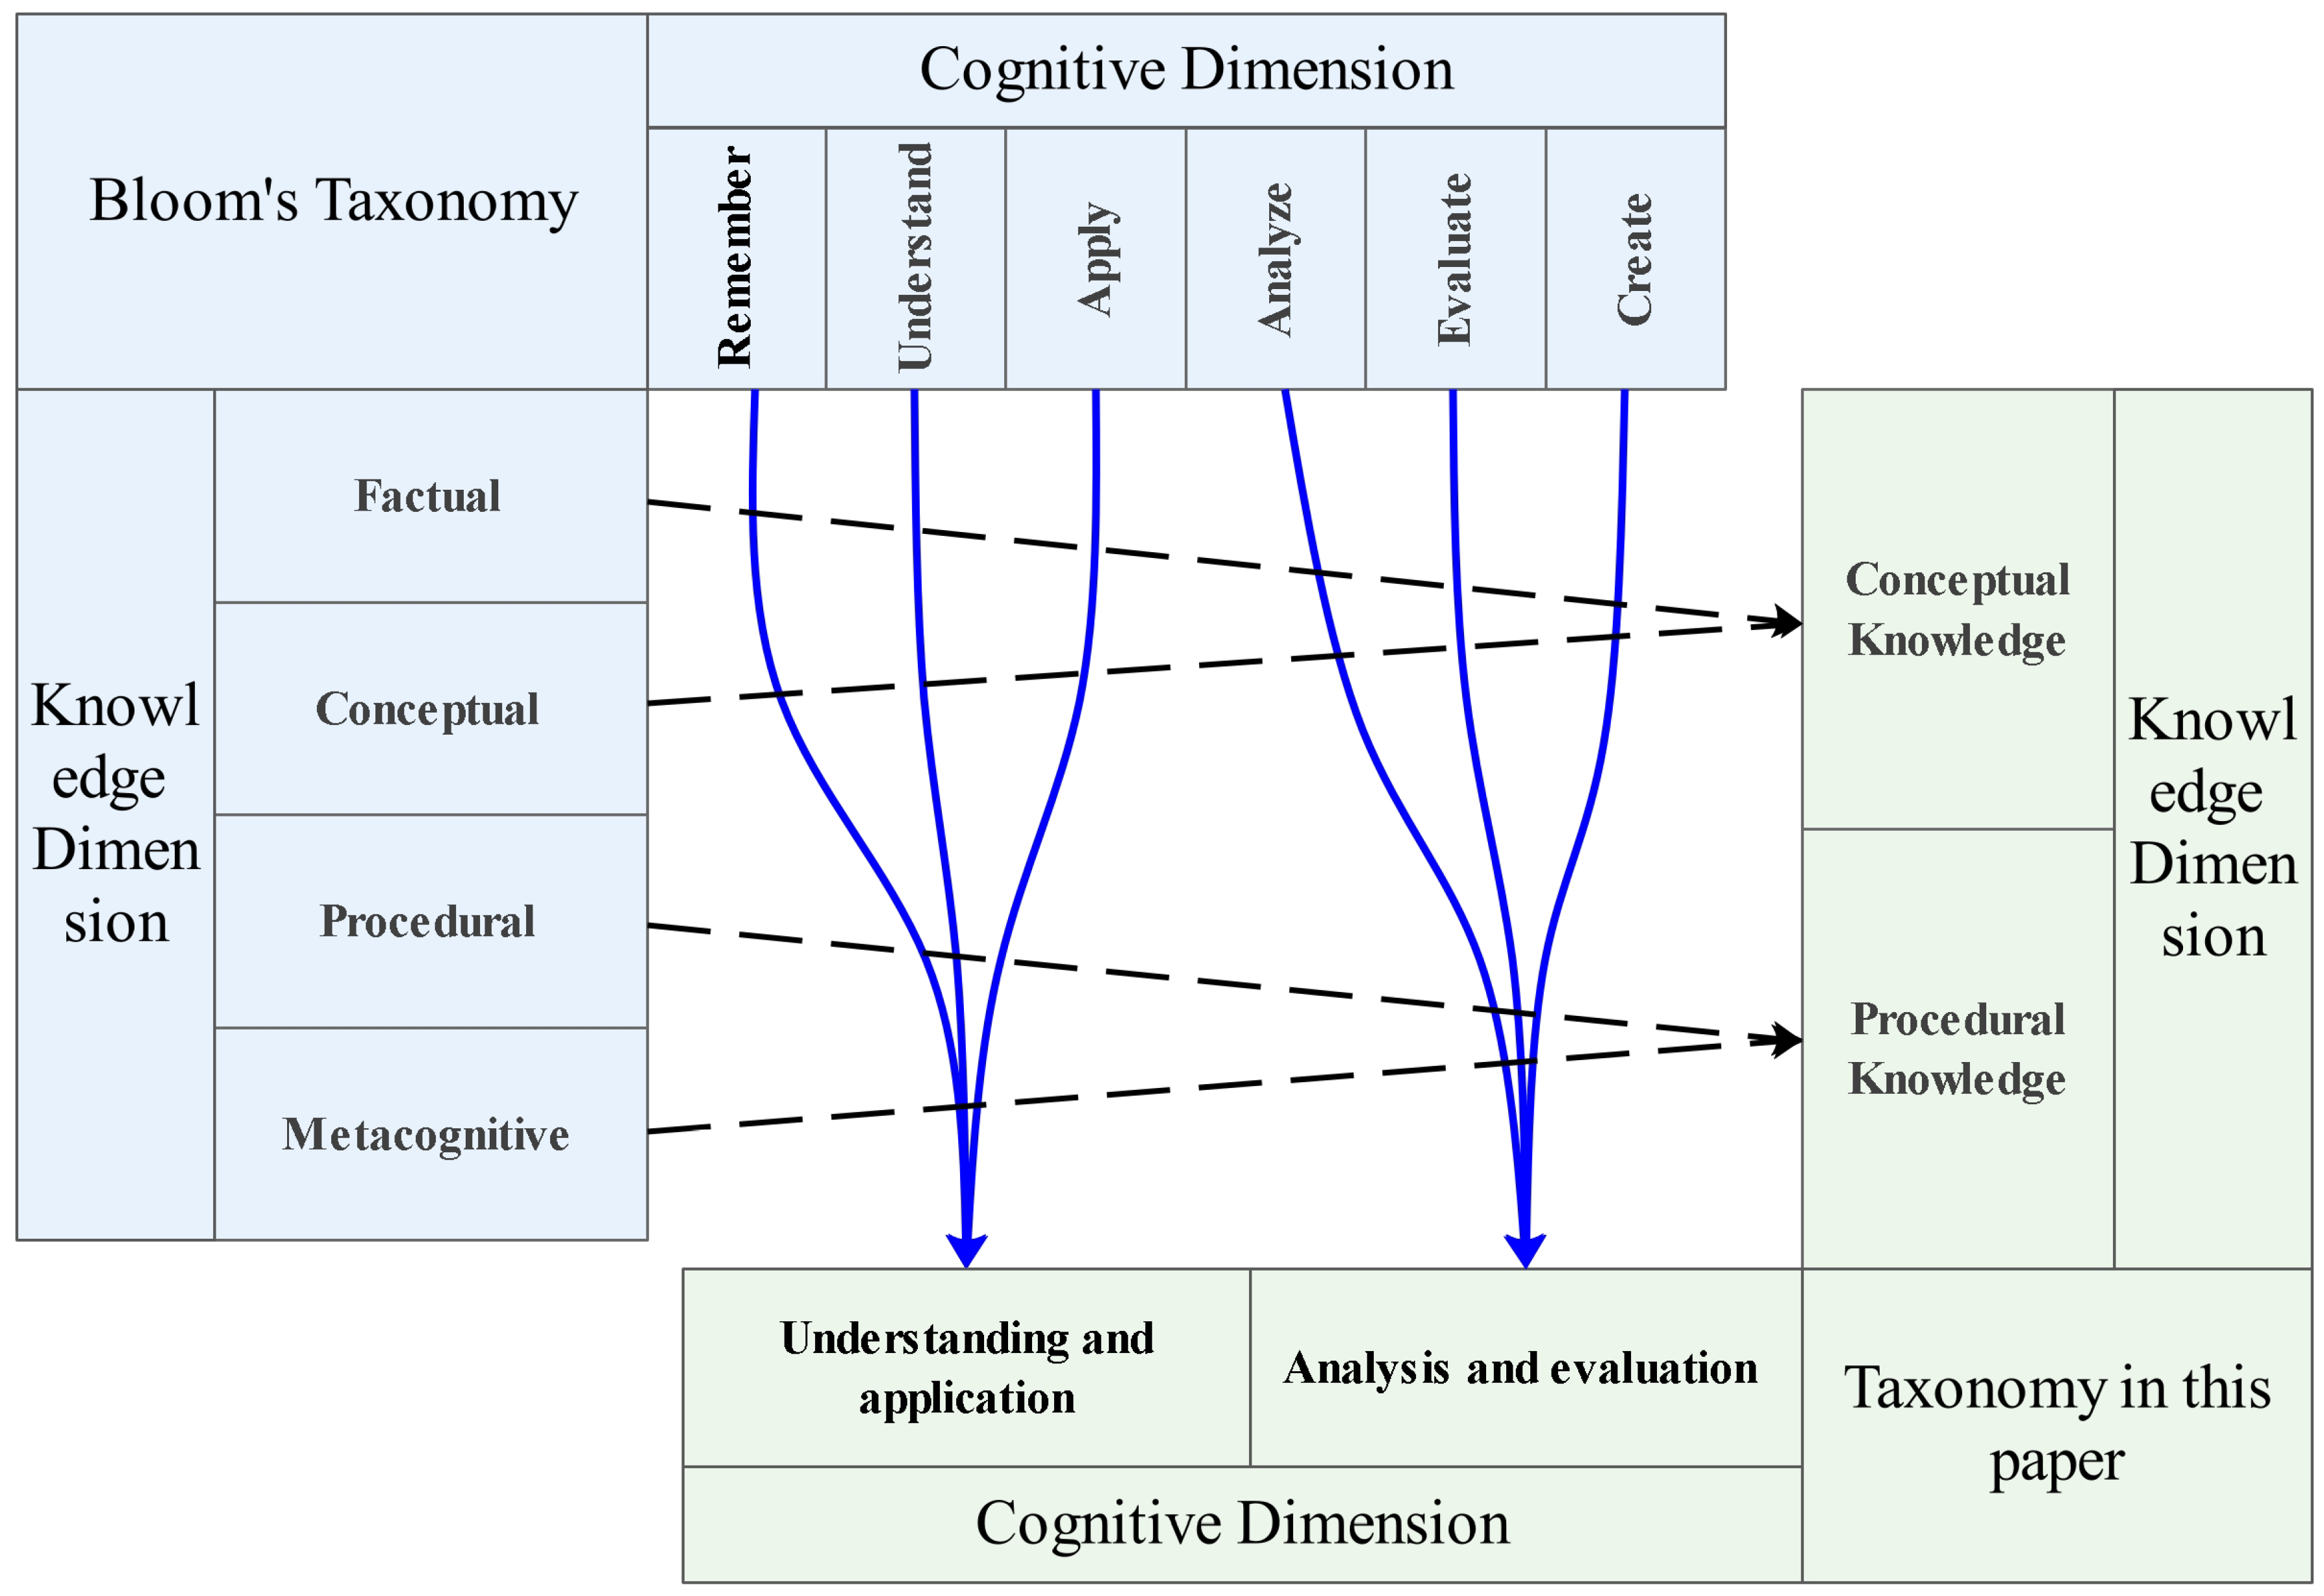
Article

Relationship Recognition between Knowledge and Ability Based on the Modularity of Complex Networks

1
College of Electrical and Information Engineering, Beihua University, Jilin 132000, China
2
Faculty of Education, East China Normal University, Shanghai 200000, China
*
Authors to whom correspondence should be addressed.
Sustainability 2023, 15(5), 4119; https://doi.org/10.3390/su15054119
Submission received: 1 January 2023 / Revised: 17 February 2023 / Accepted: 22 February 2023 / Published: 24 February 2023
(This article belongs to the Topic Education and Digital Societies for a Sustainable World)

Abstract

:
The purpose of formal education is to increase students’ abilities, and its content is to impart knowledge through various courses. Thus, it is essential to accurately identify the relationship between knowledge and students’ ability increment to ensure the quality of education and the sustainable development of education. Currently, this relationship is mainly established based on previous educational data and teachers’ experience, which is often imprecise. This paper proposes a framework for knowledge and ability recognition based on the structural characteristics of complex network modules. The proposed framework utilizes a knowledge cognitive-interdependent network model (KCIN) as its object. First, the key knowledge nodes are identified via cognitive convergence flow of knowledge nodes in KCIN. Subsequently, the module structure of the knowledge network is identified by taking the key knowledge nodes as the core. Finally, the relationship between knowledge and ability is established by identifying the similar attributes of nodes in complex network modules. To validate the framework, we use teaching process data on the Data Structure course, which is a fundamental course for Information majors. The results show that the framework can effectively optimize the knowledge–ability relationship acquired from previous data and teacher experience.

1. Introduction

1.1. Knowledge and Ability

The relationship between knowledge and ability has been an enduring topic and a classic problem [1]. The acquisition of knowledge and the addition of competence both constrain and reinforce each other. According to the philosopher Locke, man is able to acquire knowledge from sensory experiential material because he possesses a certain number of native abilities, such as memory, attention, comparison, observation, and abstraction [2]. Bruner, who is the representative of structuralism, argued that the purpose and task of teaching should not focus solely on enabling students to master the necessary knowledge and skills, and should develop their abilities as well. He believed that proficiency in knowledge structure could lead to an increased ability to use knowledge effectively, emphasizing the importance of knowledge structure and meaningful connections between knowledge [3]. Xing et al. have suggested that, from the viewpoint of performance and development of ability, knowledge is formed and developed in part through the process of mastering skills; from the viewpoint of the counteraction of ability to knowledge and skills, a certain ability is necessary for attaining further mastery of both knowledge and skills. This implies that ability is both the premise of mastering knowledge and the result of mastering knowledge, and as such there is both a mutual dependency and interdependence [4]. Wang et al. proposed that knowledge is the basis of ability development, intelligence is the crystallization of knowledge, development of ability can improve the speed and quality of knowledge mastery, and the goal of ability is the premise of converting knowledge into ability [5]. Li et al. viewed competency as an organized knowledge system and linked the relevant knowledge scattered in various courses and chapters into a network system. They argued that the problem of competency is fundamentally a problem of knowledge, and that its solution requires a detailed and in-depth study of knowledge [6]. In summary, knowledge and ability are closely related. This paper mainly investigates the supportive relationship between knowledge and ability in formal education, such as the relationship between the KMP algorithm and EPSA in the data structure course, which indicates that learning KMP algorithm knowledge can enhance students’ engineering problem design ability.

1.2. Knowledge Graph and Ability Enhancement

The identification of the relationship between knowledge and ability requires the expression of knowledge relations and the evaluation of capability enhancement. According to Wang Xiaoming and other scholars, knowledge is the subjective representation of people on objective things and laws, while ability signifies the personal psychological characteristics that promote completing activities smoothly and achieving the desired purpose. Knowledge is divided into conceptual knowledge and procedural knowledge. Conceptual knowledge is reflected in “understanding (or not) what and how”, while procedural knowledge is reflected in “how to do”; skill is reflected in “can (or not) do”; finally, ability is reflected in “can solve, can do, can finish”. Knowledge is the basis of ability. The deeper the understanding of knowledge and the firmer the mastery of it, the more skillful the corresponding skill is, which is conducive to the improvement of ability [7]. Yang Dingsheng believe that knowledge and ability are not one-to-one correspondences. The formation of one ability may require the interaction of multiple areas of knowledge, while multiple abilities may require the same knowledge. The relationship between knowledge and ability can be divided into two aspects: first, knowledge learning is the basis of ability appreciation, as without a certain amount of knowledge to support, it is impossible to produce good ability appreciation; second, ability appreciation is the ultimate goal of knowledge learning, as without ability appreciation knowledge is only be a set of simple memories [8].
As a visual tool for scientific knowledge, knowledge graphs [9] can effectively help students to identify the relationship between knowledge points. Using the knowledge graph approach, it is possible to effectively integrate fragmented knowledge on the subject, helping students to master the subject systematically. In this way, we can understand the changing and developing situation of the field of knowledge in order to effectively improve students’ learning efficiency [10,11,12,13]. Bernal first invented the subject map in 1939, and Ellingham used manually drawn charts to show the relationship between subjects in 1948 [14]. Knowledge graphs are essentially a kind of knowledge base called semantic networks, that is, a knowledge base with a directed graph structure. The nodes of the graph represent entities or concepts, and the edges of the graph represent various semantic relationships between entities or concepts [15]. Ding Guofu built a fine knowledge point map and ability point map for each teaching link, studied the integration mapping relationship between knowledge points and ability points, constructed a teaching system based on knowledge and ability integration evaluation, recorded the knowledge point map and ability point map of students’ life cycle education, and tracked it throughout the process, enabling the teaching effect to be evaluated, tracked, analyzed, and improved [16]. Petri-Net builds a knowledge map, then uses students’ learning history to predict their learning effect when studying future concepts in the future and maximize their learning results [17].
Value-Added Assessment is a developmental evaluation model which mainly adopts quantitative evaluation methods [18]. It evaluates the educational effectiveness of students by quantifying the increase in their learning abilities during the learning process [19]. This assessment method combines the advantages of predictive, formative, and summative evaluation, with the learner’s original ability level as the “initial value”, the ability level at a certain stage of the learning process as the “current value”, and the ability level after the end of the learning process as the “final value”, dividing the evaluation process into three parts [20]. This method is increasingly being recognized by schools all over the world. British scholars first systematically introduced the implementation of value-added assessment in their country in 1998 and the system showed good system stability, which attracted the reference of other countries such as the Netherlands [21]. Many states in the United States have developed and applied value-added assessment systems, including the Tennessee Value-Added Assessment System and Dallas Value-Added Assessment System [22].

1.3. Research Problem

In the process of continuous knowledge teaching, schools need to realize the gradual improvement of students’ abilities [23]. In this process, it is necessary to accurately recognize the relationship between knowledge and capability, which is a key link in achieving sustainable development in education as well [24]. However, this relationship is not a specific and clear quantitative relationship; rather, it is a fuzzy and generalized qualitative relationship [25]. Even within the same course, the relationship between knowledge and ability may be different due to the differences in the teachers and students involved, and potentially even very different. The relationship between knowledge and ability is usually based on the course divisions according to the learning order and the content proximity of knowledge points. The increment of ability is mainly evaluated through the score values of all the corresponding knowledge points. Adopting this approach to obtain the knowledge and ability relationship ignores the mutual influence between knowledge points. In order to make up for the inadequacies of qualitative identification methods for knowledge and ability relations based on experience, this paper proposes a knowledge and ability relation recognition framework based on the module feature of the knowledge relation network model. According to the cognitive dimension, the knowledge-dependent network model is constructed, then the key knowledge nodes are identified based on the network structure feature. Taking the key knowledge nodes as the core, the network module structure is identified and the corresponding relationship between the knowledge module and ability is established to realize the recognition of knowledge and ability relations.

2. Materials and Methods

2.1. KCIN Construction

Learning cognitive views and constructivist perspectives suggest that the achievement of a specific learning goal is based on a cognitive process of certain knowledge [26]. In order to recognize the relationship between knowledge and ability, we construct a KCIN based on the course knowledge graph of a course [27] according to the dimension of cognitive process, which serves as the foundation for recognizing the relationship between knowledge and ability. The nodes in the KCIN are the course knowledge points, and the edges are the relationships between knowledge nodes. The extraction of course knowledge points mainly relies on the teacher’s experience. First, the course content is determined according to the location and role of the course in the cultivation program, then the course content is gradually constructed into a tree-shaped course knowledge point graph. The knowledge points that serve as the leaf nodes are the nodes of the KCIN. There is no fixed requirement for the number of nodes, and certain nodes are connected by edges. Whether there is an edge between two nodes is determined by the knowledge content they represent. If node A must be studied before node B is studied, there exists an edge from B to A, and the weight of the edge is the degree of influence of B’s content on learning A, which is divided into five levels corresponding to 0.5, 0.4, 0.3, 0.2, and 0.1, respectively.
Referring to the common characteristics of the knowledge dimension and cognitive process dimension expressed by Bloom’s Cognitive Structure Learning Theory [28,29,30], we divide the network nodes into conceptual knowledge nodes and procedural knowledge nodes and the cognitive process dimension into the understanding application dimension and analysis evaluation dimension, separately constructing an understanding and application knowledge network (UAKN) and an analysis and evaluation knowledge network (AEKN). The relationship between our taxonomy and Bloom’s taxonomy is shown in Figure 1. The three cognitive process dimensions of Bloom (remember, understand, and apply) are equivalent to the understanding analysis dimension in this paper, while the three cognitive process dimensions (analyse, evaluate, and create) are equivalent to our analysis evaluation dimension. Moreover, Bloom’s factual and conceptual knowledge are equivalent to our conceptual knowledge, and Bloom’s procedural and metacognitive knowledge are equivalent to our procedural knowledge.
In UNKN, “understanding” refers to comprehending meaning, then transforming, rewriting, and explaining issues; as such, it refers to learners’ ability to express questions in their own language. The application of UNKN refers to learners being able to apply the concepts they have learned to new situations or use their learned knowledge in other scenarios [31]. The edges in UNKN represent the supporting relationships between different conceptual knowledge nodes as well as the support relationships between conceptual knowledge nodes and procedural knowledge nodes, which have directions; the starting nodes are conceptual knowledge nodes, while the terminal nodes are either conceptual or procedural knowledge nodes. Analysis in AEKN refers to decomposing a learning target into its components and determining how they are related to each other in order to understand the original target. Evaluation in AEKN refers to students being able to evaluate the value of certain viewpoints according to certain evaluation criteria [31]. The edges in AEKN represent the support relationships between different procedural knowledge nodes and the support relationships between procedural knowledge nodes and conceptual knowledge nodes, which have directions; both the starting nodes and terminal nodes are procedural knowledge nodes. Finally, the KCIN is constructed based on the correspondence and connections between the same nodes in the UNKN and AEKN.

2.2. Recognition of Key Knowledge Nodes

Based on the structural characteristics of KCIN [32,33,34] and the basic equation of information science proposed by Belkin [35,36], we extract the flow-in tree of each node i in UNKN and AENK. The flow-in tree is a tree-like structure with node i as the root node that contains all the incoming path nodes connected to it and all the edges in the tree pointing from lower-level nodes to higher-level nodes. We identify the key conceptual and procedural knowledge nodes by taking the root node keyness in the flow-in tree as the criterion for judging the importance of the node.
The key degree μ i calculation equation of root node i is
μ i = j ω , i j k j i l k ( θ )
where ω is the leaf node of the inflow tree extracted with i as the root node and l k ( θ ) is the weight of edge k in the path from node j to node i.

2.3. KCIN Module Identification

The relationship between knowledge and ability is a one-to-many relationship, where the enhancement of each ability requires the support of many knowledge points. Modularity is an important attribute generally possessed by complex networks, and the connections between nodes within a module are relatively dense, the connections between modules are relatively sparse, and nodes in the same module often have similar properties [37,38]. In order to identify the modular structure of the KCIN, we first merged the two nodes connected by the dependent edge into one node, then utilized the spectral clustering method to recognize the merged network [39]. The idea of the spectral clustering algorithm is derived from graph partition theory, which regards the clustering problem as a multi-way partition problem of an undirected graph. As KCIN is a directed weighted network, it can better exploit the characteristics of the spectral clustering algorithm. We tried other clustering methods such as hierarchical clustering; however, the clustering results were not as good as spectral clustering. The main idea of the spectral clustering algorithm is to extract the features of objects using the normalized random walk Laplacian matrix proposed by Shi and Malik [40], then to infer the structural relationship between the objects using the extracted features.
The main process is as follows:
  • The radius search method or nearest neighbor method is used to define a local neighborhood for each node, then the bidirectional distance D i s t i , j of all points i and j in the neighborhood is calculated.
  • The bidirectional distance D i s t i , j is converted into a similarity measure by kernel transformation, as shown in Equation (2):
    S i , j = exp ( ( D i s t i , j σ ) 2 )
    where the matrix S is the similarity matrix and σ is the scale factor of the kernel.
  • The non-normalized Laplacian matrix is calculated and either the random walk Laplacian matrix or the symmetric Laplacian matrix is normalized.
  • A matrix V is created with k columns, where the columns are k eigenvectors corresponding to the k minimum eigenvalues of the Laplacian matrix.
  • Each row of matrix V is regarded as a node, which are clustered by the k-means or k-medioids clustering methods.
  • Knowledge nodes are assigned to the same cluster as their corresponding rows in matrix V.

2.4. Relationship Determination and Ability Quantification

The main goal of this paper is to propose a framework for identifying the set of knowledge points with the highest correlation to a certain ability among many knowledge points. Since the main goal of course teaching is to cultivate students’ abilities through the learning of knowledge; the most important purpose of determining the relationship between knowledge and ability is to use it as a basis for quantitative evaluation of abilities, and the accuracy of ability quantification is an effective criterion for verifying recognition results as well. In order to make the ability quantification simple and feasible, we propose an ability quantification method based on the assessment results of the knowledge points provided by the teacher in the learning process. The abilities supported by knowledge learning are derived from the syllabus. We determine the relationship between knowledge points and abilities based on the key knowledge points and module recognition results of KCIN. First, according to the instructor’s understanding of the course objectives and teaching experience, a one-to-one support relationship is established between the key knowledge points with the highest importance and the abilities that are most relevant to the target. In this way, each ability corresponds to a key knowledge point. Then, according to the module recognition results of the knowledge points, a one-to-many support relationship is established between all the knowledge nodes in the module in which the key knowledge points have been associated with abilities and the target of the ability. The process is shown in Figure 2.
According to the relationship between knowledge node and ability, we can calculate ϕ x , which is the increment of ability x, as shown in Equation (3):
ϕ x = p , y m o d u l e x α φ y φ y φ p φ p + 1 α γ y γ y γ p γ p
where m o d u l e x represents all knowledge nodes in the module corresponding to ability x, α is a weighting parameter which mainly serves to differentiate the support of knowledge points to different cognitive dimensions in terms of their ability to achieve the desired objectives. Teachers should set this parameter according to the specific ability.
The degree of conceptual knowledge nodes y for cognitive dimensions of understanding and application φ y , as shown in Equation (4):
φ y = V ( y ) ( 1 y c i n p u t y η ( y c ) ) + y c i n p u t y [ η ( y c ) φ y c ]
The degree of conceptual knowledge nodes y for cognitive dimensions of analysis and evaluation γ y is shown by Equation (5):
γ y = y c i n p u t y [ η ( y c ) φ y c ]
where y c is the preordered node of knowledge node y, η ( y c ) is the weight of the edge with node c pointing to point y, inputy is the preordered node set of node y, and V(y) is the fraction of knowledge node y.
The degree of conceptual knowledge nodes p for cognitive dimensions of understanding and application φ p is shown by Equation (6):
φ p = p g i n p u t p [ η ( p g ) γ p g ]
The degree of conceptual knowledge nodes p for cognitive dimensions of analysis and evaluation γ p is shown in Equation (7):
γ p = V ( p ) ( 1 p g i n p u t p η ( p g ) ) + p c i n p u t p [ η ( p g ) γ p g ]
where p g is the preordered node of knowledge node p, η ( p g ) is the weight of the edge with node g pointing to point p, inputp is the preordered node set of node p, and V(p) is the fraction of knowledge node p.

2.5. Data for Validation

In order to verify the effectiveness of this framework, we applied it to a course on Data Structure. This framework can be used for all courses, and can be used for various professional talent cultivation systems as well, without any restriction in terms of the course type. The reason why we chose a Data Structure course to validate the effectiveness is that we teach this course at Beihua University, meaning that we were able to collect complete teaching process data and obtain consent of the 114 registered students to use their learning process data for research. The Data Structure course involves teaching students the theoretical foundations of programming. We collected and analyzed the syllabus for the Data Structure course from ten universities, as shown in Table 1, and extracted 42 knowledge points based on the syllabus of Beihua University, including 24 conceptual knowledge points and 18 programming knowledge points, as shown in Table 2. The syllabus included clear teaching knowledge points, ability cultivation objectives, and the relationship between knowledge and ability. The teaching knowledge points were derived from the knowledge content involved in program design using data structure, the ability cultivation objectives were derived from the overall objectives of the student training scheme, and the knowledge and ability relationship was extracted based on the subjective experience of teachers and experts in the field. The relationship between the knowledge and abilities identified by this framework was then compared with that of the knowledge and abilities in the syllabus.

3. Results

3.1. KCIN of the Data Structure Course

Based on the method introduced in Section 2.1 and the data in Section 2.5, we constructed the KCIN of the Data Structure course as shown in Figure 3, Figure 4 and Figure 5. The square nodes represent the understanding–application dimension of the knowledge points, while the circular nodes represent the analysis–evaluation dimension of the knowledge points. Figure 3 is the KCIN of the course, Figure 4 is the AEKN in the KCIN of the course, and Figure 5 is the UAKN in the KCIN of the course. The direction of the edges in UAKN and AEKN is from the precedential knowledge points to the subsequential knowledge points, while the weight of the edges is the support degree from the precedential knowledge points to the subsequential knowledge points. The precedential knowledge points refer to the knowledge points of a more basic nature which need to be learned prior to the subsequential knowledge points. The interdependent edges between UAKN and AEKN have no direction or weight, and connect the same knowledge points between the two cognitive dimensions.
Using the Pajek software [41], we calculated the basic structural characteristics of AEKN and UAKN, as shown in Table 3. The in-degree of UAKN is 29.13% that of AEKN, the out-degree is 2.79 times that of AEKN, the clustering coefficient [42] is two times that of AEKN, and the betweenness centrality [43] is similar. The in-degree measures the amount of prerequisite knowledge required in the learning process, the out-degree measures the support of the learned knowledge for subsequent learning, the clustering coefficient measures the closeness of the relationship between knowledge points, and the betweenness centrality measures the necessity of learning knowledge points. Compared with AEKN, UAKN has less in-degree and more out-degree, indicating that UAKN is better able to express the characteristic relations of the basic cognitive dimension of the knowledge points, which is in line with the understanding and application dimension characteristics. The higher clustering coefficient of UAKN compared to AEKN indicates that the relationship between knowledge points in the understanding and application dimensions is closer. From the cognitive point of view, understanding and application is the basis of analysis and evaluation, and the structure of the basic cognitive stage is closer to the characteristics of cognition. These network characteristics further confirm the accuracy of our network model.

3.2. The Supporting Relationship of Knowledge and Ability

3.2.1. Extracting Ability Objectives for the Course

As an engineering course, the training goal of Data Structure course is mainly based on international general engineering certification standards. Based on the ability objectives of the syllabus of Beihua University, we referred to the syllabi of other nine universities, as mentioned in in Section 2.5 and Table 1, and extracted five engineering abilities that the course supports: Advanced Programming Language Application Ability (APLA), Engineering Problem Expression Ability (EPEA), Complex System Mathematical Model Building Ability (CSMA), Engineering Problem Solution Design Ability (EPSA), and Data Analysis and Processing Ability (DAPA). There are differences in the ability development objectives among different universities, which mainly derive from the schools’ orientation and their students’ foundations. As the performance data of 114 course-choosing students in Beihua University were the basic data used for evaluation in this paper, we considered it more reasonable to take the ability objectives in the teaching syllabus of Beihua University as the main basis. The different cognition dimensions of knowledge have different support relationships with different abilities. The support relationship between the cognitive dimensions of knowledge and engineering abilities with respect to the Data Structure course is shown in Table 4.

3.2.2. Identification of Key Knowledge Nodes

We identified the key knowledge nodes among the 42 knowledge nodes in the Data Structure course according to the method described in Section 2.2. Because there were a total of five competencies supported by this course, we extracted the five knowledge nodes with the largest weights, as shown in Table 5. The five key knowledge nodes for understanding the application dimension are tree-based look-up, minimum spanning tree, B-tree, keyword tree, and traversing binary tree, while the five key knowledge nodes for the analytical evaluation dimension are the complexity of the algorithm, S-list, linked list, sequence list, and external sort.

3.2.3. Module Identification

All nodes in the network module identified based on the feature recognition of the network module were taken as the supporting knowledge nodes of the ability. In order to identify the module structure in KCIN, we merged the two dependent nodes into one node to obtain the combined network of UAKN and AEKN according to the dependence relationship of the nodes in KCIN. Then, the module structure of KCIN in the Data Structure course was identified according to the spectral clustering method introduced in Section 2.3. We set the number of modules according to the number of key knowledge nodes and used continuously clustering until each key knowledge node belonged to a different module; that is, each identified module contained only one key knowledge node. Finally, modules containing key nodes of different dimensions were mapped to separate subnets of corresponding cognitive dimensions. Because knowledge nodes of the understanding application dimension support five abilities, we identified five knowledge modules based on five key knowledge nodes of UAKN, then took the knowledge nodes of these five modules as supporting knowledge nodes of APLA, EPEA, CSMA, EPSA, and DAPA, as shown in Figure 6. Similarly, as the knowledge nodes of the analysis and evaluation dimension support three abilities, we identified three knowledge modules according to the three key points of AEKN and took the knowledge nodes of these three modules as the supporting knowledge nodes of CSMA, EPSA, and DAPA, as shown in Figure 7.

4. Discussion

In order to validate the effectiveness of the knowledge and ability relationship recognition framework proposed in this paper, we used the knowledge and capability relationship identified by this framework in the Data Structures course introduced in Section 3.2. Then, based on the identified relationships and knowledge scores, the five ability values of each of the 114 students who enrolled in this course at Beihua University were calculated. Finally, the calculated ability values, ability values obtained from the traditional association relationship, and self-evaluation results of the 114 students’ abilities were compared. The knowledge scores were the scores of the various tests designed by the teacher that the 114 students performed during the learning process. The traditional knowledge and ability association relationships were taken from the corresponding relationships between the knowledge points and the ability goals in the syllabus, which were set by the teacher according to experience, and the ability values were the average of all the associated knowledge scores.
We verified the effectiveness of the recognition framework by examining the results. If the framework can effectively identify the relationship between knowledge and skills, all the knowledge points of a certain major can be merged into a set, and the relationship between knowledge points and skill objectives can be recognized through the framework. This helps to overcome teachers’ limited cognition of different courses, and at the same time can avoid excessive learning of knowledge with the same ability improvement effect, which is favorable for the sustainable development of education. The method used to verify the effectiveness of the framework was to compare the recognition results, the results of grading evaluation, and the self-evaluation results of the students. The closer the recognition results of the framework are to the self-evaluation results of the students compared to the grading evaluation results, the more effective the framework.

4.1. Analysis of Ability Value Distribution

The ability values were calculated according to the calculation method introduced in Section 2.4 and the relationship between knowledge points and abilities identified in Section 3.2, and the parameter α was set according to Table 4. The maximum value of the ability is the ability value when all the knowledge points are full marks. In order to facilitate measurement and comparison, we normalized the ability values and set the maximum value of the ability to ten points. The distribution of the five abilities of the 114 students is shown in Figure 8A, and the trend of the ability values of all students is shown in Figure 8B. From the figure, it can be seen that the distribution trend of the five abilities of all students is basically the same, and the size of the five abilities of each student is different, while the trend of the ability values relative to other students is the same. This phenomenon is in line with the general law of students’ ability enhancement, that is, although the range of individual abilities of the students is different, the range of abilities of good students is generally superior [44].

4.2. Ability Value Comparison Analysis

According to the correlation of knowledge points and abilities in the syllabus of Section 2.5, we associated knowledge and abilities. Then, based on the correlation, we calculated the ability values in the traditional way, which is to average all the corresponding knowledge point scores. The distribution of the five abilities values of 114 students calculated by this framework and in the traditional way are shown in Figure 9A–E, respectively. We calculated the correlation coefficients of the ability value distribution of the same ability item for two different modes [45] in order to measure the difference between the two in terms of the knowledge and ability relationship. The correlation coefficients of the calculation results of the five ability values of the 114 students using the two modes are shown in Figure 9F, which are 0.835, 0.838, 0.584, 0.763, and 0.760, respectively. It can be seen that the evaluation results of the two methods on APLA and EPEA are similar, while the evaluation results on CSMA, EPSA, and DAPA are quite different.

4.3. Analysis of Accuracy of Knowledge and Ability Relationship Recognition

Based on the discussion in Section 4.2, the ability values calculated by the relationship between knowledge and ability obtained by this framework are significantly different from those calculated by the relationship between knowledge and ability in the syllabus. To verify which one of the two results is more accurate, we compared the two ability values with the ability results evaluated by the students themselves. The main content of the questionnaire was the achievement of APLA, EPEA, CSMA, EPSA, and DAPA, for example, “ability to analyze the characteristics of practice problems, added-value achievement evaluation”, “ability to identify key links in complex problems, added-value achievement evaluation”, etc. The answers were divided into five levels: complete agreement (10 points), good agreement (8 points), agreement (6 points), basically agreement (4 points), and non-agreement (2 points). The reliability and validity [46] of the questionnaire are shown in Table 6. The results for Cronbach’s Alpha [47], Eigenvalues, Cumulative % of Variance [48], KMO [49], Bartlett’s Test of Sphericity [50], and df show that the survey is valid.
Through the survey questionnaire, we calculated the average self-evaluation values of five abilities for the 114 students. Then, we compared and analyzed the average values of the five abilities obtained from the knowledge and ability relation calculation in the framework of this paper with those from the knowledge and ability relation calculation in the syllabus and the self-evaluation values of 91 students for five ability increments. As shown in Figure 10, the trend of the five abilities curve obtained from the framework of this paper is very similar to that of the ability increments from the self-evaluation, with a correlation coefficient of 0.9079. The change trend of five ability values obtained from the support relation in the syllabus is significantly different from that of the ability values from the self-evaluation, with a correlation coefficient of −0.0233. Thus, it can be proven that the proposed knowledge–ability relation recognition framework can optimize the knowledge and ability relationship previously set by teachers’ experience.

5. Conclusions

The enhancement of students’ abilities is an essential link in sustainable development in education; universities in particular need to play a key role in R&D as well as in knowledge production and dissemination. To achieve the transition to a low-carbon and resource-saving economy, we need to introduce new tools, technologies, products, and production models through education. In order to transition to a green economy, we can introduce these new items into the field of vocational literacy, including engineering abilities and scientific literacy, which can help students to better understand and solve real-world problems. Scientific literacy can help humanity to better innovate knowledge systems [51]. While the imparting of knowledge is the main content of formal education, its purpose is also to realize the enhancement of students’ abilities. Therefore, an important issue that cannot be ignored in formal education is to accurately identify the support relationship between knowledge sets and ability enhancement, that is, the relationship between knowledge and ability. It is the basis for the design of student training scheme and the formulation of syllabus, and is an important basis for the evaluation of student value added. The main means of determining the relationship between knowledge and ability in the past has been based on the experience of teachers, which is the most effective and currently irreplaceable way. The knowledge and ability relationship recognition framework proposed in this paper is a supplement to the traditional experience method, with the aim of optimizing the recognition results of the traditional method. The framework is based on the modular characteristics of complex networks, and the nodes in the module have the characteristics of more similar attributes [52], which is suitable for identifying more related knowledge nodes.
This framework is based on the KCIN, and identifies key knowledge nodes according to the cognitive convergence flow of knowledge nodes. With the key knowledge nodes as the core, the knowledge network modules are identified and the nodes in the modules are taken as the supporting knowledge for capabilities. We applied this method to our Data Structure course and identified the relationship between 42 knowledge points and five capability objectives. To verify the accuracy of the recognition results, we calculated the five capability increments for each of the 114 students enrolled in the course based on their knowledge point scores. First, the results were compared with the capability values derived from the knowledge and capability relationships in the syllabus to measure the difference between the two approaches. Second, the capability increments of the 91 students enrolled in the course were used as the standard to assess the accuracy of the framework. The results show that the knowledge and capability recognition framework based on complex network modularity proposed in this paper can effectively optimize and supplement the traditional recognition methods based on experience.
The influence of the method used to build the KCIN on the relationship recognition result of the framework is considerable, and different KCINs may lead to different recognition results. Moreover, the extraction of knowledge points and abilities mainly relies on the teachers’ experience. In terms of ability evaluation, the calculation of ability values is greatly influenced by the α parameter, and the determination of α depends in turn on the teachers’ experience. This experience is mainly drawn from three aspects: first, the feedback from teachers on their own capabilities when completing engineering practice tasks with the knowledge contained in the course; second, surveys by graduates about the course, for which the α -value of each capability can be obtained directly from the graduates; and Third, surveys by enterprise engineers, in which the settings for the capabilities and related parameters are generally reflected by the questions on the survey questionnaire. Nevertheless, this framework is advantageous for recognizing the relationship between knowledge and abilities when there are a large number of knowledge points and a wide distribution of content. This is beneficial for breaking the course boundaries and more accurately evaluating the achievement of students’ abilities when it comes to student ability assessment, thereby contributing to sustainable development in education.

Author Contributions

Q.Z. contributed to the conceptualization of this study; Q.Z. designed the method of identifying supporting relationships between knowledge and ability; X.S. completed the investigation of student self-evaluation; Q.Z. and X.S. analyzed the data; Q.Z. completed all the visualizations for the paper; Q.Z. and X.S. contributed to the original draft preparation and to the review and editing of the original and revised manuscripts; Z.Z. contributed to the revised manuscripts; Q.Z. and Z.Z. acquired funding that allowed the completion of the study. All authors have read and agreed to the published version of the manuscript.

Funding

This research was funded by Natural Science Foundation of Jilin Province: Research on Individualized value-added method of iterative answer based on heterogeneous relational Network. (20230101238JC); Higher Education Teaching Reform Research Project of Jilin Province: Research on the Value-adding Model of Practical Ability of Applied Information Major Students in the Post-epidemic Period. (JLJY202377910357); Research project of Education Department of Jilin Province in 2023: Recognition method and application of hidden dependence Relation of multi-scale structures in complex networks with heterogeneous mode sources; University-Industry Collaborative Education Program: The practical case of information processing and its learning effect evaluation (202102181046); Jilin Province Vocational Education and Adult Education Teaching Reform Project: Research on Value-added Evaluation Index and Quantitative Method of Core ability of Higher Applied Engineering Talents (PX-10222010); 2023 Project of Jilin Province Science and Technology Development Plan (YDZJ202303CGZH001).

Institutional Review Board Statement

Ethical review and approval were waived for this study due to our study involves a self-evaluation survey of only students administered via an online anonymous survey. Participation was voluntary and the survey was consistent with course objectives without ethical implications.

Informed Consent Statement

Informed consent was obtained from all subjects involved in the study.

Data Availability Statement

The data used for this study are available upon request to the first author (Q.Z.) or author X.S.

Acknowledgments

This work would not have been possible without the generous contributions of the families that took part in the study, and all of the people involved in data collection and processing. Particularly, we want to acknowledge the contributions of Yonghe Wu, Hao Zheng, and Shuang Ma.

Conflicts of Interest

The authors declare no conflict of interest.

Abbreviations

The following abbreviations are used in this manuscript:
UAKNUnderstanding and application knowledge network
AEKNAnalysis and evaluation knowledge network
KCINKnowledge cognitive-interdependent network model
APLAAdvanced programming language application ability
EPEAEngineering problem expression ability
CSMAComplex system mathematical model building ability
EPSAEngineering problem solution design ability
DAPAData analysis and processing ability
R&DResearch and Development

References

  1. Yang, D.; Zhang, J. The dilemma and countermeasure of the study of “The Relationship between Knowledge and Ability”. Fujian Basic Educ. Res. 2018, 1, 22–25. [Google Scholar]
  2. Locke, B. Comprehension Skills Guide Scattered Theories; People’s Education Press: Beijing, China, 2004; pp. 66–96. [Google Scholar]
  3. Ye, C. Reunderstanding of Bruner’s structuralism Curriculum Theory. Educ. Explor. 2002, 3, 2. [Google Scholar]
  4. Xing, H. Discussion on the Relationship Between Knowledge and Ability. J. Guangdong Educ. Coll. 2000, 1, 55–57. [Google Scholar]
  5. Wang, H.; Tan, D. Knowledge and Competence: Which is More Important–Dialectics in Educational Evaluation. J. Tianjin Acad. Educ. Sci. 2008, 1, 23–25. [Google Scholar]
  6. Li, X. Talking about the contradiction between “teaching and learning” and “knowledge and ability” and its handling principles. J. Univ. Int. Bus. Econ. 1999, 4, 57–59. [Google Scholar]
  7. Wang, X. Modern Psychology’s View of Knowledge and Competence–and Language Knowledge in Language Curriculum Standards. Lang. Constr. 2003, 7, 13–15+22. [Google Scholar]
  8. Yang, D.; Zhang, J. The dilemma of “knowledge-competence relationship” research and countermeasures. Fujian Basic Educ. Res. 2018, 1, 22–25. [Google Scholar]
  9. Li, Y.; Zhang, X.; Li, X.; Du, J. Construction and Innovative Application of Discipline Knowledge Graph Oriented to Smart Education. Electrochem. Educ. Res. 2019, 8, 60–69. [Google Scholar]
  10. Balaid, A.; Abd Rozan, M.Z.; Hikmi, S.N.; Memon, J. Knowledge maps: A systematic literature review and directions for future research. Int. J. Inf. Manag. 2016, 3, 451–475. [Google Scholar] [CrossRef]
  11. Dang, Y.; Zhang, Y.L.; Hu, P.J.H.; Brown, S.A.; Chen, H.C. Knowledge mapping for rapidly evolving domains: A design science approach. Decis. Support Syst. 2011, 2, 415–427. [Google Scholar] [CrossRef]
  12. Wang, J. The Application of Knowledge Graph to the Improvement of Chemical Science Literacy of Middle School Students. Master’s Thesis, Chongqing University, Chongqing, China, 2018. [Google Scholar]
  13. Zhang, H. Study on the Influence of Knowledge Graph on High School Students’ Scientific Thinking Ability. Master’s Thesis, Chongqing University, Chongqing, China, 2018. [Google Scholar]
  14. Hook, P.A. Domain maps: Purposes, history, parallels with cartography, and applications. In Proceedings of the 11th International Conference on Information Visualization (IV 2007), Zurich, Switzerland, 4–6 July 2007. [Google Scholar]
  15. Qi, G.; Gao, H.; Wu, T. The Research Advances of Knowledge Graph. Technol. Intell. Eng. 2017, 1, 4–25. [Google Scholar]
  16. Ding, G.; Ma, S.; Zhang, J.; Tian, H. Exploration on Teaching and Evaluation System for the Integration of Quantifiable Knowledge and Ability. High. Eng. Educ. Res. 2022, 6, 62–69. [Google Scholar]
  17. Dai, J.Y.; Yeh, K.L.; Kao, M.T.; Yuan, Y.H.; Chang, M.W. Applying Petri-Net to Construct Knowledge Graphs for Adaptive Learning Diagnostics and Learning Recommendations. J. Abbr. 2021, 3, 61–105. [Google Scholar]
  18. Wang, X. Value-added Evaluation Methods in Higher Education. High. Educ. Dev. Eval. 2018, 5, 60–71. [Google Scholar]
  19. Xiong, Z.; Yang, H. Value-added Evaluation: From Static Proof of Results to Dynamic Process Improvement—A Case Study from the Comprehensive Evaluation Reform of Compulsory Education Academic Quality in Xiangzhou District, Zhuhai City. J. Educ. Dev. 2016, 2, 84–88. [Google Scholar]
  20. Zhou, J.; Wu, X.; Kuang, Y. Academic Value-Added Evaluation of College Students: Basic Attributes, Realistic Dilemmas and Practical Approaches. Mod. Educ. Manag. 2021, 12, 9–18. [Google Scholar]
  21. You, Z.; Wang, L. Research on Implementation and Efficacy of the Basic Education Value-added Evaluation in Englan. Stud. Foreign Educ. 2019, 7, 42–53. [Google Scholar]
  22. Chen, A.; Guan, D. Comparative Analysis and Empirical Research of Several Value-Added Evaluation Methods. J. China Exam. 2022, 9, 54–62. [Google Scholar]
  23. Geng, F. Historical Evolution and Deep Exploration of the Relationship Between Knowledge and Ability in Terms of Teaching. J. Shaanxi Norm. Univ. (Philos. Soc. Sci. Ed.) 2014, 43, 166–171. [Google Scholar]
  24. Lorenz, P. Higher Education for Sustainability: A Critical Review of the Empirical Evidence 2013–2020. Sustainability 2022, 14, 3402. [Google Scholar]
  25. Zhou, J.; You, F. The connotation and relationship of knowledge, ability and quality. In Proceedings of the 2020 Annual Conference of the University Quality Education Research Branch and the Ninth High-Level Forum on University Quality Education, Luoyang, China, 15–17 October 2020; pp. 30–45. [Google Scholar]
  26. Shao, R.; Zhang, W. Bruner’s Selected Educational Essays; People’s Education Press: Beijing, China, 1989; pp. 142–149. [Google Scholar]
  27. Guo, Y.; Wang, Q. Knowledge Graph and Prospect of Value-Added Evaluation Research. Educ. Meas. Eval. 2021, 7, 3–10. [Google Scholar]
  28. Mu, J. Cognitive Development, Cognitive Process and Knowledge Support: The three-dimensional construction of unified Chinese Textbooks. Lang. Plan. 2020, 8, 19–24. [Google Scholar]
  29. Anderson, L.W.; Krathwohl, D.R. Taxonomy for Learning Teaching, and Assessing—A Revision of Blooms Taxonomy of Educational Objectives; Foreign Language Teaching and Research Press: Beijing, China, 2009; pp. 20–120. [Google Scholar]
  30. Al Maani, D.; Shanti, Z. Technology-Enhanced Learning in Light of Bloom’s Taxonomy: A Student-Experience Study of the History of Architecture Course. Sustainability 2023, 15, 2624. [Google Scholar] [CrossRef]
  31. Hancock, M.; Stiers, J.; Higgins, T.; Swarr, F.; Shrider, M.; Sood, S. A Hierarchical Characterization of Knowledge for Cognition. In Proceedings of the 13th International Conference on Augmented Cognition (AC) Held as Part of the 21st International Conference on Human-Computer Interaction (HCII), Orlando, FL, USA, 26–31 July 2019. [Google Scholar]
  32. Newman, M.E.J. The structure and function of complex networks. SIAM Rev. 2003, 2, 167–256. [Google Scholar] [CrossRef] [Green Version]
  33. Boccaletti, S.; Latora, V.; Moreno, Y.; Chavez, M.; Hwang, D.U. Complex networks: Structure and dynamics. Phys. Rep.-Rev. Sect. Phys. Lett. 2006, 4–5, 175–308. [Google Scholar] [CrossRef]
  34. Costa, L.D.F.; Rodrigues, F.A.; Travieso, G.; Boas, P.R.V. Characterization of complex networks: A survey of measurements. Adv. Phys. 2007, 1, 167–242. [Google Scholar] [CrossRef] [Green Version]
  35. Da, K. Information and the Cognitive Process of Information within the Cognitive Domain of the Observer. J. Intell. 2008, 5, 149–155. [Google Scholar]
  36. Belkin, N.J. The cognitive viewpoint in information science. J. Inf. Sci. 1990, 1, 11–15. [Google Scholar] [CrossRef]
  37. Newman, M.E.J. Modularity and community structure in networks. Proc. Natl. Acad. Sci. USA 2006, 23, 8577–8582. [Google Scholar] [CrossRef] [Green Version]
  38. Leicht, E.A.; Newman, M.E. Community structure in directed networks. Phys. Rev. Lett. 2008, 11, 118703. [Google Scholar] [CrossRef] [Green Version]
  39. Von Luxburg, U. A Tutorial on Spectral Clustering. Stat. Comput. J. 2007, 4, 395–4169. [Google Scholar] [CrossRef]
  40. Shi, J.; Malik, J. Normalized cuts and image segmentation. IEEE Trans. Pattern Anal. Mach. Intell. 2000, 22, 888–905. [Google Scholar]
  41. Mohammed, L.A. Validity and Reliability; Cambridge University Press: New York, NY, USA, 2011; pp. 129–139. [Google Scholar]
  42. Barrat, A.; Barthélemy, M.; Vespignani, A. Clustering Coefficient in Complex Networks. Eur. Phys. J. B Condens. Matter Complex Syst. 2004, 38, 163–168. [Google Scholar]
  43. Xu, X.; Shou, Y. Complex network analysis: An introduction. J. Netw. Comput. Appl. 2017, 92, 1–10. [Google Scholar]
  44. Hu, Z.; Dai, H.; Tang, R. The Comparative Research of the Ability-structure between Good-students and General-students. Explor. Psychol. 2000, 20, 38–43. [Google Scholar]
  45. Press, W.H.; Teukolsky, S.A.; Vetterling, W.T.; Flannery, B.P. Numerical Recipes in C, 2nd ed.; Cambridge University Press: Cambridge, UK, 1992. [Google Scholar]
  46. De Nooy, W.; Mrvar, A.; Batagelj, V. Exploratory Social Network Analysis with Pajek; Cambridge University Press: Cambridge, UK, 2018. [Google Scholar]
  47. Bland, J.M.; Altman, D.G. Cronbach’s alpha. Br. Med. J. 1997, 7080, 572. [Google Scholar] [CrossRef] [Green Version]
  48. Inclan, C.; Tiao, G.C. Use of Cumulative Sums of Squares for Retrospective Detection of Changes of Variance. J. Am. Stat. Assoc. 1994, 427, 913–923. [Google Scholar]
  49. Mrzljak, L. Targeting Kmo: Basic Understanding and Gaps. J. Am. Stat. Assoc. 2014, 85, A2. [Google Scholar] [CrossRef]
  50. Horn, J.L.; Engstrom, R. Cattell Scree Test in Relation to Bartlett Chi-Square Test and Other Observations on the Number of Factors Problem. Multivar. Behav. Res. 1979, 3, 283–300. [Google Scholar] [CrossRef]
  51. Xia, Z.; Schlächter, A.; Salama, A.A.-T. Constructing a Community of Shared Human Destiny and Sustaining Higher Education. China High. Educ. Res. 2023, 353, 14–18. [Google Scholar]
  52. Newman, M.E.J.; Girvan, M. Finding and evaluating community structure in networks. Phys. Rev. E 2004, 69, 026113. [Google Scholar] [CrossRef] [PubMed] [Green Version]
Figure 1. The relationship between Bloom’s Taxonomy and the taxonomy proposed in this paper. The light blue part is Bloom’s Taxonomy, with the four knowledge dimensions (factual, conceptual, procedural, and metacognitive) listed vertically. The cognitive process dimensions (remember, understand, apply, analyze, evaluate and create) are listed horizontally. The green part is our taxonomy, with two knowledge dimensions, namely, Conceptual and Procedural Knowledge, listed vertically and two cognitive process dimensions (understanding–analysis and analysis–evaluation) listed horizontally. The dashed lines in the figure show the mapping relations between the two taxonomies in terms of knowledge dimensions, while the solid lines show the relations in terms of the cognitive process dimensions.
Sustainability 15 04119 g001
Figure 2. The process of recognition and accuracy evaluation of the relationship between knowledge and ability.
Sustainability 15 04119 g002
Figure 3. KCIN of the Data Structure course. The figure was drawn with Pajek. The serial numbers of the nodes come from Table 2, and the gray edges are the dependent edges of AEKN and UAKN.
Sustainability 15 04119 g003
Figure 4. UAKN in KCIN.The figure was drawn with Pajek. The mark of the square node is the knowledge name, and the mark of the edge is its weight. Whether there is an edge between two nodes is determined by the understanding and application dimensions of the knowledge points they represent. If node A must be studied before node B is studied, there exists an edge from B to A where the weight of the edge is the degree of influence of B’s content on learning A, which is divided into five levels corresponding to 0.5, 0.4, 0.3, 0.2, and 0.1.
Sustainability 15 04119 g004
Figure 5. AEKN in KCIN. The figure was drawn with Pajek. The mark of the circular node is the knowledge name, while the mark of the edge is its weight. Whether there is an edge between two nodes is determined by the analysis and evaluation dimension of the knowledge points represented by these two nodes. If node A must be studied before node B is studied, there exists an edge from B to A where the weight of the edge is the degree of influence of B’s content on learning A, which is divided into five levels corresponding to 0.5, 0.4, 0.3, 0.2, and 0.1.
Sustainability 15 04119 g005
Figure 6. The results of the UAKN module identification are divided into five modules. The supporting knowledge nodes of EPEA include SList, Sequential Stack, Link Stack, Sequential Queue, Linked Queue, Hoffman Tree, Keyword Tree, Hashtable, Recursion of the Stack, and Hash Method Look-up. The supporting knowledge nodes of EPSA include Abstract Data Types, Naive Matching Algorithm, KMP Algorithm, Tree-based Look-up, Exchange Sort, Selection Sort, Distributive Sort, and External Sort. The supporting knowledge nodes of DAPA include General List, Tree Definition and Storage, Sequential Storage of Binary Trees, Linked Storage of Binary Trees, and Traversing Binary Trees. The supporting knowledge nodes of APLA include Classification of Data Structures, Sequence List, Doubly Linked List, Storage of Arrays, Sparse Matrix, Graph Definition and Storage, B-Tree, Applications of Linear List, Four Arithmetic Operations, Linear Look-up Table, and Insertion Sort. The supporting knowledge nodes of CSMA include Complexity of Algorithm, Cyclic Linked List, Minimum Spanning Tree, Shortest Path Algorithm, Traversing Graph, and Critical Path.
Sustainability 15 04119 g006
Figure 7. Module identification results of AEKN. It is divided into three modules. The supporting knowledge nodes of CSMA include Abstract Data Types, Complexity of Algorithm, S-list, Cyclic Linked List, Minimum Spanning Tree, Shortest Path Algorithm, Traversing Graph, and Critical Path. The supporting knowledge nodes of EPSA include Classification of Data Structures, Sequence List, Applications of Linear List, Naive Matching Algorithm, KMP Algorithm, Linear Look-up Table, Insertion Sort, Exchange Sort, Selection Sort, Distributive Sort, and External Sort. The supporting knowledge nodes of DAPA include Doubly-Linked List, Sequential Stack, Link Stack, Sequential Queue, Linked Queue, Sequential String, Linked List, Storage of Arrays, Sparse Matrix, General List, Tree Definition and Storage, Sequential Storage of Binary Trees, Storage of Arrays, Sparse Matrix, General List, Tree Definition and Storage, Sequential Storage of Binary Trees, Linked Storage of Binary Trees, Hoffman Tree, Graph Definition and Storage, B-tree, Keyword Tree, Hash Table, Linked Storage of Binary Trees, Hoffman Tree, Graph Definition and Storage, B-tree, Keyword Tree, Hash Table, Four Arithmetic Operations, Recursion of the Stack, Traversing Binary Tree, Tree-based Look-up, and Hash Method Look-up.
Sustainability 15 04119 g007
Figure 8. The distribution of five abilities of the 114 students. The X-coordinate in (A) represents the student’s serial number, and the Y-coordinate represents the normalized ability value. Each X-coordinate value has five Y-coordinate values corresponding to it, with the shape of asterisk, circle, pentagram, square, and plus sign in the figure representing APLA, EPEA, CSMA, EPSA, and DAPA, respectively. The X-coordinate in (B) represents the ranking of values of abilities, with each ability ranked in ascending order. The Y-coordinate represents the values of students’ abilities. The curves coloring red, blue, purple, green, and black represent the trends of APLA, EPEA, CSMA, EPSA, and DAPA respectively.
Sustainability 15 04119 g008
Figure 9. Distribution of the five abilities of the 114 students. OM represents the result distribution curve of our mode and TM represents the result distribution curve of traditional mode. (AE) show the distribution of APLA, EPEA, CSMA, EPSA, and DAPA of the 114 students, respectively. Here, “our mode” refers to the ability value calculated based on the relation between the knowledge and ability identified by the framework presented in this paper, while “traditional mode” refers to the ability value calculated based on the relation between the knowledge and ability obtained from the teacher’s experience in teaching the syllabus.
Sustainability 15 04119 g009
Figure 10. Comparison of the evaluation results of abilities. OM, SE, and TM in the figure are the ability values obtained by our method, student self-assessment, and the traditional method, respectively, while OMT, SET, and TMT are the trend curves of the abilities obtained by above methods.
Sustainability 15 04119 g010
Table 1. Course outlines of different Data Structure courses.
UniversitySource Website
Loyola Marymount Universityhttps://cs.lmu.edu/~ray/classes/dsa/syllabus/, accessed on 1 November 2022
Chongqing Universityhttp://www.cse.cqu.edu.cn/info/2105/3558.htm, accessed on 1 November 2022
Rutgers Universityhttps://ds.cs.rutgers.edu/, accessed on 1 November 2022
Chengdu University of Technologyhttps://www.icourse163.org/spoc/course/CDLGDX-1466089245, accessed on 1 November 2022
Johns Hopkins Universityhttps://www.cs.jhu.edu/~hager/Teaching/cs226/index.html, accessed on 1 November 2022
Shanxi Normal Universityhttps://jwcweb.sxnu.edu.cn/info/1242/5542.htm, accessed on 1 November 2022
Liaoning University of Technologyhttps://seie.lnut.edu.cn/info/14452/185005.htm, accessed on 1 November 2022
Gujarat Technological Universityhttps://www.studocu.com/in/document/gujarat-technological-university/computer-science/3130702-data-structures-syllabus/6180222, accessed on 1 November 2022
Massachusetts Institute of Technologyhttps://ocw.mit.edu/courses/6-851-advanced-data-structures-spring-2012/pages/syllabus/, accessed on 1 November 2022
Beihua Universityhttps://eie.beihua.edu.cn/, accessed on 1 November 2022
Table 2. Knowledge units of Data Structure course.
No.The Name of Conceptual KnowledgeNo.The Name of Procedural Knowledge
1Classification of data structures25Applications of linear list
2Abstract data types26Four arithmetic operations
3Complexity of algorithm27Recursion of the stack
4Sequence list28Naive matching algorithm
5Slist29KMP algorithm
6Doubly linked list30Traversing binary tree
7Cyclic linked list31Minimum spanning tree
8Sequential Stack32Shortest path algorithm
9Link stack33Traversing graph
10Sequential queue34Critical path
11Linked queue35Linear look-up table
12Sequential string36Tree based look-up
13Linked List37Hash method look-up
14Storage of arrays38Insertion sort
15Sparse matrix39Exchange sort
16General List40Selection sort
17Tree definition and storage41Distributive sort
18Sequential storage of binary trees42External sort
19Linked storage of binary trees--
20Hoffman tree--
21Graph definition and storage--
22B-tree--
23Keyword tree--
Table 3. Topological features of KCIN for the Data Structure course.
Network NameNetwork Input Degree CentralizationNetwork Output Degree CentralizationWatts-Strogatz Clustering CoefficientNetwork Transitivity Clustering CoefficientNetwork Betweenness Centralization
UAKN0.071386080.596073770.249074440.136254020.01685009
AEKN0.245092210.220107080.123715430.102079400.01598751
Table 4. Support parameter for abilities.
AbilityUnderstanding Application DimensionAnalytical Evaluation Dimension α Value in Equation (3)
APLA100%0%1
EPEA100%0%1
CSMA50%50%0.5
EPSA30%70%0.3
DAPA10%90%0.1
Table 5. Key knowledge nodes.
Name (Analytical Evaluation Dimension)Value (Analytical Evaluation Dimension)Name (Understanding Application Dimension)Value (Understanding Application Dimension)
Slist2.3Tree based look-up6.2
Linked List1.8Minimum spanning tree6
Sequence list1.2B-tree5.8
External sort1.1Keyword tree5.8
Sequential string1Traversing binary tree5.6
Table 6. The reliability and validity of the questionnaire.
Cronbach’s AlphaEigenvalueCumulative % of VarianceKMOBartlett’s Test of Sphericitydf
0.99419.6189.14%0.9554450.123231.000
Disclaimer/Publisher’s Note: The statements, opinions and data contained in all publications are solely those of the individual author(s) and contributor(s) and not of MDPI and/or the editor(s). MDPI and/or the editor(s) disclaim responsibility for any injury to people or property resulting from any ideas, methods, instructions or products referred to in the content.

