Article

Spatio-Temporal Evolution Patterns of Hydrological Connectivity of Wetland Biodiversity Hotspots in Sanjiang Plain between 1995 and 2015

1
Key Laboratory of Heilongjiang Province for Cold-Regions Wetlands Ecology and Environment Research, Harbin University, Harbin 150086, China
2
National and Local Joint Laboratory of Wetland and Ecological Conservation, Institute of Natural Resources and Ecology, Heilongjiang Academy of Sciences, Harbin 150040, China
*
Author to whom correspondence should be addressed.
These authors contributed equally to this work.
Sustainability 2023, 15(6), 4952; https://doi.org/10.3390/su15064952
Submission received: 1 December 2022 / Revised: 28 February 2023 / Accepted: 1 March 2023 / Published: 10 March 2023
(This article belongs to the Section Sustainability in Geographic Science)

Abstract

:
Hydrological connectivity is the main non-biological driving factor of wetland ecological processes and is key to maintaining the stability and biodiversity of the whole ecosystem. Socio-economic activities have had a significant impact on the hydrological connectivity of wetlands, resulting in the loss of biodiversity and the degradation of the ecological functions of wetlands. Wetland biodiversity hotspots in Sanjiang Plain that were identified in the previous literature using the Systematic Conservation Planning (SCP) method were chosen as the research objects. The SCP method was combined with the structural hydrological connectivity index (Integral Index of Connectivity (IIC) and Probability of Connectivity (PC)) and the functional hydrological connectivity index (Morphological Spatial Pattern Analysis) to analyze the spatio-temporal changes in the hydrological connectivity of the wetland biodiversity hotspots in Sanjiang Plain. The results showed that the hydrological connectivity within the eight identified wetland biodiversity hotspots in Sanjiang Plain experienced varying degrees of decline in the period between 1995 and 2015. Structurally, the IIC values of wetlands in all of the biodiversity hotspots were more than 0.5, and the PC values were more than 0.9, but most of the hotspots showed declining trends of varying degrees from 2010 to 2015. Functionally, the average proportion of core wetlands in the hotspots has decreased by 4.82%, and the average proportion of edge wetlands has increased by 2.71% over the last 20 years. The findings on the hydrological connectivity evolution patterns can aid in the conservation and restoration of wetlands and biodiversity hotspots.

1. Introduction

Hydrological connectivity refers to the mutual transfer of substances, energy, and organic matter within or between the elements of the hydrologic cycle [1,2]. The hydrological connectivity of the wetland ecosystem, a unique water-mediated ecosystem, is the main driving force behind the wetland ecological processes and is critical to maintaining the stability of the whole ecosystem as well as its internal biodiversity [3]. However, the hydrological connectivity of the wetlands has been significantly disrupted by the fragmentation of the wetland ecosystem caused by socio-economic activities. As a result, global wetland biodiversity is declining, and its ecological functions are degrading [4,5,6]. For wetland ecosystem conservation it is, therefore, important to reasonably define the quantitative indicators of hydrological connectivity to assess and monitor the health of the wetlands designated as conserved areas, key areas, priority and control areas, or other management areas quickly and effectively. This will help in identifying the hydrological connectivity gaps in order to put forward targeted conservation and restoration management measures.
At present, many different methods are used for the hydrological connectivity quantification of wetlands [7,8]. However, most of the relevant wetland connectivity studies focus on the river and lake wetland ecosystems, while only limited studies have been conducted on the spatio-temporal dynamics of hydrological connectivity in freshwater marsh wetlands. Marsh wetlands differ substantially from river lake wetlands. Marsh wetlands have special vegetation and soil-forming processes that have important ecological functions [9]. The marsh wetland ecosystem also has a unique biodiversity, especially when considering rare water birds [10]. It is therefore important to evaluate the hydrological connectivity of wetland biodiversity hotspots for their biodiversity protection and monitoring. Establishing a hydrological connectivity assessment framework based on the hydrological characteristics of marsh wetlands would aid in measuring the changes in wetland functionality in the biodiversity hotspots of marsh wetlands.
There are several methods for evaluating the wetland hydrological connectivity of river and lake wetlands, such as in situ monitoring, hydrological models, connectivity indexes, graph theory, and remote sensing [8,9,10,11,12]. Advances in multi-source remote sensing images provide various kinds of information on hydrological connectivity at different spatial and temporal scales [13,14]. Among these hydrological connectivity quantification methods for river and lake wetlands, the Integral Index of Connectivity (IIC) and the Probability of Connectivity (PC) are designed based on graph theory and habitat accessibility, while the indexes derived by the Morphological Spatial Pattern Analysis (MSPA) are helpful in evaluating the wetland function in terms of wetland connectivity [15,16]. Considering the characteristics of the habitat requirements of species living on marsh wetlands, the IIC and MSPA methods have great potential to measure, describe, and analyze the hydrological connectivity of marsh wetlands in terms of both structure and function.
To thoroughly explore the characteristics of the hydrological connectivity in marsh wetland biodiversity hotspots at different spatial locations, this paper combined the MSPA model with the IIC and PC indexes to comprehensively quantify and evaluate the hydrological connectivity in the wetland biodiversity hotspots using the Landsat TM images of Sanjiang Plain from 1995, 2000, 2005, 2010, and 2015. With this, we aimed to identify the “regression and recovery” patterns of the hydrological connectivity in the biodiversity hotspots in order to discuss the driving factors of the hydrological connectivity changes. Our study findings could provide insight into the hydrological connectivity of the wetland biodiversity hotspots for targeted conservation and restoration efforts.

2. Materials and Methods

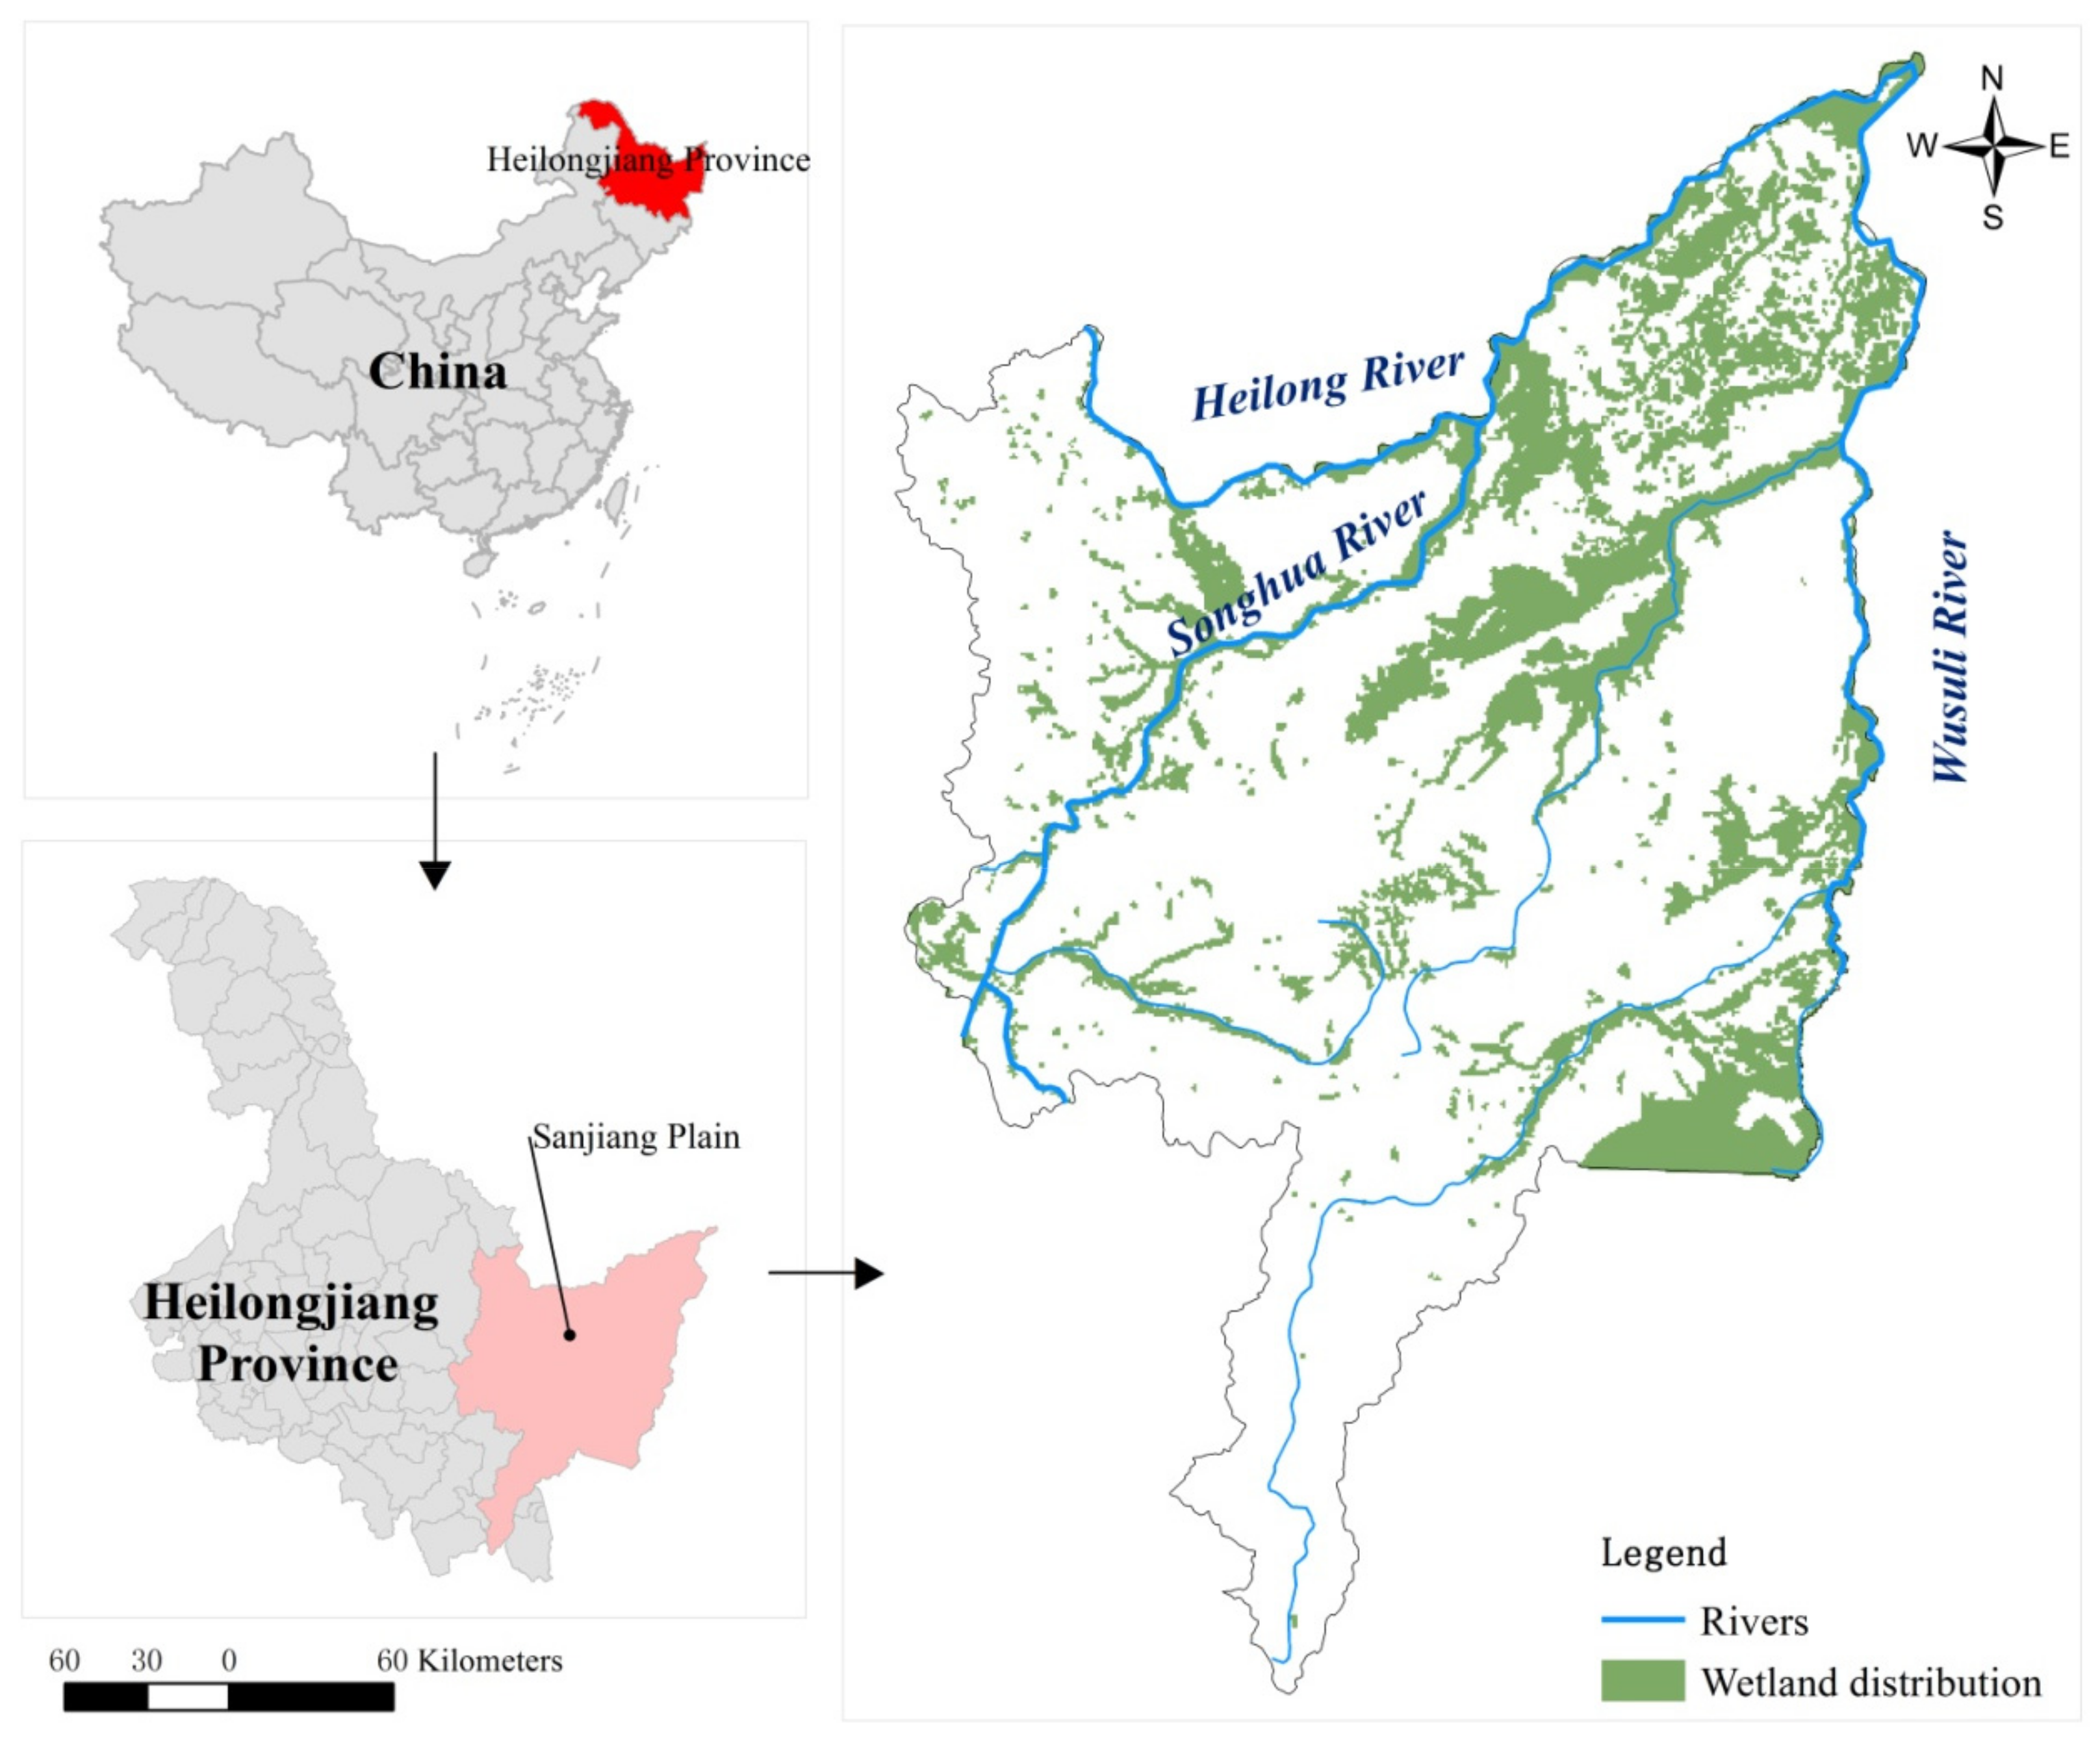
2.1. Overview of the Study Area

The Sanjiang Plain wetland is located in the eastern part of Heilongjiang Province and is the largest distribution area of freshwater swamps in China. The geographical coordinates are 43°49′55″–48°27′40″ N and 129°11′20″–135°05′26″ E (Figure 1). The Sanjiang Plain wetland has been identified as one of the biodiversity hotspots by the Ministry of Environmental Protection of China; it is known as the “specific gene pool of wildlife in Sanjiang Plain” and is particularly rich in biodiversity resources. Sanjiang Plain has now become the largest commercial grain base in China after more than 50 years of development. Excessive agricultural reclamation and destruction of the natural environment have led to many ecological and environmental problems, including the fragmentation of wetland landscapes, the reduction in river runoff, the decline in groundwater levels, the intensification of environmental pollution, and the loss of biodiversity [17,18]. The vegetation degradation caused by a large number of agricultural land occupations has drastically reduced the habitat area of the wetland species, including the animals and plants in the existing habitats. This has seriously threatened the wetland biodiversity in Sanjiang Plain and many wetland birds have been listed as endangered [19].

2.2. Research Methods

2.2.1. Data Sources

The data used in the study include land use, wetland vegetation types, a digital elevation model (DEM), and the degree of species’ endangerment, habitat preference, and historical habitat distribution range. To determine the land use data, we interpreted Landsat TM remote sensing images with a resolution of 30 m × 30 m. The wetland vegetation type map was sourced from the China Wetland Science Database. The digital elevation model (DEM) was from the SRTM data and has a resolution of 90 m × 90 m (http://srtm.csi.cgiar.org/srtmdata/, accessed on 10 August 2021). The species’ historical distribution and habitat preference mainly came from the China Red Data Book of Endangered Animals [19] and the China Species Red List [20]. Relevant geographic information data, including administrative zoning, river locations, and road maps, were obtained from the National Geomatics Center of China (http://www.ngcc.cn/ngcc/, accessed on 21 April 2022). Statistical data on the rainfall were obtained from the National Meteorological Science Data Center (http://data.cma.cn/, 6 May 2022).

2.2.2. Identification of Wetland Biodiversity Hotspots Based on Systematic Conservation Planning (SCP)

The wetland biodiversity hotspots in Sanjiang Plain were identified using Systematic Conservation Planning (SCP) [21,22,23]. The spatial distribution of the biodiversity hotspots was predicted to determine the conservation goals by selecting representative biodiversity characteristics of the wetlands, and the irreplaceability (IRR, indicating the importance or possibility of an area in achieving all conservation targets) was calculated to determine the biodiversity conservation value of the wetlands in Sanjiang Plain. There were 78 species, 9 key ecosystems, and 6 key ecological processes among the 93 representative biodiversity characteristics present in the study area. The spatial distribution of key species was obtained and simulated by using wetland vegetation type distribution data and DEM data combined with the species’ habitat preferences in the “China Red Book of Endangered Animals”, “China’s Red List of Species”, and the corresponding literature on the species [24,25,26,27,28,29]. The potential spatial distribution of the representative ecosystems was extracted from the wetland vegetation distribution. The conservation goal was defined as the percentage of the potential spatial distribution area of each representative biodiversity characteristic that needed to be protected; this was calculated and obtained according to the rarity and importance of the representative characteristics in the region. Finally, a 1 km × 1 km grid was used as the planning unit. The C-Plan 3.06 protection planning software was used to calculate the IRR (continuous value between 0 and 1) of each planning unit. The higher the value, the higher the importance of a unit in achieving the overall conservation goal and the less the likelihood of it being replaced by other units [30,31]. Biodiversity hotspots with relatively concentrated areas and different spatial characteristics area were selected as sample points for the analysis of the changes in the characteristics of the hydrological connectivity and the influencing factors inside the hotspots. The main biodiversity hotspots in Sanjiang Plain were identified based on the assessment in 1995, which was also utilized as a benchmark for the changes in hydrological connectivity within each hotspot.

2.2.3. Analysis of Hotspot Structural Hydrological Connectivity Changes Based on Hydrological Connectivity Index

In this study, the IIC and PC (indexes based on habitat accessibility) were used to evaluate the structural connectivity of the wetlands. The IIC combines the area of habitat patches and the connectivity between them, thereby meeting all the requirements of habitat connectivity distribution. It can identify the negative impact of mosaic habitats and the elements that play a key role in habitat conservation [32]. The PC index combines the patch connectivity and habitat patch characteristics representing the possibility of species migrating and spreading between different habitat patches. A higher PC value may represent not only the importance of the patch in the connectivity between patches but also the higher habitat quality inside the patch [29]. The IIC and PC values were calculated using Conefor26 software, in which the patch connectivity resistance distance threshold was set to 1 km, in accordance with the demand for wetland habitat connectivity of birds. To ensure comparability between the PC and IIC calculation results, the connectivity probability was set to 0.5 [30]. Equation (1) was used to calculate the IIC and PC values, as follows:
IIC = i = 1 n j = 1 n a i × a j 1 + n l i j A L 2         PC = i = 1 n j = 1 n p i j * × a i × a j A L 2
where n denotes the total number of core wetland patches in the study area; ai and aj denote the areas of core wetland patches i and j, respectively; nlij denotes the number of connections in the shortest path between the core wetland patches i and j; and AL denotes the landscape area. The IIC values were all between 0 and 1; the larger the value, the better the connectivity. p i j * denotes the maximum value of the product of all the path probabilities between the core wetland patches i and j.
The changes in structural connectivity inside each hotspot were analyzed using the IIC and PC values of the wetland biodiversity hotspots in Sanjiang Plain identified from 1995 to 2015.

2.2.4. Analysis of Hotspot Functional Hydrological Connectivity Changes Based on MSPA

The MSPA was used to analyze the changes in functional hydrological connectivity inside the wetland biodiversity hotspots in Sanjiang Plain. The precise landscape composition and structure at the pixel level were calculated based on mathematical morphological principles such as erosion, inflation, open operation, and closed operation [31]. The landscape elements in MSPA have clear ecological meanings, and the results are convenient in guiding realistic planning and the assessment of patches based on their importance. As the model analysis only relies on land use data, it has strong operability and is widely used in nature conservation planning and landscape planning [32,33].
Guidos Toolbox 2.9 was used to calculate the MSPA indexes, such as cores, islands, edges, perforations, bridges, loops, and branches (please see the classification map of MSPA in literature [34]). The time series of this analysis included 1995, 2000, 2005, 2010, and 2015. The ecological meaning and characteristics of different landscape classifications were used to determine the indicative significance of the connectivity inside the wetland biodiversity hotspots in Sanjiang Plain. The water and swamp wetlands that were extracted from the land use data served as the foreground in the MSPA while other landform types were used as the background. The pixel resolution was 30 m, and the 8-neighbor algorithm was used. The changes in functional hydrological connectivity inside the wetland biodiversity hotspots were analyzed by comparing the spatial distribution and numerical changes of the MSPA index time series in each hotspot in Sanjiang Plain, based on which the changes in ecological functions were further analyzed.

3. Results

3.1. Spatial Distribution of Wetland Biodiversity Hotspots

In this study, the SCP method was used to evaluate the IRR-based conservation value of the wetland biodiversity in Sanjiang Plain in 1995. The spatial distribution of the IRR (with values ranging between 0 and 1) in Sanjiang Plain is shown in Figure 2. Eight representative wetland biodiversity hotspots (Bio1, Bio2, Bio3, Bio4, Bio5, Bio6, Bio7, and Bio8) were selected in Sanjiang Plain by combining the IRR threshold (>0.6) and the spatial distribution rules of the relatively concentrated areas. Among these eight biodiversity hotspots, five of them showed partial overlapping with the existing nature reserves at or above the provincial level, indicating that they have been conserved to a certain extent. Among them, Bio6 and Bio7 were well conserved, and the reservation coverage reached more than 70%, while the wetland biodiversity hotspots located in the southwest of Tongjiang City (Bio2), the junction of Fujin City and Youyi County (Bio5), and the southeast of Hulin City (Bio8) have not been adequately conserved.

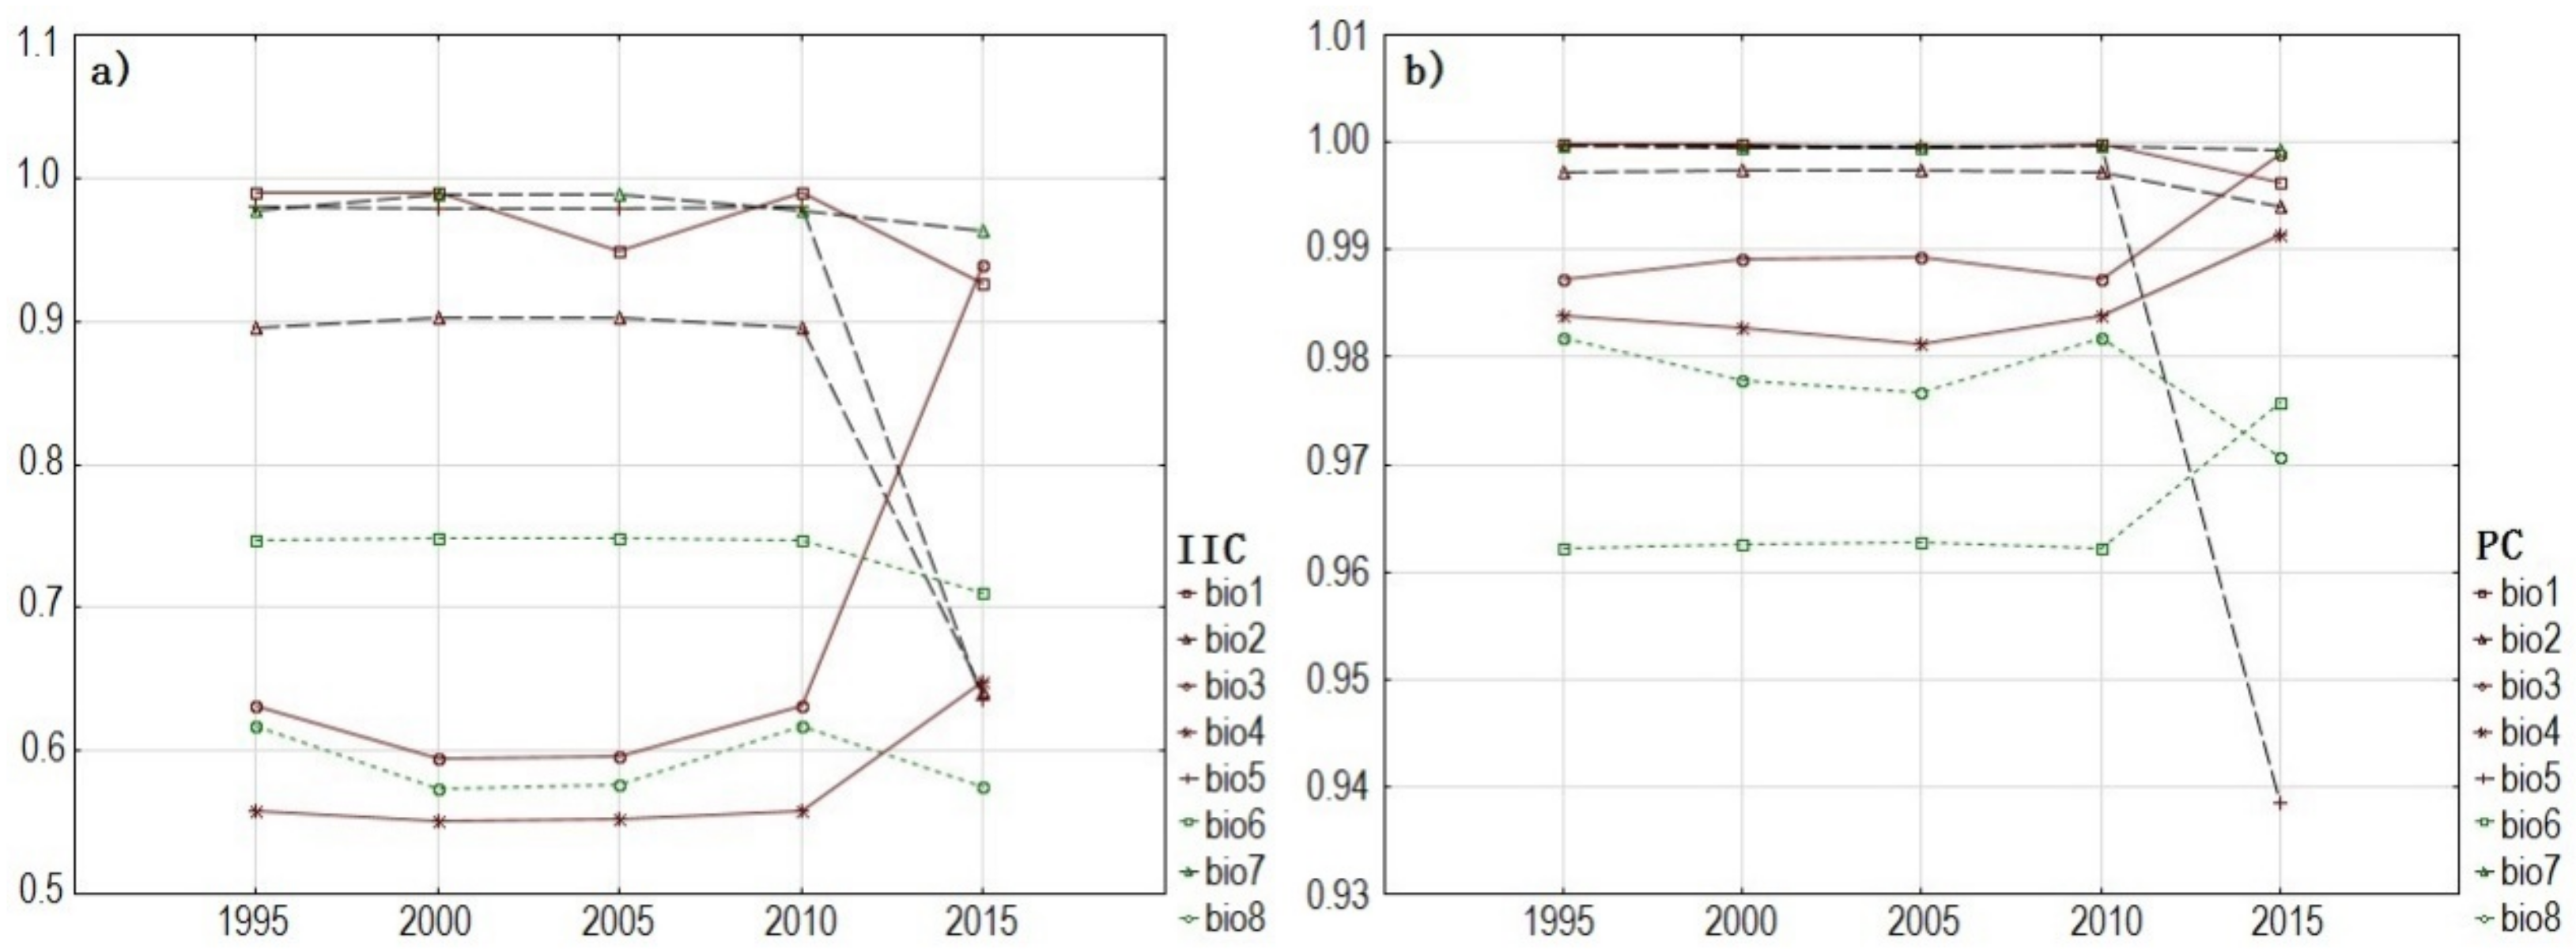
3.2. Analysis of Spatio-Temporal Changes of Biodiversity Hotspots Based on Hydrological Connectivity Index

The changes in the IIC and PC values from 1995 to 2015 (Figure 3) demonstrate that the IIC values of the wetlands inside the main biodiversity hotspots in Sanjiang Plain were all above 0.5; three of them were between 0.5 and 0.7, and the others were all above 0.7 over the past 20 years, indicating that the overall connectivity of most of the biodiversity hotspots was relatively good. The biodiversity hotspots at the different spatial locations showed different changes over time. The biodiversity hotspots at the convergence of primary and secondary rivers showed a trend of first decreasing and then increasing, reaching their highest in 2015. From 1995 to 2010, the hydrological connectivity of the wetlands in the other hotspots did not change much, but from 2010 to 2015, there was a significant change in the trend, which was observed to be downward with varying degrees. The change in the PC values was largely in line with the change in the ICC values.

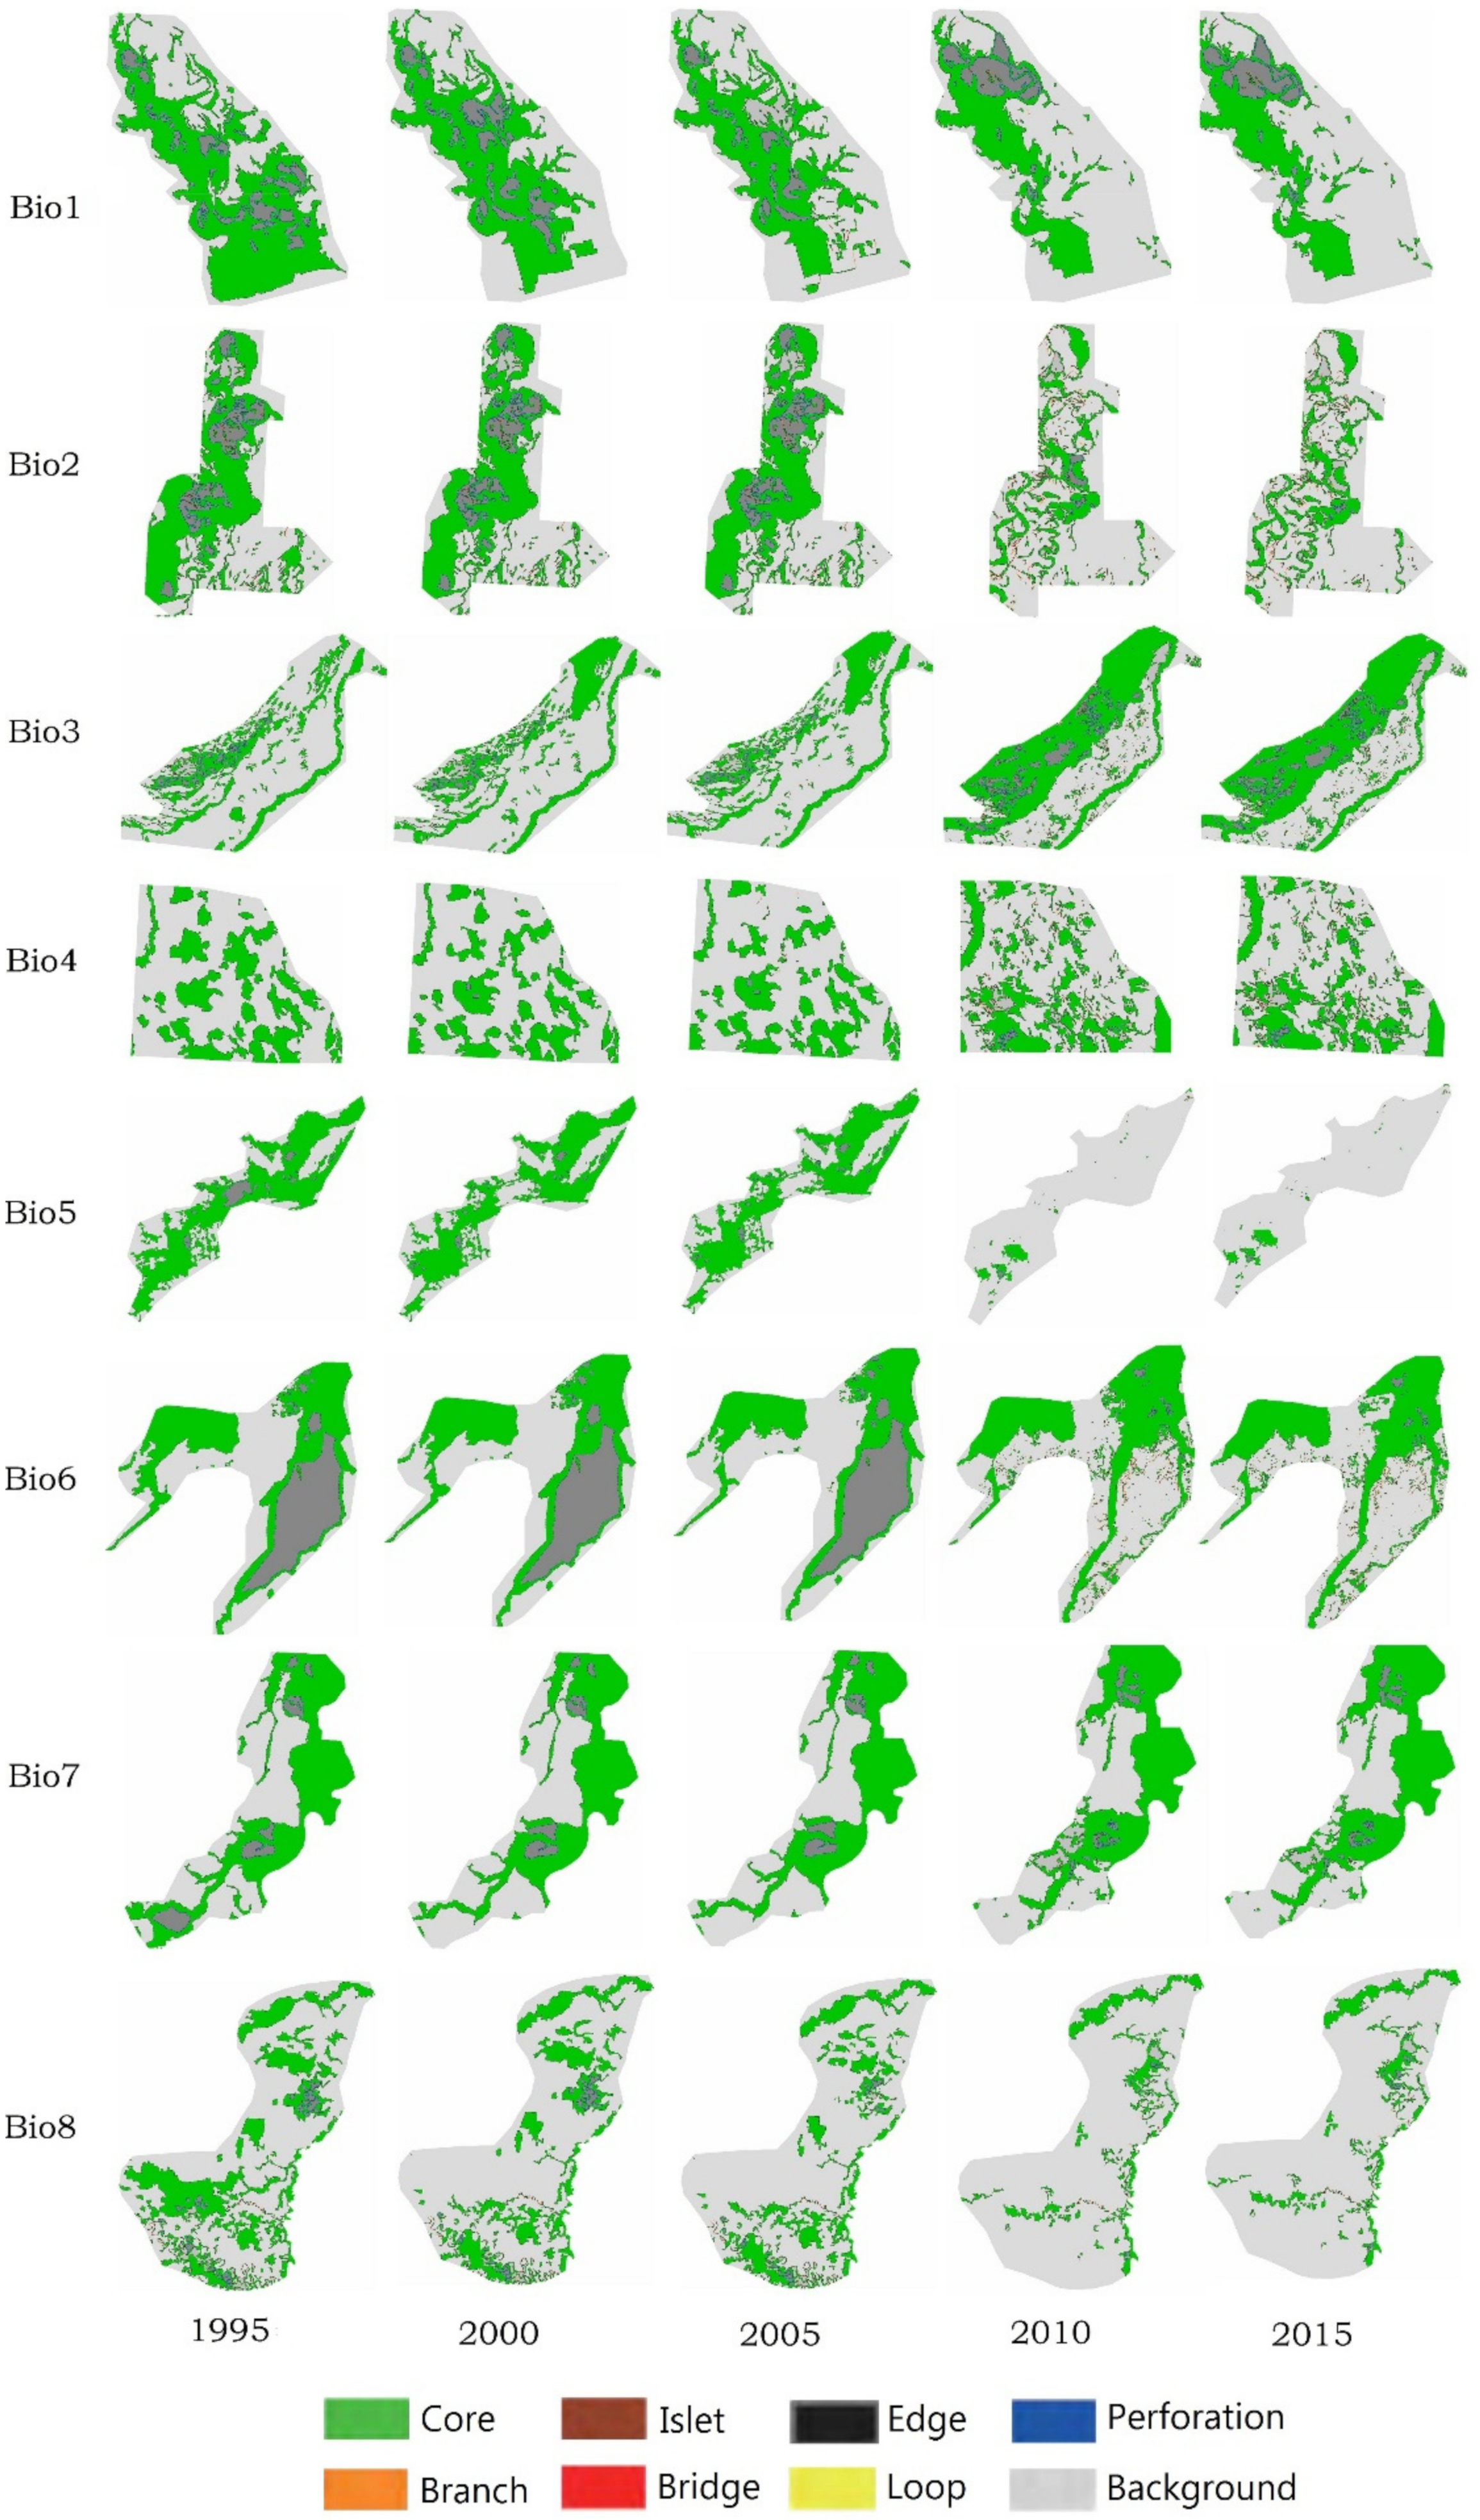
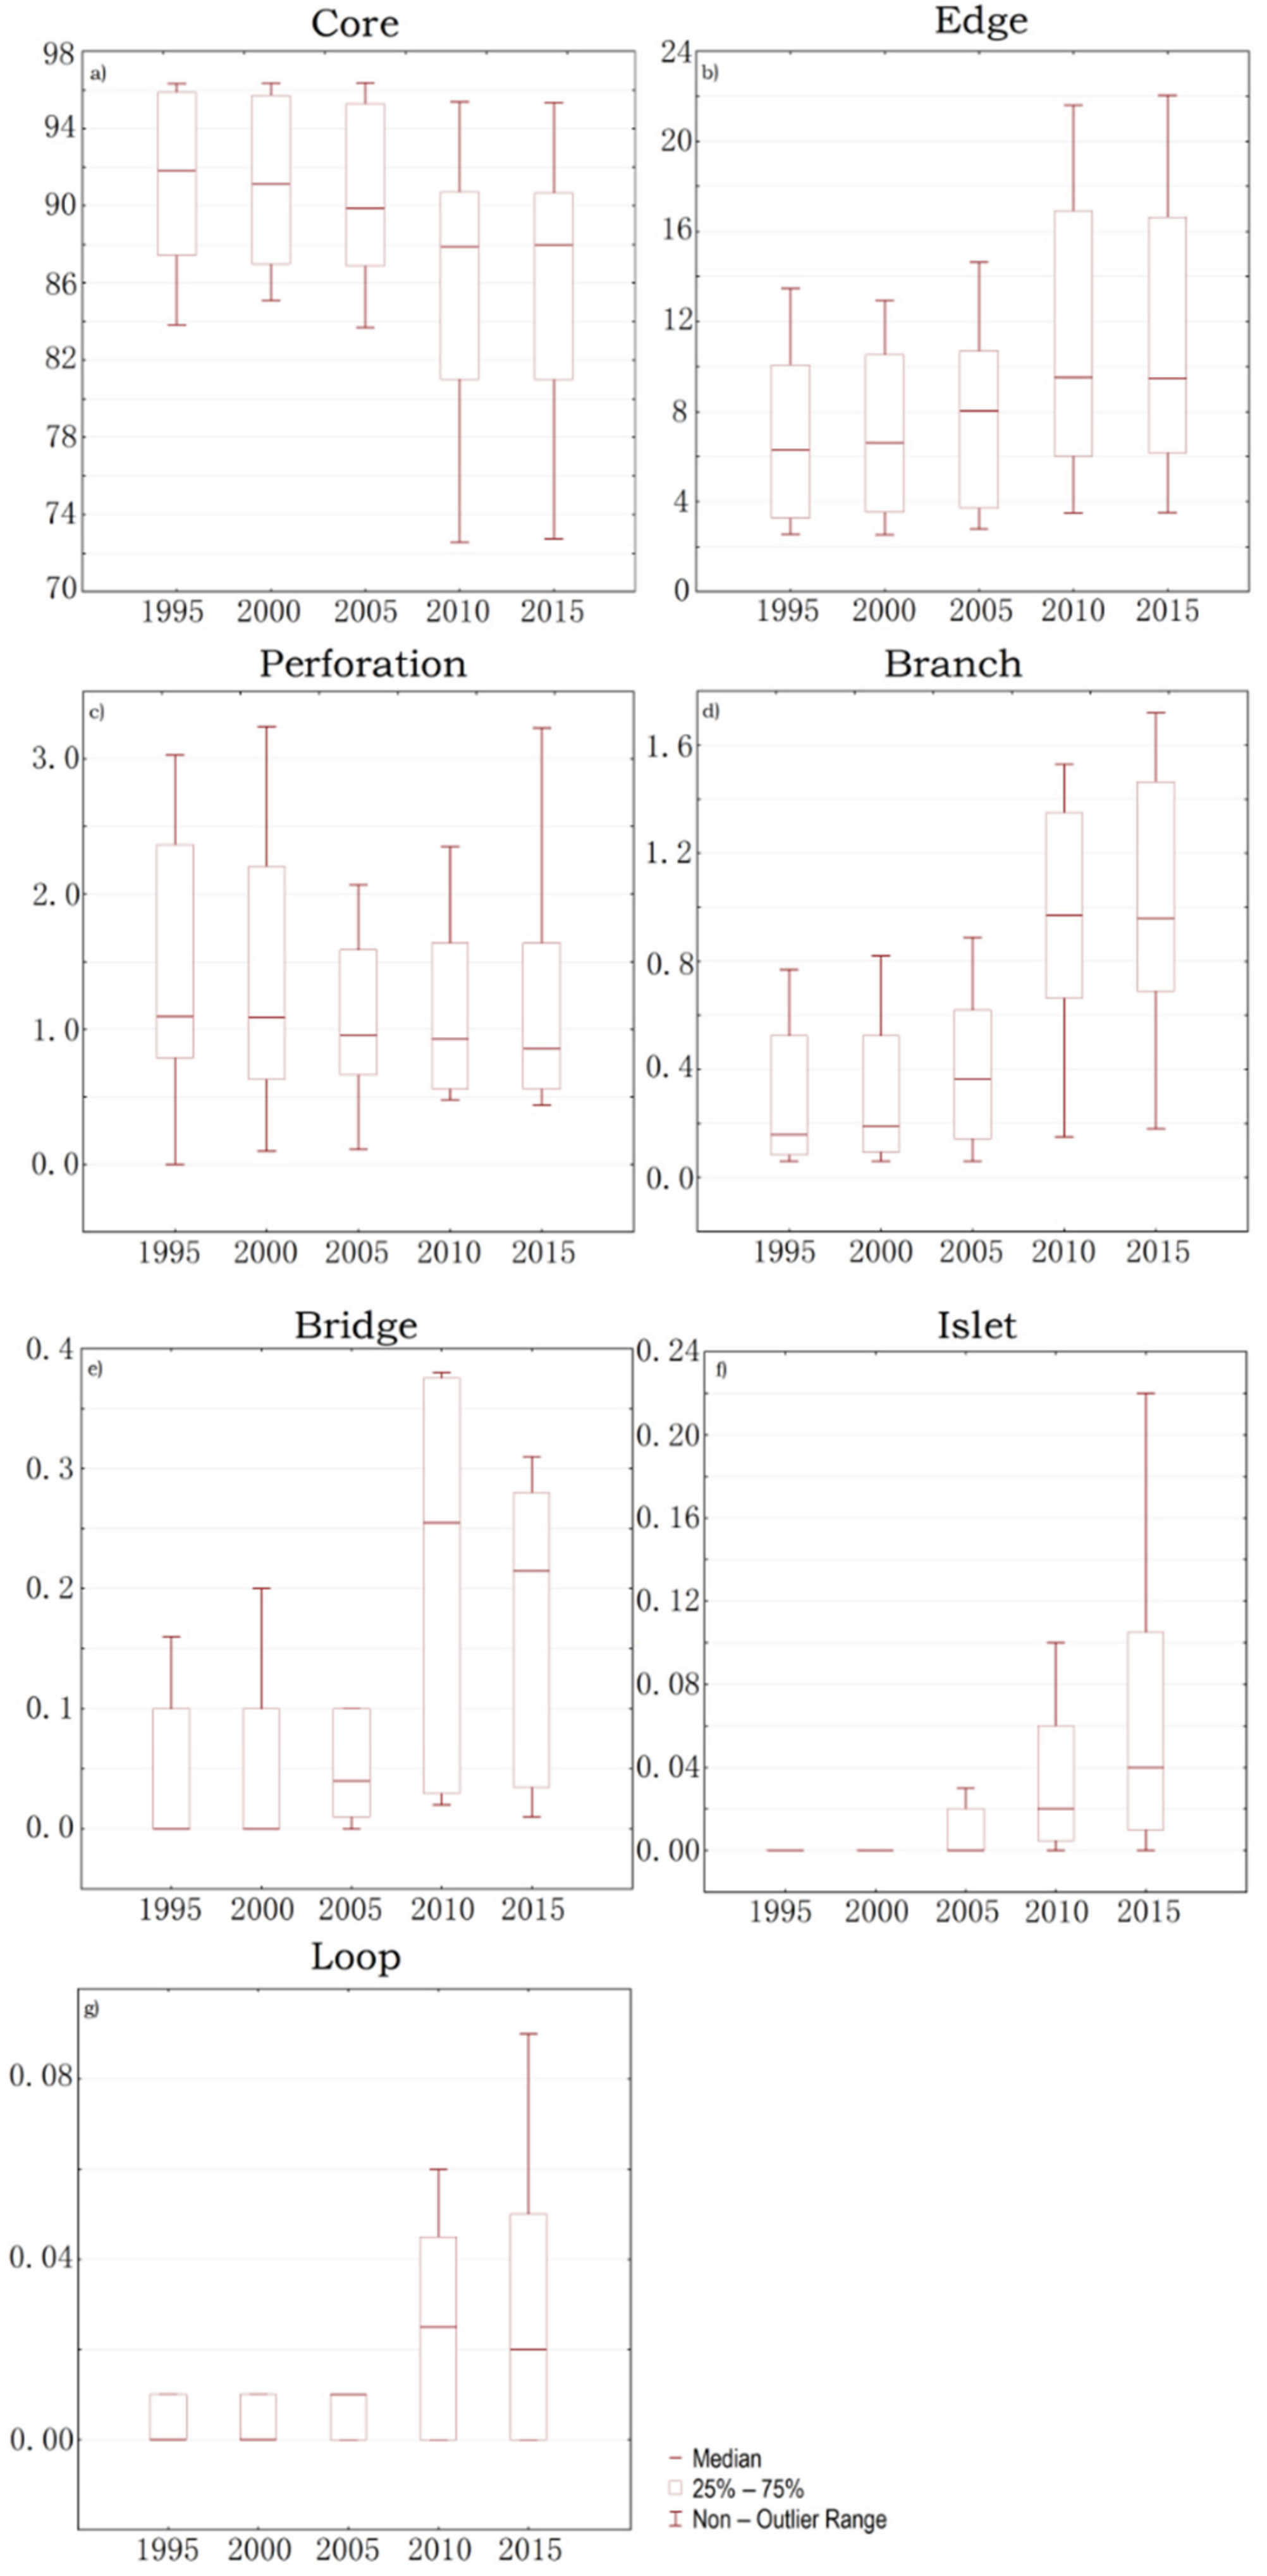
3.3. Spatio-Temporal Analysis of Change in Biodiversity Hotspots Based on MSPA

Figure 4 shows the spatial distributions of the MSPA indexes (core, islet, edge, perforation, bridge, loop, and branches) for the different periods and different biodiversity hotspots. From 1995 to 2015, among the eight wetland biodiversity hotspots selected in this study, only a proportion of the core wetlands in Bio3 increased; the marginal wetlands decreased, showing an increasing trend in the hydrological connectivity within the hotspots. The other seven hotspots showed the opposite trend, where the proportion of core wetlands decreased and the marginal wetlands increased, showing a decreasing trend in the hydrological connectivity within the hotspots, while the fragmentation degree of the wetland landscapes increased. The core wetland areas of Bio1, Bio2, Bio5, and Bio8 were drastically reduced, while the branch and bridging wetlands in Bio2 and Bio4 were significantly increased (Figure 4).
According to the MSPA results (Figure 4) for the period from 1995 to 2015, the core wetlands and marginal wetlands were the two most significant types among the seven function types of hydrological connectivity of the wetlands within the biodiversity hotspots in Sanjiang Plain. The average proportion of the core wetlands in each hotspot has decreased by 4.82% over the past 20 years, whereas the share of marginal wetlands has increased by 2.71%. The proportion of perforations, branches, bridges, isolated islands, and roundabout wetlands in each hotspot was very low (below 5%), ranging from 0% to 3.50%, 0% to 1.80%, 0% to 0.40%, 0% and 0.24%, and 0% to 0.10%, respectively (Figure 5).
There are large habitat patches in the core wetland foreground wetlands, which were identified based on the changes in the proportion of core wetlands in the main wetland biodiversity hotspots in Sanjiang Plain (Figure 5a). The overall hotspot core wetland foreground proportion showed a decreasing trend from 1990 to 2015. The median value decreased slightly during the period from 1995 to 2010, and the maximum value remained unchanged, indicating that the proportion of core wetlands in some hotspots decreased during this period. After 2010, the magnitude of this decline increased, and the proportion of core wetlands in all the hotspots decreased. The marginal wetlands showed the opposite trend, and the foreground proportion showed an overall increasing trend. The median slightly increased from 1995 to 2010; the magnitude of this increase became much more pronounced after 2010, and the marginal wetlands in some hotspots increased by more than 50% (Figure 5b). The results indicate that the core wetlands in the majority of the biodiversity hotspots in Sanjiang Plain gradually fragmented from 1995 to 2015. When the changes in the IIC and PC values were combined, the results showed that the changes in the core wetlands had a significant impact on hydrological connectivity.
From 1995 to 2015, the contribution of branches towards hydrological connectivity was the highest, followed by bridges and loops. Considering the continuous reduction in the core wetlands and an increase in the marginal wetlands, the proportion of branches in the foreground of the three wetland corridors showed an overall increasing trend. The contribution of bridges and loops increased annually from 1995 to 2010, but this trend declined from 2010 to 2015 (Figure 5d,e,g).
In most of the hotspots, the proportion of isolated island wetlands increased from 1995 to 2015 and the magnitude of this increase was quite evident from 2010. The highest value reached was 10 times higher than the proportion of isolated islands in 2005 (Figure 5f). The proportion of perforation wetlands in the foreground has generally shown a gradually declining trend over the last 20 years. The minimum and maximum values of the perforation proportions in the hotspots have both increased since 2010, while the median value has slightly decreased. This indicates that the proportion of perforations in all the hotspots has increased, with a significant increase in some hotspots and a decrease in most hotspots (Figure 5c).

4. Discussion

The analysis of the changes in the hydrological connectivity of each biodiversity hotspot from 1995 to 2015 using the IIC, PC (structural connectivity), and MSPA (functional connectivity) substantially improves the knowledge of wetland biodiversity conservation. The results of the study show that the structural connectivity in each wetland biodiversity hotspot was good (all of the ICC values were above 0.5 and most of the PC values were above 0.95), but the internal functional hydrological connectivity showed a declining trend (the average proportion of core wetlands in the hotspots has decreased by 4.82% over the past 20 years) due to the long-term human activities, despite some reservation efforts to mitigate the effects. This effect was mainly reflected in terms of a decrease in the proportion of core wetlands and an increase in the proportion of marginal wetlands and branch corridors.

4.1. Spatio-Temporal Changes of Biodiversity Hotspots Based on Hydrological Connectivity

The declined hydrological connectivity in most of the wetland biodiversity hotspots (Figure 3 and Figure 5) was generally consistent with the loss trends of the natural wetlands in Sanjiang Plain [35]. A similar spatiotemporal dynamic study of wetlands shows that an increase in agricultural land is usually the main reason for the decrease in wetland coverage [36]. This study further reveals the impact of the spatial pattern of agricultural land on the structural and functional connectivity of the wetlands. Although the hydrological connectivity of six of the eight biodiversity hotspots decreased due to the loss of natural wetlands caused by human activities, the hydrological connectivity has increased since 2005 in certain hotspots, such as Bio3 and Bio4, which are located at the convergence points of primary and secondary rivers. The regional precipitation in the Bio3 and Bio4 areas was analyzed from 2005 to 2015; it was found that after 2005, the annual precipitation in this region increased [37,38], and the structural hydrological connectivity index suddenly increased despite no significant change in the human activities from 1995 to 2005. This indicates that the changes in this area are largely attributable to changes in climatic factors (precipitation), which also suggests that the changes in hydrological connectivity inside the biodiversity hotspots located in high-grade rivers and closer to the source are much more affected by climate change than by human activities. A further interpretation is that the changes in river hydrology and geomorphological conditions at this location are prone to wetland formation and that the reclamation is difficult, which has minimized the human impact [39]. The results of the MSPA analysis (Figure 5a,b) showed that the proportion of core and marginal wetlands in each biodiversity hotspot ranged between 70% and 98% and between 2% and 24%, respectively. The proportion of core wetlands and marginal wetlands was mainly found to be influenced by the functional hydrological connectivity of the wetlands.
The ecological functions of wetlands will gradually degrade due to a continuous decrease in the proportion of core wetland area and an increase in the proportion of marginal wetland area [30]. Additionally, perforation, branching, and bridging were also the factors that led to the degradation of the wetland ecological functions. The key ways to maintain wetland functions are filling perforations, ensuring branching, and establishing bridging connections between the core wetlands. Therefore, it is suggested that wetland biodiversity conservation hotspots be identified first to clarify the spatial location of conservation when planning the conservation and utilization of plain wetlands. The perforation or the expansion of the existing perforations should be avoided as much as possible during the process of utilization and management. Once the core wetland breaks due to perforation expansion, the length of the branches and bridges between the subsections should be kept, as far as is possible, within the migration distance of most species (wetland functional threshold).

4.2. Assessment of the Hydrological Connectivity Indexes

Wetland hydrological connectivity is the basis for ensuring the normal operation and functioning of the wetland ecosystem and maintaining its biodiversity [40]. The structure and function of hydrological connectivity in the wetland management and control areas can be evaluated and monitored using the IIC, PC, and MSPA indexes, which provide an in-depth understanding of the health status of wetland species habitats and the pros and cons of wetland ecological functions. The predefined distance threshold affects the IIC and PC values. When the distance between wetland patches is lower than or equal to the threshold, two wetland patches are considered to be connected; otherwise, they are considered unconnected [28]. In this study, the distance threshold was set to 1 km, which could meet the migration distance of most bird species in the study area. There is quite a variation in the bird species that have been conserved in different wetland biodiversity hotspots; thus, the suitable migration distance should also be different. Therefore, further research is needed to determine more specific distance thresholds for individual hotspots. Additionally, MSPA indexes are also affected by pixel size. A large pixel size will result in a decrease in the proportion of core wetlands, leaving out small wetland patches such as “ecological island hopping” that provide temporary habitats for wetland species such as water birds [41]. A multi-scale analysis should be carried out according to the requirements of the wetland landscape of the conserved objects in the study area. When studying the conservation of the habitats of water birds, a finer pixel size can be selected to highlight the wetland connectivity of “island hopping”, but a larger pixel size can be selected when studying the wetland ecosystem because the identification of the fine patches and connectivity of the wetland ecosystem is not that necessary.

4.3. Implications for the Sustainable Management of Wetland Biodiversity Hotspots

This study shows that biodiversity hotspots at different spatial locations have different hydrological connectivity characteristics due to the differences in climate conditions and human activities. This should guide the sustainable management and protection of the wetland biodiversity hotspots in Sanjiang Plain. From the perspective of sustainable management, the type of land use management imposed on the biodiversity hotspots should be differentiated according to the sensitivity of the wetland to land use and its hydrological connectivity. For biodiversity hotspots that are highly sensitive to land use, strict management strategies should be adopted to maintain a sufficient degree of hydrological connectivity.
The ratios of core wetlands and edge wetlands are the key indexes that should be controlled in biodiversity hotspots. They are important indicators for the sustainable management of the biodiversity hotspots in Sanjiang Plain. An analysis of the spatio-temporal dynamics of these indicators would allow wetland managers to intuitively detect the hydrological connectivity gaps caused by uncontrolled land use, which would further promote the sustainable development of wetlands in Sanjiang Plain.

4.4. Future Research

Compared with the current connectivity evaluation based on the landscape pattern indexes, our method, which combined structural and functional hydrological connectivity indexes, sheds light on the impact of hydrological connectivity changes on marsh wetlands. Future research should determine the main causes of the hydrological connectivity changes and the impact of the hydrological connectivity changes on wetland functionality. This can be conducted by quantifying the relationship between the hydrological connectivity changes and climate/human interferences and the wetland ecological functions. This could aid in the understanding of the relationship between the influencing factors, hydrological changes, and ecological functions to clarify the driving mechanism of wetland ecosystems at all levels and provide more specific measures for wetland protection and restoration.

5. Conclusions

In this study, the IIC, PC structural connectivity index, and MSPA functional connectivity indexes were used to assess the influence of human activities on hydrological connectivity in the wetland biodiversity hotspots in Sanjiang Plain. This work enables researchers to better understand the benefits and limitations of using the IIC, PC, and MSPA methods for monitoring wetlands and their biodiversity. Structural and functional hydrological connectivity indexes can quantify the impact of human activities on wetland hydrological connectivity from different perspectives. These quantitative indexes provide wetland stakeholders and managers with comprehensive scientific measurement tools for evaluating wetland hydrological connectivity. Through the spatio-temporal comparative analysis of hydrological connectivity in a time series, wetland managers can identify current hydrological connectivity gaps and formulate targeted wetland restoration measures.

Author Contributions

Software, T.Z. and J.D.; Formal analysis, Y.W.; Writing—original draft, N.X. and X.L.; Writing—review & editing, Y.Q. All authors have read and agreed to the published version of the manuscript.

Funding

This research was funded by National Natural Science Foundation of China (Project Number 41971246), the Natural Science Foundation of Heilongjiang Province (Project Number LH2022C053), the Heilongjiang Academy of sciences (YY2020ZR01), and the Heilongjiang Province Key Laboratory of Cold Region Wetland Ecology and Environment Research of the Harbin University (Project Number 201910).

Institutional Review Board Statement

Not applicable.

Informed Consent Statement

Not applicable.

Data Availability Statement

Not applicable.

Acknowledgments

We thank the National Natural Science Foundation of China (Project Number 41971246) and the Heilongjiang Academy of sciences (YY2020ZR01) for the financial support. We also thank the Resources and Environmental Science Data Center of the Chinese Academy of Sciences, the China Earth System Science Data Center, the China Wetland Science Database for data support, the Natural Science Foundation of Heilongjiang Province (Project Number LH2022C053), and the Heilongjiang Province Key Laboratory of Cold Region Wetland Ecology and Environment Research of the Harbin University (Project Number 201910).

Conflicts of Interest

The authors declare no conflict of interest.

References

  1. Grill, G.; Lehner, B.; Lumsdon, A.E.; MacDonald, G.K.; Zarfl, C.; Reidy, L.C. An index-based framework for assessing patterns and trends in river fragmentation and flow regulation by global dams at multiple scales. Environ. Res. Lett. 2015, 10, 015001. [Google Scholar] [CrossRef]
  2. Zhang, M.M.; Wu, X.Q. Changes in hydrological connectivity and spatial morphology of Baiyangdian wetland over the last 20 years. Acta Ecol. Sin. 2018, 38, 4205–4213. [Google Scholar]
  3. Xie, C.J.; Xie, T.; Liu, Z.Z.; Ning, Z.H.; Yu, S.L.; Wang, Q.; Yu, H.L.; Cui, B.S. Effects of hydrological connection on wetland organisms. Environ. Ecol. 2020, 2, 31–39. [Google Scholar]
  4. Larsen, L.G.; Choi, J.; Nungesser, M.K.; Martha, K.; Harver, J.W. Direction-al connectivity in hydrology and ecology. Ecol. Appl. 2012, 22, 2204–2220. [Google Scholar] [CrossRef] [Green Version]
  5. Simioni, J.P.D.; Guasselli, L.A.; Etchelar, C.B. Connectivity among Wetlands of EPA of Banhado Grande, RS. RBRH 2017, 22, e15. [Google Scholar] [CrossRef] [Green Version]
  6. Liu, X.; Wang, H. Effects of loss of lateral hydrological connectivity on fish functional diversity. Conser. Biol. 2018, 32, 336–1345. [Google Scholar] [CrossRef]
  7. Tan, Z.; Wang, X.; Chen, B.; Liu, X.; Zhang, Q. Surface water connectivity of seasonal isolated lakes in a dynamic lake-floodplain system. J. Hydrol. 2019, 579, 124154. [Google Scholar] [CrossRef]
  8. Jahanishakib, F.; Salmanmahiny, A.; Mirkarimi, S.H.; Poodat, F. Hydrological connectivity assessment of landscape ecological network to mitigate development impacts. J. Environ. Manag. 2021, 296, 113169. [Google Scholar] [CrossRef]
  9. Boda, P.; Mora, A.; Várbíró, G.; Csabai, Z. Livin’ on the edge: The importance of adjacent intermittent habitats in maintaining macroinvertebrate diversity of permanent freshwater marsh systems. Inland Waters 2018, 8, 312–321. [Google Scholar] [CrossRef]
  10. Walesiak, M.; Mikusinski, G.; Borowski, Z.; Zmihorski, M. Large fire initially reduces bird diversity in Poland’s largest wetland biodiversity hotspot. Biodivers. Conserv. 2022, 31, 1037–1056. [Google Scholar] [CrossRef]
  11. Cui, B.; Wang, C.; Tao, W.; You, Z.Y. River channel network design for drought and flood control: A case study of Xiaoqinghe River basin, Jinan City, China. J. Environ. Manag. 2009, 90, 3675–3686. [Google Scholar] [CrossRef] [PubMed]
  12. Vanderhoof, M.K.; Alexander, L.C.; Todd, M.J. Temporal and spatial patterns of wetland extent influence variability of surface water connectivity in the Prairie Pothole Region, United States. Landsc. Ecol. 2016, 31, 805–824. [Google Scholar] [CrossRef] [Green Version]
  13. Vanderhoof, M.K.; Distler, H.E.; Lang, M.W.; Alexander, L.C. The influence of data characteristics on detecting wetland/stream surface-water connections in the Delmarva Peninsula, Maryland and Delaware. Wetl. Ecol. Manag. 2018, 26, 63–86. [Google Scholar] [CrossRef]
  14. Pedroli, B.; Pinto-Correia, T.; Cornish, P. Landscape-What’s in it? Trends in European landscape science and priority themes for concerted research. Landsc. Ecol. 2006, 21, 421–430. [Google Scholar] [CrossRef]
  15. Vogt., P.; Riitters, K. Guidos Toolbox: Universal digital image object analysis. Eur. J. Remote Sens. 2017, 50, 352–361. [Google Scholar] [CrossRef]
  16. Li, W.Y.; Fu, Q.; Zhao, Q. Environment Changes of Analysis on the Hydrographic and Water Resources of Marsh Wetland in the Sanjiang Plain. Res. Soil Water Conser. 2007, 14, 298–300. [Google Scholar]
  17. Zheng, Y.X.; Wu, Y.F.; Pan, X.N.; Qi, P.; Dai, Z.L.; Zhang, G.X. Evolution Characteristics of Meteorological and Hydrological Drought in Sanjiang Plain. Res. Soil Water Conserv. 2019, 135, 183–190+195. [Google Scholar]
  18. Lu, X.G. Biodiversity Change and Sustainable Utilization of Wetland in Sanjiang Plain; Science Press: Beijing, China, 2009. [Google Scholar]
  19. Margules, C.R.; Pessey, R.L. Systematic conservation Planning. Nature 2000, 405, 243–253. [Google Scholar] [CrossRef] [PubMed]
  20. Pressey, R.L.; Cabeza, M.; Watts, M.E.; Richard, M.; Cowling, R.M.; Wilson, K.A. Conservation planning in a changing world. Trens. Ecol. Evol. 2007, 22, 583–592. [Google Scholar] [CrossRef]
  21. Qu, Y.; Sun, G.Q.; Luo, C.Y.; Zeng, X.Y.; Zhang, H.Q.; Murray, N.J.; Xu, N. Identifying restoration priorities for wetlands based on historical distributions of biodiversity features and restoration suitability. J. Environ. Manag. 2019, 231, 1222–1231. [Google Scholar] [CrossRef]
  22. Wang, S. China Red Data Book of Endangered Animals; Science Press: Beijing, China, 1998. [Google Scholar]
  23. Wang, S.; Xie, Y. Chinese Species Red List; Higher Education Press: Beijing, China, 2009. [Google Scholar]
  24. Lagabrielle, E.; Rouget, M.; Bourgeois, T.L.; Payet, K.; Durieux, L.; Baret, S.; Dupont, J.; Strasberg, D. Integrating conservation, restoration and landuse planning in islands Anillustrative case study in Réunion Island (Western Indian Ocean). Landsc. Urban Plan. 2011, 2, 120–130. [Google Scholar]
  25. Higgins, J.V.; Bryer, M.T.; Khouryk, M.L.; Fitzhugh, T.W. A freshwater classification approach for biodiversity conservation planning. Conservs. Biol. 2005, 19, 432–445. [Google Scholar] [CrossRef]
  26. Carwardine, J.; Rochester, W.A.; Richardson, K.S.; Williams, K.J.; Pressey, R.L.; Possingham, H.P. Conservation planning with irreplaceability: Does the method matter? Biodivers. Conserv. 2007, 16, 245–258. [Google Scholar] [CrossRef]
  27. Ferrier, S.; Pressey, R.L.; Barrett, T.W. A new predictor of the irreplaceability of areas for achieving a conservation goal, its application to real-world planning, and a research agenda for further refinement. Biol. Conserv. 2000, 93, 303–326. [Google Scholar] [CrossRef]
  28. Pascual-Hortal, L.; Saura, S. Comparison and development of new graph-based landscape connectivity indices: Towards the priorization of habitat patches and corridors for conservation. Landsc. Ecol. 2006, 21, 959–967. [Google Scholar] [CrossRef]
  29. Saura, S.; Pascual-Hortal, L. A new habitat availability index to integrate connectivity in landscape conservation planning: Comparison with existing indices and application to a case study. Landsc. Urban Plan. 2007, 83, 91–103. [Google Scholar] [CrossRef]
  30. Saura, S.; Torné, J. Conefor Sensinode 2.2: A software package for quantifying the importance of habitat patches for landscape connectivity. Environ. Modell. Softw. 2009, 24, 135–139. [Google Scholar] [CrossRef]
  31. Riitters, K.H.; Vogt, P.; Soille, P.; Kozak, J.; Estreguil, C. Neutral model analysis of landscape patterns from mathematical morphology. Landsc. Ecol. 2007, 22, 1033–1043. [Google Scholar] [CrossRef]
  32. De Oliveira, S.N.; De Carvalho, J.; Osmar, A.; Trancoso, G.; Roberto, A. Landscape-fragmentation change due to recent agricultural expansion in the Brazilian Savanna, Western Bahia, Brazil. Region. Environ. Chang. 2017, 17, 411–423. [Google Scholar] [CrossRef]
  33. Shi, F.N.; Liu, S.Y.; An, Y.; Sun, Y.X.; Dong, S.K.; Wu, X. Changes of landscape fragmentation and connectivity with urbanization: A case study of Kunming City. Acta Ecrol. Olog. Sin. 2020, 40, 3303–3314. [Google Scholar]
  34. European Commission Joint Research Centre. Available online: http://forest.jrc.ec.europa.eu/download/software/guidos/mspa/ (accessed on 4 May 2022).
  35. Hu, P.; Wang, Z.M.; Li, C.J. Remote sensing evaluation of wetland conservation effectiveness in Sanjiang plain. Agric. Sci. J. Yanbian Univ. 2017, 39, 1–8. [Google Scholar]
  36. Yang, Z.M.; Han, L.F.; Liu, Q.P.; Li, C.H.; Pan, Z.Y.; Xu, K. Spatial and Temporal Changes in Wetland in Dongting Lake Basin of China under Long Time Series from 1990 to 2020. Sustainability 2022, 14, 3620. [Google Scholar] [CrossRef]
  37. Li, T.X.; Fu, Q.; Meng, F.X.; Cui, S. Analysis of evolution trend and abrupt changes of annual precipitation in Sanjiang Plain from 1959 to 2013. China Rural Water Hydropower 2016, 9, 201–204. [Google Scholar]
  38. Zhou, H.Y.; Diao, L.M.; Zheng, S.F. Remote Sensing Monitoring of Paddy Field Expansion in Fuyuan during 1990–2013. China Agric. Sci. Bull. 2018, 034, 140–146. [Google Scholar]
  39. Deng, W.; Song, X.S.; Zhai, J.L. Wetland Protection and Sustainable Utilization of Water Resources in the Flooded Area. Res. Environ. 2000, 3, 58–60. [Google Scholar]
  40. Roelke, D.L.; Spatharis, S.; Mitrovic, S.M. A new hydrology: Effects on ecosystem form and functioning. Can. J. Fish. Aquat. Sci. 2012, 69, 1377–1379. [Google Scholar] [CrossRef]
  41. Yu, Y.P.; Yin, H.W.; Kong, F.H.; Wang, J.J.; Xu, W.B. Analysis of the temporal and spatial pattern of the green infrastructure network in Nanjing, based on MSPA. Chin. J. Ecol. 2016, 35, 1608–1616. [Google Scholar]
Figure 1. Study area.
Sustainability 15 04952 g001
Figure 2. Spatial distribution of biodiversity conservation value and key biodiversity hotspots of hydrological connectivity analysis.
Sustainability 15 04952 g002
Figure 3. Changes in the IIC (a) and PC (b) of wetlands inside each hotspot from 1995 to 2015.
Sustainability 15 04952 g003
Figure 4. MSPA distribution types inside each biodiversity hotspot in Sanjiang Plain from 1995 to 2015.
Sustainability 15 04952 g004
Figure 5. Changes of each MSPA type in biodiversity hotspots from 1995 to 2015 ((a) box plot for Core; (b) box plot for Edge; (c) box plot for Perforation; (d) box plot for Branch; (e) box plot for Bridge; (f) box plot for Islet; (g) box plot for Loop).
Sustainability 15 04952 g005
Disclaimer/Publisher’s Note: The statements, opinions and data contained in all publications are solely those of the individual author(s) and contributor(s) and not of MDPI and/or the editor(s). MDPI and/or the editor(s) disclaim responsibility for any injury to people or property resulting from any ideas, methods, instructions or products referred to in the content.

