Abstract
This paper proposes an indirect-mode forced convection solar dryer equipped with a PV/T air collector. The PV/T air collector generates both heated air and electrical energy, which are used to force convection in the solar dryer. Experiments were carried out on selected tomato slices for which the temperature and humidity readings as well as the masses of the dried samples were instantaneously recorded for two days. A thermal analysis was performed on the solar drying system to investigate its performance. The PV/T dryer’s air temperature and velocity simulation using CFD modeling were validated by the experimental results for which the drying chamber was empty, without tomato slices. The experimental and numerical results were in good agreement. The difference between the CFD model and the experimental results for air temperature was around 1 °C (3%) and 2 °C (5%) for the solar collector and drying chamber, respectively. The average daily efficiencies of the collector, dryer, and PV panel for the solar drying system were estimated to be 30.9%, 15.2%, and 8.7%, respectively.
1. Introduction
Drying is one of the oldest food processing methods. A solar dryer is a device that uses solar energy to extract moisture from various agricultural products to extend their shelf life [1]. When compared to industrial dryers that use electricity or gas energy, solar dryers have a lower environmental impact [2]. A few years ago, predicted equations and thin-layer models were used to calculate the performance of solar dryers [3,4]. However, some mobile applications and computer software have recently been developed to predict the behavior of the solar drying process using smartphone application [5], numerical analyses with TRNSYS software [6], and MATLAB and computational fluid dynamics (CFD) programs [7].
A MATLAB/Simulink model was used in [8] to predict drying performance under various weather conditions over a 10-year period. The simulated temperatures and moisture content were highly accurate when compared to those of the experimental data. However, because the drying process is a complex multi-physics and multiphase problem, a CFD model is critical for describing it. Furthermore, some CFD simulations for solar dryers have been completed [9,10,11]. For instance, Sanghi et al. [12] created a CFD model to simulate the corn drying process in a solar cabinet dryer. In [12], the CFD model was used to simulate the dryer’s performance under overcast conditions with a lower incident solar irradiance, and the predicted removed moisture was 32% lower than in the fair-weather simulation. The predicted temperature and humidity distributions were similar to those of the experimental observations, though both temperature (8.5%) and humidity (21.4%) were overestimated. The model overpredicted the relative humidity due to the underprediction of the drying rate. Iranmanesh et al. [13] investigated the solar CFD modeling of the system and a quality evaluation was used to investigate the performance of a solar cabinet drying system for dried apple slices. Amer and Albaloushi [14] used a COMSOL CFD model to predict the trends of the air temperature, velocity, and performance of a solar dryer developed for drying cantaloupe.
Solar drying parameters such as drying temperature, air velocity, and other thermodynamic parameters for drying items all have an impact on the quality of fruits and vegetables. These parameters can be improved with CFD modeling and simulation techniques. It is critical to improve the efficiency of solar dryers and predict the performance of various types of solar dryers that preserve food quality [15]. According to Amanlou and Zomorodian [16], comparing the experimental results from the cabinet solar dryer and the predicted results from the CFD analysis’s data revealed very good correlation coefficients of 99.9% and 86.5% for the drying air temperature and air velocity in the drying chamber, respectively. Furthermore, Sonthikun et al. [17] performed a CFD simulation for the air flow distribution inside a solar–biomass hybrid dryer to ensure the utility of air circulating fans. In terms of statistical parameters, the simulation results for temperature were found to be very close to the experimental values; the coefficient of determination and the root mean square of the percentage error varied from 0.98 to 0.99 and from 2.3% to 5.9%, respectively.
By measuring the temperature along the tunnel dryer, Hussain et al. [18] validated the CFD model. The mean temperature difference between the experiment and the CFD simulation was found to be 1.5 °C, allowing for more qualitative insights into the temperature distribution within the collector and drying chamber. Benhamza et al. [19] used CFD of indirect solar dryer results to determine the best configuration that ensures the most uniform drying. CFD and image processing demonstrated that a mass flow rate of 0.06 kg/s is the optimal operating condition for improving the drying uniformity and drying temperature. In [20], Ansys Fluent software was used to visualize both the flow and thermal behavior inside a vertical hybrid photovoltaic/thermal (PV/T) solar dryer. The obtained results revealed that the deviation between the numerical and experimental findings ranged between 4.2 and 8.7%.
Recently, there has been growing interest in the impact of the PV/T collector’s design on both electrical and thermal performances. For instance, Touti et al. [21] analyzed the geometry impact of a flat PV/T collector on its electrical and thermal performances. It has been observed that the system performance increases by increasing the number of air ducts in the PV/T collector. Recent developments of PV/T systems have heightened the need for compound parabolic concentrators (CPCs) and phase change materials (PCMs), as they are effective methods to promote both electrical and thermal performances [22]. The integration of a CPC in a PV/T system enhances the thermal and electrical energy gain while the incorporation of PCMs boosts the cooling down of PV cells. A case study approach was adopted by Kong et al. [22] to evaluate the effectiveness of a compound parabolic concentrating PV/T system integrated with PCMs (PV/T–CPCM). It was reported that the PV/T–CPCM system gained an important heat–electricity cogeneration performance with a maximum primary energy efficiency of 7.9%, approximately.
A 3D CFD simulation was used in [23] to predict the flow and temperature distribution within a drying chamber. The maximum average temperature difference between the measurement and prediction by the CFD model was found to be 4.3 °C. A modeling process based on a CFD simulation was used in [24] to diagnose the operation and determine the best solar drying operating parameters. The results of CFD combined with the experimental results gave the researchers a better understanding of the air distribution inside the dryer, which led to the avoidance of non-uniformity and the enhancement of the design. The CFD tool has also been shown to be an extremely powerful tool for the parametric study and optimization of a tray drying chamber design for use in batch-type tray dryers in leaf drying [25].
Since the PV/T solar dryer is one of the most important types of solar dryers, some previous research has already been conducted [4]. However, there are few research studies using CFD modeling to validate the performance of PV/T solar dryers [2,20] or to describe the solar drying process for tomato slices [26]. Therefore, this paper can easily and clearly explain the performance of the solar PV/T dryer using a CFD simulation. Furthermore, we use the CFD model to simulate the air temperature and velocity distributions versus the experimental results when the drying chamber is empty (without tomato slices).
The purpose of this paper is to evaluate the performance of an indirect forced convection solar dryer equipped with a PV/T air collector. During our drying experiments of the tomato slices, the masses of the samples were instantaneously monitored together with the air temperature and relative humidity inside the PV/T collector and drying chamber. In addition, a 2D CFD model was carried out to simulate the airflow temperature and velocity inside the PV/T collector and drying chamber when the latter was empty, without the tomato slices. The CFD simulations were then compared with the experimental results.
2. Materials and Methods
2.1. PV/T Solar Dryer Setup
A solar dryer uses solar energy to dry agricultural products, which aids in their preservation. In this paper, the PV/T solar dryer shown in Figure 1 and Figure 2 is made up of the following components: (1) drying chamber, (2) PV/T solar collector, (3) solar charge controller, (4) battery, (5) PWM speed controller, (6) fan, (7) Arduino Mega, (8) DHT22 sensors, (9) load cells, and (10) SD card module. Table 1 provides a brief description of components. The photovoltaic-thermal collector (PV/T) generates electricity as well as heated air for drying. A polycrystalline PV module generates the electricity, which is then stored in a gel battery. The stored energy is then used to power the fan, which ensures forced convection. The dryer is then filled with heated air to dry tomato slices. DHT22 sensors are installed inside the system and connected to Arduino Mega to measure the temperature and humidity. During the experiment, four load cells are used to measure the mass of tomatoes. The data collected are then saved to an SD card (Figure 2).
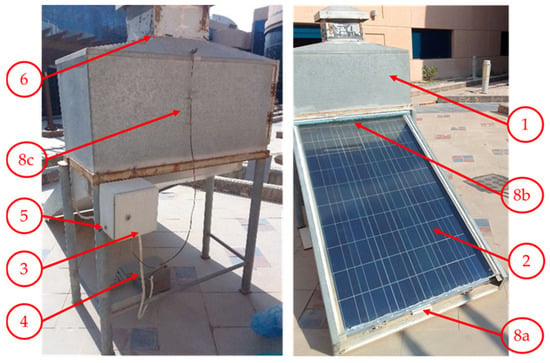
Figure 1.
Solar dryer coupled to PV/T air collector (1: drying chamber; 2: PV/T solar collector; 3: solar charge controller; 4: battery; 5: PWM speed controller; 6: fan; 8: DHT22 sensors).
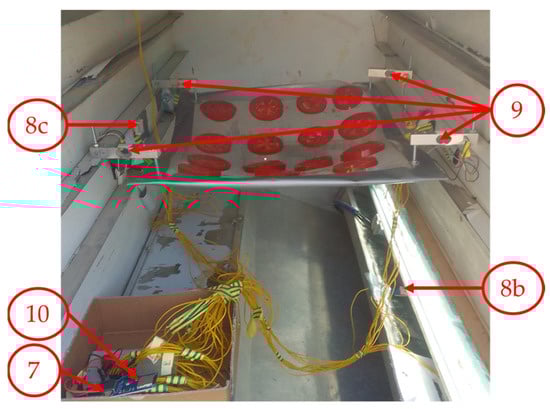
Figure 2.
Locations of DHT22 sensors (8), Arduino Mega (7), load cells (9), and SD card module (10) inside the drying chamber.

Table 1.
Components of the PV/T solar dryer.
2.2. Experimental Procedure
Experiments were carried out to test the solar dryer prototype, including open sun drying and forced convection drying. The experiments were performed in November till December 2022 at the College of Engineering at King Faisal University (25°20′08.4″ N Latitude, 49°35′52.9″ E Longitude), Al-Ahsa, Saudi Arabia, from 8:00 to 16:00 (roughly 8 h per day) and were stopped at night. Tomato slices were stored in plastic bags at night to prevent moisture buildup. Throughout these experiments, continuous readings for product mass as well as temperature and humidity inside the PV/T and dryer were recorded on an SD card. Two DHT22 sensors were installed in the inlet and outlet of the PV/T to measure temperature and humidity, while another one was installed inside the drying chamber above the product (Figure 2).
Fresh tomatoes were sliced into samples with a thickness of around 5 mm (±0.2 mm) for all tomato slices. Fresh samples for open sun drying were left outside with an initial mass of 250 g (Figure 3). In addition, fresh samples with an initial mass of 250 g were left inside the solar dryer (Figure 4).
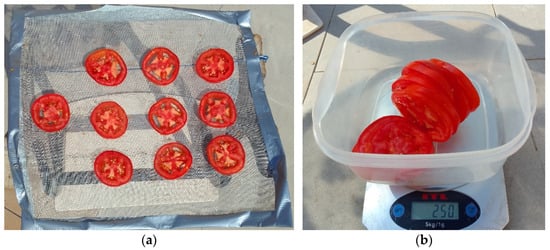
Figure 3.
Tomato slices before open sun drying: (a) open sun drying; (b) mass of samples.
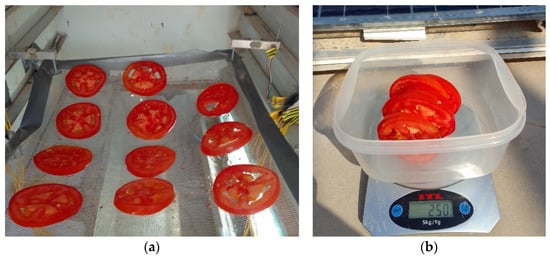
Figure 4.
Tomato slices before drying inside the dryer: (a) samples inside the dryer; (b) mass of samples.
The fresh and dried moisture contents of tomato slices were measured by a moisture analyzer with a stainless steel platform (Model: Adam Equipment PMB 53). The tomato slices’ wet basis moisture content at any time (ti) during drying process was determined using the following equation [27]:
where Wd is the mass of the dried sample in (kg), and Wi is the mass of tomato slices at time ti, in (kg). The tomato slices’ mass was determined by weighting the samples during the drying process.
Table 2 shows the air speed at the PV/T inlet, inside the dryer, and at the dryer outlet.
Table 2.
Air speed values for the PV/T solar dryer.
Uncertainty values are required for experimental work to evaluate various variables. Instruments, observation, calibration, reading, environment, and other factors all contribute to uncertainty. The temperature and relative humidity of the air at the inlet and outlet of the solar collector and inside the drying chamber, the mass of samples, and the air velocity were the independent parameters measured in the experiments.
Calculating uncertainty in experimental results for measuring different parameters is required to ensure that errors occur due to instrument selection. The uncertainty variables are Y1, Y2, … Yn, and the independent variables for different parameters in the result YR are Z1, Z2, … Zn. The estimation of the total uncertainty in the experimental process could be calculated as follows [28,29]:
Table 3 shows the uncertainty for various devices used in these experiments. Devices with an uncertainty of less than or equal to 5% are considered reasonable by standards.
Table 3.
Uncertainty of various parameters for the PV/T solar dryer.
According to Equation (2), the uncertainty of various parameters was calculated and is given in Table 4.
Table 4.
Uncertainty calculation of various parameters for the PV/T solar dryer.
2.3. Input Air Characteristics
The temperature in (°C), the relative humidity in (%), and the average velocity in (m/s) for ambient air as well as the solar irradiance in (W/m2) were measured by a local weather station in the Water Studies Center at King Faisal University (25°16′21.8″ N Latitude, 49°42′33.6″ E Longitude), Al Ahsa, Saudi Arabia.
The absolute humidity (AH) of air in (g/m3) can be calculated using the following equation [30]:
where T is the temperature expressed in (°C) and RH is the relative humidity expressed in (%).
2.4. Efficiency of the PV/T Solar Dryer
The following equations are used to assess the efficiency of the PV/T solar dryer: (1) the efficiency of the solar collector, (2) the efficiency of the drying chamber, and (3) the efficiency of the PV panel.
The solar collector efficiency ηC is given as [31,32]:
where the energy input to the solar air collector is as follows:
where Ic is the instantaneous inclined solar irradiance (W/m2). The energy output from the solar air collector to the drying chamber is:
However, the output heat from the solar collector can be determined as follows [33,34]:
The drying chamber efficiency (ηd) is given as follows [35]:
where the output heat from the solar collector equals the input heat to the drying chamber.
The total thermal energy by evaporation from the product is determined by [5] as follows:
Since the outlet energy from the drying chamber is the energy needed to evaporate moisture from the product, it can be calculated from the following equations.
The sensible heat to raise tomatoes’ temperature (Qs) can be estimated by the following:
The latent heat to evaporate moisture from tomato slices (QL) is computed by the following:
where mt represents the rate of water removal from the product (kgw/s), and λt represents the latent heat of water vaporization [36] (2300 kJ/kg).
The moisture exchange between the product and the air inside the dryer follows a mass balance relationship in which moisture lost by the product is picked up by the air. The total mass of water to be removed from the total mass of the fresh product is given by the following [5]:
The PV panel efficiency is expressed as [1]:
2.5. Computational Fluid Dynamics (CFD) Simulation
A 2D CFD simulation was conducted using ANSYS Fluent 2023R1 for the solar dryer coupled to the photovoltaic/thermal collector (PV/T). The purpose of the simulation was to study the temperature and air velocity distribution inside the drying chamber when the latter is empty, without tomato slices. Figure 5 depicts the geometry and dimensions of the PV/T solar dryer proposed as drawn in Ansys, while Table 5 presents the dimensions of main parts of the PV/T solar dryer.
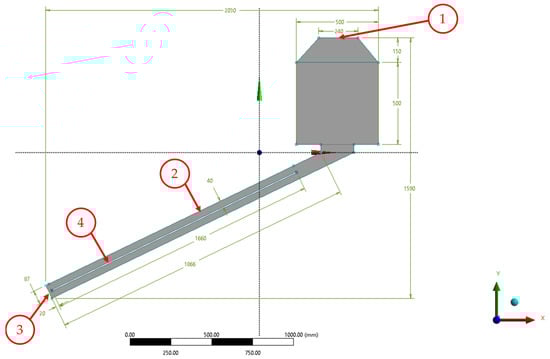
Figure 5.
Geometry and dimensions of the PV/T solar dryer in Ansys: (1) dryer outlet, (2) glass, (3) PV/T inlet, and (4) PV module.
Table 5.
Dimensions of main parts of the PV/T solar dryer.
Figure 5 also shows the main dryer elements used in the CFD simulation. Several assumptions are adopted in this simulation: (1) there are no leaks in the dryer, (2) the system is fully isolated (except both the inlet and outlet), (3) the properties of the fluid are constant and uniform, and (4) the air flow inside the dryer is turbulent (Reynolds number Re > 4000). The properties of materials used in the ANSYS Fluent simulation are shown in Table 6.
Table 6.
Material properties for ANSYS simulation.
The fluid’s boundary conditions were as follows:
- (1)
- For the air flow, the inlet boundary condition is specified as atmospheric pressure and the outlet boundary condition is specified as velocity outlet in the Y-axis direction, with the wall boundary conditions isolated and at no slip.
- (2)
- For heat transfer, the PV panel and the glass cover have constant and uniform thermal energy, and heat transfer is accomplished through convection. The heat from the gap between the PV panel and the glass is transferred to the drying chamber by the air.
- (3)
- The input parameters for CFD simulations are the collector’s inlet temperature (Tin), the dryer’s outlet air velocity (vout), the photovoltaic panel temperature (TPV), the glass cover temperature (Tg), the dryer’s outlet temperature (Tout), and the temperature of the dryer’s outside surface (TWall).
To conduct 2D CFD simulations in ANSYS, the standard k-epsilon turbulence model was selected to carry out computations in the steady-state phase, because it could produce satisfactory results for the current study. Moreover, this turbulence model has been widely used in practical engineering flow analyses since it was proposed by Launder and Spalding in 1972. The model’s robustness, economy, and reasonable accuracy have contributed to its popularity in industry for flow and heat transfer simulations [37].
The standard k-epsilon turbulence model is presented by the following equations [24]. The continuity equation can be written as follows:
The Reynolds-averaged Navier–Stokes (RANS) equations can be written as follows:
and
The turbulence kinetic energy (k) and its rate of dissipation (ε) are obtained from the following transport equations:
and
where the turbulent viscosity is:
and Gk, which represents the generation of turbulence kinetic energy due to mean velocity gradients, is:
The model parameters are constant: C1ε = 1.44, C2ε = 1.92, Cµ = 0.09, σk = 1, and σε = 1.3.
Because the current study demonstrates CFD simulation for an empty solar dryer (without tomato slices), the input parameters required for simulation are measured then updated in the model before running calculations with ANSYS Fluent. The CFD simulation was carried out on 28 November 2022 at 13:00 when the drying chamber was empty. The input parameters for CFD model are given in Table 7.
Table 7.
Input parameters for CFD simulation on 28 November 2022 at 13:00 when the drying chamber was empty (without tomato slices).
The PV panel temperature (TPV) was calculated using the following equation [38]:
where Tamb is the ambient temperature, Ic is the irradiance in W/m2, and NOCT is the nominal operation cell temperature which ranged between 47 °C and 50 °C. In the current study, NOCT is assumed to be 47 °C since it is located on a south-oriented tilted surface [38]. According to Figure 6, the irradiance for the first day was 651 W/m2 while it was 678 W/m2 for the second day.
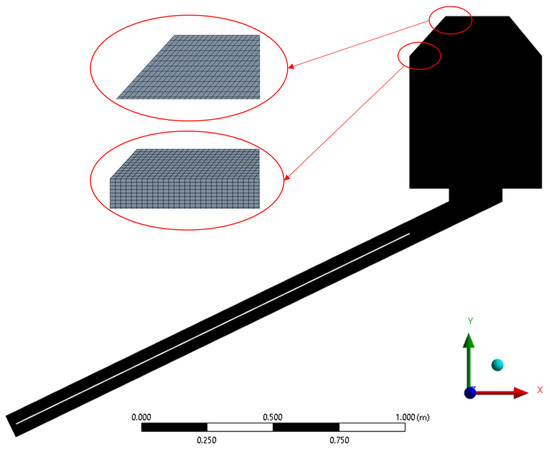
Figure 6.
2D model mesh for the PV/T solar dryer.
The glass cover temperature (Tg) can be calculated in Kelvin as follows [39]:
where hw is the wind heat transfer coefficient in (W/m2 K) [40]:
while εPV is the PV emittance (εPV = 0.92 [41]) and vw is the wind velocity, which was around 0.6 m/s on 28 November 2022 at 13:00.
The mesh is an essential component of the simulation process. It has an impact on the solution’s accuracy, convergence, and speed. The air inside the PV/T solar dryer was meshed using the meshing tool in Ansys Fluent 2023R1. The PV/T solar dryer mesh was created using quadrilateral elements whose edge lengths ranged from 0.9 mm to 2 mm. The mesh quality was assessed by ensuring that all elements’ skewness and quality fell within the optimal ranges (e.g., a target skewness of 0.9, a transition ratio of 0.272, a growth rate of 1.2, and a pinch tolerance of 0.081 mm).
A mesh independence study was carried out with five mesh refinements (mesh I—103199, mesh II—210064, mesh III—336529, mesh IV—408335, and mesh V—503925). Consequently, mesh IV was selected as a good compromise between accuracy and computation time. The selected mesh has 408,335 nodes and 403,771 elements, and it produced similar results to a mesh with more nodes. However, as the number of nodes decreased, the results change. Furthermore, the minimum orthogonal quality was 0.741 and the maximum aspect ratio was 3.078. Figure 6 depicts the chosen mesh.
3. Results
3.1. Air Characteristics for Solar Drying of Tomatoes
Because of the changing characteristics of the ambient air, there was a continuous variation in the drying air characteristics during the solar drying experiments (Figure 7).
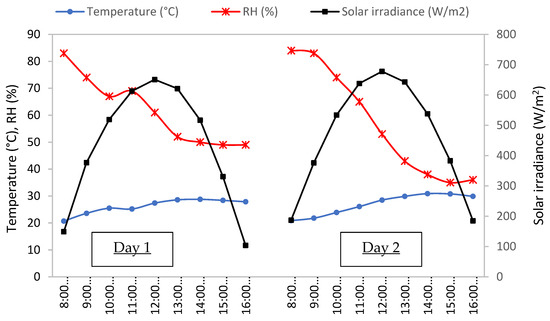
Figure 7.
Variations in ambient air temperature, relative humidity (RH), and solar irradiance versus time of day (5 and 6 December 2022).
The variations in ambient air temperature, relative humidity, and solar irradiance during the day are shown in Figure 7. The maximum values for the solar irradiance and ambient air temperature were observed between 11:00 and 13:00, while the lowest values were observed in the morning and before sunset. However, the highest value for the ambient air humidity was observed in the morning, while the lowest value was observed before sunset. The variations in the ambient temperature and relative humidity were caused by changes in solar irradiance. During the two days of the open sun drying experiment, the average speed of the ambient air ranged from 0.5 m/s to 1 m/s.
According to Figure 7, the ambient air temperature in the first day of the experiment ranged from 23.1 °C to 28.9 °C, and the relative humidity ranged from 92% in the morning to 49.8% in the afternoon, while the drying air temperature ranged from 29.8 °C to 42 °C, and the relative humidity ranged from 5.5% to 36.9%. During the first day, the average maximum solar irradiance ranged from 600 W/m2 to 670 W/m2, while the maximum temperature difference between the ambient air and the drying air ranged from 9 °C to 12 °C.
However, Figure 8 shows that the mean air temperature inside the solar collector ranged from 23 °C (296 °K) in the morning to 30 °C at 13:00 (303 °K) at the inlet point. Moreover, the mean air temperature inside the solar collector ranged from 32 °C (305 °K) in the morning to 41 °C at 13:00 (314 °K) at the outlet point. The difference in air temperature between the solar collector outlet and the drying air temperature, as shown in Figure 8, was around 9–10 °C.
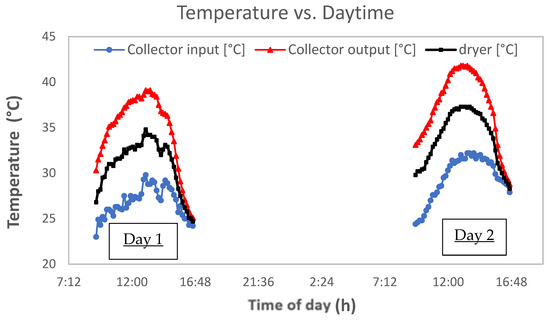
Figure 8.
Air temperature distribution for the solar collector input/output and the drying chamber (5 and 6 December 2022).
Figure 9 depicts the mean absolute humidity in (g/m3) of the solar collector’s input (AH1) and output (AH2), as well as inside the dryer (AH3). Due to the high ambient air humidity, the absolute humidity of the solar collector’s input for the first day of drying the tomato slices was around 19 g/m3 in the morning, increased slightly at 13:00 to be over 25 g/m3, and then decreased to around 12 g/m3 at 16.00 due to the falling ambient air humidity. The absolute humidity of the solar collector’s output, on the other hand, ranged from 14 g/m3 in the morning to around 16.5 g/m3 at 13:00 and then around 10 g/m3 at 16:00. In contrast, the absolute humidity inside the drying chamber ranged from 15 g/m3 in the morning to 10 g/m3 at 16:00, reaching 20 g/m3 at 13:00. For the second day of the drying process, the absolute humidity ranged from 18 to 22 g/m3, from 16 to 23 g/m3, and from 16 to 22 g/m3, for the solar collector’s input and output and the dryer, respectively.
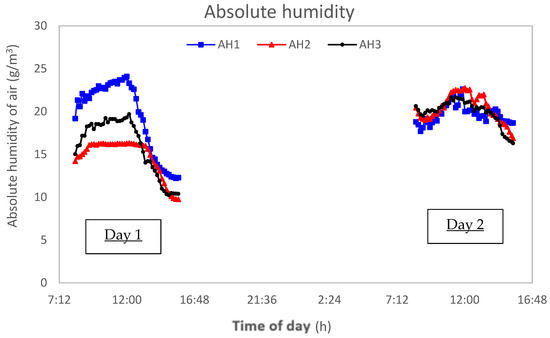
Figure 9.
Absolute humidity distribution for the solar collector’s input/output and the drying chamber (5 and 6 December 2022).
Figure 10, Figure 11 and Figure 12 depict the absolute humidity versus both temperature and relative humidity for the solar collector’s input and output and the dryer, respectively. According to Figure 10, the relative humidity in the solar collector’s input was higher than that of the solar collector’s output; it ranged from 50% to 95%. However, the temperature ranged from 23 °C to 33 °C.
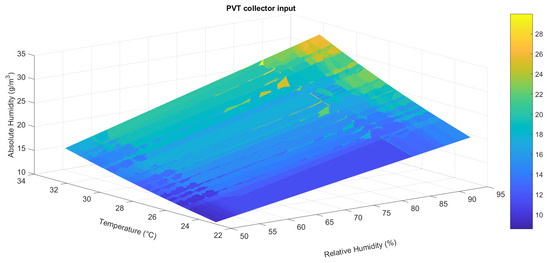
Figure 10.
Absolute humidity distribution vs. temperature and relative humidity for the solar collector’s input (5 and 6 December 2022).
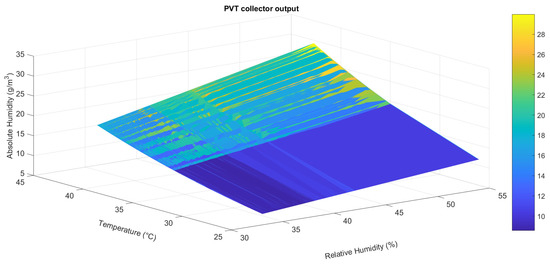
Figure 11.
Absolute humidity distribution vs. temperature and relative humidity for the solar collector’s output (5 and 6 December 2022).
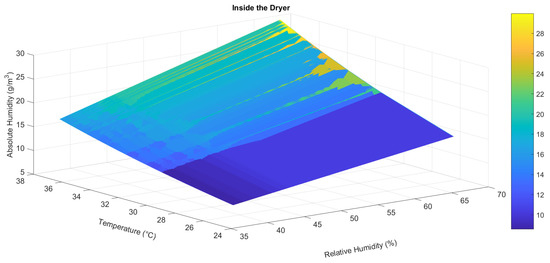
Figure 12.
Absolute humidity distribution vs. temperature and relative humidity inside the drying chamber (5 and 6 December 2022).
According to Figure 11, the PV/T collector has an important impact on both the relative humidity and temperature. Thus, the relative humidity decreased compared to the collector input and ranged from 33% to 55%, while the temperature increased compared to the collector input and ranged from 25 °C to 45 °C.
Since the heated air produced by the PV/T collector extracts the moisture from the tomato slices inside the dryer, the relative humidity increased compared to the collector output and ranged from 35% to 70% as shown in Figure 12, while the temperature decreased compared to the collector output and ranged from 24 °C to 38 °C.
3.2. Tomatoes’ Drying Characteristics
Figure 13 shows the tomato slices after the drying process inside the drying chamber and for open sun drying, while Figure 14 depicts the evolution of the moisture content of these tomato slices during the two days of the experiment for both drying methods. The wet basis moisture content of the fresh tomato slices ranged from 90 to 91%, while the moisture content of the final tomato slices ranged between 9 and 10%. Figure 14 also shows that the moisture content of the tomato slices dried in the solar dryer decreased faster than that of those in the open sun. At the end of the first day, it was 70% inside the solar dryer and 80% outside in the open sun. The final moisture content for the tomato slices inside the dryer was 10% at the end of the second day and 31% for the open sun drying. As a result, the solar dryer reduced the drying time for the tomato slices when compared to the open sun drying method.
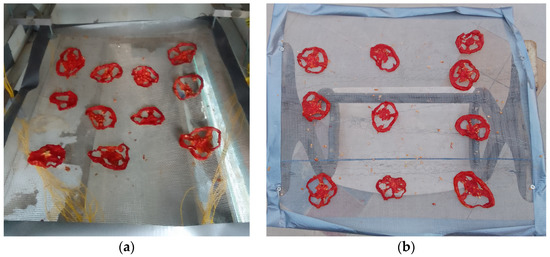
Figure 13.
Tomato slices after drying: (a) inside the drying chamber, (b) open sun drying.
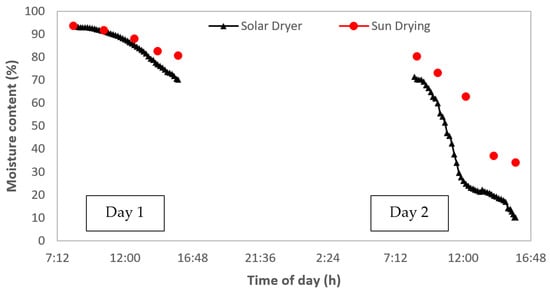
Figure 14.
Moisture content of tomato slices for solar drying and open sun drying vs. time of day (5 and 6 December 2022).
Furthermore, Figure 14 shows that the moisture content of the tomato slices at the same measured point differs slightly during the open sun drying and the solar drying process using the PV/T solar dryer. The average moisture content of the fresh tomato slices was 91.4% (w.b.), while the average moisture content of the final dried tomatoes was around 10.2% (w.b.). The time for the solar drying process for the tomato slices was around 16 h inside the solar dryer; however the moisture content of the dried tomatoes for the open sun drying was 31% with the same time of drying (16 h). As a result, it may take longer than this amount of time to reach the expected final moisture content (9–10%).
3.3. Efficiency of the PV/T Solar Dryer
The efficiency of the PV/T solar collector is calculated using Equations (4)–(13). Table 8 depicts the average daily PV panel efficiency, solar collector efficiency, and drying chamber efficiency. Because of the midday temperature increase, the PV panel efficiency fell to 8.7%, while the collector efficiency rose to 30.9%. The dryer efficiency was high during the first stage of the drying process to remove the most amount of moisture from the fresh tomato slices, but then decreased until sunset. The experiment was restarted after sunrise on the second day, with the dryer efficiency decreasing slightly until the end of the drying process. The low efficiency of the PV/T solar dryer’s components could be attributed to the high humidity of the ambient air in the morning.
Table 8.
Efficiencies for the items of PV/T solar dryer.
3.4. CFD Simulation Results
To simulate the temperature distribution and air flow inside the PV/T solar dryer, a preliminary study was carried out using ANSYS Fluent 2023R1 based on the input parameters given in Table 7. These parameters were measured on 28 November 2022 at 13:00 with a solar irradiance of 682 W/m2 when the drying chamber was empty (without the tomato slices).
The air temperature distribution inside the dryer and PV/T collector is depicted in Figure 15, with an outlet air velocity of 3.9 m/s for the constant dryer. Figure 15 shows that the air temperature through the PV/T solar dryer ranges from 30.7 °C to 53.7 °C, with an average of 44 °C inside the drying chamber. The air temperature was found to be lower near the back side, ranging from 36 °C to 38 °C, and higher in the middle, ranging from 43 °C to 45 °C.
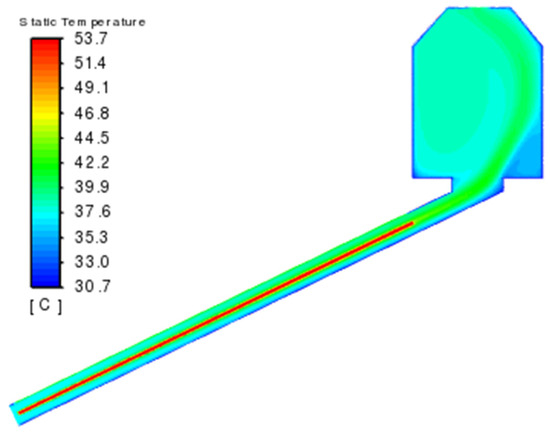
Figure 15.
Temperature distribution for the PV/T solar dryer with 3.9 m/s outlet air velocity on 28 November 2022 at 13:00 with solar irradiance of 682 W/m2 when the drying chamber was empty (without tomato slices).
Figure 16 shows the air flow inside the drying chamber and PV/T collector, with an outlet air velocity of 3.9 m/s for the constant dryer, measured on 28 November 2022 at 13:00. Additionally, there was a solar irradiance of 682 W/m2 when the drying chamber was empty (without the tomato slices). According to Figure 16, the air velocity varies between 0.4 and 3.9 m/s, with an average of 1.3 m/s inside the dryer. It also reveals that the air velocity distribution inside the drying chamber varied; it ranged from 0.4 m/s to 1.5 m/s near the back side and from 1.9 m/s to 3.1 m/s in the center.
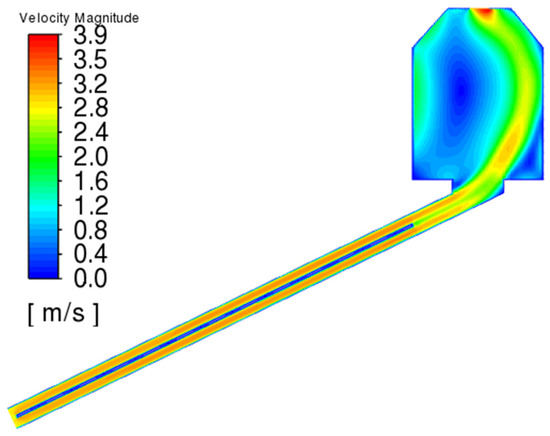
Figure 16.
Air velocity distribution for the PV/T solar dryer with 3.9 m/s outlet air velocity on 28 November 2022 at 13:00 with solar irradiance of 682 W/m2 when the drying chamber was empty (without tomato slices).
4. Discussion
Because the PV panel is located inside the solar collector, it is completely protected from inclement weather, so its efficiency is improved. However, because the fan is not operating at full capacity, the performance is evaluated under ambient conditions. The findings revealed that the PV power output and module temperature were proportional to solar irradiance and ambient temperature.
Since autumn is the rainy season in Al Ahsa, the ambient air humidity was excessively high in the morning and even during the day from November till December 2022. The air temperature was distributed in the opposite direction to the distribution of the air velocity inside the drying chamber. The air velocity inside the drying chamber may influence the air temperature. The efficiency of the PV/T solar dryer could be improved during the summer season due to an increase in solar irradiance.
The experimental results for drying the tomato slices inside the PV/T solar dryer (Figure 8) show that the air temperature increased inside the solar collector, it was at its maximum value in the collector outlet, and then it decreased inside the drying chamber due to moisture extraction from the tomato slices. The inlet air temperature to the PV/T solar dryer (32.2 °C) increased slightly over the first day (29.8 °C). This could be attributed to a slight increase in solar irradiance (678 W/m2) on the second day compared to that of the first day (651 W/m2). This may also have an impact on the panel temperature, glass temperature, and outlet temperature.
According to our study of the air path for both the air temperature and velocity through the PV/T solar dryer on 28 November 2022 at 13:00 (with a solar irradiance of 682 W/m2 when the drying chamber was empty (without any tomato slices)), the input parameters for the CFD model were equal to the data collected from the ambient air (Table 7). The results show that the air temperature increased through the air path inside the solar collector, it was at its maximum value in the collector outlet, and then it decreased inside the drying chamber (Figure 17). However, the air velocity increased from the inlet to the outlet of the solar collector, and it was at its maximum value in the outlet of the drying chamber (Figure 18).
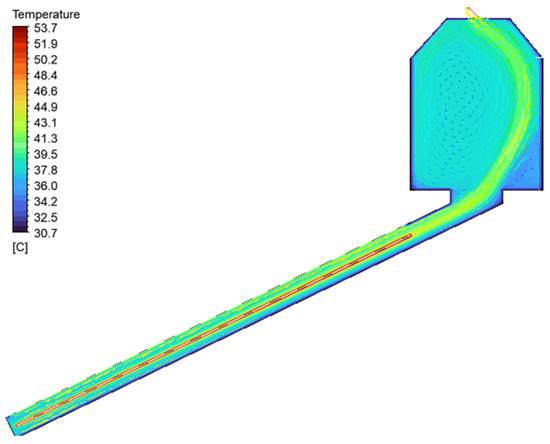
Figure 17.
Air path profile of the temperature for the PV/T solar dryer with 3.9 m/s outlet air velocity on 28 November 2022 at 13:00 with solar irradiance of 682 W/m2 when the drying chamber was empty (without tomato slices).
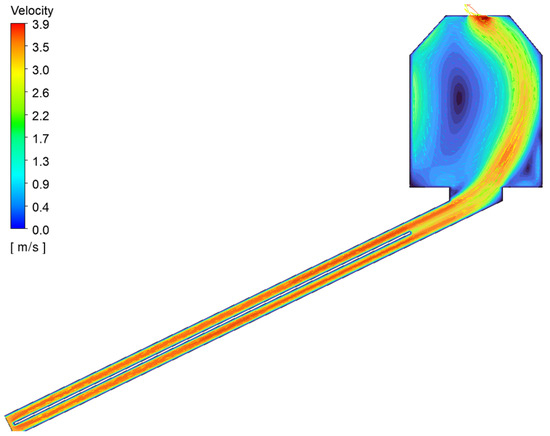
Figure 18.
Air path profile of the velocity for the PV/T solar dryer with 3.9 m/s outlet air velocity on 28 November 2022 at 13:00 with solar irradiance of 682 W/m2 when the drying chamber was empty (without tomato slices).
Table 9 depicts a comparison of the experimental and CFD simulation results for the output parameters on 28 November 2022 at 13:00 with a solar irradiance of 682 W/m2 when the drying chamber was empty (without any tomato slices). Table 9 also shows that the difference between the air outlet’s temperature for the CFD model and the experimental results for the solar collector and empty drying chamber was around 1 °C and 2 °C, respectively. As a result, the CFD model’s results were close to the experimental results and can accurately represent the performance of the solar dryer.
Table 9.
Output parameters for CFD simulation and measured values for the PV/T solar dryer on 28 November 2022 at 13:00 with solar irradiance of 682 W/m2 when the drying chamber was empty (without tomato slices).
5. Conclusions
An indirect forced convection solar dryer prototype equipped with a PV/T air collector was used to conduct our experiment on the selected tomato slices. According to the thermal analysis of the solar drying system, we determined that its performance was good and that it saved energy.
CFD was found to be an important simulation tool for the design and development of the PV/T solar dryer. CFD can also be used to improve the design of solar dryers. This model enabled the visualization of air properties, such as temperature and velocity, within the solar dryer. The PV/T dryer’s air temperature and velocity were simulated and validated using experimental data when the drying chamber was empty (without any tomato slices); they showed good agreement. Our results present the advantages of collaboratively improving the PV/T solar dryer’s performance and help promote the application of PV/T systems for heat–electricity generation for developing environmentally sustainable equipment.
The possibility of rot was high in this version of the system due to the uncontrolled air temperature, which is the primary cause of rot, as well as the weather conditions. Therefore, this prototype needs to be modified to improve its performance. Furthermore, a 3D CFD study could be adopted to improve these results and to suggest new geometries for the PV/T collector. Mass transfer is not considered in this research study; it could be considered in further studies.
Author Contributions
Conceptualization, H.C.; Methodology, H.C. and B.M.A.A.; Software, H.C.; Validation, B.M.A.A.; Formal analysis, B.M.A.A.; Investigation, H.C. and B.M.A.A.; Resources, H.C.; Data curation, H.C. and B.M.A.A.; Writing—original draft, H.C. and B.M.A.A.; Writing—review & editing, H.C. and B.M.A.A.; Visualization, B.M.A.A.; Supervision, B.M.A.A.; Project administration, H.C.; Funding acquisition, H.C. All authors have read and agreed to the published version of the manuscript.
Funding
This work was supported through the Annual Funding track by the Deanship of Scientific Research, Vice Presidency for Graduate Studies and Scientific Research, King Faisal University, Saudi Arabia [Project No. AN000321].
Institutional Review Board Statement
Not applicable.
Informed Consent Statement
Not applicable.
Data Availability Statement
Not applicable.
Conflicts of Interest
The authors declare no conflict of interest.
Nomenclature
| Ac | collector area (m2) |
| AH | absolute humidity of air (g/m3) |
| RH | relative humidity expressed (%) |
| Ic | inclined solar irradiance (W/m2) |
| ma | rate of air (kg/s) |
| cp,a | specific heat of air (J/kg.°K) |
| t | time (s) |
| Tc,in | air inlet temperature to collector (°C) |
| Tc,out | air outlet temperature from collector (°C) |
| mp | rate of fresh tomatoes (kg/s) |
| cp,p | specific heat of tomatoes (kJ/kg.°C) |
| ρt | density of tomatoes (kg/m3) |
| Tt,in | tomatoes inlet temperature to drying chamber (°C) |
| Tt,out | tomatoes outlet temperature from drying chamber (°C) |
| mt | rate of water removed from product (kgw/s) |
| λt | latent heat of water vaporization (kJ/kg) |
| Mwi | moisture content wet basis of tomato slices at any time (%) |
| Wd | mass of the dried sample (kg) |
| Wi | mass of tomato slices at time ti (kg) |
References
- Azam, M.M.; Eltawil, M.A.; Amer, B.M.A. Thermal Analysis of PV System and Solar Collector Integrated with Greenhouse Dryer for Drying Tomatoes. Energy 2020, 212, 118764. [Google Scholar] [CrossRef]
- Fterich, M.; Chouikhi, H.; Sandoval-Torres, S.; Bentaher, H.; Elloumi, A.; Maalej, A. Numerical Simulation and Experimental Characterization of the Heat Transfer in a PV/T Air Collector Prototype. Case Stud. Therm. Eng. 2021, 27, 101209. [Google Scholar] [CrossRef]
- Erick César, L.-V.; Ana Lilia, C.-M.; Octavio, G.-V.; Isaac, P.F.; Rogelio, B.O. Thermal Performance of a Passive, Mixed-Type Solar Dryer for Tomato Slices (Solanum lycopersicum). Renew. Energy 2020, 147, 845–855. [Google Scholar] [CrossRef]
- Cerezal Mezquita, P.; Álvarez López, A.; Bugueño Muñoz, W. Effect of Drying on Lettuce Leaves Using Indirect Solar Dryer Assisted with Photovoltaic Cells and Thermal Energy Storage. Processes 2020, 8, 168. [Google Scholar] [CrossRef]
- Amer, B.M.A.; Chouikhi, H. Smartphone Application Using a Visual Programming Language to Compute Drying/Solar Drying Characteristics of Agricultural Products. Sustainability 2020, 12, 8148. [Google Scholar] [CrossRef]
- Yuan, Y.; Ma, K.; Xu, Y.; Yang, L.; Li, Y.; Lin, X.; Yuan, Y. Research on Operation Performance of Multi-Heat Source Complementary System of Combined Drying Based on TRNSYS. Renew. Energy 2022, 192, 769–783. [Google Scholar] [CrossRef]
- Amer, B.M.A. Solar Drying: Principles and Applications. In Thermal Food Engineering Operations; John Wiley & Sons, Ltd.: Hoboken, NJ, USA, 2022; pp. 179–196. ISBN 978-1-119-77643-7. [Google Scholar] [CrossRef]
- Salvatierra-Rojas, A.; Ramaj, I.; Romuli, S.; Müller, J. CFD-Simulink Modeling of the Inflatable Solar Dryer for Drying Paddy Rice. Appl. Sci. 2021, 11, 3118. [Google Scholar] [CrossRef]
- Romero, V.M.; Cerezo, E.; Garcia, M.I.; Sanchez, M.H. Simulation and Validation of Vanilla Drying Process in an Indirect Solar Dryer Prototype Using CFD Fluent Program. Energy Procedia 2014, 57, 1651–1658. [Google Scholar] [CrossRef]
- Prakash, O.; Laguri, V.; Pandey, A.; Kumar, A.; Kumar, A. Review on Various Modelling Techniques for the Solar Dryers. Renew. Sustain. Energy Rev. 2016, 62, 396–417. [Google Scholar] [CrossRef]
- Tegenaw, P.D.; Gebrehiwot, M.G.; Vanierschot, M. On the Comparison between Computational Fluid Dynamics (CFD) and Lumped Capacitance Modeling for the Simulation of Transient Heat Transfer in Solar Dryers. Sol. Energy 2019, 184, 417–425. [Google Scholar] [CrossRef]
- Sanghi, A.; Ambrose, R.P.K.; Maier, D. CFD Simulation of Corn Drying in a Natural Convection Solar Dryer. Dry. Technol. 2018, 36, 859–870. [Google Scholar] [CrossRef]
- Iranmanesh, M.; Samimi Akhijahani, H.; Barghi Jahromi, M.S. CFD Modeling and Evaluation the Performance of a Solar Cabinet Dryer Equipped with Evacuated Tube Solar Collector and Thermal Storage System. Renew. Energy 2020, 145, 1192–1213. [Google Scholar] [CrossRef]
- Amer, B.M.A.; Albaloushi, N.S. A Developed Design to Improve the Performance of Solar Dryer Supported by Sensible Heat Storage and Photovoltaic Module for Drying Cantaloupe. Fresenius Environ. Bull. 2021, 30, 2920–2930. [Google Scholar]
- Getahun, E.; Delele, M.A.; Gabbiye, N.; Fanta, S.W.; Demissie, P.; Vanierschot, M. Importance of Integrated CFD and Product Quality Modeling of Solar Dryers for Fruits and Vegetables: A Review. Sol. Energy 2021, 220, 88–110. [Google Scholar] [CrossRef]
- Amanlou, Y.; Zomorodian, A. Applying CFD for Designing a New Fruit Cabinet Dryer. J. Food Eng. 2010, 101, 8–15. [Google Scholar] [CrossRef]
- Sonthikun, S.; Chairat, P.; Fardsin, K.; Kirirat, P.; Kumar, A.; Tekasakul, P. Computational Fluid Dynamic Analysis of Innovative Design of Solar-Biomass Hybrid Dryer: An Experimental Validation. Renew. Energy 2016, 92, 185–191. [Google Scholar] [CrossRef]
- Hussain, F.; Akhtar, I.; Murtaza, G.; Haider, U.; Rukh, L.; Owais, M. Simulation and Performance Evaluation of Solar Tunnel Dryer for Apricot Drying in Northern Pakistan. Int. J. Appl. Sci. Eng. 2021, 9, 1–5. [Google Scholar]
- Benhamza, A.; Boubekri, A.; Atia, A.; Hadibi, T.; Arıcı, M. Drying Uniformity Analysis of an Indirect Solar Dryer Based on Computational Fluid Dynamics and Image Processing. Sustain. Energy Technol. Assess. 2021, 47, 101466. [Google Scholar] [CrossRef]
- Çiftçi, E.; Khanlari, A.; Sözen, A.; Aytaç, İ.; Tuncer, A.D. Energy and Exergy Analysis of a Photovoltaic Thermal (PVT) System Used in Solar Dryer: A Numerical and Experimental Investigation. Renew. Energy 2021, 180, 410–423. [Google Scholar] [CrossRef]
- Touti, E.; Masmali, M.; Fterich, M.; Chouikhi, H. Experimental and Numerical Study of the PVT Design Impact on the Electrical and Thermal Performances. Case Stud. Therm. Eng. 2023, 43, 102732. [Google Scholar] [CrossRef]
- Kong, X.; Zhang, L.; Li, H.; Wang, Y.; Fan, M. Experimental Thermal and Electrical Performance Analysis of a Concentrating Photovoltaic/Thermal System Integrated with Phase Change Material (PV/T-CPCM). Sol. Energy Mater. Sol. Cells 2022, 234, 111415. [Google Scholar] [CrossRef]
- Demissie, P.; Hayelom, M.; Kassaye, A.; Hailesilassie, A.; Gebrehiwot, M.; Vanierschot, M. Design, Development and CFD Modeling of Indirect Solar Food Dryer. Energy Procedia 2019, 158, 1128–1134. [Google Scholar] [CrossRef]
- Amouiri, R.; Belhamri, A. CFD Investigations on the Behavior of a Solar Dryer Used for Medicinal Herbs Dehydration under Climatic Conditions of Constantine, Algeria. Mater. Today Proc. 2022, 51, 2123–2130. [Google Scholar] [CrossRef]
- Babu, A.K.; Kumaresan, G.; Antony Aroul Raj, V.; Velraj, R. CFD Studies on Different Configurations of Drying Chamber for Thin-Layer Drying of Leaves. Energy Sources Part A Recovery Util. Environ. Eff. 2020, 42, 2227–2239. [Google Scholar] [CrossRef]
- Arabhosseini, A.; Samimi-Akhijahani, H.; Motahayyer, M. Increasing the Energy and Exergy Efficiencies of a Collector Using Porous and Recycling System. Renew. Energy 2019, 132, 308–325. [Google Scholar] [CrossRef]
- Madhankumar, S.; Viswanathan, K. Computational and Experimental Study of a Novel Corrugated-Type Absorber Plate Solar Collector with Thermal Energy Storage Moisture Removal Device. Appl. Energy 2022, 324, 119746. [Google Scholar] [CrossRef]
- Das, B.; Mondol, J.D.; Debnath, S.; Pugsley, A.; Smyth, M.; Zacharopoulos, A. Effect of the Absorber Surface Roughness on the Performance of a Solar Air Collector: An Experimental Investigation. Renew. Energy 2020, 152, 567–578. [Google Scholar] [CrossRef]
- Gupta, A.; Biswas, A.; Das, B.; Reddy, B.V. Development and Testing of Novel Photovoltaic-Thermal Collector-Based Solar Dryer for Green Tea Drying Application. Sol. Energy 2022, 231, 1072–1091. [Google Scholar] [CrossRef]
- Sofia Paulino Mendes, A.; Rutgersson, A.; Paulsson, M. Outdoor Environmental Effects on Cleanrooms–A Study from a Swedish Hospital Pharmacy Compounding Unit. Eur. J. Pharm. Biopharm. 2022, 177, 100–106. [Google Scholar] [CrossRef]
- Fterich, M.; Chouikhi, H.; Bentaher, H.; Maalej, A. Experimental Parametric Study of a Mixed-Mode Forced Convection Solar Dryer Equipped with a PV/T Air Collector. Sol. Energy 2018, 171, 751–760. [Google Scholar] [CrossRef]
- Shahsavar, A.; Eisapour, M.; Talebizadehsardari, P. Experimental Evaluation of Novel Photovoltaic/Thermal Systems Using Serpentine Cooling Tubes with Different Cross-Sections of Circular, Triangular and Rectangular. Energy 2020, 208, 118409. [Google Scholar] [CrossRef]
- Arun, K.R.; Srinivas, M.; Saleel, C.A.; Jayaraj, S. Active Drying of Unripened Bananas (Musa Nendra) in a Multi-Tray Mixed-Mode Solar Cabinet Dryer with Backup Energy Storage. Sol. Energy 2019, 188, 1002–1012. [Google Scholar] [CrossRef]
- Simo-Tagne, M.; Ndukwu, M.C.; Zoulalian, A.; Bennamoun, L.; Kifani-Sahban, F.; Rogaume, Y. Numerical Analysis and Validation of a Natural Convection Mix-Mode Solar Dryer for Drying Red Chilli under Variable Conditions. Renew. Energy 2020, 151, 659–673. [Google Scholar] [CrossRef]
- Vijayan, S.; Arjunan, T.V.; Kumar, A. Exergo-Environmental Analysis of an Indirect Forced Convection Solar Dryer for Drying Bitter Gourd Slices. Renew. Energy 2020, 146, 2210–2223. [Google Scholar] [CrossRef]
- Cengel, Y.A. Heat Transfer: A Practical Approach; Mcgraw-Hill: Boston, MA, USA, 2002; ISBN 978-0-07-245893-0. [Google Scholar]
- Khalaji, M.N.; Koca, A.; Kotcioğlu, İ. Investigation of Numerical Analysis Velocity Contours K-ε Model of RNG, Standard and Realizable Turbulence for Different Geometries. Int. J. Innov. Res. Rev. 2019, 3, 29–34. [Google Scholar]
- Alonso García, M.C.; Balenzategui, J.L. Estimation of Photovoltaic Module Yearly Temperature and Performance Based on Nominal Operation Cell Temperature Calculations. Renew. Energy 2004, 29, 1997–2010. [Google Scholar] [CrossRef]
- Kumar, S.; Mullick, S.C. Glass Cover Temperature and Top Heat Loss Coefficient of a Single Glazed Flat Plate Collector with Nearly Vertical Configuration. Ain Shams Eng. J. 2012, 3, 299–304. [Google Scholar] [CrossRef]
- Hussain, M.I.; Kim, J.-T. Performance Evaluation of Photovoltaic/Thermal (PV/T) System Using Different Design Configurations. Sustainability 2020, 12, 9520. [Google Scholar] [CrossRef]
- Fortuin, S.; Hermann, M.; Stryi-Hipp, G.; Nitz, P.; Platzer, W. Hybrid PV-Thermal Collector Development: Concepts, Experiences, Results and Research Needs. Energy Procedia 2014, 48, 37–47. [Google Scholar] [CrossRef]


Disclaimer/Publisher’s Note: The statements, opinions and data contained in all publications are solely those of the individual author(s) and contributor(s) and not of MDPI and/or the editor(s). MDPI and/or the editor(s) disclaim responsibility for any injury to people or property resulting from any ideas, methods, instructions or products referred to in the content. |
© 2023 by the authors. Licensee MDPI, Basel, Switzerland. This article is an open access article distributed under the terms and conditions of the Creative Commons Attribution (CC BY) license (https://creativecommons.org/licenses/by/4.0/).