
GPS Data Analytics for the Assessment of Public City Bus Transportation Service Quality in Bangkok

Abstract
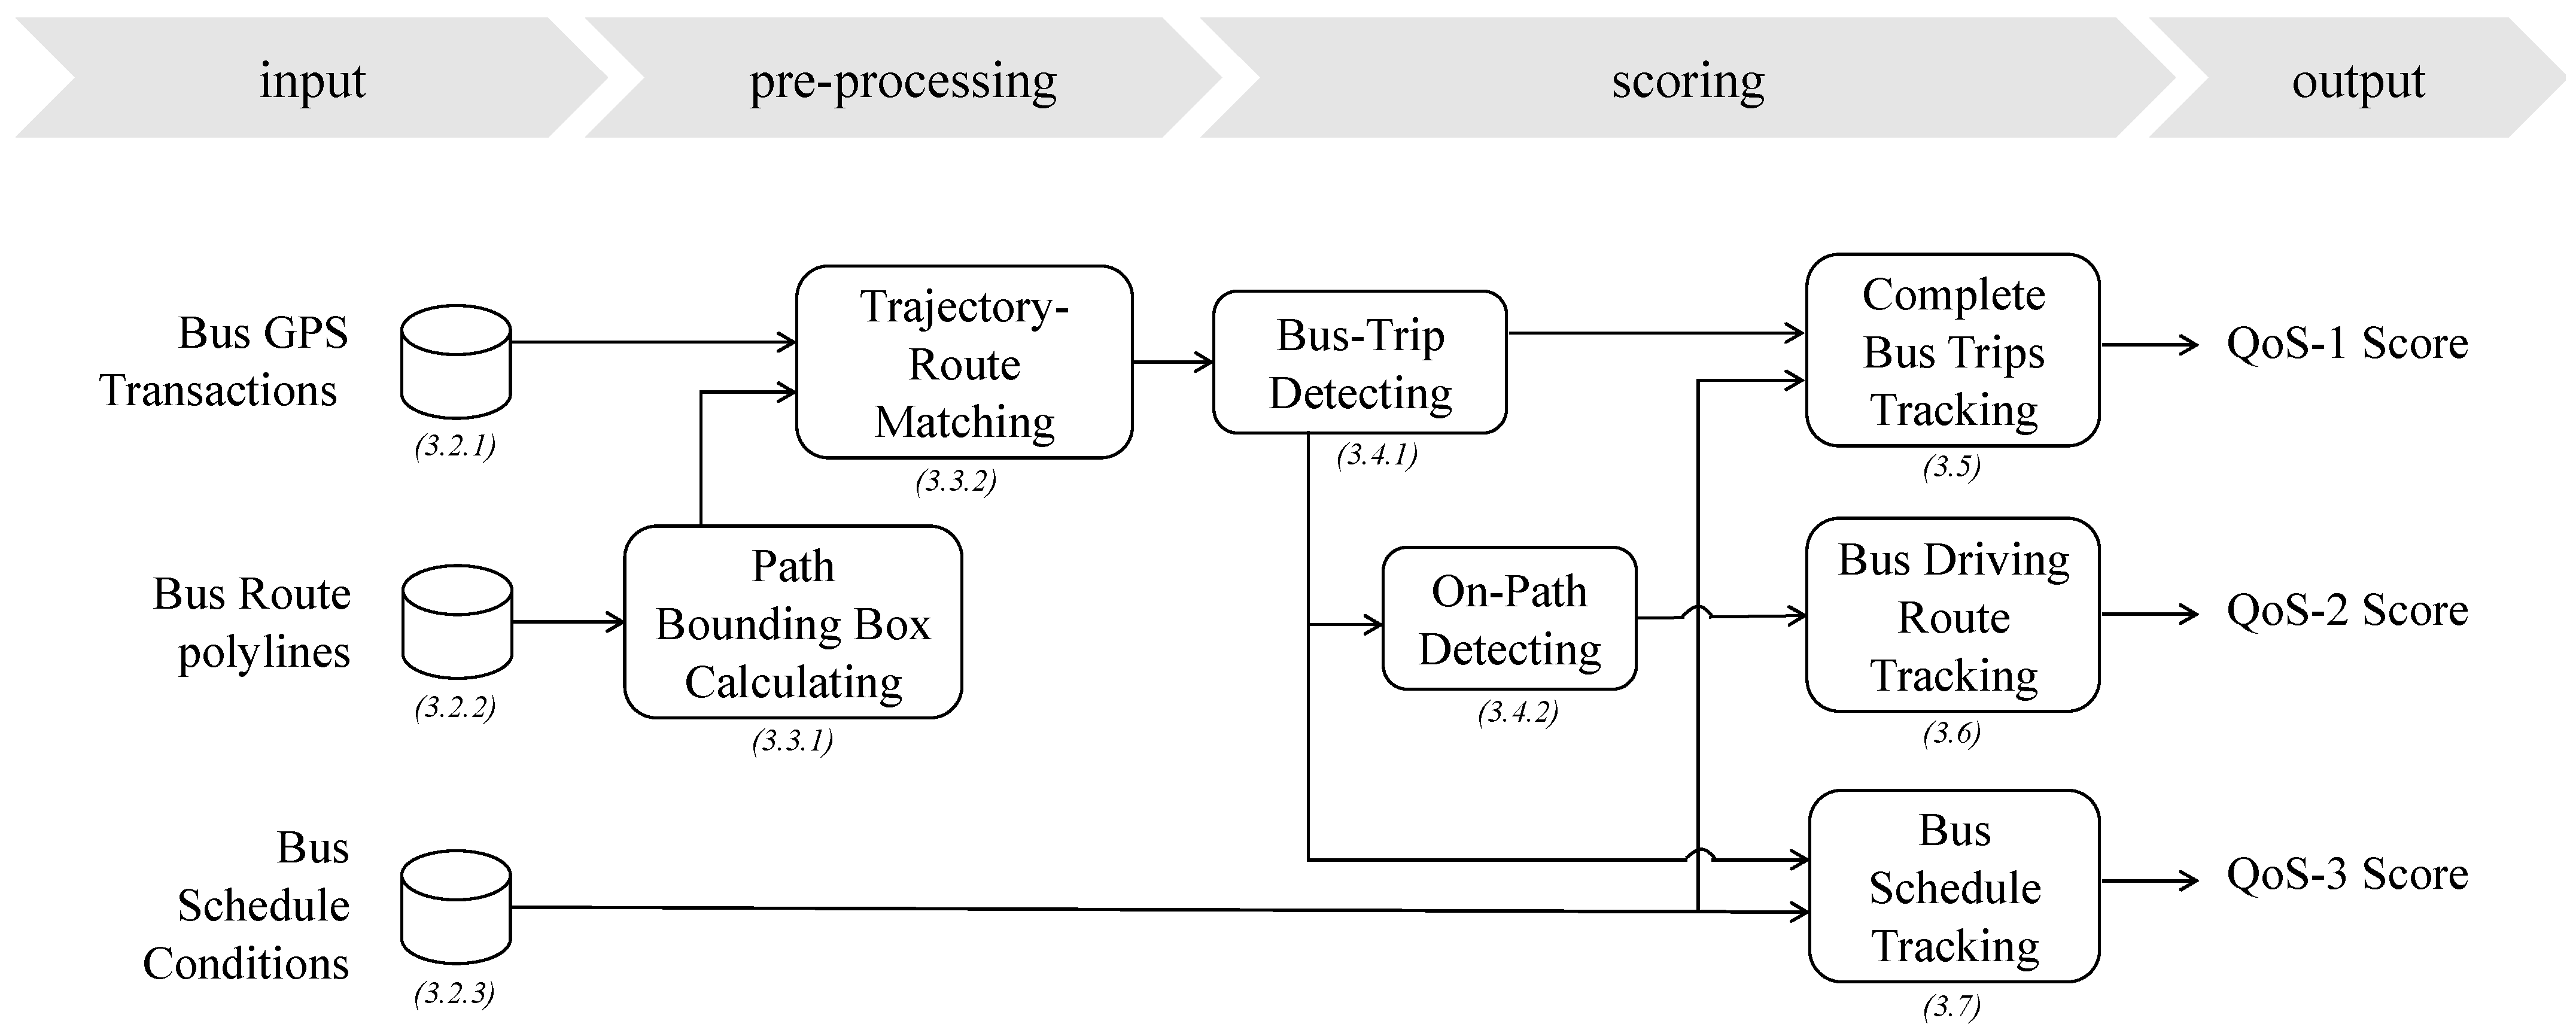
:1. Introduction
- To track complete bus trips based on commitments.
- To track on-path driving following operated routes.
- To track on-schedule operation according to schedule conditions.

| Reference | Year | Summary | Lesson Learned |
|---|---|---|---|
| Shen and Stopher [8] | 2014 | Reviewed the uses of the GPS technology of mobile phones and applications for travel survey from many works. | Survey purposes, samples, and techniques of each work; details of five steps for GPS data processing. |
| Mazloumi et al. [7] | 2010 | Used GPS data to analyze travel time variability against other traffic-related factors. | Some significant factors, such as segment length, off-peak time, etc., contributing to the travel time variability. |
| Gschwendar et al. [9] | 2016 | Used data from smart cards and GPS for analyzing the uses of buses. | The results of travel time, transfer time, number of transfers, and waiting time are beneficial for policy makers. |
| Chan et al. [4] | 2020 | Conducted user surveys before and after installing the GPS system for monitoring buses. | The criteria of accessibility, reliability, comfort, safety, customer satisfaction, and customer loyalty were higher after having the GPS system. |
| Page and Yue [5] | 2009 | Studied the public transportation quality matrix for tourism. | The public transportation matrix, including availability, accessibility, information, time, customer care, comfort, security, and environment, was reviewed. |
| Goyal et al. [6] | 2022 | Proposed multicriteria decision making for finding significant criteria for evaluating the quality of a bus depot. | It results in some important criteria, such as total number of vehicles, scheduled vehicles, operated vehicles, off-road vehicles, etc. |
| Wethyavivorn and Sukwattanakorn [2] | 2019 | Conducted user surveys about travel patterns, modes, and ratings. | There needs to be an improvement in bus frequency, and precise schedules. |
| Ueasangkomsate [3] | 2019 | Conducted user survey about the QoS of public transportations. | Five dimensions, tangibility, reliability, responsiveness, assurance, and access, are analyzed; the improvement of some attributes under these dimensions is required. |
2. Literature Review
2.1. The Uses of GPS Technology for Transportation
2.2. Quality of Service of Bus Transportation
2.3. GPS Coordinates Rounding
3. Materials and Methods
3.1. Definitions
- -
- p (e.g., p1): An original coordinate point that is a relation comprising of latitude and longitude.
- -
- p with a dot (e.g., p1.1): An inner point between original coordinate points.
- -
- p* (e.g., p*1, p*1.1): A rounding box of a coordinate point p.
- -
- p*(x,y) (e.g., p*1(+1,+2)): A neighbor of a p*. For example, if the 2-decimal rounding box p*1 is (13.00, 100.00), the neighbor p*1(+1,+2) is (13.00 + 1 × 0.01, 100.00 + 2 × 0.01) being (13.01, 100.02).
- -
- P (e.g., P1): A path that is a sequence set of p.
- -
- P* (e.g., P1*): A path P whose points are rounded.
- -
- P** (e.g., P1**): A path that contains all neighbors of all coordinate points from P*.
- -
- POR (b*, P**): A function to detect a point of bus (b*) on a path (P**).
3.2. Data Preparation
3.2.1. GPS Transaction Data
3.2.2. Bus Routes Polylines
- -
- route: a route number.
- -
- path_id: a unique identifier of a path.
- -
- path_type: the type of path, that can be main, split, and sub.
- -
- direction: the bus direction of a path, that can be go and back.
- -
- begin_point: the begin point of the polyline.
- -
- end_point: the ending point of the polyline.
- -
- polyline: the sequence set (array) of coordinates.
3.2.3. Bus Schedule Conditions
- -
- con_id: a condition identifier.
- -
- route: a route number.
- -
- path_id: a path id.
- -
- begin_time: the beginning time of that condition.
- -
- end_time: the ending time of that condition.
- -
- con_type: a condition type that can be all trips, count, and headway.
- -
- param: a parameter of that condition.
3.3. Path Rounding Boxes Calculating
3.3.1. GPS Coordinates and Path Rounding Boxes
3.3.2. Trajectory Route Matching
3.4. Bus Trip Calculating
3.4.1. Bus Trip Detection
- -
- The begin point is detected when a bus starts moving out of the rounding boxes area of the begin point, as shown in Figure 7(2). At timestamp t1, a bus is inside the rounding boxes area, while it moves out of the area at the timestamp t2. In this case, t1 is stamped as the time of a bus at the begin point R8190.00.B.
- -
- The end point is detected when a bus starts moving into the rounding boxes area of the end point, as shown in Figure 7(3). At timestamp t9, a bus is entering the rounding boxes area, and it starts inside the area at timestamp t10. In this case, t10 is stamped as the time of a bus at the end point R8190.00.E.
- -
- index: an index, which is a running number, of each entry.
- -
- bid: a bus identifier.
- -
- path_id: a path identifier.
- -
- begin_ts: a begin timestamp when a bus starts moving out from a begin point’s rounding boxes area.
- -
- end_ts: an end timestamp when a bus starts moving into an end point’s rounding boxes area.
- -
- is_full_trip: to check if a trip is a full trip, where 1 is a full trip, otherwise 0.
- -
- on_path: a measurement of a bus driving on a route path. It uses a Jaccard index, which will be described in the next subsection.
3.4.2. On-Path Driving Detection
- -
- True-positive (TP): the distance of a bus driving on a route path.
- -
- False-positive (FP): the distance of a bus driving outside of a route path.
- -
- False-negative (FN): the distance of a route path without a bus driving on it.
3.5. QoS-1 Score: Tracking Complete Trips
3.6. QoS-2 Score: Bus On-Path Driving Tracking
3.7. QoS-3 Score: Bus On-Schedule Operation Tracking
- -
- At index 10, the begin_time is 16:05, which satisfies the condition including error times. Thus, n is 1, and ex_begin_time is 16:05.
- -
- At index 11, the begin_time is 16:35. It differs from the ex_begin_time about 30 min, so n becomes 2, and ex_begin_time becomes 16:35.
- -
- At index 12, the begin_time is 17:20. It differs from the ex_begin_time about 45 min, so this trip is failed. In this case, n is still 2, and ex_begin_time changes into 17:20.
- -
- At index 13, the begin_time is 17:50, and it differs from the previous one about 30 min. Thus, n becomes 3.
4. Results
4.1. Result of Bus QoS scores
4.2. Discussion
5. Conclusions
Author Contributions
Funding
Institutional Review Board Statement
Informed Consent Statement
Data Availability Statement
Conflicts of Interest
References
- Hansson, J.; Pettersson, F.; Svensson, H.; Wretstrand, A. Preferences in regional public transport: A literature review. Eur. Transp. Res. Rev. 2019, 11, 1–16. [Google Scholar]
- Wethyavivorn, P.; Sukwattanakorn, N. Problems and barriers affecting sustainable commuting: Case study of people’s daily commute to Kasetsart University, Bangkok, Thailand. IOP Conf. Ser. Earth Environ. Sci. 2019, 329, 012011. [Google Scholar]
- Ueasangkomsate, P. Service quality of public road passenger transport in Thailand. Kasetsart J. Soc. Sci. 2019, 40, 74–81. [Google Scholar]
- Chan, W.; Ibrahim, W.W.; Lo, M.; Suaidi, M.; Ha, S. Sustainability of public transportation: An examination of user behavior to real-time GPS tracking application. Sustainability 2020, 12, 9541. [Google Scholar]
- Page, S.; Yue, G.G. Transportation and tourism: A symbiotic relationship? In The SAGE Handbook of Tourism Studies; Sage Publications: Thousand Oaks, CA, USA, 2009; pp. 371–395. [Google Scholar]
- Goyal, S.; Agarwal, S.; Singh, N.S.S.; Mathur, T.; Mathur, N. Analysis of Hybrid MCDM Methods for the Performance Assessment and Ranking Public Transport Sector: A Case Study. Sustainability 2022, 14, 15110. [Google Scholar]
- Mazloumi, E.; Currie, G.; Rose, G. Using GPS data to gain insight into public transport travel time variability. J. Transp. Eng. 2010, 136, 623–631. [Google Scholar] [CrossRef]
- Shen, L.; Stopher, P.R. Review of GPS travel survey and GPS data-processing methods. Transp. Rev. 2014, 34, 316–334. [Google Scholar]
- Gschwender, A.; Munizaga, M.; Simonetti, C. Using smart card and GPS data for policy and planning: The case of Transantiago. Res. Transp. Econ. 2016, 59, 242–249. [Google Scholar] [CrossRef]
- Liu, Q.; Liu, Z.; Kang, T.; Zhu, L.; Zhao, P. Transport inequities through the lens of environmental racism: Rural-urban migrants under Covid-19. Transp. Policy 2022, 122, 26–38. [Google Scholar]
- Chawuthai, R.; Pruekwangkhao, K.; Threepak, T. Spatial-Temporal Traffic Speed Prediction on Thailand Roads. In Proceedings of the 7th International Conference on Engineering, Applied Sciences and Technology, Pattaya, Thailand, 1–3 April 2021; pp. 58–62. [Google Scholar]
- Chawuthai, R.; Chankaew, N.; Threepak, T. A Hybrid Method for Predicting a Potential Next Rest Stop of Commercial Vehicles. Transp. Res. Procedia 2018, 34, 36–43. [Google Scholar] [CrossRef]
- Chawuthai, R.; Ainthong, N.; Intarawart, S.; Boonyanaet, N.; Sumalee, A. Travel Time Prediction on Long-Distance Road Segments in Thailand. Appl. Sci. 2022, 12, 5681. [Google Scholar]
- Chawuthai, R. Monitoring roadway lights and pavement defects for nighttime street safety assessment by sensor data analysis and visualization. Sens. Mater. 2018, 30, 2267–2279. [Google Scholar] [CrossRef]
- SL, A.H.; Samsudeen, S.N. Real time bus tracking and scheduling system using wireless sensor and mobile technology. J. Inf. Syst. Inf. Technol. 2016, 1, 18–23. [Google Scholar]
- Kamble, P.A.; Vatti, R.A. Bus tracking and monitoring using RFID. In Proceedings of the 2017 Fourth International Conference on Image Information Processing, Shimla, India, 21–23 December 2017; pp. 1–6. [Google Scholar]
- Huang, S.-H.; Lin, C.-S. Rapid Route Comparison Based on GPS Coordinates and Bounding Boxes. J. Traffic Logist. Eng. 2019, 7, 5–9. [Google Scholar] [CrossRef]
- Elevelt, A.; Bernasco, W.; Lugtig, P.; Ruiter, S.; Toepoel, V.; Ruiter, B.M.S. Where you at? Using GPS locations in an electronic time use diary study to derive functional locations. Soc. Sci. Comput. Rev. 2021, 39, 509–526. [Google Scholar] [CrossRef]
- Ciociola, A.; Cocca, M.; Giordano, D.; Vassio, L.; Mellia, M. E-scooter sharing: Leveraging open data for system design. In Proceedings of the 2020 IEEE/ACM 24th International Symposium on Distributed Simulation and Real Time Applications (DS-RT), Prague, Czech Republic, 14–16 September 2020; pp. 1–8. [Google Scholar]
- Payyanadan, R.P.; Sanchez, F.A.L.; Lee, J.D. Assessing route choice to mitigate older driver risk. IEEE Trans. Intell. Transp. Syst. 2016, 18, 527–536. [Google Scholar]
- Yang, J.; Rahardja, S.; Fränti, P. Outlier detection: How to threshold outlier scores? In Proceedings of the International Conference on Artificial Intelligence, Information Processing and Cloud Computing, Sanya, China, 19–21 December 2019; pp. 1–6. [Google Scholar]
- Rilett, L.R.; Tufuor, E.; Murphy, S. Arterial roadway travel time reliability and the COVID-19 pandemic. J. Transp. Eng. Part A Syst. 2021, 147, 04021034. [Google Scholar]
- Soza-Parra, J.; Raveau, S.; Muñoz, J.C.; Cats, O. The underlying effect of public transport reliability on users’ satisfaction. Transp. Res. Part A Policy Pract. 2019, 126, 83–93. [Google Scholar]
- Xiaoliang, Z.; Limin, J. Analysis of Bus Line Operation Reliability Based on Copula Function. Sustainability 2021, 13, 8419. [Google Scholar]
- Liu, Q.; An, Z.; Liu, Y.; Ying, W.; Zhao, P. Smartphone-based services, perceived accessibility, and transport inequity during the COVID-19 pandemic: A cross-lagged panel study. Transp. Res. Part D Transp. Environ. 2021, 97, 102941. [Google Scholar]
- Curl, A.; Nelson, J.D.; Anable, J. Does accessibility planning address what matters? A review of current practice and practitioner perspectives. Res. Transp. Bus. Manag. 2011, 2, 3–11. [Google Scholar] [CrossRef] [Green Version]
- Leng, N.; Corman, F. The role of information availability to passengers in public transport disruptions: An agent-based simulation approach. Transp. Res. Part A Policy Pract. 2020, 133, 214–236. [Google Scholar]
- Vdovychenko, V.; Ivanov, I.; Pidlubnyi, S. Assessment of the impact of traffic conditions on the availability of transport services of the city bus route. Technol. Audit. Prod. Reserves 2022, 3, 45–50. [Google Scholar]
- Ľupták, V.; Droździel, P.; Stopka, O.; Stopková, M.; Rybicka, I. Approach methodology for comprehensive assessing the public passenger transport timetable performances at a regional scale. Sustainability 2019, 11, 3532. [Google Scholar]
- Zhang, H.; Cui, H.; Shi, B. A data-driven analysis for operational vehicle performance of public transport network. IEEE Access 2019, 7, 96404–96413. [Google Scholar] [CrossRef]
- Zhu, H.; Wu, Y.; Wang, Y. Algorithm for Headway of Fixed Route Buses in Bus Stations Based on Bus Big Data. In Proceedings of the 6th International Conference on Transportation Information and Safety, Wuhan, China, 22–24 October 2021; pp. 28–33. [Google Scholar]


| Bid | Route | Ts | Lat | Lon | Speed |
|---|---|---|---|---|---|
| 8ead83c5 | R7234 | 2021-10-20 09:39:21 | 13.729222 | 100.641610 | 33 |
| 8ead83c5 | R7234 | 2021-10-20 09:40:36 | 13.721500 | 100.642138 | 31 |
| 8ead83c5 | R7234 | 2021-10-20 09:41:36 | 13.713388 | 100.643667 | 63 |
| 8ead83c5 | R7234 | 2021-10-20 09:42:21 | 13.709083 | 100.644722 | 57 |
| 8ead83c5 | R7234 | 2021-10-20 09:42:36 | 13.706860 | 100.645250 | 51 |
| … | … | … | … | … |
| route | path_id | path_type | direction | begin_point | end_point | polyline |
|---|---|---|---|---|---|---|
| R7234 | R7234.00 | Main | go | (13.81196, 100.54976) | (13.59013, 100.59738) | [(13.81196, 100.54976), (13.81106, 100.54943),... |
| R7234 | R7234.01 | Split | go | (13.76977, 100.64184) | (13.60081, 100.74983) | [(13.76977, 100.64184), (13.76865, 100.64196),... |
| R7234 | R7234.02 | Split | back | (13.60081, 100.74983) | (13.76977, 100.64184) | [(13.60081, 100.74983), (13.60068, 100.74984),... |
| R7234 | R7234.03 | Sub | go | (13.76977, 100.64184) | (13.59004, 100.59742) | [(13.76977, 100.64184), (13.76946, 100.64187),... |
| R7234 | R7234.04 | Sub | back | (13.59004, 100.59742) | (13.76977, 100.64184) | [(13.59004, 100.59742), (13.59013, 100.59738),... |
| R8190 | R8190.00 | Main | go | (13.74004, 100.49846) | (13.82723, 100.73943) | [(13.74004, 100.49846), (13.74012, 100.49822),... |
| R8190 | R8190.01 | Main | back | (13.82723, 100.73943) | (13.74004, 100.49846) | [(13.82723, 100.73943), (13.82581, 100.74775),... |
| … | … | … | … | … | … | … |
| con_id | route | path_id | begin_time | end_time | con_type | param |
|---|---|---|---|---|---|---|
| C0001 | R7234 | R7234.00 | 05:00 | 21:00 | all-trips | 50 |
| C0002 | R7234 | R7234.00 | 05:00 | 21:00 | count | 50 |
| C0003 | R7234 | R7234.00 | 06:00 | 09:00 | headway | 18 |
| C0004 | R7234 | R7234.00 | 15:00 | 18:00 | headway | 10 |
| C0005 | R7234 | R7234.01 | 05:00 | 21:00 | all-trips | 15 |
| C0006 | R7234 | R7234.01 | 05:00 | 21:00 | count | 15 |
| C0007 | R7234 | R7234.02 | 05:00 | 21:00 | all-trips | 15 |
| C0008 | R7234 | R7234.02 | 05:00 | 21:00 | count | 15 |
| C0009 | R7234 | R7234.03 | 06:00 | 10:00 | all-trips | 60 |
| C0010 | R7234 | R7234.03 | 06:00 | 10:00 | headway | 10 |
| C0011 | R7234 | R7234.04 | 06:00 | 10:00 | all-trips | 60 |
| C0012 | R7234 | R7234.04 | 06:00 | 10:00 | headway | 10 |
| C0013 | R8190 | R8190.00 | 11:00 | 18:00 | all-trips | 10 |
| C0014 | R8190 | R8190.00 | 11:00 | 12:00 | count | 5 |
| C0015 | R8190 | R8190.00 | 16:00 | 18:00 | headway | 30 |
| … | … | … | … | … | … | … |
| route | path_id | path_type | direction | begin_point (Rounding Boxes) | end_point (Rounding Boxes) | polyline (Rounding Boxes) |
|---|---|---|---|---|---|---|
| R7234 | R7234.00 | main | go | R7234.00.B** | R7234.00.E** | R7234.00** |
| R7234 | R7234.01 | split | go | R7234.01.B** | R7234.01.E** | R7234.01** |
| R7234 | R7234.02 | split | back | R7234.02.B** | R7234.02.E** | R7234.02** |
| R7234 | R7234.03 | sub | go | R7234.03.B** | R7234.03.E** | R7234.03** |
| R7234 | R7234.04 | sub | back | R7234.04.B** | R7234.04.E** | R7234.04** |
| R8190 | R8190.00 | main | go | R8190.00.B** | R8190.00.E** | R8190.00** |
| R8190 | R8190.01 | main | back | R8190.01.B** | R8190.01.E** | R8190.01** |
| … | … | … | … | … | … | … |
| Index | bid | path_id | begin_ts | end_ts | is_full_trip | on_path |
|---|---|---|---|---|---|---|
| 1 | 4d43e028 | R8190.00 | 2021-10-01 10:10:00 | 2021-10-01 12:12:00 | 1 | 0.85 |
| 2 | f03235d3 | R8190.00 | 2021-10-01 10:40:00 | 2021-10-01 12:41:00 | 1 | 0.85 |
| 3 | 12ec22a7 | R8190.00 | 2021-10-01 11:05:00 | 2021-10-01 13:07:00 | 0 | 0.50 |
| 4 | 23731bd3 | R8190.00 | 2021-10-01 11:20:00 | 2021-10-01 13:22:00 | 1 | 0.95 |
| 5 | 512e06ff | R8190.00 | 2021-10-01 11:25:00 | 2021-10-01 13:28:00 | 1 | 0.90 |
| 6 | 0a4fd2f5 | R8190.00 | 2021-10-01 11:50:00 | 2021-10-01 13:52:00 | 0 | 0.60 |
| 7 | 1b43575e | R8190.00 | 2021-10-01 12:15:00 | 2021-10-01 14:14:00 | 1 | 0.85 |
| 8 | 512e06ff | R8190.00 | 2021-10-01 13:50:00 | 2021-10-01 15:56:00 | 1 | 0.70 |
| 9 | 076fde6b | R8190.00 | 2021-10-01 15:40:00 | 2021-10-01 17:49:00 | 1 | 0.90 |
| 10 | 12ec22a7 | R8190.00 | 2021-10-01 16:05:00 | 2021-10-01 18:06:00 | 1 | 0.95 |
| 11 | 23731bd3 | R8190.00 | 2021-10-01 16:35:00 | 2021-10-01 18:33:00 | 0 | 0.70 |
| 12 | 4d43e028 | R8190.00 | 2021-10-01 17:20:00 | 2021-10-01 19:21:00 | 1 | 0.95 |
| 13 | 23731bd3 | R8190.00 | 2021-10-01 17:50:00 | 2021-10-01 19:52:00 | 1 | 0.90 |
| 14 | f03235d3 | R8190.00 | 2021-10-01 18:20:00 | 2021-10-01 20:27:00 | 1 | 0.85 |
| Route | Date | QoS_1 | QoS_2 | QoS_3 |
|---|---|---|---|---|
| R8190 | 2021-10-01 | 0.92 | 0.83 | 0.70 |
| Route | Date | QoS_1 | QoS_2 | QoS_3 |
|---|---|---|---|---|
| R7234 | 2021-10-01 | 0.83 | 0.85 | 0.72 |
| R7234 | 2021-10-02 | 0.78 | 0.73 | 0.76 |
| R7234 | 2021-10-03 | 0.77 | 0.80 | 0.83 |
| R7234 | 2021-10-04 | 0.83 | 0.86 | 0.68 |
| R7234 | 2021-10-05 | 0.81 | 0.74 | 0.73 |
| R7234 | 2021-10-06 | 0.92 | 0.75 | 0.82 |
| R7234 | 2021-10-07 | 0.84 | 0.87 | 0.68 |
| R7234 | 2021-10-08 | 0.83 | 0.76 | 0.80 |
| … | … | … | … | |
| R7234 | 2021-12-28 | 0.77 | 0.91 | 0.81 |
| R7234 | 2021-12-29 | 0.75 | 0.83 | 0.67 |
| R7234 | 2021-12-30 | 0.76 | 0.74 | 0.82 |
| R7234 | 2021-12-31 | 0.64 | 0.82 | 0.83 |
| Route | Month | QoS_1 | QoS_2 | QoS_3 |
|---|---|---|---|---|
| R7234 | 2021-10 | 0.86 | 0.83 | 0.73 |
| 2021-11 | 0.75 | 0.94 | 0.81 | |
| 2021-12 | 0.69 | 0.87 | 0.75 | |
| R7731 | 2021-10 | 0.71 | 0.89 | 0.72 |
| 2021-11 | 0.65 | 0.93 | 0.85 | |
| 2021-12 | 0.73 | 0.91 | 0.74 | |
| R8196 | 2021-10 | 0.69 | 0.88 | 0.76 |
| 2021-11 | 0.87 | 0.90 | 0.91 | |
| 2021-12 | 0.68 | 0.84 | 0.67 | |
| R8630 | 2021-10 | 0.73 | 0.87 | 0.75 |
| 2021-11 | 0.75 | 0.83 | 0.89 | |
| 2021-12 | 0.71 | 0.83 | 0.72 |
| Rating Label | Score Range | Number of City Bus Routes | ||
|---|---|---|---|---|
| QoS_1 | QoS_2 | QoS_3 | ||
| High | 90–100 | 313 | 315 | 417 |
| Medium | 80–90 | 10 | 37 | 14 |
| Low | 60–80 | 40 | 66 | 9 |
| Lower | 0–60 | 91 | 36 | 14 |
Disclaimer/Publisher’s Note: The statements, opinions and data contained in all publications are solely those of the individual author(s) and contributor(s) and not of MDPI and/or the editor(s). MDPI and/or the editor(s) disclaim responsibility for any injury to people or property resulting from any ideas, methods, instructions or products referred to in the content. |
© 2023 by the authors. Licensee MDPI, Basel, Switzerland. This article is an open access article distributed under the terms and conditions of the Creative Commons Attribution (CC BY) license (https://creativecommons.org/licenses/by/4.0/).
Share and Cite
Chawuthai, R.; Sumalee, A.; Threepak, T. GPS Data Analytics for the Assessment of Public City Bus Transportation Service Quality in Bangkok. Sustainability 2023, 15, 5618. https://doi.org/10.3390/su15075618
Chawuthai R, Sumalee A, Threepak T. GPS Data Analytics for the Assessment of Public City Bus Transportation Service Quality in Bangkok. Sustainability. 2023; 15(7):5618. https://doi.org/10.3390/su15075618
Chicago/Turabian StyleChawuthai, Rathachai, Agachai Sumalee, and Thanunchai Threepak. 2023. "GPS Data Analytics for the Assessment of Public City Bus Transportation Service Quality in Bangkok" Sustainability 15, no. 7: 5618. https://doi.org/10.3390/su15075618