Abstract
Arable land is the natural resource of food production, plays a key role in safe guarding people’s livelihood, maintaining social stability, and ecological balance. In the context of the great challenge of rapid loss of arable land and rapid growth of food demand due to rapid socio-economic development, scientific forecasting of arable land demand and supply, can clarify the conservation pressure of regional arable land, provide a reference for formulating effective arable land policies, and ensuring regional food security and sustainable development. Therefore, with the help of system dynamics model and Gray-Markov model, this study predicts and analyzes the balance of arable land supply and demand in China, and reached the following conclusions. (1) During the projection period, with the continuous development of living standards and agricultural technology, both per capita food demand and food production show an upward trend. However, the combined effects of changes in diet structure and grain yields on changes in arable land demand are smaller than those brought about by population changes. Therefore, the trend of arable land demand is similar to that of population change, and the arable land demand in China reaches a peak of 112.78 million hm2 in 2026. (2) The amount of arable land possession is always greater than the amount of arable land replenishment, and the arable land supply area shows a continuous decreasing trend, and the arable land supply in China is 127.16 million hm2 in 2035. (3) China’s supply holdings are all able to meet the demand of China’s arable land, but combined with existing studies, it is insufficient to meet the demand of crop rotation fallow between 2023 and 2030, which is not conducive to sustainable development. In the future, arable land protection policies should be comprehensively improved and strictly implemented to ensure national food security and achieve sustainable use of arable land.
1. Introduction
Since 1960, world population growth and rising living standards have increased global food demand by approximately twofold [1,2]. Despite significant increases in food production capacity, there are still about 900 million people who do not have access to sufficient protein and energy in their diets [3], 53 countries are experiencing severe food crises [4]. Coupled with global climate change could exacerbate the food crisis [5], food security is one of the most pressing challenges facing humanity in the 21st century. Food security at the national level is the availability of national food. National food access includes both domestic food production and international trade [6,7]. Owing to the risks associated with food supply and its price volatility, almost all countries in the world are on a consensus to achieve food security based on domestic food production [8,9]. At the same time national food self-sufficiency can shorten the food supply chain, reduce transportation, and ease environmental pressure [10]. The food production capacity of a country depends on the quantity and quality of its arable land resources [11]. Therefore, predicting a country’s future arable land holdings and demand can clarify a country’s arable land conservation pressure. It is essential for formulating effective arable land conservation policies to ensure its food security and sustainable development.
The overall quality of China’s arable land is not high and the reserve resources are insufficient [12]. China’s per capita arable land area was less than 0.10 hm2, far below the world average. Moreover, China is in a phase of rapid urbanization and industrialization [8], which will inevitably lead to a large amount of arable land being occupied by construction land [13,14]. For this reason, China has implemented the arable land protection system with the “balance of arable land occupation and replenishment” at the core, and has made sound achievements [15]. However, the situation of arable land loss is remains severe, with a cumulative reduction of 7.25 million hm2 from 2001 to 2017. As the county with the largest population in the world, China supports 20.31% of the world’s population with a mere 8.40% of the world’s arable land [16,17]. China’s food security is not only significant to economic development and social stability, but also important to global food patterns [18,19]. Analysis of the balance between supply and demand of arable land in China is important to ensure global food security and sustainable development.
The current analysis of the balance between arable land supply and demand are focuses on the following three aspects. The first aspect is the demand forecast for arable land. Existing studies are mainly analyzing the changes in population, food production and diet structure. Then, forecast the respective possible changes in the future and accordingly forecast the arable land demand in different possible situations [20,21,22,23,24,25]. The second aspect is the analysis of the spatial and temporal evolution characteristics of arable land use and then simulate the future [26]. The existing models commonly used to predict future cropland holdings are Gray-Markov model [26,27], SAR model [28], BP neural network [29], cellular automata model [30,31] and CLUE-S [32]. Some studies have combined the above two aspects, the surplus and margin of arable land resources was measured from the perspective of food security [12,33].
Numerous scholars have done rich research on the supply and demand of arable land, which provides a reference for this paper. In terms of arable land demand forecasting, it can be concluded from the existing studies that factors such as population, food production and diet structure are the main factors influencing the change in arable land demand [33,34]. Existing articles also mainly set fixed rates of change for population, food production capacity, diet structure and their related influencing variables to predict future arable land demand. However, the change rates of population, food production capacity, diet structure and their related influencing variables are dynamic with socio-economic development. The prediction results achieved by setting fixed rates of change can deviate significantly from the actual situation. In terms of predicting arable land holdings, the arable land area published in China’s second national land survey differs significantly from the data changed in the first national land survey [12]. Therefore, there are fewer studies on the prediction of arable land holdings at the overall level in China. Based on the above analysis, this paper attempts to borrow system dynamics model to forecast the demand for arable land in China, a country with many people and little arable land. The system dynamics model can predict China’s arable land demand more accurately by considering the dynamic changes of population, food production capacity, diet structure and its related variables. At the same time, Gray-Markov model is used to predict and analyze the arable land occupation in China by combining the data of arable land reduction and replenishment in China over the years, and the future arable land supply in China is calculated by combining the existing arable land area in China. By comparing the gap between the demand and supply of arable land in China in the future, we try to figure out whether the supply of arable land in China can meet the demand and provide relevant suggestions for arable land conservation.
2. Data and Methods
2.1. Data Sources
To estimate the demand and holding of arable land in China for the next 15 years, the research data in this study primarily include data from the following aspects. Population data such as birth rate, death rate, age structure, were primarily obtained from the China Population Census database, China Statistical Yearbook, China Health, and Health Statistical Yearbook. The areas of various types of arable land transferred out and transferred in were obtained from the China Land Resources Bulletin, China Land and Resources Statistical Yearbook, and China Rural Statistical Yearbook. Grain data were obtained from China Grain Development Report, National Agricultural Product Cost–Benefit Data Compilation, China Statistical Yearbook, National Grassland Monitoring Report, and White Paper on Food Security in China. Other data such as the number of graduate students, the number of married couples registered, per capita education expenditure, and per capita disposable income were garnered from Educational Statistics Yearbook of China, China Civil Affairs’s Statistical Yearbook, and China Statistical Yearbook, respectively. Given the availability of data, Hong Kong, Macao and Taiwan are not considered in this paper.
2.2. Methods
2.2.1. System Dynamics Model
System dynamics was proposed by Professor J. W. Forrester of Massachusetts Institute of Technology in 1956. It is a discipline that quantitatively studies nonlinear, high-order, multi-feedback complex systems based on theories related to cybernetics, information theory, and decision theory, and with computer simulation techniques as means [35,36]. The demand for arable land is influenced by the regional population, per capita food demand, food yield, the replanting index of arable land, and the grain-to-crop ratio [25]. It has been used to forecast resource demand, economic development, food demand, etc. [25,37,38] The variables such as population, per capita food demand, and food yield are driven by their related subvariables, and there is some mutual feedback effect of each variable among each and influencing factors. The use of a system dynamics model allows the dynamics of the variables and their associated drivers to be taken into account in an integrated manner, and the prediction results may be more satisfying. The model was run for 2001–2035. Specifically, 2001–2020 was the reference and validation period for the model simulation, which provides a reference for the rationality and accuracy of the model simulation, while 2021–2035 was the forecast period for arable land demand. The system dynamics model of arable land demand was constructed and the variables of interest were determined as follows.
We constructed a model of arable land demand forecasting system based on the structure and function of the determinants of the arable land demand system, in order to forecast the arable land demand in China in the context of ensuring food security (Figure 1). The model consists of three subsystems: population development subsystem, per capita food demand subsystem, and the grain yield subsystem. The total regional food demand is divided by the food production capacity per unit of arable land area to get the area of arable land demand. Of course, it is also necessary to consider the replanting index of arable land and the proportion of arable land used for growing food crops. Therefore, the arable land demand forecast formula in this paper is as follows.
where denotes the minimum area of arable land demanded in year x + t, x represents the base year, and t is the difference between the forecast year and the base year. denotes the food self-sufficiency rate in year x + t; represents the total population in year x + t. is the per capita food demand in year x + t; is the food production per unit area in year x + t; is the grain-to-crop ratio in year x + t; is the replanting index in year x + t.
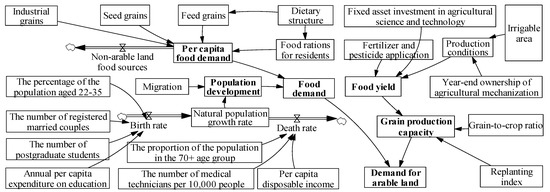
Figure 1.
Regulatory map of arable land demand system.
- Population development subsystem
Regional population change mainly contains two parts: natural population growth and population migration, and the direction and intensity of their effects together determine the direction of population change in a region. The natural population growth is mainly influenced by the birth rate and the death rate of the population, and the combination of the above factors can better predict the total population in different future periods with the following formula.
where denotes the birth rate in year x + t; represents the population mortality rate in year x + t; is the Chinese population migrating abroad in year x + t; is the overseas population migrating to China in year x + t.
Birth and death rates are closely related to local fertility and marriage attitudes, regional policies, medical conditions, and other factors [39]. In recent years, as China’s economy has grown, the cost of raising children has also risen, which has led to a steady decline in the willingness of Chinese families to have children [40]. With the increase in the number of young Chinese individuals that have received higher education, it has become increasingly evident that young Chinese individuals are marrying and having children at an older age [41]. The number of registered married couples and the proportion of the population of childbearing age have a key impact on the birth rate of the population [42]. Therefore, in this study, we selected the variables of per capita disposable income (), the number of registered married couples (), the number of postgraduate students (), the percentage of the population aged 22–35 (), and per capita education expenditure () as variables of interest to predict the fertility rate in China. Mortality in China is also affected by the quality of life of the population, medical technology, and population aging [43,44]. Therefore, in this study, , the number of medical technicians per 10,000 people (), and the proportion of the population in the 70 + age group () were selected as variables of interest to predict future population mortality in China. The increase in the depth and breadth of China’s participation in the globalization process has made China an increasingly attractive destination country for migrants. Meanwhile, the cross-border reverse and circular flows of Chinese citizens have become increasingly diverse in recent years; thus, migration is a key variable influencing demographic change [45] (Table 1, Table 2 and Table 3).

Table 1.
Equations for calculating population development variables.
Table 2.
Equations for calculating per capita food demand variables.
Table 3.
Equations for calculating variables related to grain yields.
- 2.
- Per capita food demand subsystem
Food consumption demand is primarily composed of two parts: food for living and food for production. The former is primarily for food rations for residents, while the latter primarily includes feed grains, industrial grains, and seed grains. With the change of residents’ income, living standards, and population age structure, the dietary structure will change accordingly [47,48]. As a result, the direct consumption of food rations for residents will exhibit a decreasing trend, while the consumption of meat, eggs, milk, and aquatic products will exhibit a continuous growth trend. Because industrial food and the level of industrial development is closely related, in the future, industrial food demand will grow along with the development of industry. The changes in multiple factors imply that the structure of demand for food will change dramatically in the new era. The formula for forecasting food demand is as follows:
where , , , represent food rations for residents, feed grains, industrial grains, and seed grains, respectively. represents meat, egg, and milk consumption, represents the corresponding food conversion factor, represents the ratio of edible food, and represents losses in the process.
- 3.
- Food yield subsystem
The quality of arable land, degree of mechanizable cultivation, and degree of irrigatability are factors directly affecting the planting and growth of crops, which will directly affect the yield of crops. Moreover, fertilizers and pesticides are the “food” of food, and the amount of fertilizers and pesticides applied is significantly related to the yield of food crops. Advancements in agricultural science and technology in the broad sense, including crop breeding, technology diffusion, and application, are also instrumental in improving grain yields. Thus, in this study, we selected four variables, namely, year-end ownership of agricultural mechanization, fertilizer and pesticide application, irrigable area, and fixed asset investment in agricultural science and technology, as the variables of interest to predict future grain yields in China.
- 4.
- Settings of other parameters
Grain-to-crop ratio is mainly predicted by analyzing changes in the grain-to-crop ratio in the past years, in combination with relevant industrial planning, agricultural restructuring, market demand, and other factors. China’s Grain-to-crop ratio decreased from 0.69 in 2000 to 0.65 in 2003, then increased to 0.69 in 2006, and has since remained stable. Owing to the importance attached to the use of arable land for non-farming purposes, China’s grain-to-crop ratio will gradually decrease as the agricultural structure rationalizes in the future. Thus, in this study, we set a stable grain-to-crop ratio of 0.69 for 2020–2035. Replanting index was primarily predicted by analyzing changes in the replanting index in the past years in combination with changes in climate, agricultural restructuring, cropping systems, production technology, and other factors. Replanting index fluctuated at approximately 1.20 from 2000 to 2006. It exhibited a slow upward trend, stabilized at approximately 1.30 from 2007 to 2013, and then declined to 1.23 in 2015. In this study, we set the future replanting index at 1.21, considering all policies and the implementation of a crop rotation fallow system.
2.2.2. Gray-Markov Model
The future supply area of arable land in China is equal to the existing area of arable land minus the area of arable land lost. The area of arable land lost is equal to the difference between the area of arable land converted to other land and the area of other land converted to arable land. There are numerous drivers of interconversion between arable land and other types of land in China. Economic growth and urbanization are considered to be one of the most important drivers of arable land loss in China [49], with both economic development and urbanization leading to the conversion of significant amounts of arable land into urban construction land. China is also one of the countries with severe desertification and natural disasters, which cause a substantial amount of arable land to be degraded to wasteland every year [7]. To alleviate the deterioration of the natural environment, China has implemented the project of “returning farmland to forest and grass”, converting arable land with steep slopes of 25 degrees or more into forest or grass land [50]. In recent years, in order to promote the development of rural industries and achieve rural revitalization, agricultural restructuring has also led to changes in land use. To curb the loss of arable land, China has put forward the arable land protection policy of “balance of occupation and compensation”, which makes an entity occupying arable land responsible for replenishing arable land of the same quantity and quality as the arable land it occupies [51]. In summary, the main ways of converting arable land out are construction land occupation, disaster destruction, returning farmland to forest, and agricultural restructuring, while the main way of replenishing arable land is “balance of land occupation and replenishment”.
Equidistant observations are used in Gray-Markov model to predict systems with uncertain factors [52,53]. Using the transfer-out data and transfer-in data of various types of arable land in China from 2001 to 2017 as basic data, a gray model was used to predict the future transfer-out and transfer-in of arable land in China. By subtracting the future amount of arable land change from the existing arable land holdings in China, the future arable land holdings can be obtained. The difference between the data of China’s second national land survey and the change data of the first national land survey and other external factors are avoided. The basic modeling steps are as follows.
- Construct the original data sequence. Let X(0)(1), X(0)(2), ..., X(0)(x) be the original data of the index to be predicted.
X(0) = {X(0)(1), X(0) (2), ..., X(0) (x)}.
- 2.
- Accumulate the original data. To reduce the randomness of the original series, we processed the original data sequence for cumulative generation to obtain new series.
X(1) = {X(1)(1), X(1)(2), … , X(1)(n)}.
- 3.
- Construct accumulation matrix B and column vector Y.
Y = [X(0)(2), X(0)(3), …, X(0)(n)]T
- 4.
- The differential equation for Gray-Markov model is .
- 5.
- Derive the values of parameters a and b. The values were fitted using the least squares.
[a b]T = (BTB)−1BTY
- 6.
- Construct the Gray-Markov model time response function.
X(1)(t + 1) = [X(0)(1) − b/a]e−at + b/a
- 7.
- Solve the original series x(0) time-response function. The cumulative reduction of the above was performed to derive the reduced value of the original number.
X(0)(t + 1) = X(1)(t + 1) − X(1)(t) = (1 − ea)[X(0)(t + 1) − b/a]e−at
3. Analysis of Results
3.1. Analysis of Arable Land Demand Forecast Results
3.1.1. Simulation Model Testing
To ensure the rationality, validity, and accuracy of the model, in this study, we selected birth rate, mortality rate, grain demand, and grain yield per capita for the historical test for the period of 2001–2020. Relevant studies considered test errors acceptable for variations between −10% and 15% [38,54]. The test results in this study indicated that the error values of each variable fluctuated between −7.57% and 9.87%. The mean errors of the simulated values of birth rate, mortality rate, cereal demand, and cereal yield per capita for the last 20 years were 3.51%, −2.03%, 0.261%, and 0.17%, respectively. The simulation results were virtually consistent with the reality of system development, indicating that the model was well structured and can basically predict the future arable land demand in China (Table 4).
Table 4.
Prediction results of arable land demand and main related variables.
3.1.2. Population Development
In the next fifteen years, on the one hand, the improvement of China’s medical care and living standards will extend the average life expectancy of Chinese residents and reduce the mortality rate in China. On the other hand, population aging will increase the mortality rate in China. Under the combined influence of both factors, the mortality rate in China will show a decreasing trend in the future. During the study period, Chinese households’ education expenditures and the number of people pursuing postgraduate studies continued to rise, while the proportion of registered married couples and the proportion of the population in the age group suitable for childbearing will further decrease. If China continues to maintain its current population policy, China’s birth rate will further decrease in the future. It is expected, that by 2026, China’s birth rate will be lower than its population mortality rate. By 2025, the population size will also peak (1.49 billion). China’s population will decline to 1.43 billion and 1.33 billion by 2030 and 2035, respectively.
3.1.3. Per Capita Food Demand
According to the 2011 food balance sheet released by the Ministry of Agriculture, Forestry and Fisheries of Japan, FAO’s Global Food Loss and Waste Report for 2021, and Study on China Farming Sustainable Development Strategy, the ratios of the edible parts of food rations, meat, aquatic product groups, eggs, and milk are set at 93.80%, 65.90%, 55.60%, 850%, and 100.00%, respectively, and the loss rates per unit product in the production and distribution of food rations, meat, aquatic product groups, eggs, and milk in industrialized Asian countries (including China) are 2.50%, 15.00%, 34.00%, 10.00%, and 6.00%, respectively. According to China Agricultural Products Cost and Benefit Yearbook and the Study on China Farming Sustainable Development Strategy, the grain consumption coefficients per unit of product for pork, beef, mutton, poultry, aquatic products, eggs, and milk of medium farming scale are 2.70, 2.50, 2.92, 2.03, 1.28, 1.68, and 0.37, respectively (Table 5).
Table 5.
Conversion parameters of various foods and cereals based on nutritional requirements.
The consumption of food rations by Chinese residents will further decrease in the future. The per capita food ration demand in China for 2025, 2030, and 2035 is 143.27 kg, 130.93 kg, and 119.67 kg, respectively. However, more is transformed into the intake of meat, eggs, and milk. The feed grain demand in China for 2025, 2030, and 2035 is 261.50 kg, 291.71 kg, and 325.40 kg, respectively. Industrial food also comes from the grain supply of arable land, and the per capita demand for industrial food in China is 63.06 kg, 67.542 kg, and 74.63 kg for 2025, 2030, and 2035, respectively. In summary, China’s per capita food demand from arable land is 467.83 kg, 490.17 kg, and 519.70 kg/a for 2020, 2025, 2030, and 2035, respectively, of which food rations and feed grains occupy over 86% of the food demand, indicating that food demand is primarily determined by dietary structure.
3.1.4. Grain Yields
To promote sustainable agricultural and rural development, on the one hand, China is reducing the use of chemical fertilizers and pesticides on arable land. Since 2016, the amount of chemical fertilizers and pesticides applied in China has decreased, which, to a certain extent, has inhibited the improvement of China’s grain yields. On the other hand, to solve the issue of more people and less land as well as poor quality of arable land, China, as a country with a large population, has continuously increased its financial investment in agriculture and implemented agricultural land improvement projects to promote crop improvement and enhance the quality of arable land and farming conditions. In recent years, the irrigable area of China’s arable land and the degree of machine-friendly farming has increased, which has contributed, to a certain extent, to increasing China’s grain yields. Overall, China’s future cereal yields exhibit an upward trend and are expected to rise to 6.50, 6.60, and 6.70 t/hm2 in 2025, 2030, and 2035, respectively.
3.1.5. Arable Land Demand
From the perspective of food security, we have projected the change in demand for arable land in China from 2021–2035, taking into account the grain production capacity and demand. China’s arable land demand from 2021 to 2035 can be divided into 3 stages. The first stage is from 2021 to 2025; with the increase in population and per capita food demand, China’s overall food demand also increases rapidly, and the arable land demand also increases rapidly. China’s arable land demand in 2021 was approximately 114.49 million hm2, and China’s arable land demand will be approximately 121.52 million hm2 by 2025, with an average annual demand growth rate of 1.50%. The second stage is from 2025 to 2026, during which China’s population begins to decrease, but the rate of population decrease is lower than the growth rate of per capita food demand. Thus, the overall food demand continues to grow, and the growth rate of overall food demand is greater than the rate of increase in food yields. Therefore, China’s arable land demand is still increasing in this stage, but the growth rate is lower than the first stage, with an average annual growth rate of 0.22%. China’s arable land demand grows to 121.78 hm2 by 2026. The third stage is 2027–2035, during which the growth rate of overall food demand is less than the rate of increase in food yields. Thus, China’s arable land demand shows a decreasing trend in 2027–2035. In 2035, China’s arable land demand will be approximately 116.19 million hm2.
3.2. Forecast of Changes in China’s Arable Land Supply
3.2.1. Tendency of Arable Land Transferring Out
Construction land includes urban and rural residential land, public facility land, infrastructure land, tourism land, military land, etc. The scale of arable land occupied by construction land is closely related to the needs for social and economic development. The scale of arable land occupied by construction fluctuated and changed with a different focus of development in each year from 2001 to 2017. With the slowing down of economic development, the fluctuation of the amount of arable land occupied by construction land is shrinking, and the trend of change also shows a decreasing trend. It is estimated that 4.07 million hm2 of arable land will be taken up by construction from 2021 and 2035 (Figure 2). The project of returning farmland to forest was implemented on an experimental basis in 1999 and was fully extended in China in 2002. As a result, from 2001 to 2005, large areas of steep-sloped farmland were converted to forest or grassland owing to the project of returning farmland to forest. With the reduction of steep-sloped land, the area of arable land occupied by reforestation has decreased yearly in recent years. From 2021 and 2035, China’s arable land is estimated to be reduced by 1595.29 hm2 due to reforestation (Figure 3). Owing to the implementation of the project of returning farmland to forests, the scale of natural destruction of farmland in China has decreased yearly. The disaster is estimated to destroy 0.03 million hm2 of arable land from 2021 and 2035 (Figure 4). In recent years, China has seen a decrease in the scale of arable land being reallocated to other agricultural land as the agricultural structure has been optimized to curb the de-farming of arable land. 0.06 million hm2 of arable land will be transferred out by China’s agricultural restructuring from 2021 and 2035 (Figure 5).
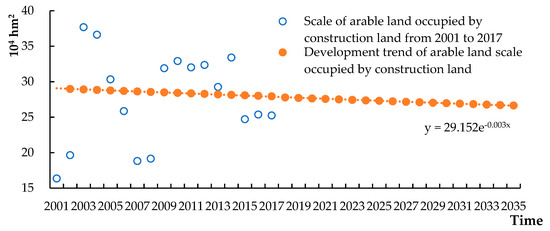
Figure 2.
Scale of arable land occupied by construction land from 2001 to 2017 and its development trend.
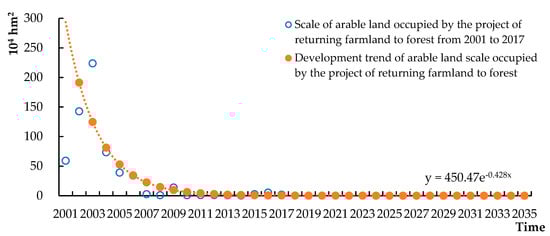
Figure 3.
Scale of arable land occupied by the project of returning farmland to forest from 2001 to 2017 and its development trend.
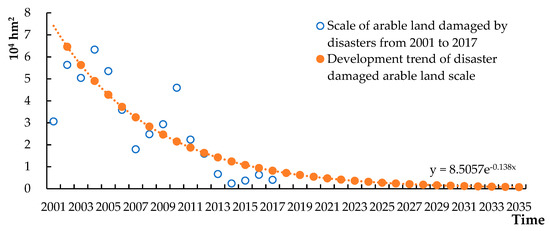
Figure 4.
Scale of arable land damaged by disasters from 2001 to 2017 and its development trend.
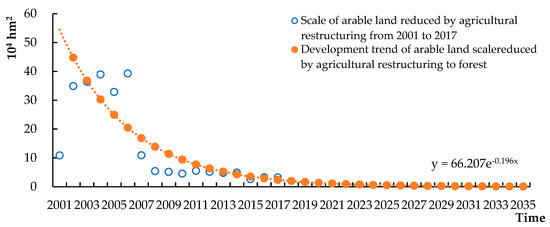
Figure 5.
Scale of arable land reduced by agricultural restructuring from 2001 to 2017 and its development trend.
3.2.2. Forecast of Arable Land Supply
In the future, the scale of all types of arable land transferred out in China will exhibit a decreasing trend. In 2025, 2030, and 2035, China’s arable land is expected to decrease by 0.28 million hm2, 0.27 million hm2, and 0.27 million hm2, respectively, and the scale of arable land transferred from is expected to decrease at an average annual rate of 0.61%. As the difficulty of land remediation strengthens, the scale of arable land transferred in decreases at an average annual rate of 2.27%. Moreover, it is expected that 0.25 million hm2, 0.22 million hm2, and 0.20 million hm2 of other types of land will be converted into arable land in China in 2025, 2030, and 2035, respectively. China’s scale of arable land transferred out during the study period was larger than the scale of transferred in. Thus, the total scale of China’s arable land will further decrease after 2021. Moreover, since the rate of decrease of the scale of arable land transferred in is larger than the rate of decrease of the scale of arable land transferred out, The scale of arable land loss in China during the study period exhibited an increasing trend. It is expected that China’s arable land will decrease by 0.03 million hm2, 0.05 million hm2, and 0.07 million hm2 in 2025, 2030, and 2035, and the supply area of arable land in China will be 127.70 million hm2, 127.48 million hm2, and 127.16 million hm2 (Table 6).
Table 6.
Forecast of China’s arable land supply Changes from 2021 to 2035.
3.3. Analysis of China’s Arable Land Supply and Demand Balance Situation
In terms of the demand and supply of arable land, the supply of arable land in China from 2021 to 2035 is guaranteed to meet China’s demand for arable land. Moreover, the largest supply area and the smallest demand occur in 2021, when the degree of arable land guarantee is the highest, at 111.63%. Between 2021 and 2026, China’s overall demand for arable land will increase, while China’s supply of arable land will decrease, and China’s degree of arable land security will decrease. By 2026, China’s degree of arable land security will be approximately 104.83%. After 2026, the rate of decline in demand for arable land in China will be greater than the rate of decline in the supply of arable land, and the degree of arable land security in China will begin to rebound, reaching 109.44% in 2035 (Figure 6). These data suggest that over the next 15 years, China can rely on its resources and agricultural production capacity to ensure food security and maintain certain redundancy in the supply of arable land, as long as it maintains its current fertility policy and development level.
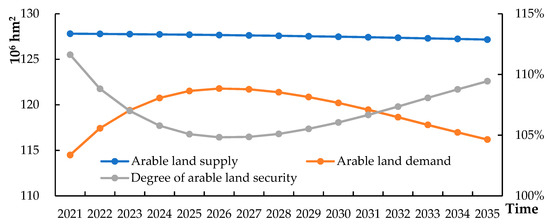
Figure 6.
China’s arable land supply and demand balance situation from 2021 to 2035.
4. Discussion
4.1. Optimize Arable Land Protection Measures, Promote Sustainable Utilization of Arable Land Resources
The forecast results show that the supply of arable land in China will be able to meet the demand for arable land in the context of full food self-sufficiency from 2021 to 2035. However, Yawson et al. showed that even when food is currently available to meet demand, there will still be a shortfall in future food demand due to the backlash of demographic, policy, and natural conditions [34]. The reasons for this result are twofold. On the one hand, the transformation of agricultural farming structure brought about by rapid urbanization with the aim of economic efficiency may limit food production [24]. The land use change also require huge economic and ecological costs, and this consumption is even irreversible [55,56]. On the other hand, the long-term intensive agricultural production mode of “high input, high replanting and high yield” has brought high grain yield, but also brought problems such as farmland degradation and ecological environment degradation [57]. In the context of global green development, we should reduce the input of chemical fertilizers and pesticides, moderately reduce the sown area, and reasonably implement rotation fallow to achieve the sustainable use of arable land resources. Lu et al. showed that 7–10% of arable land should be kept in crop rotation under the premise of fully exploiting the productive potential of arable land, using China as a case study [58]. Therefore, in order to meet the requirements of sustainable development, countries such as China with more people and less land need to continue to strengthen arable land protection in the future, and should build a solid bottom line of food security by the following ways.
- Clarify the main parties, responsibilities and obligations of arable land protection, establish arable land protection compensation and assessment system, improve the supervision system of arable land protection, and promote the institutionalization, standardization and legalization of arable land protection.
- Taking into account the multiple needs of arable land in terms of quantity, quality and ecology, set up national arable land protection zones, abandoned the non-differentiated arable land protection strategy, and implemented zoning control and classification protection for arable land nationwide.
- Improve the rules for the conversion of arable land to garden and forest land, and strictly restrain the capital-led large-scale occupation of arable land for the development of non-food industries. For garden land and forest land with undamaged ground strength and good soil and water conditions, which can be easily restored to arable land, they will be considered as arable land for control to ensure that they can be restored when urgently needed.
- Promote the implementation of comprehensive land improvement and high-standard farmland construction and other projects to replenish the quantity and improve the quality of arable land. Strictly restrain the ecological damage of forest land reclamation in areas with scarce arable land reserves to supplement arable land.
4.2. Research Limitations and Prospects
According to the prediction results of China’s arable land demand by Yu Haocheng et al. in the context of complete self-sufficiency in grain, China’s arable land demand in 2025, 2030, and 2035 is 122.60, 123.13, and 111.67 million hm2, respectively [33]. They are 1.01, 1.02, and 0.96 times of the prediction results of this study, respectively, which are basically consistent with the prediction results of this study. Therefore, the results of this study have some reference value. However, in reality, policies such as population and rural revitalization are constantly changing. When system dynamics is running, the future situation is calculated as an equation and the variables need to be quantified. Because policy factors are difficult to quantify, the simulation scenario set in this paper are is that China’s population policy and rural revitalization policy will not change significantly or have less impact during the simulation period. It is just one of many scenarios that may occur, Subsequent research can set other scenarios to simulate the demand scale of arable land according to the actual development trend or theoretical assumptions.
As the third largest country in the world in terms of land area, China has obvious differences in resource endowment and economic development among provinces. However, this paper only analyzed China’s demand for arable land from a macro perspective. In the future, we can analyze regional demand for arable land from provinces, cities, counties and other regional scales based on regional development positioning and resource endowment, and further define arable land protection tasks from different scales and different development types.
5. Conclusions
In this article, we use a system dynamics model and a Gray-Markov model to predict future changes in arable land supply and demand in China, aiming to providing a reference for spatial planning ideas such as agricultural structural adjustment and fallow policy improvement. The study reached the following conclusions.
- Over the next fifteen years, the demand for per capita rations in China will be relatively reduced. However, the increasing demand for meat, eggs, milk and aquatic products due to the rising standard of living has resulted in an increase in per capita feed grain demand. The steady development of industry has also contributed to the rapid development of the grain processing industry, and industrial food will continue to grow. Without regulation, China’s population birth rate will decline rapidly in the future. At the same time, the overall demand for arable land in China will tend to increase before decreasing in the context of improved agricultural technology to increase grain yields. 2026 will see the largest demand for arable land at 120.86 million hm2.
- Due to the limitation of land remediation potential, the area of cultivated land transferred to China will show a decreasing trend in future years. At the same time, the pressure of arable land protection also reduces the scale of arable land occupation in China, so the area of arable land transferred out of China will also show a decreasing trend in the future. However, the area of transferred out arable land in China is larger than the area of transferred in in each year, and the supply area of arable land in China will show a decreasing trend. It is expected that China’s arable land supply will decrease to 127.70 million hm2, 127.48 million hm2 and 127.16 million hm2 by 2025, 2030 and 2035, respectively.
- According to the current Chinese arable land use and protection policy, China’s future arable land supply will be sufficient to meet China’s arable land demand. In the context of complete food self-sufficiency, the degree of arable land security in China will show a trend of first decreasing and then increasing with 2026 as the critical point. 2026, the degree of arable land security in China will be 104.83%. However, the degree of arable land security in China is relatively low. For the sustainable use of arable land resources, it is necessary to continue to strictly implement arable land protection policies and improve the quality and output of arable land.
Author Contributions
Conceptualization, S.Y., H.L. and L.Z.; Methodology, S.Y.; Software, S.Y. and D.L.; Resources, H.L.; Data curation, M.Z. and Z.C.; Writing—original draft, S.Y. and D.L.; Writing—review & editing, S.Y., H.L. and L.Z.; Funding acquisition, H.L. All authors have read and agreed to the published version of the manuscript.
Funding
This study was supported by 2020 Chongqing Postdoctoral Research Grant Program (No. 7820100595); 2021 Chongqing Social Science Planning Project (No. 2021BS068); 2021 Central Universities Basic Research Business Fund Youth Project (No. SWU2109317); 2021 Chongqing Postdoctoral Natural Science Foundation Project (No. cstc2021jcyj-bsh0168).
Data Availability Statement
The data presented in this study are available on request from the corresponding author.
Acknowledgments
The authors are grateful to the National Statistics Offifice for providing the data and the editors and anonymous reviewers for their comments and suggestions.
Conflicts of Interest
The authors declare that they have no conflict of interest.
References
- Bodirsky, B.L.; Rolinski, S.; Biewald, A.; Weindl, I.; Popp, A.; Lotze-Campen, H. Global food demand scenarios for the 21st century. PLoS ONE 2015, 10, e0139201. [Google Scholar] [CrossRef] [PubMed]
- Groot, J.J.R.; de Vries, F.P.; Uithol, P.W.J. Food supply capacity study at global scale. Nutr. Cycl. Agroecosyst. 1998, 50, 181–189. [Google Scholar] [CrossRef]
- World Bank. World Development Report 2008: Agriculture for Development; The World Bank: Washington, DC, USA, 2007. [Google Scholar]
- Skaf, L.; Buonocore, E.; Dumontet, S.; Capone, R.; Franzese, P.P. Applying network analysis to explore the global scientific literature on food security. Ecol. Inform. 2020, 56, 101062. [Google Scholar] [CrossRef]
- Wheeler, T.; von Braun, J. Climate Change Impacts on Global Food Security. Science 2013, 341, 508–513. [Google Scholar] [CrossRef]
- Xie, G.; Cheng, S.K.; Xiao, Y.; Lu, C.; Liu, X.; Xu, J. The Balance between Grain Supply and Demand and the Reconstruction of China’s Food Security Strategy in the New Period. J. Nat. Resour. 2017, 32, 895–903. [Google Scholar]
- Yu, B.; Lu, C. Change of cultivated land and its implications on food security in China. Chin. Geogr. Sci. 2006, 16, 299–305. [Google Scholar] [CrossRef]
- Cai, Y.L. Problems of Farmland Conservation in the Rapid Growth of China’s Economy. Resour. Sci. 2000, 22, 24–28. [Google Scholar]
- Sanchez, P.A.; Leakey, R.R. Land use transformation in Africa: Three determinants for balancing food security with natural resource utilization. Eur. J. Agron. 1997, 7, 15–23. [Google Scholar] [CrossRef]
- Sarkar, B.; Ganguly, B.; Pareek, S.; Cárdenas-Barrón, L.E. A three-echelon green supply chain management for biodegradable products with three transportation modes. Comput. Ind. Eng. 2022, 174, 108727. [Google Scholar] [CrossRef]
- Fu, Z.Q.; Cai, Y.L.; Yang, Y.X.; Dai, E. Research on the relationship of cultivated land change and food security in China. J. Nat. Resour. 2001, 16, 313–319. [Google Scholar]
- Li, X.; Jiang, D.; Bian, Z. The Surplus and Deficit Measurement of the Cultivated Land in China in the View of Food Security. Resour. Sci. 2014, 36, 2057–2065. [Google Scholar]
- Du, W.X.; Huang, X.J.; Zhai, W.X.; Peng, B.Z. Spatial differentiation of land transfer: Case study of Shanghai, Nanjing and Taizhou in Changjiang river delta. Chin. Geogr. Sci. 2006, 16, 24–31. [Google Scholar] [CrossRef]
- Tan, M.; Li, X.; Xie, H.; Lu, C. Urban land expansion and arable land loss in China—A case study of Beijing–Tianjin–Hebei region. Land Use Policy 2005, 22, 187–196. [Google Scholar] [CrossRef]
- Huaizhi, T.A.N.G.; Lingling, S.A.N.G.; Wenju, Y.U.N. China’s Cultivated Land Balance Policy Implementation Dilemma and Direction of Scientific and Technological Innovation. Bull. Chin. Acad. Sci. 2020, 35, 637–644. [Google Scholar]
- Li, C.; Wang, X.; Ji, Z.; Ji, Z.; Guan, X. Optimizing the Use of Cultivated Land in China’s Main Grain-Producing Areas from the Dual Perspective of Ecological Security and Leading-Function Zoning. Int. J. Environ. Res. Public Health 2022, 19, 13630. [Google Scholar] [CrossRef]
- Lai, Z.; Chen, M.; Liu, T. Changes in and prospects for cultivated land use since the reform and opening up in China. Land Use Policy 2020, 97, 104781. [Google Scholar] [CrossRef]
- Wang, Q.; Liu, X.; Yue, T.; Wang, C.; Wilson, J.P. Using models and spatial analysis to analyze spatio-temporal variations of food provision and food potential across China’s agro-ecosystems. Ecol. Model. 2015, 306, 152–159. [Google Scholar] [CrossRef]
- Wang, Y.B.; Wu, P.T.; Engel, B.A.; Sun, S.K. Comparison of volumetric and stress-weighted water footprint of grain products in China. Ecol. Indic. 2015, 48, 324–333. [Google Scholar] [CrossRef]
- He, G.; Zhao, Y.; Wang, L.; Jiang, S.; Zhu, Y. China’s food security challenge: Effects of food habit changes on requirements for arable land and water. J. Clean. Prod. 2019, 229, 739–750. [Google Scholar] [CrossRef]
- Chen, A.; He, H.; Wang, J.; Li, M.; Guan, Q.; Hao, J. A study on the arable land demand for food security in China. Sustainability 2019, 11, 4769. [Google Scholar] [CrossRef]
- Zhao, Y.Y.; Wang, J.; Zhang, L.; Jiang, L.L. Analysis of arable land requirement for protecting the self-supply of grains under new food security policy. J. Arid Land Resour. Environ. 2015, 29, 1–6. [Google Scholar]
- Yang, L.M.; Yu, M. The Analysis of Demand on Cultivated Land of China in the Future. Econ. Geogr. 2013, 33, 168–171. [Google Scholar]
- Liang, X.Y.; Jin, X.B.; Sun, R.; Han, B.; Reng, J.; Zhou, Y.K. China’s resilience-space for cultivated land protection under the restraint of multi-scenario food security bottom line. Acta Geogr. Sin. 2022, 77, 697–713. [Google Scholar]
- Ma, Y.H.; Niu, W.Y. Forecasting on Grain Demand and Availability of Cultivated Land Resources Based on Grain Safety in China. China Soft Sci. 2009, 3, 11–16. [Google Scholar]
- Xiang, H.; Ma, Y.; Zhang, R.; Chen, H.; Yang, Q. Spatio-Temporal Evolution and Future Simulation of Agricultural Land Use in Xiangxi, Central China. Land 2022, 11, 587. [Google Scholar] [CrossRef]
- Sun, G.J.; Liu, P.X.; Sun, T. Driving Forces of Cultivated Land Change in Wulate County: Investigation and Prediction. Bull. Soil Water Conserv. 2011, 31, 207–210. [Google Scholar]
- Zhao, Y.; Liu, X.H.; Sun, T.D. Prediction of Chinese arable land based on SAR Mode. J. Arid Land Resour. Environ. 2013, 27, 1–5. [Google Scholar]
- Cao, Y.G.; Wang, J.; Liu, A.X.; Huang, H. Studies on forecasting the arable land areas of Kai county in reservoir region of three gorges based on BP nerve network. Chin. J. Agric. Resour. Reg. Plan. 2007, 28, 30–34. [Google Scholar]
- Okwuashi, O.; Mcconchie, J.; Nwilo, P.; Isong, M.; Eyoh, A.; Nwanekezie, O.; Ekpo, A.D. Predicting future land use change using support vector machine based GIS cellular automata: A case of Lagos, Nigeri. J. Sustain. Dev. 2012, 5, 132–139. [Google Scholar] [CrossRef]
- Jian, S.U.N.; Zhang, L.; Chunlu, P.E.N.G.; Zhongren, P.E.N.G.; Meng, X.U. CA-based urban land use prediction model: A case study on orange county, Florida, US. J. Transp. Syst. Eng. Inf. Technol. 2012, 12, 85–92. [Google Scholar]
- Mamanis, G.; Vrahnakis, M.; Chouvardas, D.; Nasiakou, S.; Kleftoyanni, V. Land use demands for the CLUE-S spatiotemporal model in an agroforestry perspective. Land 2021, 10, 1097. [Google Scholar] [CrossRef]
- Yu, H.; Zeng, S.; Wang, Q.; Dai, J.; Bian, Z.; Chen, F. Forecast on China’s cultivated land protection baseline in the new era by multi- scenario simulations. Resour. Sci. 2021, 43, 1222–1233. [Google Scholar]
- Yawson, D.O. Estimating virtual land use under future conditions: Application of a food balance approach using the UK. Land Use Policy 2021, 101, 105132. [Google Scholar] [CrossRef]
- Bruckmann, G. Introduction to system dynamics modeling with DYNAMO. Technol. Forecast. Soc. Chang. 1984, 25, 363–366. [Google Scholar] [CrossRef]
- Forrester, J.W. Advertising: A problem in industrial dynamics. Harv. Bus. Rev. 1959, 37, 100–110. [Google Scholar]
- Wang, Q.; Huang, K. Simulation of Agricultural Water Footprint and Analysis of Influencing Factorsin Beijing Based on System Dynamics. Syst. Eng. 2021, 39, 13–24. [Google Scholar]
- Ma, L.; Long, H. Simulation on Sustainable Development of Rural Territorial System in China. Econ. Geogr. 2020, 40, 1–9. [Google Scholar]
- Liu, Z.; Qi, W.; Wang, X.; Shenghe, L. A literature research on population shrinking. World Reg. Stud. 2019, 28, 13–23. [Google Scholar]
- Tuerxun, M.; Chang, X. A Study on the Influencing Factors of the Birth Rate in China—Empirical analysis based on dynamic GMM model and threshold model. Price Theory Pract. 2019, 53–56. [Google Scholar] [CrossRef]
- Pang, Y.; Xu, W.X.; Fan, Y.C.; Li, X.S. Inhibition effect of labor quality on labor quantity in china: Provincial spatial panel analysis based on higher education enrollment and birth rate. Econ. Geogr. 2022, 42, 53–60. [Google Scholar]
- Wang, Y.; Zhong, H. The Analysis of Birth Rate Variation in China since 1990 and the Projection to the Future. Popul. Econ. 2017, 1–12. [Google Scholar] [CrossRef]
- Ma, J.; Li, J.; Zhang, L.; Qian, C.; Li, H. Understand the Basic Laws of Population Evolution and Promote the Longterm Balanced Development of China’s Population. J. Manag. World 2022, 38, 1-19+34+20. [Google Scholar]
- Fan, J.; Zhou, L.; Zhang, Y.; Shao, S.; Ma, M. How does population aging affect household carbon emissions? Evidence from Chinese urban and rural areas. Energy Econ. 2021, 100, 105356. [Google Scholar] [CrossRef]
- Liu, Y.; Chen, Y. Dynamics and Features of Transnational Immigrants in China Since 1990s. World Reg. Stud. 2014, 23, 1–13. [Google Scholar]
- Oryani, B.; Moridian, A.; Sarkar, B.; Rezania, S.; Kamyab, H.; Khan, M.K. Assessing the financial rеsоurсе curse hypothesis in Iran: Thе nоvеl dynаmiс АRDL approach. Resour. Policy 2022, 78, 102899. [Google Scholar] [CrossRef]
- Xiong, X.; Zhang, L.; Hao, Y.; Zhang, P.; Chang, Y.; Liu, G. Urban dietary changes and linked carbon footprint in China: A case study of Beijing. J. Environ. Manag. 2020, 255, 109877. [Google Scholar] [CrossRef]
- Rathnayaka, S.D.; Selvanathan, S.; Selvanathan, E.A. Demand for animal-derived food in selected Asian countries: A system-wide analysis. Agric. Econ. 2021, 52, 97–122. [Google Scholar] [CrossRef]
- Liu, J.; Guo, Q. A spatial panel statistical analysis on cultivated land conversion and Chinese economic growth. Ecol. Indic. 2015, 51, 20–24. [Google Scholar] [CrossRef]
- Liming, W.; Yanfeng, Y.; Hongbin, O. A Study of population stress simulation in slope cropland de-farming based on grid. Geogr. Res. 2001, 20, 389–396. [Google Scholar]
- Deng, Z.; Zhao, Q.; Bao, H.X. The impact of urbanization on farmland productivity: Implications for China’s requisition—Compensation balance of farmland policy. Land 2020, 9, 311. [Google Scholar] [CrossRef]
- Ding, S.; Li, R. Forecasting the sales and stock of electric vehicles using a novel self-adaptive optimized grey model. Eng. Appl. Artif. Intell. 2021, 100, 104148. [Google Scholar] [CrossRef]
- Zhou, T.; Hu, Z.; Zhou, Q.; Yuan, S. A novel grey prediction evolution algorithm for multimodal multiobjective optimization. Eng. Appl. Artif. Intell. 2021, 100, 104173. [Google Scholar] [CrossRef]
- Liu, Z.Q.; Chen, Y.; Jin, J.; Pan, X.W. System dynamics-based simulation of agricultural resource security and its policies: The case of Heilongjiang Province. Syst. Eng.-Theory Pract. 2010, 30, 1586–1592. [Google Scholar]
- Zhang, X.; Song, W.; Lang, Y.; Feng, X.; Yuan, Q.; Wang, J. Land use changes in the coastal zone of China’s Hebei Province and the corresponding impacts on habitat quality. Land Use Policy 2020, 99, 104957. [Google Scholar] [CrossRef]
- Wu, Y.Z.; Xu, Z. Study on the transformation of cropland protection under the background of rehabilitation system. Resour. Sci. 2019, 41, 9–22. [Google Scholar]
- Xie, H.; Wang, W.; Zhang, X. Evolutionary game and simulation of management strategies of fallow cultivated land: A case study in Hunan province, China. Land Use Policy 2018, 71, 86–97. [Google Scholar] [CrossRef]
- Lu, D.; Wang, Y.; Yang, Q.; He, H.; Su, K. Exploring a Moderate Fallow Scale of Cultivated Land in China from the Perspective of Food Security. Int. J. Environ. Res. Public Health 2019, 16, 4329. [Google Scholar] [CrossRef] [PubMed]


Disclaimer/Publisher’s Note: The statements, opinions and data contained in all publications are solely those of the individual author(s) and contributor(s) and not of MDPI and/or the editor(s). MDPI and/or the editor(s) disclaim responsibility for any injury to people or property resulting from any ideas, methods, instructions or products referred to in the content. |
© 2023 by the authors. Licensee MDPI, Basel, Switzerland. This article is an open access article distributed under the terms and conditions of the Creative Commons Attribution (CC BY) license (https://creativecommons.org/licenses/by/4.0/).