Abstract
In order to effectively reduce the probability of subway operation accidents and explore the key risk factors and multi-factor risk coupling mechanism during the subway operation period, this paper classifies the risk factors affecting subway operation safety into four categories of primary risk factors, personnel, equipment and facilities, environment and safety management, introduces the emergency management concept to identify 18 secondary risk factors, combines the improved fuzzy decision making test and evaluation laboratory (DEMATEL) and Explanatory Structure Model (ISM) to visualize the risk factor action relationship, construct a six-order hierarchical recursive structure model for subway operation accidents, explore the coupling relationship and effect between risk factors from the perspective of single factor, double factor and multiple factors, establish a coupling effect metric model based on Natural Killing Model (N-K), carry out coupling information interaction scenario combination and coupling effect quantification calculation, and finally integrate fuzzy DEMATEL-ISM-NK model to correct the centrality, determine the key risk factors in subway operation accidents from the perspective of macro and micro analysis, qualitative and quantitative research, and propose safety prevention and control strategies accordingly. The results show that six factors, such as emergency management and social environment, are key risk factors to be prevented in the metro operation system. Multi-factor risk coupling leads to a higher probability of subway operation accidents, and controlling multi-factor involvement in coupling is an effective means to reduce the occurrence of subway operation accidents.
1. Introduction
With the rapid economic and social development and urbanization in China, the contradiction between the huge traffic demand and the shortage of traffic facilities is deepening, and congestion has become the primary problem facing the traffic development of most cities [1]. In order to alleviate the traffic congestion on the ground, many cities have started to develop underground transportation vigorously, among which the lines and mileage of the subway are spurting development. As a green and sustainable way to travel, the subway is also popular for its ability to reduce traffic pollution and its convenience [2]. According to Wikipedia, as of August 2022, 205 cities in about 60 countries in the world have opened subway systems, and China is the country with the most subway systems [3]. However, in recent years, subway operation safety accidents have been frequent, such as train derailments, fire, flood, terrorist attacks, etc. In July 2021, Zhengzhou subway line five was besieged by a flood during its journey, and 14 passengers were tragically killed. As an emerging large-capacity public transportation, the safety of subway operations is closely related to the safety of the life and property of passengers and subway staff. Since subways are buried deep underground, with few entrances and exits, long evacuation lines, and poor ventilation and lighting conditions, it is more difficult to evacuate and rescue in case of safety accidents, which cause casualties, property damage, environmental damage, and bad social impact. The occurrence of safety accidents is often the result of multiple risk factors coupled together, and it is mentioned in the “14th Five-Year Plan” development strategy study of safety science and engineering discipline in China that the study on the risk assessment of underground space, the mechanism and development law of disaster caused by multi-parameter coupling of accidental disasters and catastrophes should be emphasized [4]. Therefore, a comprehensive analysis of the risk factors facing subway operation safety, identification of key risk factors, sorting out the interaction between factors, and an in-depth study of the multi-factor coupling mechanism of subway operation can help to prevent risks in advance and reduce the occurrence of subway operation safety risks, thus improving the level of subway operation safety management.
Currently, there has been some research in the field of safety risks related to metro operations at home and abroad. A. Di Graziano et al. [5] introduced a complete set of risk management methods to quantitatively analyze the causes and consequences of safety incidents in metro operations and proposed a procedure applied to metro operations to evaluate the safety risk impact of three different management decisions using a derailment risk event as an example. Chen J et al. [6] used artificial neural networks to evaluate the operational safety of urban rail transit systems. Li Zhengdao et al. [7] considered the risk factors in the construction and operation phases of metro projects from the stakeholder perspective and used social network analysis to construct a stakeholder risk network model to control and detect the control effect of core risk factors. Zhang Miao [8] combined the combined empowerment technique and cloud modeling method to construct a metro operation safety risk evaluation model. Huang Yajiang et al. [9]. combined the DEMATEL-ISM-ANP method to build a metro operation safety resilience evaluation model based on resilience theory. Zhao Luwei et al. [10] established a metro vulnerability index system under storm disturbance from five perspectives: human, equipment, environment, safety management, and emergency response, and constructed a metro system vulnerability formation mechanism model under storm disturbance based on ISM-MICMAC. Wang Yimin et al. [11] established a four-level safety evaluation index system containing 55 indicators and established the safety risk level determination guidelines and evaluation methods for crowded metro stations based on the topologic theory. Li Xiaojuan [12] used hierarchical analysis to quantitatively analyze the risk factors affecting metro operation safety and applied multi-level topologic theory to establish a model for metro operation safety risks. Zhu Yueyue [13] constructed a metro network vulnerability evaluation system from four elements: human, facility, environment, and management to improve the safety of metro operations.
In summary, previous studies in the field of subway operation safety are more about establishing risk models and constructing subway operation risk evaluation index systems, and the comprehensive analysis of risk factors affecting subway operation safety is not deep enough, and to effectively improve subway operation safety, it is necessary to adopt appropriate methods to comprehensively evaluate these risk factors, for example, due to the lack of safety education and training of subway security personnel, their safety awareness is low safety awareness due to the lack of safety education and training of subway security personnel, which leads to operational accidents if passengers are negligently indulged in carrying flammable and explosive substances on the subway, so it is very important to further judge the priority and complex relationships among risk factors [14]. The N-K model originated from information theory and was originally used to measure the amount of information transmission, but now it has been developed as a general model to solve complex systems [15]. It is mainly used to analyze the influence of the interaction of factors within the system on the overall system adaptation and is a common method for analyzing the evolution of the effects associated with risk factors in complex networks [16]. It has been applied to the safety risk management of road traffic, marine transportation, civil aviation, and building construction in recent years [17,18,19,20,21,22,23], and the feasibility of the N-K model for risk factor analysis and risk coupling has been demonstrated, which provides a theoretical basis and methodological support for the study of coupled evolutionary analysis of subway operation accident risks.
The combined fuzzy DEMATEL and ISM models can sort out the causal relationship, and hierarchical structure of risk factors and better describe the interrelationship between risk factors. The integrated DEMATEL-ISM-NK model can analyze the risk factors of subway operation accidents from macro and micro, qualitative and quantitative aspects. Therefore, to prevent subway operation accidents scientifically, this paper combines the improved fuzzy DEMATEL-ISM model, uses fuzzy DEMATEL to identify key factors, reveals the interrelationship between risk factors through ISM, the risk coupling mechanism of subway operation safety is analyzed, the interaction scenarios of risk factors are combined, the coupling effect metric model based on N-K model is constructed, the empirical analysis is carried out based on the database of 124 typical subway operation accidents, the risk coupling values under different risk coupling methods are calculated, and finally the coupling values are used as correction coefficients to correct the centrality of risk factors, to accurately identify the key risk factors and causal attributes leading to subway operation accidents, and to clarify the mechanism of action between risk factors, to provide a valuable reference for scientific prevention of subway operation safety accidents.
2. Materials and Methods
2.1. Framework for Analyzing Risk Factors in Metro Operations
The definition of risk is the combination of the possibility of a particular hazardous event (accident or incident) occurring and the severity of its consequences. Combined with the definition of risk, the subway operation safety risk is the combination of the possibility and severity of a hazardous event (accident or incident) occurring within the system and its close individual factors during subway operation under a specific situation.
2.1.1. Subway Operation Accident Case Collection
In order to build a database of subway operation accidents that can be used for quantitative analysis, this paper collects data on subway operation accidents that occurred between 1991 and 2021 worldwide through relevant literature, books, news reports, and accident reports published by the Ministry of Emergency Management at home and abroad, evaluates the quality of each accident case, eliminates cases with insufficient and unreliable data, and finally collects 124 typical subway operation accident cases.
The data collected are classified according to the time, location, cause, and consequences of the accidents [24]. Although it is impossible to include all the accidents that occurred during the metro operation, the accident data collected in this paper are still representative. In order to visualize the data, the statistics of typical subway operation safety accidents are presented in the form of the number of accidents and the percentage of data, as shown in Figure 1.
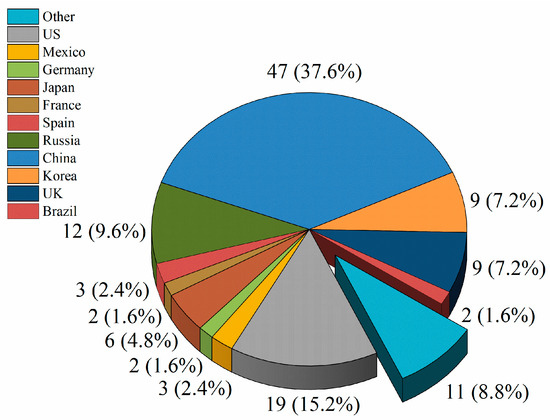
Figure 1.
Summary of typical subway operation safety accidents. (See Appendix A, Table A1 for details).
2.1.2. Identification of Safety Risk Factors for Metro Operations
By analyzing the causes leading to subway operation accidents through the collected accident cases, based on previous studies [25,26,27,28,29], the four major categories of personnel (a), equipment and facilities (b), environment (c), and safety management (d) are used to identify the safety risks during subway operation, which can be further subdivided into the physiological and psychological state (S2), vehicle system (S6), natural environment (S11), and emergency management (S17) and other 18 related risk factors, with personnel (a), equipment and facilities (b), environment (c), and safety management (d) as primary risk factors, and physiological and psychological state (S2), vehicle system (S6), natural environment (S11), and emergency management (S17) as secondary risk factors, the definition and specific interpretation of parameters S1–S18 are shown in Figure 2.
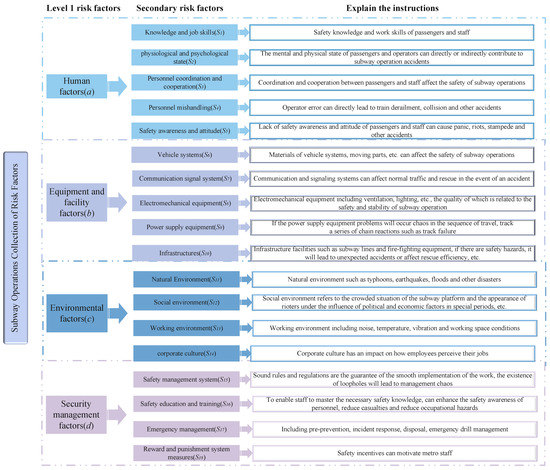
Figure 2.
Collection of safety risk factors for metro operations.
In 2019, the Ministry of Transport formulated the Management Measures for Emergency Drills of Urban Rail Transit Operations to improve the emergency response capability of urban rail transit operations, and the emergency management includes prevention beforehand, response in the event, and disposal in the event, and the emergency drill management is part of the emergency management, therefore, in this paper, when constructing the analysis framework of safety risk factors of metro operations, combined with the unpredictability of accidents innovative emergency management as a secondary risk factor of safety management, and because the corporate culture will make the employees have some influence on the degree of work perception, the corporate culture is considered as part of the internal environment that affects the safety of metro operations.
Specifically, it includes the following:
- Personnel (a) risk factors, where the secondary risk factors are knowledge and job skills (S1), physiological and psychological state (S2), personnel coordination and cooperation (S3), personnel mishandling (S4) and safety awareness and attitude (S5). Personnel is divided into staff and passengers, and the process of subway operation requires staff control, so the unsafe behavior of staff may lead to accidents, which can be divided into individual unsafe behavior and non-individual unsafe behavior, that is, the risk arising from the cooperation of workers with each other, mainly: driver operating errors, dispatcher improper command, security personnel fatigue, station service The main risks are: driver’s error, dispatcher’s misconduct, security personnel’s fatigue, station staff’s negligence, etc. Passengers are an important factor in subway operation, and the risks caused by passengers’ lack of safety awareness include trampling behavior under heavy passenger flow, suicide by jumping on the rail, man-made arson, etc.
- Equipment and facilities (b) risk factors, including secondary risk factors for the vehicle system (S6), communication signal system (S7), electromechanical equipment (S8), power supply equipment (S9), and infrastructures (S10). The safety of metro operations is positively related to the reliability, degree of wear and tear, and maintenance level of equipment and facilities. The systems that constitute metro equipment and facilities are vehicle systems, communication signal systems, electromechanical equipment, infrastructure facilities, power supply system, etc. The common risks caused by equipment and facility factors are signal failure, vehicle failure, power outage, line short circuits, etc.
- Environmental factors (c) risk. The secondary risk factors are the natural environment (S11), social environment (S12), work environment (S13), and corporate culture (S14). The environment is divided into the external environment and internal environment; the external environment mainly includes the natural environment and social environment; the natural environment includes earthquakes, floods, typhoons, etc., and the social environment refers to the crowded situation of passengers boarding and alighting from the bus with a surge in passenger flow and the emergence of rioters under the influence of political and economic factors in special periods, etc.; the internal environment includes the work environment and corporate culture, the work environment includes noise, temperature, vibration, and workspace conditions, the corporate culture will make employees perceive the work. Corporate culture will make the employees’ perception of their work have an impact.
- Safety management (d) factors risk. The secondary risk factors are the safety management system (S15), safety education and training (S16), emergency management (S17), and reward and punishment system measures (S18). Safety management directly affects the safety status of the subway operation period. The factors affecting safety management are mainly: safety education and training of subway staff, the degree of perfection of the safety management system, emergency rescue management and evacuation drills, safety incentive mechanism, etc.
2.2. Model Overview and Coupling
2.2.1. Fuzzy DEMATEL-ISM Overview
The Decision Experimentation and Evaluation Laboratory (DEMATEL) method is a system factor analysis method using matrix and graph theory as tools, which can quantify the interdependence of risk factors and identify the key factors in the system by analyzing the logical and direct influence relationships of the elements in a complex system and by calculating the centrality, causality, and other indicators [30]. This method is based on expert linguistic terminology expressions, which need to be converted from fuzzy linguistic terms to definite values to avoid ambiguity and reach a unified opinion. Fuzzy DEMATEL is a multi-indicator decision-making technique, which has the advantage that the decision-making process is based on pairwise comparisons and acceptance relationships, and fuzzy DEMATEL is applied to different areas of research, such as risk assessment and safety management [31,32]. In this paper, to solve the fuzzy problem of expert evaluation in the DEMATEL method, the triangular fuzzy numbers in fuzzy theory are introduced, and the initial direct matrix is fuzzified by applying the semantic evaluation and fuzzy number conversion relation of Li [33].
In 1973, John Warfield in the United States proposed the explanatory structural model (ISM), which can visually represent a structured model of factors with multi-order hierarchical structural relationships. Both DEMATEL and ISM reflect the influence of relationships between factors based on information in the expert assessment matrix, but the two models can yield different results [34]. The ISM model considers the influence of its factors based on the DEMATEL method and can determine the hierarchical structure among risk factors, making it easier to point out the key risk factors of metro operations and analyze the correlation and hierarchical relationship among risk factors [35].
The Decision Experiment and Evaluation Laboratory method (DEMATEL) and the Interpretative Structural Model (ISM) are interrelated. The overall influence matrix in the DEMATEL method and the reachable matrix in the ISM method represent the relationship between the system factors, and the combination of the DEMATEL-ISM method makes the overall influence matrix in DEMATEL contain more information than the reachable matrix in ISM and the calculation of the overall influence matrix, and thus the reachable matrix by the DEMATEL method can increase the amount and accuracy of information among the factors, and the direct influence matrix in the DEMATEL method and the adjacency matrix in the ISM reflects the correlation between factors, to obtain the reachable matrix from the overall influence matrix, the DEMATEL direct influence matrix must be used to replace the adjacency matrix in the ISM. The two methods complement each other for analysis, and the combination of DEMATEL and ISM methods can grasp both the influence and causal relationships between system factors and obtain the logical relationships and hierarchy between subway operational safety risk factors [36]. The DEMATEL-ISM model is well-suited for analyzing complex problems in complex systems and has been used in past studies [37].
2.2.2. Overview of the N-K Model
The N-K model [38] was proposed in the late 20th century for solving biological and genetic combination problems and is a model for analyzing the evolution of risk factor effects in complex systems. It mainly contains two important parameters, N and K. N represents the number of elements in the system, and K represents the number of interdependencies of elements in the system network, and its value interval is [0, N − 1]. It represents the way of the combination when there are “N” elements in the system, and each element has “n” forms.
2.2.3. Coupling of Integrated Fuzzy DEMATEL-ISM-NK Models
The DEMATEL model, the ISM model, and the N-K model all analyze the interactions among risk factors in complex systems, and the integrated DEMATEL-ISM-NK model can analyze the interactions among risk factors of subway operation accidents from macro and micro, qualitative, and quantitative perspectives. The DEMATEL-ISM model qualitatively analyzes and explains the multi-order hierarchy of subway operation risk factors from a macro perspective, while the N-K model quantitatively analyzes the interaction of risk factors within the subway operation system from a micro perspective, establishes a coupled hierarchical network model of subway operation risk, and uses the calculated coupling values as correction coefficients to correct the centrality of risk factors, and finally determines the key risk factors affecting the safety of subway operation are finally determined. The flow chart for applying the integrated DEMATEL-ISM-NK method to determine the key risk factors in this paper is shown in Figure 3.
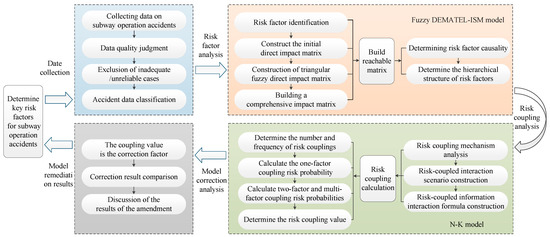
Figure 3.
Flow chart of the integrated DEMATEL-ISM-NK model.
2.3. Analysis of Risk Factors of Metro Operation Based on Fuzzy DEMATEL-ISM Model
2.3.1. Construction of a Comprehensive Impact Matrix of Risk Factors
- Construct the initial direct influence matrix D. The secondary risk factors of subway operation accidents were identified through literature research and the above risk identification as S1, S2, S3, …, and S18. To evaluate the degree of influence between risk factors, the authors conducted questionnaires or telephone interviews with senior engineers engaged in the metro operation industry, university teachers, and experts studying the field of metro operation safety; the expert group information is shown in Table 1, based on experience and professional perception of the relationship between the two influencing factors using the 0 (no influence), 1 (very low influence), 2 (low influence), 3 (high influence), 4 (very high influence). According to the scoring of the expert group, it was found that during the metro operation period, the operation manager paid more attention to both equipment and facilities (b) and safety management (d), among which vehicle system (S6), safety education and training (S16) and emergency management (S17) were more important. The academic group, on the other hand, paid more attention to the risk of personnel (a) factors, among which physiological and psychological state (S2), misuse (S4), and safety awareness and attitude (S5) received greater attention. Meanwhile, both academic and management groups paid more attention to the influence of environmental factors (c) on the safety of metro operations, such as social environment (S12) and work environment (S13).
 Table 1. Questioner information.
The experts’ scores were averaged and finally integrated into a matrix form. The component element aij indicates the influence of factor i on factor j, and aii indicates the influence of the factor itself, which is taken as 0. The matrix is expressed in the form of a Formula (1). (i,j = 1…18, and i ≠ j).
- 2.
- The triangular fuzzy direct influence matrix E was constructed, and to eliminate subjective differences in expert scoring, fuzzy processing was used to transform the direct influence relationships into the corresponding triangular fuzzy numbers and fuzzy scales [39,40], as shown in Table 2.
Table 2. Triangular fuzzy semantic conversion table.
- 3.
- Construct the standardized, clear direct influence matrix G. Firstly, the clear, direct influence matrix F is constructed and defuzzified using the center of gravity method, and the triangular fuzzy number is expressed by Ai = (mi, ni, ri) [41], which is calculated as expressed in Equation (2), and the expert-rated clear values are calculated and shown in Table 2, followed by normalization of the matrix F according to Equation (3) to obtain the standardized matrix G.
- 4.
- Construct the combined influence matrix R. The combined influence matrix R indicates the degree of the combined influence of one factor on another factor and is calculated according to Equation (4) as shown in Table 3.
Table 3. Integrated impact matrix R.
- 5.
- Calculate the influence degree Ji, the influenced degree Li, the centrality degree Mi and the cause degree Ni of each factor using the integrated influence matrix R. The influence degree is the sum of the corresponding rows in the integrated influence matrix, and the influenced degree is the sum of the corresponding columns in the integrated influence matrix. The centrality indicates the importance of the risk factor in the system, and the higher the centrality, the more important the factor is. The cause degree refers to the net influence of a factor on other factors, and the causal factor and the resulting factor are divided according to the positive and negative values of the cause degree, if Ni > 0, it is the causal factor, which means that the factor is easy to influence other factors; if Ni < 0, it is the resulting factor, which means that the factor is easy to be influenced by other factors, and the calculation formula is as (5)–(8).
The influence degree Ji, the influenced degree Li, the central degree Mi and the cause degree Ni of each influence factor are shown in Table 4.
Table 4.
Causality and centrality results.
The causality diagram is drawn according to Table 4, as in Figure 4, and the horizontal and vertical coordinates indicate the centrality degree Mi and the cause degree Ni, respectively, to determine the causality of factors and identify the key causes.
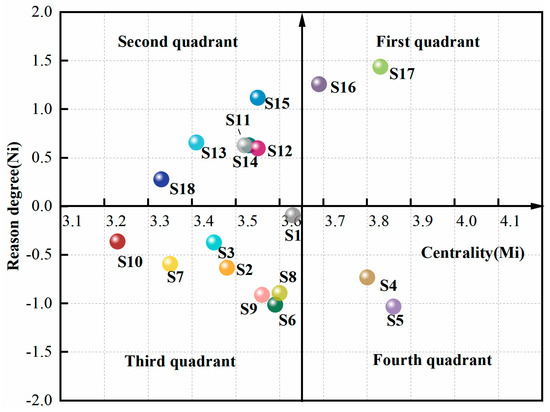
Figure 4.
Cause-and-effect diagram of influencing factors.
2.3.2. Construction of Risk Factor Reachability Matrix
Firstly, the threshold λ is calculated, and in this paper, to reduce the subjective influence of λ given directly by experts, λ is calculated by Equation (9); where α is the mean value of the integrated influence matrix R and β is the standard deviation of the integrated influence matrix R.
Next, the overall influence matrix H and the reachable matrix K are determined, and since the integrated influence matrix only considers the relationship between different factors and does not consider the influence of its factors, the overall influence matrix H is constructed, as in Equation (10), I is the corresponding order unit matrix. The reachable matrix K is determined by the threshold value λ, as in Equation (11). The reachable matrices are shown in Table 5.
Table 5.
Up to matrix K.
Finally, the hierarchical decomposition is carried out according to the reachable matrix to determine the reachable set Ai, the antecedent set Bi, and the common set Ci of factor Si. The reachable set Ai represents all factors in the reachable matrix K whose corresponding row value is 1, the antecedent set Bi represents the set of rows in the reachable matrix K whose corresponding column factor value is 1 when the intersection of Ai and Bi, Ci, and the expression (12) holds, the factors satisfying Formula (12) are divided into the same hierarchy, while the rows and columns of this factor in the reachable matrix are deleted to obtain the new reachable matrix Kn. The system is analyzed layer by layer, and a clear hierarchical structure among the factors affecting the metro operation period is derived. The results of the hierarchical analysis are shown in Table 6.
Table 6.
Hierarchy analysis calculation results.
Draw a multi-order recursive diagram of the influencing factors, and choose the first level at the top and the nth level at the bottom to draw the structural model according to the hierarchy carried out in Table 6, as shown in Figure 5.
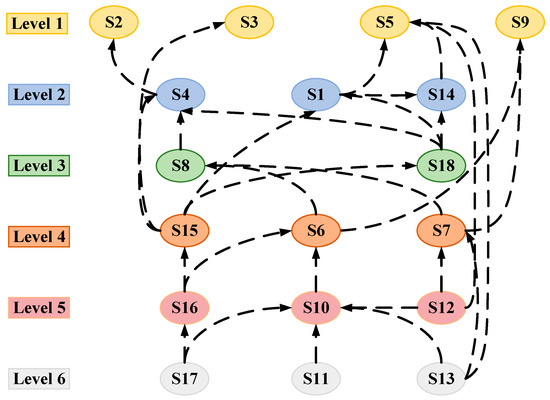
Figure 5.
Hierarchy progression diagram.
2.4. Building a Coupled Model of Subway Operational Safety Risks
Coupling in physics refers to the phenomenon in which two or more systems or two forms of motion interact and influence each other to the extent of joining together. In the field of risk management, risk coupling is defined as the degree to which the generation of a certain type of risk in a system and its influence depend on other risks and the degree to which this risk affects the generation and influence of other risks. Whether the misoperation of personnel leads to subway operation accidents or increases the safety risk of subway operation is not only influenced by the factors of equipment and facilities but also influenced by the factors of environment and safety management, and there are also mutual effects and influences among the four factors, i.e., the coupling of multiple factors leads to the generation and development of subway operation accident.
The coupling analysis of the causative factors of subway operation accidents is carried out, and the coupling degree of risk factors is calculated by using the N-K model to analyze the impact of risk coupling among four types of primary risk factors on the safety of subway operation, to deduce the deep mechanism of multi-factor coupled subway operation accidents, and to facilitate the grasp of the key points of prevention and control in the causative system of subway operation accidents [42].
2.4.1. Subway Operation Safety Risk Coupling Mechanism and Interaction Scenarios
According to Heinrich’s chain theory of accident causation, a casualty is not an isolated event but the result of a series of events occurring one after another, although the injury is formed in an instant. There are often many risk factors in subway operation, among which individual risk factors often do not lead to safety accidents, but rather the coupling between various risk factors leads to the overall risk value of subway operation exceeding the safety level of the system design itself, thus leading to the occurrence of accidents.
As shown in Figure 6, there are four types of first-level risk factors in the subway system: personnel, equipment and facilities, environment, and safety management. The accumulation of risk factors under a single risk factor generates the corresponding risk, and the continuously intensifying risk factors continue to spread in the subway operation accident chain after breaking through the respective sub-defense system, and the risk factors are transformed from static to dynamic, interacting, superimposing and coupling with other risk factors, and under the action of coupling oscillation, prompting them to break through the risk threshold leading to enhanced risk coupling effect in the subway operation system, and the risk intensifies or generates new risks under the promotion of positive coupling, which eventually leads to the occurrence of subway operation accidents.
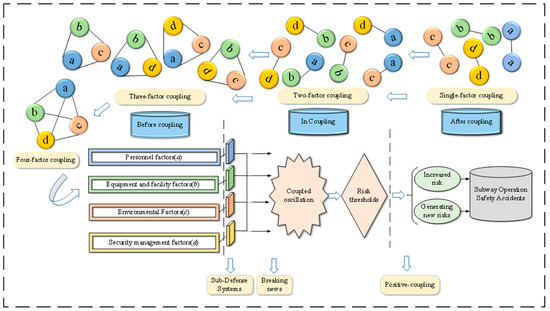
Figure 6.
Subway operation safety risk coupling evolution mechanism and interaction scenarios.
According to the different categories of subway operation risk factors personnel, equipment and facilities, environment, and safety management above, which are recorded as a, b, c, and d, the risk coupling is divided into the following three categories based on the actual situation of subway operation accidents.
- Single-factor risk coupling. Individual risk factors affecting metro operations contain many risk factors, and a certain number of single-factor risk factors interacting with each other may lead to the occurrence of metro operation accidents. Single-factor coupled risk includes personnel factor-coupled risk, equipment, and facility factor-coupled risk, environmental factor-coupled risk, and safety-management factor-coupled risk, which are recorded as T11(a), T12(b), T13(c), T14(d), and the total value of coupled risk is recorded as T1.
- Two-factor risk coupling. Two-factor coupling refers to the interaction and influence between 2 different types of risk factors affecting metro operation. Two-factor coupling risk includes: personnel-equipment and facilities factors coupling risk, personnel-environmental factors coupling risk, personnel-safety-management factors coupling risk, equipment, and facilities-environmental factors coupling risk, equipment and facilities-safety-management factors coupling risk, and environmental-safety-management factors coupling risk, respectively recorded as T21(a, b), T22(a, c), T23(a, d), T24(b, c), T25(b, d), T26(c, d), and the total value of coupled risk is recorded as T2.
- Multi-factor risk coupling. Multi-factor coupling refers to the interaction and influence between 3 and more risk factors that affect metro operation. Multi-factor coupling risk includes personnel-equipment and facilities-environmental factors coupling risk, personnel-equipment, and facilities-safety-management factors coupling risk, personnel-environment-safety-management factors coupling risk, and equipment and facilities-environment-safety-management factors coupling risk, which are recorded as T31(a, b, c), T32(a, b, d), T33(a, c, d) and T34(b, c, d), respectively. The total value of coupled risk is recorded as T3. Four factors of personnel-equipment, and facilities-environment-safety-management factors, coupled risk value are recorded as T41(a, b, c, d), and the total value of coupled risk is recorded as T4. The risk coupling relationship is shown in Figure 6.
2.4.2. Determine the Formula of Coupled Information Interaction for Metro Operation Risk
In the subway operation system, the object of this paper, N refers to 4 numbers of risk factors of personnel, equipment and facilities, environment, and safety management, and K is the number of risk factors interacting and coupling under each risk factor. By calculating the interaction information of the 4 types of risk factors of the subway operation system, the risk state formed due to the coupling of each risk factor is evaluated. The probability of the occurrence of the coupling is measured by the number of various types of risk coupling, i.e., the higher the number of occurrences of a certain risk coupling, the higher the probability of the occurrence of the coupling. The size of the coupling value to measure the size of the coupling risk and the probability of accidents; that is, the greater the value of a certain form of coupling, then the greater the coupling risk, the higher the probability of accidents. The formula of the interaction information is as in Equation (13).
where: a, b, c, d represent the 4 coupling elements, where “a” represents personnel, “b” represents equipment and facilities, “c” represents the environment, “d” represents safety management, v, w, x, y represent the states of the 4 factors respectively; Fvwxy is the probability of occurrence of the 4 factors risk coupling for personnel in the “v” state, equipment in the “w” state, environment in the “x” state, and safety management in the “y” state. The larger the value of T, the greater the risk of subway operation safety, and “T” is the quantitative assessment of the coupling of subway operation safety risk.
In this paper, there are six cases of local coupling of two-factor risk; for example, if the coupling of personnel and equipment and facilities factors occurs but not with environmental factors, local risk coupling occurs, so the local risk coupling can be analyzed by calculating the information interaction that occurs between the two factors. The formula for the two-factor risk coupling of personnel equipment and facilities is shown in Equation (14), and the two-factor risk coupling model can be constructed in the same way.
There are four cases of local risk coupling caused by three factors; for example, if the coupling of personnel factors, environmental factors, and safety-management factors, but not with the equipment and facilities factors, it is also the case of local risk coupling. Take personnel-environment-safety management as an example to build a three-factor risk coupling model as in Equation (15), and all three-factor risk coupling models can be built in the same way.
2.4.3. Risk Coupling Calculation
The risk factors of a metro operation mainly include personnel, equipment and facilities, environment, and safety management, and there are 16 possible forms of risk coupling for 4 types of first-level risk factors, with 0 and 1 indicating the status of the 4 types of risk factors, 0 indicating that the risk factor has not broken through the subsystem’s defense system, and 1 indicating that the risk has broken through the subsystem’s defense system. The number of risk coupling and the frequency of risk coupling are calculated by analyzing the collected data of 124 accidents, and the results are shown in Table 7.
Table 7.
Number and frequency of risk coupling of subway operation safety accidents in 1991–2021.
Single-factor risk coupling analysis. To calculate the T-value, the probability of occurrence of coupling in different ways should be calculated first. The probability of occurrence of subway operation accident without the involvement of personnel risk factors in risk coupling is: F0… = F0000 + F0100 + F0010 + F0001 + F0110 + F0101 + F0011 + F0111 = 0.2904, and the same can be obtained from F1…, F.0.., F.1.., F..0., F..1., F...0, F…1, and the calculation results are shown in Table 8.
Table 8.
Probability of risk occurrence under single-factor coupling.
Two-factor and multi-factor risk coupling analysis. The probability of a subway operation safety accident without risk coupling of personnel risk factors and equipment and facilities risk factors is F00… = F0000 + F0010 + F0001 + F0011 = 0.0404. Similarly, we can obtain F01.., F10.., F11.., F0.0., F1.0., F0.1., F1.1., F0..0, F1..0, F0..1, F1..1, F.00., F.10., F.01., F.11., F.0.0, F.1.0, F.0.1, F.1.1, F..00, F..10, F..01, F..11.
The probability of a subway operation safety accident without risk coupling of personnel risk factors, equipment and facilities risk factors, and environmental risk factors are F000. = F0000 + F0001 = 0.0081, by the same token, it follows that F000., F100., F0-10., F001., F110., F101., F011., F111., F.000, F.100, F.010, F.001, F.110, F.101, F.011, F.111, F0.00, F1.00, F0.10, F0.-01, F1.10, F1.01, F0.11, F1.11, F00.0, F10.0, F01.0, F00.1, F11.0, F10.1, F01.1, F11.1. The calculated results are represented as coupled probability chord diagrams, as in Figure 7.
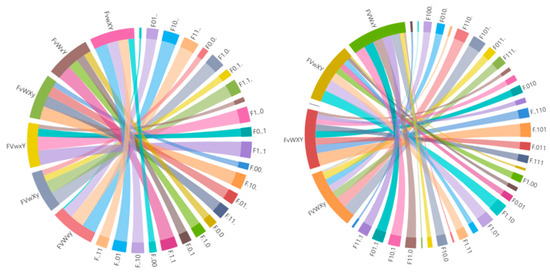
Figure 7.
Two-factor and multi-factor coupled risk occurrence probability chart.
The left side of the coupling probability chord diagram indicates the coupling type such as FvwXY indicates the two-factor environment-safety management coupling, F..11 indicates the probability under the coupling of both environment and safety management risk factors, and the chord width of each chord indicates the coupling probability, and the chord width in the same chord diagram is positively correlated with the coupling probability. The coupling chord diagram can visually represent the frequency of each type of coupling and provide the original data for the calculation of the coupling risk value below.
3. Results
3.1. Analysis of the Results of the Fuzzy DEMATEL-ISM Model for Subway Operation Risk Factors
3.1.1. Risk Factor Analysis
The risk factors affecting the safety of subway operations are analyzed in four aspects: degree of influence, degree of being influenced, degree of centrality, and degree of cause. The degree of influence of each factor on operation safety can be analyzed in terms of influence degree and influenced degree, and the importance of each factor in the complex system of metro operation is judged by centrality degree. To facilitate visual observation and analysis of the results, a coordinate system with (3.65, 0) as the origin is established, as shown in Figure 4, and a diagram of causality and centrality of the influencing factors is also established, as shown in Figure 8.
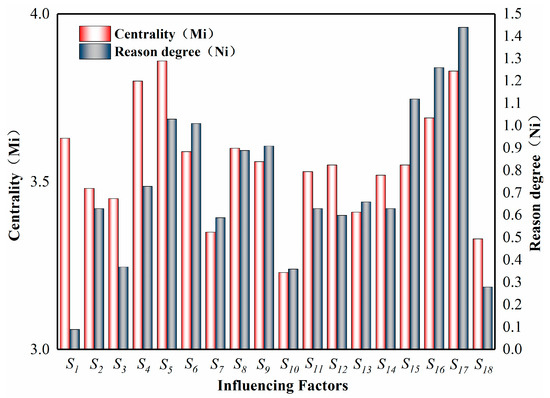
Figure 8.
Risk factor causality and centrality ranking chart.
Judging from Table 4, the cause degree greater than 0 is the causal factor, and the cause degree less than 0 is the resulting factor. According to Figure 4 and Figure 8, the cause factors are emergency management (S17), safety education and training (S16), safety management system (S15), work environment (S13), corporate culture (S14), natural environment (S11), social environment (S12), and reward and punishment system measures (S18) in order of cause degree, which is high potency factors and has a strong influence on other factors. The absolute values of the resultant factors in order are safety awareness and attitude (S5), vehicle system (S6), power supply equipment (S9), electromechanical equipment (S8), personnel mishandling (S4), physiological and psychological state (S2), communication and signal system (S7), personnel coordination and cooperation (S3), infrastructures (S10), and knowledge and work skills (S1) The above factors are influenced by high potency factors.
According to Figure 4, safety education and training (S16) and emergency management (S17) are located in the first quadrant with high cause degree and centrality, indicating that they are key factors and need to be focused on. Safety management system (S15), natural environment (S11), social environment (S12), corporate culture (S14), work environment (S13), and reward and punishment system measures (S18) are located in the second quadrant with a high degree of cause but a low degree of center, indicating that these factors can have a strong influence on other factors and should be paid attention to. Personnel mishandling (S4) and safety awareness and attitude (S5) are located in the fourth quadrant with high centrality but negative causality, which also belong to the key factors in the complex system of subway operation and are easily influenced by other factors.
3.1.2. Hierarchy Analysis
According to the hierarchy diagram shown in Figure 5, the subway operation safety system is a multi-level recursive system with six layers. Among these factors, emergency management (S17), social environment (S12), safety education and training (S16), natural environment (S11), safety awareness and attitude (S5), personnel mishandling (S4), and vehicle system (S6) are the most important factors, and their centrality is not low, indicating that these seven factors are the key factors affecting the safety of subway operation. Among them, safety awareness and attitude (S5) has the greatest centrality, indicating that safety awareness and attitude are the most critical factors affecting the safety of subway operation.
The physiological and psychological state (S2), personnel coordination and cooperation (S3), safety awareness and attitude (S5), and power supply equipment (S9) in level one are the direct factors affecting the safety of metro operation, while the natural environment (S11), working environment (S13), and emergency management (S17) in level six are the deeper influencing factors. The natural environment has a great impact on the normal operation of the metro, such as earthquakes and floods. This has an important impact on the physiological and psychological state of personnel and the working environment of metro staff. Levels two to five are indirect risk factors between the direct and deep impact factors. By analyzing these factors, we can study the risk factors of metro operation more comprehensively, identify the key critical factors, and effectively reduce the risk of metro operation safety.
3.2. N-K Model Calculation Results from Analysis
The probability and ranking of the coupling of each risk during the operation period of the metro are calculated according to Equations (13)–(15), as shown in Figure 9.
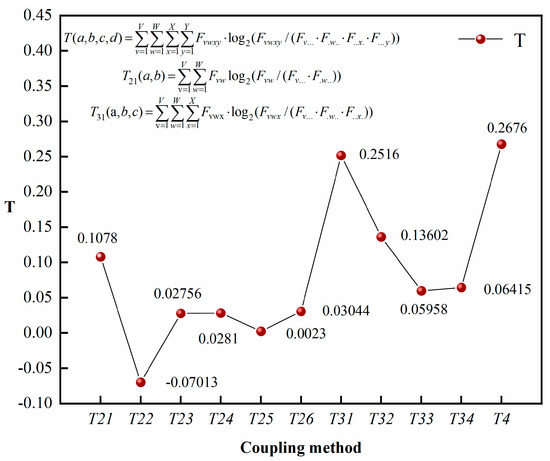
Figure 9.
Risk coupling calculation results and ranking.
The resulting T values are arranged in descending order: T4 > T31 > T32 > T21 > T34 > T33 > T26 > T24 > T23 > T25 > T22, and based on the above analysis it is obtained that:
The risk coupling value T is positively correlated with the number of risk coupling factors, and in special cases such as personnel-equipment and facilities two-factor coupling T value is greater than the equipment and facilities-environment-safety management and personnel-environment-safety management three-factor coupling T value, which illustrates the complexity of risk factor coupling during metro operation and is consistent with the causes of metro operation accidents occurring in daily life, and the risk coupling value T is greatest when personnel-equipment, and facilities-environment-safety-management four-factor coupling, which means that controlling the occurrence of multi-risk factor coupling will be the focus of subsequent metro operation accident prevention and control work.
In the risk coupling of three factors of subway operation, the T value of personnel-equipment-facility-environment risk coupling is the largest, while personnel-equipment-facility-safety-management and equipment-facility-environment-safety-management have higher coupling values than personnel-environment-safety management, which indicates that objective factors (equipment-facility factors) are involved in coupling than non-coupling risk values, and managers should pay more attention to subway equipment-facility risk factors and attenuate the risk level of risk factors.
From the single-factor change probability values and risk coupling T-values, it can be concluded that among the four types of risk factors for subway operation safety, human risk factors are involved in the most risk coupling, and the T-values of risk coupling are larger.
4. Analysis and Discussion of Model Result Correction
Since the fuzzy DEMATEL-ISM model describes the relationship between risk factors from a subjective perspective, the identified key risk factors may have a lower probability of occurrence in actual accidents, while the N-K model calculates the risk coupling values based on accident data, which is more objective. Therefore, combining the reachable matrix K in the fuzzy DEMATEL-ISM model, the potential risk coupling forms induced by the spread of risk factors in the directed network are analyzed, and the risk coupling values are used as correction coefficients to correct the centrality of risk factors, and the corrected data are used as the basis for evaluating the key risk factors in the metro operation period, and the results are shown in Figure 10.
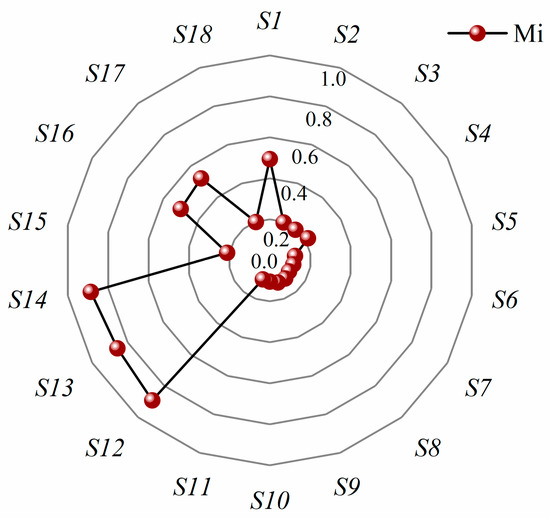
Figure 10.
Risk factor centrality correction results.
From the corrected results, it can be seen that the risk factors with high centrality ranking are mainly the two primary risk factors of environment and safety management, and the secondary risk factors of the social environment (S12), work environment (S13), corporate culture (S14) and emergency rescue (S17) and safety education and training (S16) in safety management still perform prominently, and the corrected knowledge and work skills (S1) is not less central, which is probably consistent with the key risk factors before the correction, indicating that the results of the correction using actual cases are consistent with the key risk factors obtained by analysis with the fuzzy DEMATEL-ISM method.
The key factors that change more after correction are personnel and equipment and facilities factors because environmental and safety management risk factors are cause factors, which are high potency factors and have a strong influence on other factors, and personnel and equipment and facilities factors are the result factors, which are influenced by high potency factors, so it can explain the higher accident probability when personnel and equipment and facilities factors are involved in coupling in the actual data.
The uncertainty of the environment will easily lead to the malfunction of the vehicle system, power supply system, electromechanical equipment, etc. It will also have a greater impact on the physiological and psychological state of passengers and staff, which will then affect the coordination and cooperation of staff or lead to staff mishandling. At the same time, the subway company should establish a good corporate culture, improve the safety awareness and knowledge skills of the staff, provide a good working environment to improve the concentration and motivation of the staff, and avoid the safety risks caused by the staff due to physical discomfort or psychological problems.
5. Conclusions and Future Research
This paper applies the Fuzzy DEMATEL model, ISM model, and N-K model to the field of subway operation safety, identifies and analyzes the key risk factors leading to subway operation accidents and the main coupling types of subway operation accidents based on the collected accident data, and clarifies the hierarchical relationship and mechanism of action among the influencing factors, and obtains the following conclusions:
- Based on the analysis results of the fuzzy DEMATEL-ISM model, it can be seen that among the 18 risk factors affecting the safety of subway operation, 4 factors, such as physiological and psychological state, safety awareness, and attitude are direct influencing factors, 3 factors such as natural environment and emergency management are deep influencing factors, and 11 factors such as knowledge and work skills are indirect causes of subway operation accidents. Seven factors, such as emergency management and safety education and training, have high centrality and are key influencing factors. Avoiding the occurrence of these risk factors can effectively cut off the connection of the risk network and avoid the formation of risk in the metro operation system.
- Based on the calculation results of the N-K model, it can be seen that the number of risk factors involved in coupling in the risk system of subway operation is proportional to the risk coupling value, and avoiding multiple factors involved in coupling is an effective means to reduce the occurrence of subway operation accidents. When checking risk factors, managers should also check other risk factors while avoiding single-factor coupling, and in the risk coupling of subway operation accidents, personnel and equipment, and facilities risk factors are key coupling factors, so they should give full play to the human initiative, strengthen safety education and training for staff, overhaul and monitoring of equipment and facilities, and timely deal with various hidden dangers encountered, and also monitor the environment in real-time. Real-time monitoring reduces the frequency of subway operation accidents.
- Based on the revised analysis results, it can be seen that six factors, such as emergency management and social environment, are the key risk factors in subway operation accidents, and the key risk factors that change more after the revision are personnel and equipment and facilities factors under the influence of high effectiveness factors (such as environmental factors), and considering from the perspective of system risk coupling, the coupling ability of environmental factors to induce risk is prominent and uncertain, for this reason, the subway should be improved system’s ability to respond to severe weather or adverse environmental emergency response, and Metro should also establish a good corporate culture and provide a good working environment to avoid the occurrence of subway operation accidents.
- The fuzzy DEMATEL-ISM model constructs a visualized multi-factor recursive structure model among the risk factors of metro operation, and the N-K model reveals the coupling degree of risk factors under different coupling types. The coupling of the integrated fuzzy DEMATEL-ISM-NK model is more suitable for describing the complex coupling interactions among risk factors during metro operation and identifying and analyzing key risk factors, which provides a theoretical basis for managers and decision-makers to formulate accident prevention measures and policies during metro operation.
- In this paper, the integrated fuzzy DEMATEL-ISM-NK model is used to explore the key risk factors and multi-factor risk coupling mechanism of subway operation accidents, and the findings are consistent with reality, so this method can be extended to future research in different fields. However, similar to other studies, this paper faces some limitations, such as constructing the set of subway operation safety risk factors with only 18 secondary risk factors considered, which is not exhaustive, and more studies should be conducted to refine the risk factors. Meanwhile, in the fuzzy DEMATEL model, in addition to using the triangular fuzzy affiliation function to convert the fuzzy semantic terms into specific values, other fuzzy affiliation functions can also be obtained, and subsequent studies can focus on this aspect to find a more suitable mathematical model for the research object and improve the accuracy of the research results.
Author Contributions
Conceptualization, J.L. and L.W.; methodology, L.W.; software, L.W. and G.Y.; Q.M. and H.Z. (Haowen Zhou); formal analysis, F.L. and H.Z. (Huyun Zhao); investigation, L.W.; data curation, G.Y. and Q.M.; writing-original draft preparation, J.L. and L.W.; writing-review and editing, J.L., L.W., W.W., F.L. and H.Z. (Huyun Zhao); supervision, J.L. and W.W. All authors have read and agreed to the published version of the manuscript.
Funding
This research was funded by Yunnan Province Key R & D Program Project (grant number 202003AC100002), Yunnan Fundamental Research Projects (grant number 202201AU070110), Yunnan Provincial Department of Education Scientific Research Fund Project (2022J0470), and the Scientific Research Fund Project of Yunnan University of Finance and Economics (grant number 2021D04).
Institutional Review Board Statement
Not applicable.
Informed Consent Statement
Not applicable.
Data Availability Statement
Not applicable.
Conflicts of Interest
The authors declare no conflict of interest.
Appendix A
Table A1.
Information statistics of 124 typical subway operation accident cases from 1991–2021.
Table A1.
Information statistics of 124 typical subway operation accident cases from 1991–2021.
| No. | Accident Time | Accident Location | Cause of Accident | Consequences of the Accident |
|---|---|---|---|---|
| 1 | April 1991 | Zurich, Switzerland | Fire | 32 dead and more than 100 injured |
| 2 | June 1991 | Berlin subway | Fire | 18 people were sent to the hospital for emergency treatment |
| 3 | August 1991 | Manhattan, New York City | Train derailment | Five people died and 155 were injured |
| 4 | January 1995 | Japan Subway | Earthquake | Damage to subway stations and subway tunnels |
| 5 | March 1995 | Tokyo Subway, Japan | Terrorist attack, the release of sarin gas | 12 dead, 5500 injured |
| 6 | July 1995 | Paris Metro, France | Bomb explosion | Eight people were killed and 117 were injured |
| 7 | October 1995 | Baku metro, capital of Azerbaijan | Fire | 558 people died and 269 were injured. |
| 8 | January 1996 | Beijing Subway | Power outage | Over 2000 passengers trapped |
| 9 | June 1996 | Moscow Metro, Russia | Terrorist attack | Four people died and seven people were injured |
| 10 | January 1998 | Moscow Metro, Russia | Terrorist attack | 3 people died |
| 11 | May 1999 | Belarus metro stations | Trampling accident | 54 deaths |
| 12 | June 1999 | St. Petersburg Metro Station, Russia | Explosion | 6 deaths |
| 13 | July 1999 | Guangzhou Metro Dongshankou Station | Fire | Direct fire damage of RMB 206,000 |
| 14 | August 1999 | Cologne subway train, Germany | Impact | 67 people were injured, 7 of them seriously |
| 15 | October 1999 | Seoul Subway | Fire | 55 deaths |
| 16 | November 1999 | Beijing Metro Fubax Line | Flooding | Personnel casualties |
| 17 | March 2000 | Nakameguro Station, Japan | Train derailment | 5 dead, 60 injured |
| 18 | April 2000 | Washington Metro | Fire | More than 10 people were injured |
| 19 | June 2000 | US subway from Brooklyn to Manhattan | Train derailment | 89 people were injured |
| 20 | August 2000 | Pushkin Station, Moscow | Terrorist attack | Thirteen people died and more than 90 were injured |
| 21 | November 2000 | Saarzburg metro, Austria | Fire | 155 people died and 18 were injured. |
| 22 | February 2001 | Moscow Belarusian Station | Bomb explosion | 15 people were injured |
| 23 | December 2001 | Beijing Subway Line 1 | Passenger fall | One person died |
| 24 | August 2001 | London Underground | Explosion | 6 people were injured |
| 25 | August 2001 | São Paulo Metro, Brazil | Fire | One person died and 27 people were injured |
| 26 | September 2001 | Taipei Metro | Typhoon Lily | Some subway lines were shut down for six months, leaving hundreds of thousands of people without transportation. |
| 27 | Dec. 2001 | Shanghai Metro People’s Square Station | Passenger fall | One death |
| 28 | January 2003 | London Underground Central Line | Train derailment | 32 people were injured |
| 29 | January 2003 | Sydney Metro | Train derailment | Personnel casualties |
| 30 | February 2003 | Korea Metro Line 1 Jungangno Station | Man-made intentional arson | 198 dead, 146 injured |
| 31 | July 2003 | Shanghai Metro Line 4 | Pipe surge collapse accident | The direct economic loss of RMB 150 million |
| 32 | August 2003 | London Underground | Major power outages | 250,000 people trapped in the subway |
| 33 | September 2003 | Shanghai Metro Xinzhuang Station | Escalator failure | More than forty people fell |
| 34 | January 2004 | Hong Kong MTR Admiralty Station | Man-made intentional arson | 14 people were sent to the hospital |
| 35 | February 2004 | Moscow Metro Line 2 | Terrorist attack | 50 dead and more than 100 injured |
| 36 | March 2004 | Madrid, Spain | Terrorist attack | 191 dead and 2050 injured |
| 37 | May 2004 | London Underground Central Line | Train derailment | More than 30 people were injured |
| 38 | July 2004 | Seoul Subway Daelim Station | Fire | Operational interruptions |
| 39 | August 2004 | Moscow Metro Line 6 Riga Station | Suicide bombing attack | Personnel casualties |
| 40 | October 2004 | Barcelona Metro, Spain | Train collision | More than 50 people were injured |
| 41 | January 2005 | New York Manhattan Subway Station | Fire | Line shutdown |
| 42 | January 2005 | Bangkok Metro | Train collision | 212 people were injured |
| 43 | April 2005 | Japan Subway Fukuchiyama Line | Train derailment | 107 people died and 562 were injured |
| 44 | July 2005 | London, England | Terrorist attack | 56 deaths |
| 45 | August 2005 | Shanghai Metro Line 1 | Waterlogged subway tunnel | Subway shutdown |
| 46 | August 2005 | Beijing Subway Chaoyangmen Station | Fire | Driver Injured |
| 47 | December 2005 | Shanghai Metro Line 1 | Parking accidents | A large number of passengers stranded |
| 48 | December 2005 | Beijing Metro Line 2 | A man entered the inner ring tunnel | Injured by train, the train stopped running |
| 49 | July 2006 | Chicago Metro “Blue Line” | Train derailment | 152 people were injured |
| 50 | August 2006 | Valencia Metro Line 1 | Subway derailment | 34 people died and more than 20 were injured |
| 51 | August 2006 | New York Subway Line B | Fire | 15 people were injured and 4000 passengers were evacuated in an emergency |
| 52 | October 2006 | Beijing Metro Chongwenmen Station | People jumping the track | 1 person died |
| 53 | October 2006 | Subway Line A, Rome, Italy | Train collision | 1 person was killed, and 236 people injured |
| 54 | July 2007 | Shanghai Metro Shanghai Stadium Station | Getting caught in the car | 1 person died |
| 55 | July 2007 | Venezuela Metro | Train collision | One person died and 12 people were injured |
| 56 | July 2007 | London Bethnal Green Underground Station | Train derailment | 37 people were injured |
| 57 | October 2007 | Tokyo Metro Toei Oedo Line | Power outage | 1300 people were trapped on the train, and 9.3 million people were affected by the trip |
| 58 | March 2008 | Beijing Metro Dongdan Station | Trampling accident | 11 people were injured |
| 59 | April 2008 | Chicago Subway | Traffic accidents | Two people died and 18 people were injured |
| 60 | September 2008 | Los Angeles Metro | Collision with a truck | 25 deaths |
| 61 | December 2008 | Xi’an, China | Fire | 19 people were injured |
| 62 | May 2009 | Boston Subway | Train collision | 49 people were injured |
| 63 | June 2009 | Washington Metro | Train collision | Nine people died and more than 70 were injured |
| 64 | July 2009 | Beijing Metro Line 1 | A man committed suicide by jumping on the rail | Subway operations were severely disrupted |
| 65 | September 2009 | New Delhi Metro, India | Train derailment | 21 people died and 17 were injured |
| 66 | December 2009 | Shanghai Metro Line 1 | Train collision | Train stop |
| 67 | February 2010 | Washington | Train derailment | Personnel casualties |
| 68 | March 2010 | Moscow Metro Line 1 | Explosion | 40 dead, nearly 100 injured |
| 69 | May 2010 | Shenzhen Metro Huaqiang Road Station | Trampling accident | 15 people were injured |
| 70 | June 2010 | Nanjing Metro Line 2 | Power outage | Subway delays |
| 71 | July 2010 | Shanghai Metro Zhongshan Park Station | Door failure | 1 person died |
| 72 | October 2010 | London Underground | Power outage | Many people were trapped for hours and 4000 people were affected by the travel |
| 73 | December 2010 | Shenzhen Metro Line 1 Guomao Station | Elevator failure | 24 passengers were injured |
| 74 | April 2011 | Minsk Metro Line 1 October Station | Bomb attack | 12 people lost their lives and about 200 people were injured |
| 75 | July 2011 | Beijing Metro Line 4 Zoo Station | Escalator failure | 1 dead, 2 seriously injured, and 26 were slightly injured |
| 76 | August 2011 | Nanjing Metro Line 2 | Floating on the seepage channel bed | Misalignment of train cars |
| 77 | September 2011 | Beijing Metro Xidan Station | Escalator failure | Passenger crush injuries |
| 78 | September 2011 | Shanghai Metro Xintiandi Station | Train rear-end | 295 people were injured |
| 79 | May 2012 | São Paulo Metro, Brazil | Train collision | At least 40 people were injured |
| 80 | July 2012 | Beijing Metro Xidan Station | Escalator failure | Five passengers were injured |
| 81 | August 2012 | Busan, Korea | Fire | More than 40 people were injured |
| 82 | September 2012 | Bowery Street Subway Station, New York | Fire | More than 500 passengers were evacuated |
| 83 | October 2012 | New York Subway, USA | Hurricane Sandy | New York’s entire subway system is down |
| 84 | November 2012 | Busan Subway Line 1 Daeti Station | Subway rear-end | Over 100 passengers injured |
| 85 | November 2012 | Shenzhen Metro | Signal interference | Emergency train braking |
| 86 | November 2012 | Guangzhou Metro Line 8 | Fire | 4 people were injured |
| 87 | January 2013 | Kunming Metro | Train derailment | One person was killed and one person was injured |
| 88 | March 2013 | Moscow Metro 110th Street Subway Station | Fire | 59 people were injured |
| 89 | March 2014 | Guangzhou Metro Line 5 | Trampling accident | Many people were injured |
| 90 | March 2014 | Chicago O’Hare International Airport Subway Station | Train derailment | 32 people were injured |
| 91 | April 2014 | Shanghai Metro Jing’an Temple Station | Escalator retrograde | 12 passengers were injured |
| 92 | May 2014 | New York Subway Line F | Train derailment | 19 people were injured and more than 1000 passengers were evacuated |
| 93 | May 2014 | Seoul Subway Line 3 | Deliberate arson | Train suspension |
| 94 | May 2014 | Seoul Subway Line 2 | Train rear-end | 249 people were injured |
| 95 | July 2014 | Busan Subway, Korea | Fire | Four passengers were injured and more than 400 passengers were evacuated in an emergency |
| 96 | November 2014 | Beijing Metro Huixinxijie South Exit Station | Getting caught in the car | 1 person died |
| 97 | January 2015 | Washington Metro | Fire | One person was killed and two people were seriously injured |
| 98 | February 2015 | Beijing Subway Wukesong Station | People falling off the track | One death |
| 99 | April 2015 | Shenzhen Metro Huangbeiling Station | Trampling accident | 12 injured |
| 100 | May 2015 | Mexico Metro | Train collision | 12 people were injured |
| 101 | July 2015 | Beijing Airport Line | Fire | Train suspension |
| 102 | December 2015 | London Leytonstone Underground Station | Terrorist attack | 3 people were injured |
| 103 | December 2015 | Beijing Subway Chaoyangmen Station | fall off the track | One death |
| 104 | January 2016 | Guangzhou Sanyuanli Metro Exit | Knife-wielding slashers | 1 woman injured |
| 105 | January 2016 | Tokyo Ginza Subway | Fire | 68,000 people travel disrupted |
| 106 | March 2016 | Metro stations near the EU headquarters in Brussels | Terrorist attack | 35 dead, 340 injured (62 seriously injured) |
| 107 | June 2016 | Nanning Metro Line 1 Baihualing Station | Flooded subway | Subway shutdown |
| 108 | January 2017 | Beijing Subway Babaoshan Station | Fall off the track | 1 person died |
| 109 | February 2017 | Hong Kong MTR | Man-made arson | 22 passengers were injured |
| 110 | April 2017 | St. Petersburg Metro Line 2 | Terrorist attack | 16 people died and 49 people were injured |
| 111 | June 2017 | New York Subway Line A | Train derailment | 34 people were slightly injured |
| 112 | September 2017 | London Parsons Green Underground Station | Terrorist attack | 29 people were injured |
| 113 | November 2017 | Singapore Subway | Train collision | 25 people were injured |
| 114 | April 2018 | Shanghai Metro Line 2 | Signal failure | Train suspension |
| 115 | August 2018 | Paris Metro Line 1 | Power outage | Hundreds of passengers evacuated as multiple driverless trains stop running |
| 116 | March 2020 | Northern Manhattan, New York, USA | Fire | Train driver dies, at least 16 people injured |
| 117 | May 2020 | Shanghai Metro Line 1 | Power supply equipment failure | Train speed limit |
| 118 | June 2020 | Seoul Subway Line 4 Sanggye Station | Train rear-end | Some trains are suspended |
| 119 | November 2020 | Union Square Subway Station, Manhattan, New York | Malicious injury | Adverse social effects |
| 120 | January 2021 | Mexico City Rail Transit Control Center | Fire | One death, massive subway shutdown |
| 121 | April 2021 | Shanghai Metro Line 2 | Fall off the track | 1 person died |
| 122 | May 2021 | Mexico Metro Line 12 | Elevated railroad track collapse | 23 people died and 79 people were injured |
| 123 | July 2021 | Zhengzhou Metro Line 5 | Flooding | 12 people died |
| 124 | November 2021 | Shenyang Metro Line 9 Shengli South Street Station | Stabbing people with knives | 1 person died |
References
- Chen, X.; Wu, S.; Shi, C.; Huang, Y.; Yang, Y.; Ke, R.; Zhao, J. Sensing Data Supported Traffic Flow Prediction via Denoising Schemes and ANN: A Comparison. IEEE Sens. J. 2020, 20, 14317–14328. [Google Scholar] [CrossRef]
- Xiao, G.; Xiao, Y.; Ni, A.; Zhang, C.; Zong, F. Exploring influence mechanism of bike-sharing on the use of public transportation-A case of Shanghai. Transp. Lett. 2022. [Google Scholar] [CrossRef]
- Statistics of Global Opened and Operated Metro Systems. Tunn. Constr. 2022, 42, 1814–1819, (In Chinese and English).
- Fan, W.; Miao, H.; Yuan, L.; Zhou, F.; Zhang, L.; Liu, N.; Zhong, M. Research on the development strategy of China’s safety science and engineering discipline in the 14th Five-Year Plan. China Sci. Found. 2021, 35, 864–870. [Google Scholar] [CrossRef]
- Graziano, A.D.; Marchetta, V.; Grande, J.; Fiore, S. Application of a decision support tool for the risk management of a metro system. Int. J. Rail Transp. 2022, 10, 352–374. [Google Scholar] [CrossRef]
- Chen, J.; Xu, H.; Gao, W.; Gao, J. Application of Artificial Neural Network in Course Design of Safety System-Taking a rail transit operation safety evaluation as an example. J. Phys. Conf. Ser. 2021, 1885, 52065. [Google Scholar] [CrossRef]
- Li, Z.; Guo, Z.; Su, D.; Wu, H.; Li, X. Study on risk management of metro construction and operation from stakeholders’ perspective. J. Saf. Environ. 2022, 1–13. [Google Scholar] [CrossRef]
- Zhang, M. Evaluation of subway operational safety risks under G1-EW combined empowerment cloud model. Chin. J. Saf. Sci. 2022, 32, 163–170. [Google Scholar] [CrossRef]
- Huang, Y.; Li, S.; Li, Y.; Zheng, H. Comprehensive evaluation of metro operational safety resilience based on DEMATEL-ISM-ANP. Chin. J. Saf. Sci. 2022, 32, 171–177. [Google Scholar] [CrossRef]
- Zhao, L.; Wang, Q. Mechanism of vulnerability formation of subway system under storm disturbance. Chin. J. Saf. Sci. 2022, 32, 193–199. [Google Scholar] [CrossRef]
- Wang, Y.; Luo, Y.; Yu, H.; Chen, J.; Huang, X. Safety risk evaluation method for crowded subway stations. J. Transp. Eng. 2020, 20, 198–207. [Google Scholar] [CrossRef]
- Li, X. Analysis of subway operation safety risks. J. Eng. Manag. 2017, 31, 83–88. [Google Scholar] [CrossRef]
- Zhu, Y.; Li, X.; Li, L. Research on vulnerability risk evaluation of subway network. J. Harbin Univ. Commer. 2021, 37, 450–455. [Google Scholar] [CrossRef]
- Li, Y.; Zhao, K.; Zhang, F. Identification of key influencing factors to Chinese coal power enterprises transition in the context of carbon neutrality: A modified fuzzy DEMATEL approach. Energy 2023, 263 Pt A, 125427. [Google Scholar] [CrossRef]
- Chu, F.; Zhu, C. Single-Item Dynamic Lot-Sizing Models with Bounded Inventory and Outsourcing. IEEE Trans. Syst. Man Cybern. Part A Syst. Hum. 2008, 38, 70–77. [Google Scholar] [CrossRef]
- Liu, Z.; Ma, Q.; Cai, B.; Shi, X.; Zheng, C.; Liu, Y. Risk coupling analysis of subsea blowout accidents based on dynamic Bayesian network and NK model. Reliab. Eng. Syst. Saf. 2022, 218 Pt A, 108160. [Google Scholar] [CrossRef]
- Yang, T.; Shuai, B.; Huang, W. Coupled risk analysis of road hazardous materials transportation system based on N-K model. Chin. J. Saf. Sci. 2019, 29, 132–137. [Google Scholar] [CrossRef]
- Pan, D.; Li, Y.; Luo, F. A study of aircraft operational safety risk coupling based on the N-K model. J. Saf. Environ. 2022, 22, 606–614. [Google Scholar] [CrossRef]
- Wang, H.; Liu, Z. Coupled analysis of maritime traffic safety risk factors based on N-K model. J. Saf. Environ. 2021, 21, 56–61. [Google Scholar] [CrossRef]
- Zhou, H.; Yang, Q.; Yang, Z.; Chen, C.; Ji, M. Analysis and control of tower crane safety risk factors based on complex network and N-K model. J. Saf. Environ. 2020, 20, 816–823. [Google Scholar] [CrossRef]
- Wu, X.; Wu, K.; Shen, M.; Chen, Y.; Zhang, L. Study on the coupling of subway construction safety risks based on the N-K model. Chin. J. Saf. Sci. 2016, 26, 96–101. [Google Scholar] [CrossRef]
- Fu, B.; Jiang, H.; Xu, T.; Yao, A. Coupling analysis of failure possibility factors of city gas pipelines based on the N-K model. China Sci. Technol. Saf. Prod. 2018, 14, 145–149. [Google Scholar]
- Zhao, J.; Xu, D.; Tian, J.; Dai, G. Study on the coupling of risk factors of fire and explosion accidents in oil tank areas based on the N-K model. Press. Vessel. 2019, 36, 49–55. [Google Scholar]
- Yang, D.; Zheng, Y.; Peng, K.; Pan, L.; Zheng, J.; Xie, B.; Wang, B. Characteristics and Statistical Analysis of Large and above Hazardous Chemical Accidents in China from 2000 to 2020. Int. J. Environ. Res. Public Health 2022, 19, 15603. [Google Scholar] [CrossRef]
- Ren, G.; Chen, J.; Gao, J.; Wang, Y.; Yuan, C.; Jiang, Q. An evaluation method for operational safety of subway stations based on improved topological element method. Urban Rail Transit Res. 2020, 23, 136–139. [Google Scholar] [CrossRef]
- Huang, H.; Ye, Y.; Hu, Q. Analysis of the current situation of subway operation safety risk management. Chin. J. Saf. Sci. 2008, 18, 55–62. [Google Scholar] [CrossRef]
- Han, L.; Li, Y.; Yang, Y. Study on the safety of subway operation and countermeasures. Chin. J. Saf. Sci. 2004, 14, 46–50. [Google Scholar] [CrossRef]
- Pan, K.; Wang, H.; Shi, J. Application of multi-level topological evaluation method in subway operation safety evaluation. J. Railw. 2011, 33, 14–19. [Google Scholar]
- Ma, Y.; Sun, J.; Wang, H. Risk assessment of metro operation safety based on OWA-AHP and entropy power method. J. Dalian Jiaotong Univ. 2019, 40, 86–91. [Google Scholar] [CrossRef]
- Sun, Y.; Huang, Z.; Li, Y. A review of recent advances in DEMATEL complex factor analysis algorithm. Comput. Sci. Explor. 2022, 16, 541–551. [Google Scholar]
- Mohammadfam, I.; Khajevandi, A.A.; Dehghani, H.; Babamiri, M.; Farhadian, M. Analysis of Factors Affecting Human Reliability in the Mining Process Design Using Fuzzy Delphi and DEMATEL Methods. Sustainability 2022, 14, 8168. [Google Scholar] [CrossRef]
- Yeganeh, R.; Mohammadfam, I.; Soltanian, A.; Mirzaei Aliabadi, M. An integrative fuzzy Delphi decision-making trial and evaluation laboratory (DEMATEL) study on the risk perception-influencing factors. Int. J. Occup. Saf. Ergon. 2022. [Google Scholar] [CrossRef]
- Li, R.J. The fuzzy method in group decision-making. Comput. Math. Appl. 1999, 38, 91–101. [Google Scholar] [CrossRef]
- Chen, J.; Huang, T. The Multi-Level Hierarchical Structure of the Enablers for Supply Chain Resilience Using Cloud Model-DEMATEL-ISM Method. Sustainability 2022, 14, 12116. [Google Scholar] [CrossRef]
- Zhu, J.; Chen, G.; Cao, E.; Dai, Z. Study on the influencing factors of deepwater good blowout risk based on DEMATEL/ISM. China Saf. Prod. Sci. Technol. 2020, 16, 5–10. [Google Scholar]
- Liang, Y.; Wang, H.; Zhao, X. Analysis of factors affecting the economic operation of electric vehicle charging station based on DEMATEL-ISM. Comput. Ind. Eng. 2022, 163, 107818. [Google Scholar] [CrossRef]
- Chen, Y.; Zhou, R.; Zhou, Y. Analysis of Critical Factors for the Entrepreneurship in Industries of the Future Based on DEMATEL-ISM Approach. Sustainability 2022, 14, 16812. [Google Scholar] [CrossRef]
- Weinans, H. The origins of order-self-organization and selection in evolution. J. Biomech. 1996, 29, 835–837. [Google Scholar] [CrossRef]
- Kuzu, A.C. Risk analysis of break-in-two accident of ships using fuzzy DEMATEL method. Ocean. Eng. 2021, 235, 109410. [Google Scholar] [CrossRef]
- Pan, L.; Zheng, Y.; Zheng, J.; Xu, B.; Liu, G.; Wang, M.; Yang, D. Characteristics of Chemical Accidents and Risk Assessment Method for Petrochemical Enterprises Based on Improved FBN. Sustainability 2022, 14, 12072. [Google Scholar] [CrossRef]
- Chen, F.; Han, M. Identification of ATC risk factors in airborne hazardous approach events. J. Saf. Environ. 2021, 21, 1583–1591. [Google Scholar] [CrossRef]
- Liu, J.; Yang, G.; Wang, W.; Zhou, H.; Hu, X.; Ma, Q. Based on ISM-NK Tunnel Fire Multi-Factor Coupling Evolution Game Research. Sustainability 2022, 14, 7034. [Google Scholar] [CrossRef]


Disclaimer/Publisher’s Note: The statements, opinions and data contained in all publications are solely those of the individual author(s) and contributor(s) and not of MDPI and/or the editor(s). MDPI and/or the editor(s) disclaim responsibility for any injury to people or property resulting from any ideas, methods, instructions or products referred to in the content. |
© 2023 by the authors. Licensee MDPI, Basel, Switzerland. This article is an open access article distributed under the terms and conditions of the Creative Commons Attribution (CC BY) license (https://creativecommons.org/licenses/by/4.0/).