Article

The Technological Innovation Efficiency of China’s Renewable Energy Enterprises: An Estimation Based on a Three-Stage DEA Model

School of Japanese Economy, Dongguk University, Seoul 04620, Republic of Korea
*
Author to whom correspondence should be addressed.
Sustainability 2023, 15(8), 6342; https://doi.org/10.3390/su15086342
Submission received: 6 March 2023 / Revised: 31 March 2023 / Accepted: 5 April 2023 / Published: 7 April 2023
(This article belongs to the Section Energy Sustainability)

Abstract

:
The advantages of clean, ecologically friendly, and renewable energy have drawn considerable attention from all nations in the world. The growth of the renewable energy industry has frequently been elevated to the status of national policy. By evaluating the technical innovation effectiveness of China’s renewable energy sector, the energy crisis may be alleviated, and the innovation potential of renewable energy can be boosted. At present, the research content of domestic renewable energy enterprises mainly adopts DEA and Cobb–Douglas production functions. Moreover, there is limited literature on the factors impacting efficiency, and most research results center on efficiency assessment. This study employs a three-step DEA method to determine the technological innovation efficiency for China’s A-share renewable energy firms from 2016 to 2020. To investigate the factors influencing technological innovation’s effectiveness, the panel Tobit model is then developed. In light of the empirical data, the main conclusions of this paper are as follows: First, despite a slow but steady improvement, Chinese renewable energy companies still need to increase their technological innovation efficiency. Pure technical efficiency is the main factor contributing to low innovation efficiency. Second, environmental laws such as reliance on global commerce, industrial structure, and local science and technology affect the innovation effectiveness of listed renewable energy enterprises. After excluding environmental factors, the comprehensive technical efficiency of listed renewable energy companies has decreased. Finally, the innovation and technological efficiency of renewable energy firms are positively impacted by government subsidies, top operational revenue, and enterprise scale.

1. Introduction

A nation’s existence and progress are fueled by its access to energy. Future years will see a continued rise in energy demand. One of the causes is the rise in energy demand. Global warming and the rising cost of fossil fuels are further significant considerations. Almost all governments are adopting necessary energy security policies. Therefore, it urges us to study zero-emission alternatives, that is, the renewable energy industry. After the United States, China today has the second-largest economy in the world, and it has entered a new era of improving quality and efficiency. At the same time, China is experiencing more major issues with energy consumption and environmental pollution [1]. The national economy’s lifeblood and the tangible foundation of human survival is energy. The engine of societal growth is energy. The production and use of energy both reflect the rapid economic growth of China. Energy is currently China’s most important and divisive economic development issue. In recent years, China’s demand for energy has increased significantly. China will consume 4 billion tons of standard coal by 2015, which is an increase of 3.18% over the previous year [2].
In the context of a concerted effort to combat global climate change, the transition from high carbon to low carbon has solidified itself as an inevitable trend. The energy sector’s development goal and direction is to support efficient use and environmentally sustainable growth. From the perspective of globalization, the expansion of the renewable energy sector has become a critical issue in the commercial and environmental sectors. Energy has become essential for human social production activities and economic development since industrialization. However, the use of energy sources such as coal, oil, and natural gas has also harmed the environment irreparably. Environmental deterioration has compelled numerous nations to create renewable energy industries in order to transform the world’s existing energy scenario [3]. In recent years, human activities have led to a significant increase in carbon dioxide emissions. Carbon dioxide is also considered a major cause of climate change. The negative impact of human industrial activities on the environment has caused people to worry about the future. The environment and renewable energy of each country have become the center of economic policy. Solving the global carbon dioxide problem requires the joint efforts of all countries in the world. Dealing with energy issues has gradually become a world consensus [4]. The world has started to give priority to energy concerns due to the transformation and upgrading of economic development in many countries [5].
In addition to environmental concerns, the expansion of renewable energy has had an impact on national economic activities. Renewable energy has significant social and environmental benefits. Besides, it has the potential to progressively replace conventional energy as the severity of climate change increases. In an atmosphere with stable political conditions, the use of renewable energy will promote economic growth more. Using renewable energy causes economic development in nations with high political risk to increase by 0.0204%. Nonetheless, the use of renewable energy has resulted in the economic growth of 0.0892% [6] in nations with little political risk. Inglesi et al. [7] calculated the impact of using renewable energy on the economy using panel data. The results show that boosting renewable energy is advantageous for both the environment and the economy of the various countries. For hybrid renewable energy systems, Vivasetal et al. [8] evaluated and analyzed various renewable energy management methodologies. Independent renewable energy technologies should be used in the circular economy, according to Gallaghertal et al. [9]. The potential of renewable energy technologies, which will significantly lessen the burden of greenhouse gas emissions and environmental strain, should be further explored. By promoting the switch from widespread to intense economic development, the integrated development of energy, economy, and environment is encouraged.
The coronavirus pandemic is rampant and pervasive in 2019 all over the world. Both economic activity and people’s lives have suffered significantly as a result of the outbreak. The political, economic, and trade patterns of the world will continue to change at the same time. Energy development with a low carbon footprint is important for humankind’s future. China places a high priority on the development of low-carbon energy. China actively contributes to and participates in the global sustainable development movement. Developing industries including wind power, solar energy, and electric cars are anticipated to play a vital role in fostering economic growth and establishing new growth centers. Exploring a green and low-carbon business model has received a significant boost from China’s energy plan. The Chinese government now prioritizes the renewable energy sector as a major strategic sector. Several government energy subsidy initiatives favor renewable energy [10].
Technological innovation promotes ecological sustainability from a national standpoint. Today, nations all across the world are acting. Realizing sustainable development has emerged into a unifying objective shared by all nations worldwide. Innovation in technology has the potential to boost production while simultaneously protecting ecosystems more effectively [11,12].
Technology innovation is an enterprise’s main competitive advantage and the cornerstone of its sustainable growth. Raising the level of technological innovation in enterprises requires first improving the efficacy and efficiency of existing technologies. An indicator of innovation potential is the effectiveness of technical advancement. It is possible to assess the technical innovation capacity of a certain firm, sector, or even a country by a thorough evaluation of innovation activity in a given subject. In other words, the effectiveness of technological innovation is ultimately determined by the amount of resources a corporation allocates to innovation initiatives. Efficiency is primarily addressed from the perspective of resource allocation [13]. Economic entities make the most use of feasible resources possible given the input conditions. Finally, the minimum input is used to achieve the maximum output of the enterprise. Efficiency in technological innovation can combine existing manufacturing resources and improve every element. If an enterprise’s technological innovation efficiency ability is stronger, its ability to combine production factors and production conditions is also stronger [14].
Investigating the effectiveness of technological innovation can help businesses transform and advance. It helps meet competitive market demand and raise the level of technological innovation in the new environment. From the standpoint of practical concerns, it can offer useful recommendations for businesses to increase the effectiveness of technological innovation. Innovation can increase a company’s market share, which is important for the long-term success of the business. In comparison to economic advantages, this has more long-term considerations.
This study primarily investigates the technological innovation effectiveness of renewable energy enterprises using the DEA three-stage method. Then, we look into the factors that influence the effectiveness of technological innovation. The remaining portions of this article are broken down as follows: Section 2 covers studies on the effectiveness of technological innovation in renewable energy enterprises. Section 3 and Section 4 introduce the study’s data and methods. We show and discuss the results in Section 5. Section 6 discusses the data robustness test. Section 7 presents the findings and policy implications. Recommendations are made for additional research in the conclusion.

2. Literature Review

Countries around the world are aggressively working to generate new renewable energy as the energy crisis and environmental issues become more prevalent. To achieve sustainable economic and social development, the energy system must be improved while also conserving the environment. Countries have developed support programs for the renewable energy sector intending to combat climate change such as subsidies and tax breaks for renewable energy technologies, for instance [15]. Technology innovation is meant to advance the growth of renewable energy sources. Future innovation should focus on fundamental technologies and apparatus such as fuel cells and hydrogen energy. Technologies for renewable energy are constantly being improved across the globe [16,17].
Technology innovation has received a great deal of attention from academics both domestically and internationally as a critical factor in promoting sustainable economic development. The foundation for advancing higher-level sustainable development is technological innovation [18]. Science and technology are now the main drivers of manufacturing. The main force behind economic growth is innovation. In short, breakthroughs in key technologies can often bring about the development of enterprises, and they may eventually drive the progress of the whole industry [19]. Scientific and technological innovation ability can provide an impetus for economic development. All countries can improve their economic level by improving their level of international patent expansion. Rich countries seem to be more successful in this respect than less affluent countries [20].
A critical component of accomplishing energy conservation is technological innovation. Innovation in technology is the primary force driving the low-cost development of renewable energy. Renewable energy companies advance energy technology research and development in order to close the gap between fossil fuels and renewable energy technologies and finally achieve green energy development. Effective energy technology innovation policies can also alter the way that renewable energy is consumed. They can encourage the growth of the energy user market. Yuan et al. [21] examined the relationship between energy intensity and technical advancement using the Cobb–Douglas production function, treating energy, labor, capital, and technological advancement as independent variables. The final conclusion is that as capital and labor output increases, so will the intensity of energy use. On the contrary, technological progress will reduce the intensity of energy. Technological progress can further open up the development space for energy conservation. So far, power generation is mainly based on fossil fuels, which has caused serious environmental problems and financial difficulties. With the continuous growth of global power demand, it is necessary to vigorously develop renewable energy technology to meet this demand [22]. Listed renewable energy companies play a crucial role in the growth of the sector and act as unique units for it. Innovation in science and technology is a crucial safeguard for the quick growth of China’s renewable energy sector.
The relative economic metric for measuring the effectiveness of technological innovation is its efficiency [23]. Compared to input and output indicators of technical innovation, efficiency indicators can more accurately evaluate the effectiveness of an enterprise’s innovation. Xun et al. [24] employed the technological innovation efficiency indicator to analyze the technological innovation. The writers also look at regional, policy, and issues related to human and financial capital at the same time.
Technological innovation’s efficacy does not equate to high input and high output. The ratio of technological innovation input to output, which represents an enterprise’s capacity for innovation, is known as technological innovation efficiency. Businesses increase output while using the same input. Fritsch et al. [25] used data from 11 European areas to examine the connection between manufacturing firms’ cooperative behavior and the effectiveness of R&D innovation. The findings of the study indicate that the two variables are essentially unimportant. Innovation efficiency, according to Sheng et al. [26], is the connection between input and output. According to the study’s findings, efficiency is high when input is low and output is high. The efficiency of invention suffers when input exceeds output.
It is clear from the aforementioned scholars’ study that many researchers base their analyses of the growth of corporate innovation efficiency on the relationship between input and output [27,28]. Ref. [29] evaluates the water usage effectiveness of 31 provinces in China between 2004 and 2013 using the SBM-DEA model (SBM-DEA model is DEA Model Considering Unexpected Output), which takes sewage into consideration. Since the three-stage DEA model combining DEA and SFA can successfully remove the external environmental factors and random interference items, this increases measurement accuracy. The model is simple to understand and simple to calculate.
Ref. [30] examines the effectiveness of South Korean small and medium-sized businesses’ technological innovation. The industrial and service industries were examined using DEA analysis and Tobit regression. The research’s findings indicate that technological innovation in the service sector is more effective than in the industrial sector. The efficiency affecting elements differs across the two industries as well. Lastly, guidelines and fundamental ideas for enhancing effectiveness are offered.
The representative parameter method is the SFA model [31]. The specific approach is to assume that there is a clear production function between input and output. A set of input-output data is substituted into the production function to obtain the unknown parameters, and finally, a specific expression of the production function is obtained. The solving process is similar to solving an unknown quantity in mathematics. The representative of the non-parametric method is the DEA model [32], which uses a linear programming method to calculate technical efficiency. It only needs the value of input and output. Based on it, the efficiency value is calculated through the distance between the production surface of DMU (decision-making unit) and the optimal frontier. The production frontier is mainly calculated by the linear programming method. The advantage is that we do not need to estimate the production function in advance. The operation is simple, so it is widely used by scholars at home and abroad. DEA is a popular non-parametric technique for analyzing problems with multiple inputs and variables. Piao et al. [33] used a sample of Chinese energy-listed enterprises to conduct an empirical study on the efficacy of technological innovation and its influencing factors. He came to the final conclusion that the number of patents held by China’s publicly traded energy businesses was rising quickly. Yet, there has been a decline in the company’s total technical innovation efficiency. Zhang et al. [34]’s analysis of the energy efficiency and its influencing elements in 13 RCEP nations used the three-stage SBM-DEA model, with the goal of enhancing regional energy efficiency. The overall energy efficiency of the RCEP is, in our opinion, quite poor, whereas China and Japan have slightly higher energy efficiencies. The effectiveness of global innovation indicates the potential for innovation in many nations. Aytekin et al. [35] utilized the data envelopment analysis (DEA) and efficiency analysis technology and input–output satisfaction (EATWIOS) to study global innovation efficiency. The Netherlands, Germany, and Sweden were determined to be the most significant nations in terms of global innovation efficiency. The final three inefficient nations were identified as Lithuania, Greece, and northern Macedonia.
The effectiveness of enterprise technical innovation across a variety of industries were then examined using similar methodologies by several researchers. The effectiveness of China’s photovoltaic industry’s micro-level technical innovation was examined by Lin and Luan [36]. Additionally, he examined how government assistance programs and other factors impact the effectiveness of innovation. According to the research, the efficiency levels of China PV-listed businesses are above 0.9, which is a respectably good level. Efficiency evaluation is crucial to airport operations. Thanavutd et al. [37] used data envelopment analysis and the Malmquist Productivity Index to examine the technical efficiency scores. Technically speaking, the bulk of Thailand’s municipal and regional airports are inefficient. Yet, the majority of airports have experienced a moderate but steady increase in overall productivity (around 8.4%). There is increasing pressure on the automotive industry to lessen environmental harm and increase battery sustainability. Data envelopment analysis (DEA) and the Marquiste technique were employed in this study to evaluate the technological prowess of 33 global automakers between 2014 and 2017. The extension of the analytical window for technical efficacy is a unique aspect of this work. Technical efficiency also includes environmental, social, and governance (ESG) activities [25]. From the perspective of high-tech industries, there is also a study that concentrates on the effect of market rivalry on the innovation efficiency of high-tech industries in transitional economies. According to the study’s findings, market competitiveness and company size have a favorable and considerable influence on how effectively high-tech industries innovate in two stages. On the contrary, government interference and the volume of industrial exports have a detrimental effect on the effectiveness of research and development [38].
The global shift to low-carbon development will benefit from the expansion of China’s green economy. Wu et al. [39] calculated the green economic efficiency (GEE) of several Chinese areas using panel data from 2008 to 2017. This study used the window analysis technique to investigate regional differences in GEE in China. Using the DEA approach, Sharma and Thomas [40] assessed the R&D effectiveness across 22 nations. Japan, the Republic of Korea, China, India, Slovenia, and Hungary are regarded as effective nations under the CRS (constant returns to scale) and VRS (variable return on the scale) frameworks, respectively. The research on technical efficiency and its affecting aspects has reportedly been a hot topic in recent years; however, the following issues still need to be further investigated. First, the majority of the existing research on energy efficiency comes from the macro-level of nations and regions, and just a little portion comes from the micro-level of businesses and organizations. The business is the starting point for increasing energy efficiency. To increase energy efficiency, it is crucial to research the micro-level technical efficiency of energy organizations. Second, the majority of current studies continue to employ the Conventional DEA or SFA model, and the study methodology is quite straightforward. Finally, research on the efficacy of technology advancement and the motivations behind renewable energy is scant. This study selects renewable energy enterprises from the enterprise level as the research object to perform a detailed examination of the changes in enterprise technology innovation efficiency as well as the factors influencing renewable energy innovation efficiency. To fill the gap in the literature, the following attempts are undertaken in this study. First, there is a strong representation of the developing sector of renewable energy. A three-stage DEA model is used in place of a single-stage DEA model.
In conclusion, academics both domestically and internationally have conducted research on the advancement of renewable energy technology, and as a consequence, a solid theoretical foundation for this study has been formed. Yet, there are still some extensible elements, such as the fact that qualitative research is frequently used in research methods. Most quantitative studies are conducted on the macro level, and very little study is made on renewable energy companies at the micro level.
Given the extent of China’s geographical area, few researchers have additionally considered the particularity of renewable energy technology innovation efficiency under regional differences. Academics often use the traditional DEA technique in their research methodologies to evaluate the success of technical innovation in renewable energy in China. When examining efficiency, it is hard to entirely rule out the influence of random events and environmental factors.
To remove the external environment and random interference and obtain a more precise efficiency number, the three-stage DEA approach is employed in this study. The efficiency rankings of several provinces and regions are also contrasted in this study. Finally, the author makes some suggestions for enhancing the overall technical innovation effectiveness of China’s renewable energy sector. We provide an evaluation and thus a good understanding of the technical innovation efficiency of the listed renewable energy vehicle enterprises. Lastly, we offer policy recommendations to increase the overall effectiveness of technological innovation.

3. Research Methodology

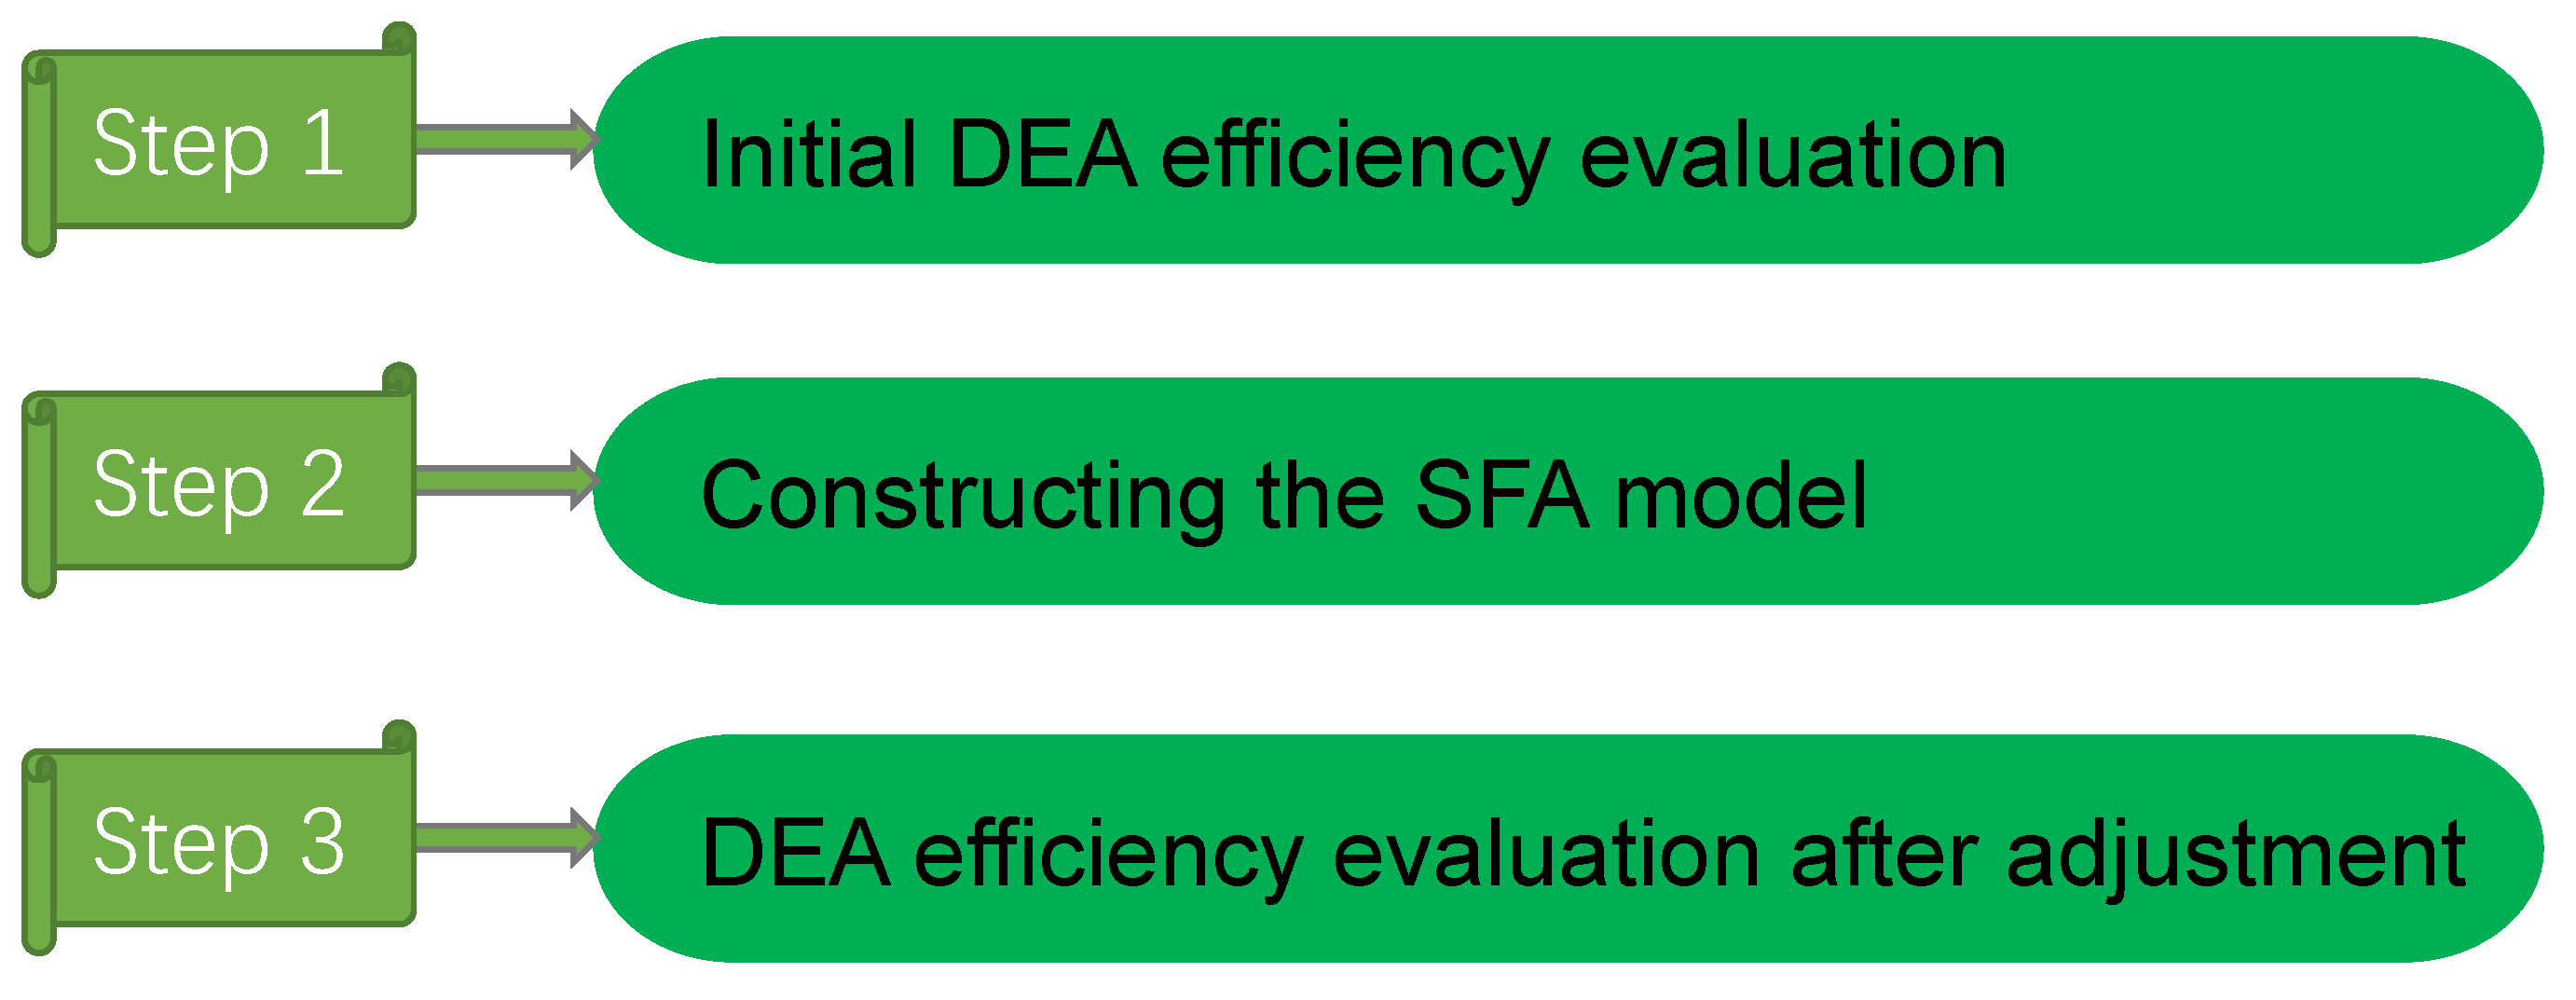
3.1. Three-Stage DEA Model

The influence of arbitrary and environmental factors on the effectiveness of the decision-making unit’s evaluation cannot be entirely eliminated by the conventional DEA model [41]. To ensure that the computed efficiency value more closely reflects the internal management level of the decision-making unit, the three-stage DEA model can simultaneously change the impact of random error and the external environment on efficiency. The three-stage DEA model serves as the foundation for the analysis in this paper. The model has three steps (see Figure 1).
The initial stage is used to determine effectiveness using the conventional DEA method, assessing the initial efficiency using the input–output data. The DEA model has well-defined input orientation and output orientation. Several orientations may be utilized, depending on the particular analytical purpose. To assess the relative efficacy of the same kind of decision-making units, the conventional DEA-CCR model is utilized (DMUs). A target that is located in the same external environment is referred to as a DMU of the same kind. The fundamental premise of the traditional DEA-BCC model is that there are variable returns to scale. This approach further divides the technical efficiency in the CCR model. The combination between scale efficiency and pure technical efficiency results in the original technical efficiency, which is sometimes referred to as comprehensive efficiency. By separating scale efficiency from pure technology efficiency, we may determine the root of the decision-making unit’s inefficiency. The BCC model is the one that was finally chosen for this study since it is usually difficult to put the idea of a perpetual return to scale into practice in actual production operations. The technical efficiency (TIE) in the DEA model may be broken down into pure technical efficiency (PTE) and scale efficiency (SE).
TIE = SE × PTE
The capacity to alter output under the presumption of a specific output is known as technical efficiency. How far economies of scale have been implemented concerning the scale efficiency point is determined by the scale efficiency statistic. Pure technical efficiency is efficiency that does not consider scale factors.
The input-oriented BCC model can be written as: for any decision-making unit,
m i n θ ε e ^ T S + e T S + j = i n λ j X j + S + = θ x 0 j = i n λ j Y j S = Y 0 ,   j = 1 , 2 , , n S + 0 ,   S 0 ,   λ j 0
In Formula (2), j represents different decision-making units; S + , S represent the relaxation variables of input indicators and output indicators, respectively; θ represents the efficiency evaluation value; and λ j represents the weight of the jth decision-making unit. When θ = 1 , and S + = S = 0 , the decision-making unit is effective; when θ = 1 , and S + 0 or S 0 , the decision-making unit is weak and effective. However, when θ < 1 , the decision-making unit is invalid.
In the second stage, we largely concentrate on the efficiency-affecting relaxation factors. The key relaxation variables are statistical noise, environmental factors, and management effectiveness. We divide the aforementioned relaxation variables into the three effects of noise, management, and environment as the main goal of the second phase. The implementation method entails regressing various relaxation factors that were acquired in the first stage to noise and ambient variables using SFA regression. Suppose there are p environmental factors that alter input redundancy, n decision-making units, m inputs per unit, and n environmental factors. This results in the following regression equation being established:
S i k = f i Z K ; β i + v i k + u i k
In Formula (3), i = 1 , 2 , , m , k = 1 , 2 , , n . S i k represents the difference between the ith input of the kth decision-making unit. Z k = [ z 1 k , z 2 k , , z p k ] represents p environment variables, β i is the parameter to be estimated for the environment variable. f i ( Z K ; β i ) represents the impact of environmental variables on the input difference value Sik. v i k + u i k is compound error terms, and v i k is random interference.
Next, we adjust the input of decision-making units through the regression results of SFA. This can reflect the impact of environmental factors and random disturbances of different decision-making units, as shown in Formula (4).
x i k A = x i k + m a x k z k β i ^ z k β i ^ + m a x k v ^ i k v ^ i k
Among them, X i k is the actual value of the ith input item of the kth decision-making unit. i = 1 , 2 , , m , k = 1 , 2 , , n , x i k A is its adjusted value. β i is the estimated value of the environmental variable parameter, and v i k is the estimated value of the random interference term. m a x k z k β i ^ z k β i ^ is used to adjust external environmental factors. m a x k v ^ i k v ^ i k is to put all decision-making units in the same external environment.
The original input variable value is used to replace the modified input variable value in the third stage using a similar SFA regression analysis. When the BCC model is used once more for efficiency estimates, it is possible to calculate the efficiency value without considering random and environmental factors. Efficiency is accurately represented by the efficiency value. Technical management is now the only factor that affects the efficiency number.

3.2. Tobit Model

Compared with other models, the Tobit model is more suitable to solve the problems of limited dependent variables [42]. The specific form of the model is as follows (5):
y i = β T x i + e i if β T x i + e i > y 0 0 other e i N ( 0 , δ 2 ) i = 1 , 2 , , n
In Formula (5), y 0 represents the limit value; x i represents the explanatory variable vector of ( K + 1 ) dimension; and β is an unknown parameter vector in ( K + 1 ) dimension. Its main feature is that the observed values of dependent variables are limited. For example, under certain circumstances, some dependent variables can obtain real observation data or are not limited, and the actual observation values can be used for analysis. However, in another case, the variable is difficult to observe or limited, so the value of the variable needs to be processed if intercepted as 0 or other constants. Therefore, the Tobit model can be expressed as (6):
y i * = a if y i a y i if b > y i > a b if y i b y i = β T x i + e i , e i N ( 0 , δ 2 ) i = 1 , 2 , , n
Based on the findings of numerous academics, this section investigates the factors that affect the technological innovation effectiveness of renewable energy companies. We employ the Tobit regression model, where the independent variable is government subsidies and the dependent variable is the comprehensive technological efficiency calculated in the third stage. The net profit margin on sales, asset-liability ratio, prime operational revenue, employee education level, firm size, and enterprise age are examples of control variables. The coefficients of independent variables are determined by the Tobit regression model to assess the influence and direction of each variable on overall technical efficiency. It should be stressed that the control variables selected in the Tobit regression model must be different from the input variables used in the three-stage DEA model to estimate overall efficiency to distinguish between the impacts of input and environment. The following is how the Tobit regression model is made:
C R S T E i t = α 0 + α 1 G O V i t + α 2 S A L E i t + α 3 D E B T i t + α 4 R E V i t + α 5 H U M i t + α 6 S I Z E i t + α 7 A G E i t + ε i t

4. Data and Indicators

4.1. Data Source

The research object for this article is the renewable energy businesses in A-share listed corporations. 2016 through 2020 is the time frame. The sample data are processed as follows and are taken from the wind database and selected finance terminal: The following steps are taken: (1) if the sample company has missing data, the sample is deleted; (2) choose non-ST renewable energy listed companies as the research object; (3) perform tail reduction processing on the sample data to remove the negative effects of outliers; (4) process the sample as the balance panel data for DEA analysis. After processing, 315 A-share listed renewable energy businesses yielded a total of 1575 samples.

4.2. Indicators Selection

4.2.1. Output Variables

Economic production and the results of scientific research have been chosen as output indicators. The number of patents awarded to publicly traded corporations is used in this study. The growth in patents is one indication of how renewable energy companies’ technological innovation efficiency has improved. As a result, the number of patents held by publicly traded companies is chosen as the indicator of technological innovation in renewable energy businesses. This report also incorporates the growth of intangible assets. Patents and copyrights are examples of intangible assets that have been developed as a result of enterprise technology development operations, and they are essential for demonstrating the fundamental competitiveness of renewable energy enterprises. However, in addition to patent output, non-patent technological innovation output should also be considered for enterprise technological development achievements. Therefore, the increase in intangible assets is selected as another output variable of technological innovation activities.

4.2.2. Input Variables

Investment in enterprise R&D and human resources are chosen as input indicators. It should be noted that the input indicators are chosen to lag the first-order term due to the lag of the impact of input on output. The number of employees working on R&D projects within the organization is used in this paper. The resources for scientific and technical abilities are essential in activities involving innovation in science and technology. One of the key components to enhancing an organization’s capacity for innovation is its R&D workforce. Renewable energy is a knowledge-intensive industry, making human resources for enterprise R&D essential. One of the study’s input elements is the amount of R&D personnel. Moreover, this report incorporates enterprise R&D investment. The complexity of technological innovation gradually rises as a result of the technology’s rapid progress and the current thinking impasse, which forces businesses to spend more money on R&D. An additional input variable will be the enterprise R&D investment index.

4.2.3. External Environmental Variables

When calculating the effectiveness of input–output, it is affected by environmental factors. As a result, environmental considerations must be taken into account while evaluating the technical innovation effectiveness of renewable energy firms. This paper uses three variables as environmental factors: foreign trade dependence (Tra), industrial structure (Ind), and local science and technology expenditure (Tec).
The percentage of total imports and export in a region’s GDP is known as “dependence on foreign trade” (Tra). The entire number of imports and exports is a good indicator of the region’s degree of innovation, market activity, and economic growth.
The industrial structure is represented by the secondary industry’s proportion of the GDP (Ind). The creation of an inventive market environment that supports technological innovation in businesses is more advantageous as the industrial economy develops.
The local scientific and technology expenditure (Tec) is what is referred to as local. The degree of local government innovation assistance for businesses using renewable energy increases with the level of research and technology spending, which encourages business technological innovation.

4.2.4. Influencing Factors of Technological Innovation Efficiency

The effectiveness of technological innovation will be impacted by a variety of internal and external elements, according to the empirical study experience of previous forerunners. The government subsidies of listed businesses, net profit margin, debt asset ratio, prime operational revenue, employee education level, enterprise size, and enterprise age are all included in the regression model for the empirical test to confirm the validity of the study findings. Detailed definitions are provided in Table 1 below. Table 2 displays the descriptive statistics for the samples.

5. Efficiency Analysis of Technological Innovation Efficiency of China’s Renewable Energy Enterprises

5.1. Renewable Energy Enterprises’ Overall Technological Innovation Efficiency

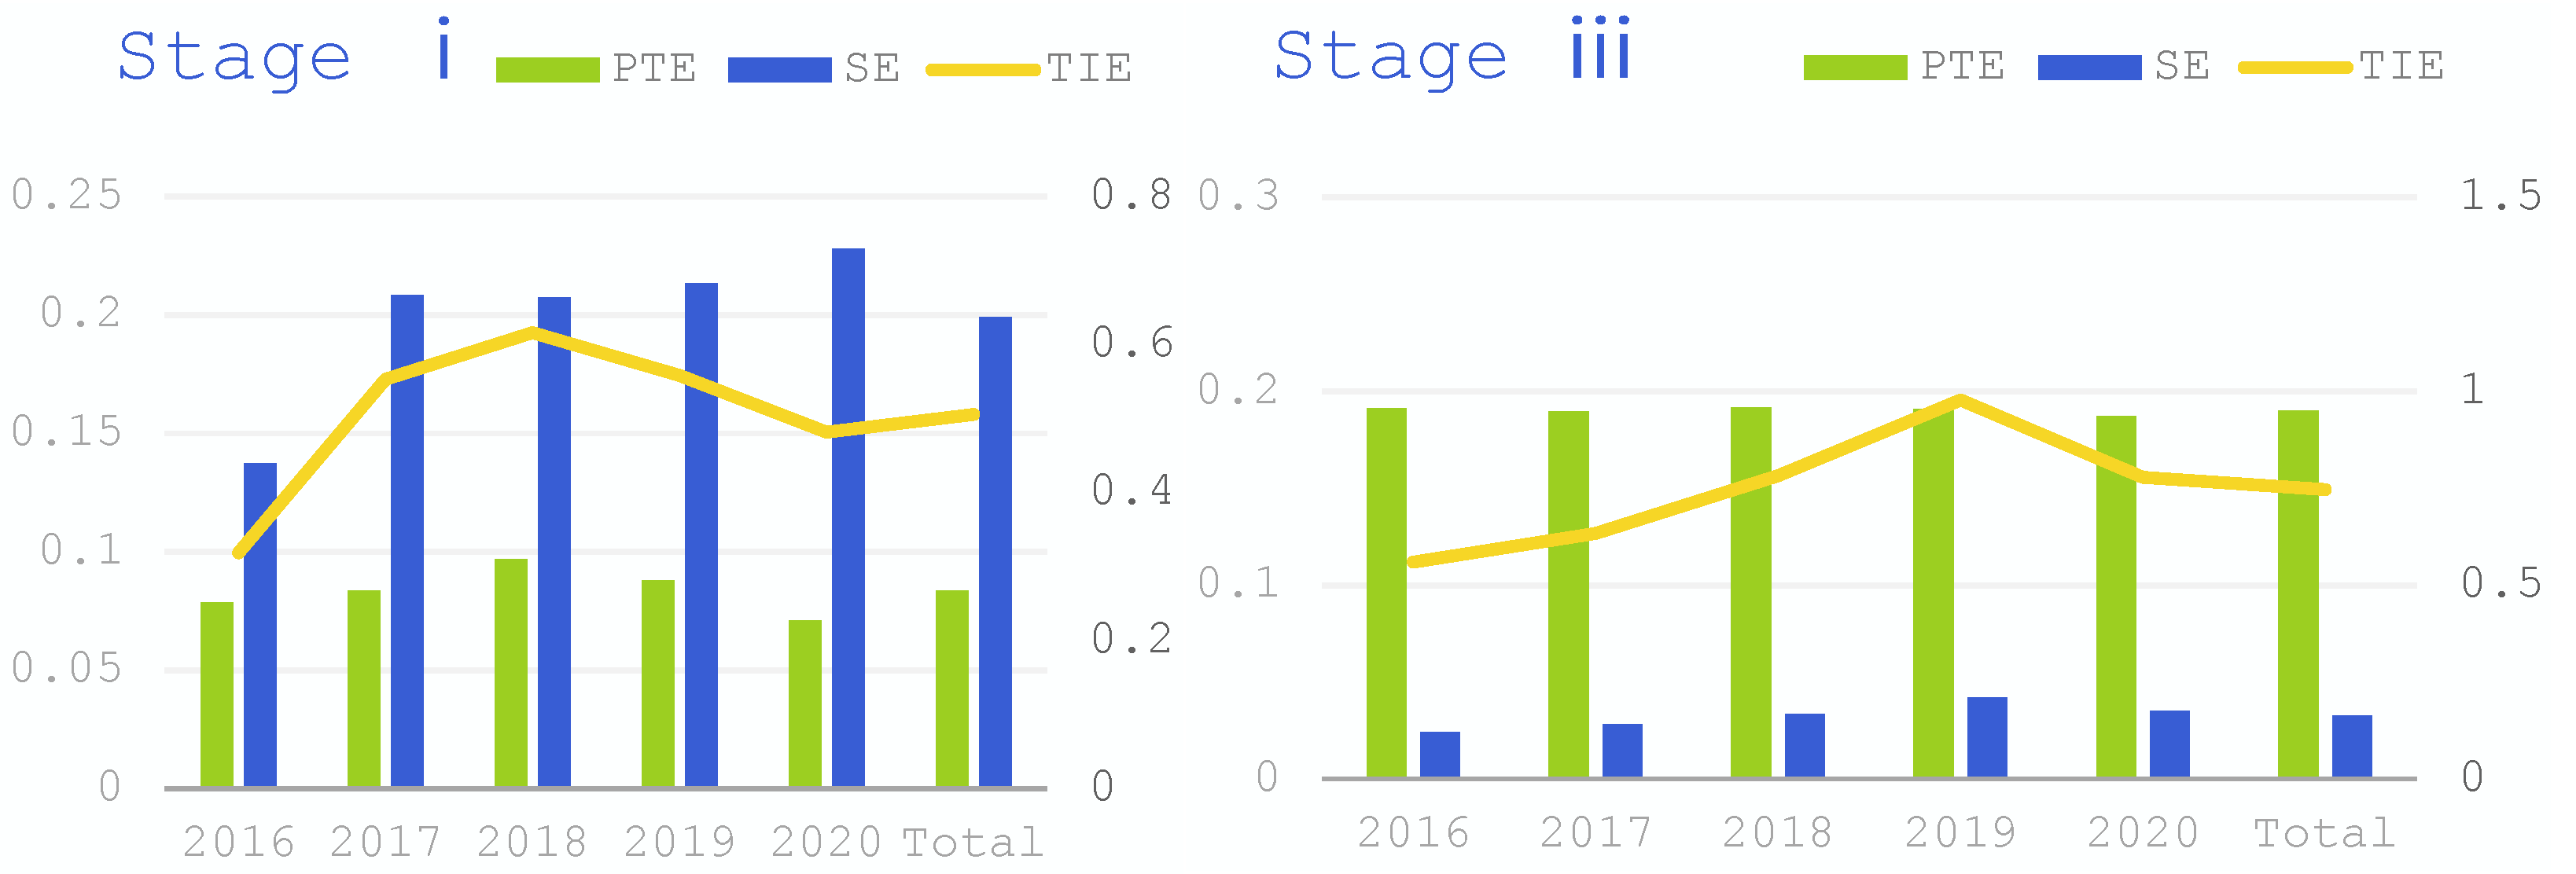
5.1.1. Initial DEA Efficiency Evaluation

Software called DEAP 2.1 is used in the first stage of the three-stage DEA technique. Secondly, we determine the total technical efficiency value of renewable energy companies, which reflects the value of efficient resource allocation. The total technical efficiency is the scale efficiency multiplied by the pure technical efficiency. Based on current technologies and resources, pure technical efficiency refers to the output capacity of renewable energy businesses. The extent to which scale level fosters the growth of renewable energy businesses is measured by scale efficiency (see Figure 2).

5.1.2. The Effects of External Environmental Variables on TIE

Dependence on international trade, industrial structure, and expenditure on local research and technology are considered independent factors. The SFA model is also established, with the dependent variables being the financial resource relaxation variable and the human resource relaxation variable. Table 3 displays the findings of the analysis.
According to Table 3, there is input inefficiency in the mixed error term of the SFA analysis model, and the three environmental variables have a significant impact on the input redundancy of renewable energy enterprises. The coefficient significance level of the three environmental variables on the two input relaxation variables is higher than 1%. The results of the LR one-sided likelihood ratio test indicate that the model has a composite structure since they are larger than the crucial threshold of 1%. It demonstrates that the constructed model more accurately models the production function and that environmental factors and unpredictability have a substantial impact on the technical innovation efficiency of renewable energy businesses.
The following inferences may be made based on how environmental factors affect relaxation factors.
(1)
The variable of human resource relaxation is significantly negatively impacted by the degree of dependency on foreign trade (Tra), demonstrating that the degree of dependence on foreign trade is favorable to the effective level of human resources. The variable of financial resource relaxation is significantly negatively impacted by the degree of reliance on foreign trade, demonstrating that the amount of reliance on international trade is favorable to the actual level of financial resources.
(2)
The relationship between industrial structure (Ind) and human resource relaxation variables shows that an industrial structure is advantageous to the effective level of human resources. This shows that the effective level of financial resources, which is advantageous to the relaxation of industrial structure, has a significant negative impact on industrial structure.
(3)
Local science and technology expenditures (Tec) have a significant positive impact on human resource relaxation variables, demonstrating the waste of human resources caused by these expenditures; they also have a significant positive impact on financial resource relaxation variables, illustrating the waste of financial resources caused by these expenditures.
According to the analysis, the three environmental factors significantly affect the two input variables. As a result, the computed efficiency value will be erroneous if the input–output efficiency value is determined directly without taking the effect of environmental conditions into account. In other words, the input variables need to be changed by taking environmental factors into account because the DEA findings from the first stage are not correct. This can guarantee that listed renewable energy businesses are calculating input–output efficiency in the same environment. The third stage DEA approach may then be used to calculate the technical innovation efficiency of renewable energy firms. The adjustment method of input variables is to separate the erroneous rate term using SFA.

5.1.3. The DEA Efficiency Evaluation after Using Adjustment Variables

The environmental and random disturbance components are divided into the input variables for the second stage of DEA. We apply the DEA approach to examine the technical innovation efficiency of renewable energy firms using the adjusted human resources and financial resources as input variables. The efficiency figure after correction is significantly different from it.
Chinese renewable energy companies have relatively poor overall technological efficacy (see Figure 3). The comprehensive technical efficiency of enterprises rose from 0.112 in 2016 to 0.196 in 2019, and it dropped to 0.156 in 2020. The average from 2016 to 2020 was only 0.149.
Businesses that use renewable energy have better pure technical efficiency. Pure technical efficiency has a mean value greater than 0.900. Enterprises using renewable energy have poor scaling efficiency. The scale efficiency of enterprises rose from 0.122 in 2016 to 0.210 in 2019 and then dropped to 0.177 in 2020. The average value from 2016 to 2020 was only 0.164.
Overall, China’s renewable energy firms have less comprehensive technical innovation efficiency than they had before the adjustment (see Figure 2). While the scale efficiency is much less than it was before the change, the pure technical efficiency is significantly better. This demonstrates how strongly environmental factors affect businesses that use renewable energy. Figure 3 displays the total technical effectiveness of renewable energy businesses in the first and third stages.

5.2. Renewable Energy Enterprises’ Technological Innovation Efficiency in Each Province

The total technical innovation efficiency of renewable energy firms is higher in Xinjiang, Shaanxi, and Chongqing than in other areas. In particular, Xinjiang ranks first; the last three are Guangxi, Heilongjiang, and Ningxia, with comprehensive technical efficiency of only 0.032, 0.021, and 0.015, respectively. There is not a significant overall efficiency difference between renewable energy businesses in other jurisdictions (see Figure 4).
The three areas’ overall technical efficacy has increased from 2016 to 2019. There is a minor declining tendency in all three regions through the year 2020. Overall, the western area has a greater comprehensive technological efficiency than the central region, while the central region has a higher comprehensive technical efficiency than the eastern region. Nevertheless, by 2020, the rankings had altered. The central area had more overall technological efficiency than the western region (see Figure 5).

5.3. Study of the Elements That Affect the Innovation Efficiency of Renewable Energy Firms

The adjusted complete technical efficiency of renewable energy firms is discovered through the third step of the DEA analysis. In this part, we investigate the variables influencing the technical innovation effectiveness of renewable energy enterprises using the panel Tobit model.
We picked the independent variable of the current term and the dependent variable before the first term due to the lag impact of the independent variable on the overall technical efficiency of renewable energy firms. The projected outcomes of the panel Tobit model for the effect of the technological efficiency of renewable energy businesses are shown in Table 4.
The independent variables in the model (1) include government subsidy (Gov), the net profit margin on sales (Sale), asset-liability ratio (Debt), and prime operating revenue (Rev). On the basis of model (1), model (2) adds the independent variables of employee education level (Hum), enterprise Size (Size), and enterprise Age (Age); LR tests of the two models are strongly rejected “ H 0 : σ u = 0 ”. As a result, it is believed that there is an individual impact, making panel Tobit regression with random effect appropriate. The model’s overall significance p value with the addition of the control variables is 0.000, indicating that the model is statistically significant.
According to the model’s estimation results, government subsidies that are bigger in quantity encourage technological innovation in renewable energy businesses. The comprehensive technical efficiency of renewable energy enterprises has increased as a result of increases in prime operating revenue, enterprise size, employee education, and enterprise age. On the other hand, the comprehensive technical efficiency of renewable energy enterprises has decreased as a result of increases in asset-liability ratio and asset-liability ratio, respectively.

6. Robustness Test

Due to the epidemic’s effects, the company’s operations and output in 2020 are abnormally impacted. For a robustness test, the data for 2020 are thus removed. Table 5 displays the model’s expected outcomes.
The model’s p-value is 0.000, which denotes that it is statistically significant. According to the model’s estimate findings, the results in Table 3 and the estimation results are essentially equivalent. The conclusion is strong as a result.

7. Conclusions and Policy Implications

We assess the technological innovation capabilities of renewable energy businesses using the three-stage DEA methodology. Based on this framework, we assess the Tobit model’s predictions of the elements influencing technological innovation’s efficacy. By performing an empirical examination of technological innovation efficiency and its impacting factors, we may identify the advantages and disadvantages of businesses engaged in technological innovation. The main conclusions are as follows.
Overall, China’s renewable energy firms have a poor rate of technological innovation. Scale efficiency has an average value that is much higher than pure technical efficiency. The poor pure technical efficiency is currently the main cause of the low comprehensive efficiency. This shows how more technical innovation promotion is required to further China’s growth of renewable energy. The development of the renewable energy industry depends on the improvement of science and technology. Technology innovation is the primary driver of the growth of renewable energy enterprises. Increasing technological efficiency should be a top priority for companies that use renewable energy. Through technological innovation, businesses should reduce resource waste and improve resource allocation.
Judging from the difference in research results with other researchers, the technical efficiency of Chinese renewable energy companies is less than it was before to adjustment. It demonstrates that environmental factors have a significant impact on these organizations’ ability to innovate technologically. The technical efficacy of publicly listed renewable energy enterprises was overestimated due to disregard for environmental issues.
According to temporal evolution features, the overall technical efficacy of renewable energy firms in China’s eastern, central, and western regions fluctuated higher from 2016 to 2019 before starting to modestly drop in 2020. Before 2019, the western region’s overall technological efficiency of renewable energy firms consistently scored first from the perspective of regional features. In addition, there is a disparity in the technical efficiency of renewable energy companies throughout all provinces. The majority of provinces still have a lot of room to improve the efficacy of renewable energy innovation, as seen by the fact that most of them have not yet reached 0.5. Inter-provincial cooperation has to be strengthened to promote the balanced and thorough growth of renewable energy.
To improve interaction and collaboration, each region should take advantage of its regional advantages in terms of resource endowment. According to the panel Tobit model’s estimation results, government support is important in encouraging technological innovation among renewable energy businesses. The government should consider how money is allocated while granting pertinent preferential policies to maximize resource usage and create a knowledge-intensive and technology-intensive industry around renewable energy. The government can enhance the system for technological and scientific innovation as well as the process for safeguarding talent.

8. Limitations and Directions for Future Research

8.1. Limitations

Future research will need to address several remaining issues and flaws in the research process of efficient renewable energy technology creation. This study first uses the three-stage DEA model to evaluate the technical innovation performance of renewable energy enterprises. Owing to the circumstances, only one analytical theory is used in this research. Moreover, due to energy restrictions, our research solely examines the effectiveness of technical innovation from the standpoint of commercial renewable energy. The article does not specifically study the technical innovation of each specific renewable energy. There may be some differences in solar energy, hydro energy, wind energy, and thermal energy. In addition, this study examines the technological innovation and efficient consumption of renewable energy. Other factors such as the demand and consumption of renewable energy also need to be considered.

8.2. Directions for Future Research

In the future, we can consider combining the DEA theory with the Malmquist Productivity Index to more completely examine the development pattern and characteristics of the effectiveness of technical innovation of renewable energy enterprises. Second, future research on the success of corporate innovation in renewable energy technologies may be divided from the perspective of different renewable energy business chains. The energy storage industry chain has developed rapidly. Suppliers of components and raw materials are included in its upstream. Batteries, converters, management systems, additional devices, and system integration are available from midstream. Application possibilities for the grid, power consumption, and power generating sides are all included downstream. The capacity to design various assessment index systems and analyze the characteristics of various production connections is essential for improving the overall efficacy of the creation of new renewable energy technologies.

Author Contributions

Writing, Y.C.; supervision, J.S. All authors have read and agreed to the published version of the manuscript.

Funding

This work was jointly funded by Basic scientific research business expenses of Central Universities (JNU12819026).

Institutional Review Board Statement

Not applicable.

Informed Consent Statement

Not applicable.

Data Availability Statement

The data used to support the findings of this study are available from the corresponding author upon request.

Acknowledgments

The authors appreciate the support from Dongguk University.

Conflicts of Interest

The authors declare that there are no conflict of interest regarding the publication of this article.

References

  1. Madurai Elavarasan, R.; Afridhis, S.; Vijayaraghavan, R.R.; Subramaniam, U.; Nurunnabi, M. SWOT analysis: A framework for comprehensive evaluation of drivers and barriers for renewable energy development in significant countries. Energy Rep. 2020, 6, 1838–1864. [Google Scholar] [CrossRef]
  2. Fan, J.-L.; Zhang, Y.-J.; Wang, B. The impact of urbanization on residential energy consumption in China: An aggregated and disaggregated analysis. Renew. Sustain. Energy Rev. 2017, 75, 220–233. [Google Scholar] [CrossRef]
  3. Pukšec, T.; Leahy, P.; Foley, A.; Markovska, N.; Duić, N. Sustainable development of energy, water and environment systems 2016. Renew. Sustain. Energy Rev. 2018, 82, 1685–1690. [Google Scholar] [CrossRef]
  4. Chang, S.J. Solving the problem of carbon dioxide emissions. For. Policy Econ. 2013, 35, 92–97. [Google Scholar] [CrossRef]
  5. Godil, D.I.; Sharif, A.; Ali, M.I.; Ozturk, I.; Usman, R. The role of financial development, R&D expenditure, globalization and institutional quality in energy consumption in India: New evidence from the QARDL approach. J. Environ. Manag. 2021, 285, 112208. [Google Scholar]
  6. Wang, Q.; Dong, Z.; Li, R.; Wang, L. Renewable energy and economic growth: New insight from country risks. Energy 2022, 238, 122018. [Google Scholar] [CrossRef]
  7. Inglesi-Lotz, R. The impact of renewable energy consumption to economic growth: A panel data application. Energy Econ. 2016, 53, 58–63. [Google Scholar] [CrossRef] [Green Version]
  8. Vivas, F.J.; De las Heras, A.; Segura, F.; Andújar, J.M. A review of energy management strategies for renewable hybrid energy systems with hydrogen backup. Renew. Sustain. Energy Rev. 2018, 82, 126–155. [Google Scholar] [CrossRef]
  9. Gallagher, J.; Basu, B.; Browne, M.; Kenna, A.; McCormack, S.; Pilla, F.; Styles, D. Adapting Stand-Alone Renewable Energy Technologies for the Circular Economy through Eco-Design and Recycling. J. Ind. Ecol. 2017, 23, 133–140. [Google Scholar] [CrossRef] [Green Version]
  10. He, J.; Li, Z.; Zhang, X.; Wang, H.; Dong, W.; Chang, S.; Ou, X.; Guo, S.; Tian, Z.; Gu, A.; et al. Comprehensive report on China’s Long-Term Low-Carbon Development Strategies and Pathways. Chin. J. Popul. Resour. Environ. 2020, 18, 263–295. [Google Scholar] [CrossRef]
  11. Zhang, W.; Wang, Z.; Adebayo, T.S.; Altuntaş, M. Asymmetric linkages between renewable energy consumption, financial integration, and ecological sustainability: Moderating role of technology innovation and urbanization. Renew. Energy 2022, 197, 1233–1243. [Google Scholar] [CrossRef]
  12. Godil, D.I.; Yu, Z.; Sharif, A.; Usman, R.; Khan, S.A.R. Investigate the role of technology innovation and renewable energy in reducing transport sector CO2 emission in China: A path toward sustainable development. Sustaina. Dev. 2021, 29, 694–707. [Google Scholar] [CrossRef]
  13. Wang, Y.; Pan, J.F.; Pei, R.M.; Yi, B.W.; Yang, G.L. Assessing the technological innovation efficiency of China’s high-tech industries with a two-stage network DEA approach. Socio-Econ. Plan. Sci. 2020, 71, 100810. [Google Scholar] [CrossRef]
  14. Chen, X.; Liu, X.; Wu, Q.; Deveci, M.; Martínez, L. Measuring technological innovation efficiency using interval type-2 fuzzy super-efficiency slack-based measure approach. Eng. Appl. Artif. Intell. 2022, 116, 105405. [Google Scholar] [CrossRef]
  15. Shen, T.; Chen, H.H.; Zhao, D.H.; Qiao, S. Examining the impact of environment regulatory and resource endowment on technology innovation efficiency: From the microdata of Chinese renewable energy enterprises. Energy Rep. 2022, 8, 3919–3929. [Google Scholar] [CrossRef]
  16. Ali, A.; Tufa, R.A.; Macedonio, F.; Drioli, E. Membrane technology in renewable-energy-driven desalination. Renew. Sustain. Energy Rev. 2018, 81, 1–21. [Google Scholar] [CrossRef]
  17. Tang, Z.; Yang, Y.; Blaabjerg, F. Power electronics: The enabling technology for renewable energy integration. CSEE J. Power Energy Syst. 2022, 8, 39–52. [Google Scholar]
  18. Ali, S.A.; Alharthi, M.; Hussain, H.I.; Rasul, F.; Hanif, I.; Haider, J.; Ullah, S.; Rahman, S.U.; Abbas, Q. A clean technological innovation and eco-efficiency enhancement: A multi-index assessment of sustainable economic and environmental management. Technol. Forecast. Soc. Chang. 2021, 166, 120573. [Google Scholar] [CrossRef]
  19. Galindo, M.-É; Mández, M.-T. Entrepreneurship, economic growth, and innovation: Are feedback effects at work? J. Bus. Res. 2014, 67, 825–829. [Google Scholar] [CrossRef]
  20. Willoughby, K.W.; Mullina, N. Reverse innovation, international patenting and economic inertia: Constraints to appropriating the benefits of technological innovation. Technol. Soc. 2021, 67, 101712. [Google Scholar] [CrossRef]
  21. Yuan, C, Liu, S, Wu, J. Research on energy-saving effect of technological progress based on Cobb–Douglas production function. Energy Policy 2009, 37, 2842–2846. [Google Scholar] [CrossRef]
  22. Weisser, D. On the economics of electricity consumption in small island developing states: A role for renewable energy technologies? Energy Policy 2004, 32, 127–140. [Google Scholar] [CrossRef]
  23. Xia, K.; Guo, J.; Han, Z.; Dong, M.; Xu, Y. Analysis of the scientific and technological innovation efficiency and regional differences of the land–sea coordination in China’s coastal areas. Ocean Coast. Manag. 2019, 172, 157–165. [Google Scholar] [CrossRef]
  24. Xi, X.; Xi, B.; Miao, C.; Yu, R.; Xie, J.; Xiang, R.; Hu, F. Factors influencing technological innovation efficiency in the Chinese video game industry: Applying the meta-frontier approach. Technol. Forecast. Soc. Chang. 2022, 178, 121574. [Google Scholar] [CrossRef]
  25. Fritsch, M. Cooperation and the efficiency of regional R&D activities. Camb. J. Econ. 2004, 28, 829–846. [Google Scholar]
  26. Xu, S.; Lu, B.; Yue, Q. Impact of sci-tech finance on the innovation efficiency of China’s marine industry. Mar. Policy 2021, 133, 104708. [Google Scholar]
  27. Wang, Y.; Li, J.; Zhong, S. Analysis on the innovation efficiency of China’s electronic and communication equipment industry. J. Radiat. Res. Appl. Sci. 2022, 15, 111–121. [Google Scholar] [CrossRef]
  28. Fan, F.; Lian, H.; Wang, S. Can regional collaborative innovation improve innovation efficiency? An empirical study of Chinese cities. Growth Chang. 2020, 51, 440–463. [Google Scholar] [CrossRef]
  29. Deng, G.; Li, L.; Song, Y. Provincial water use efficiency measurement and factor analysis in China: Based on SBM-DEA model. Ecol. Indic. 2016, 69, 12–18. [Google Scholar] [CrossRef]
  30. Im, C.H.; Cho, K.T. Comparing and Identifying Influential Factors of Technological Innovation Efficiency in Manufacturing and Service Industries Using DEA: A Study of SMEs in South Korea. Sustainability 2021, 13, 12945. [Google Scholar] [CrossRef]
  31. Wang, J.; Han, D.; Wang, Y. Empirical research on innovation efficiency in China based on SFA model. IOP Conf. Ser. Earth Environ. Sci. 2020, 474, 072055. [Google Scholar] [CrossRef]
  32. Zeng, G.; Guo, H.; Geng, C. A five-stage DEA model for technological innovation efficiency of China’s strategic emerging industries, considering environmental factors and statistical errors. Pol. J. Environ. Stud. 2021, 30, 927–941. [Google Scholar] [CrossRef] [PubMed]
  33. Piao, Z.; Miao, B.; Zheng, Z.; Xu, F. Technological innovation efficiency and its impact factors: An investigation of China’s listed energy companies. Energy Econ. 2022, 112, 106140. [Google Scholar] [CrossRef]
  34. Zhang, C.; Chen, P. Applying the three-stage SBM-DEA model to evaluate energy efficiency and impact factors in RCEP countries. Energy 2022, 241, 122917. [Google Scholar] [CrossRef]
  35. Aytekin, A.; Ecer, F.; Korucuk, S.; Karamaşa, Ç. Global innovation efficiency assessment of EU member and candidate countries via DEA-EATWIOS multi-criteria methodology. Technol. Soc. 2022, 68, 101896. [Google Scholar] [CrossRef]
  36. Lin, B.; Luan, R. Do government subsidies promote efficiency in technological innovation of China’s photo-voltaic enterprises? J. Clean. Prod. 2020, 254, 120108. [Google Scholar] [CrossRef]
  37. Chutiphongdech, T.; Vongsaroj, R. Technical efficiency and productivity change analysis: A case study of the regional and local airports in Thailand. Case Stud. Transp. Policy 2022, 10, 870–890. [Google Scholar] [CrossRef]
  38. Cao, S.; Feng, F.; Chen, W.; Zhou, C. Does market competition promote innovation efficiency in China’s high-tech industries? Technol. Anal. Strateg. Manag. 2019, 32, 429–442. [Google Scholar] [CrossRef]
  39. Wu, D.; Wang, Y.; Qian, W. Efficiency evaluation and dynamic evolution of China’s regional green economy: A method based on the Super-PEBM model and DEA window analysis. J. Clean. Prod. 2020, 264, 121630. [Google Scholar] [CrossRef]
  40. Sharma, S.; Thomas, V.J. Inter-country R&D efficiency analysis: An application of data envelopment analysis. Scientometrics 2008, 76, 483–501. [Google Scholar]
  41. Bojnec, Š.; Latruffe, L. Measures of farm business efficiency. Ind. Manag. Data Syst. 2008, 108, 258–270. [Google Scholar] [CrossRef]
  42. Wang, Z.; Wang, X. Research on the impact of green finance on energy efficiency in different regions of China based on the DEA-Tobit model. Resour. Policy 2022, 77, 102695. [Google Scholar] [CrossRef]
Figure 1. The flowchart of three-stage DEA.
Sustainability 15 06342 g001
Figure 2. The average technical efficiency score for renewable energy in stage i and stage iii from 2016 to 2020.
Sustainability 15 06342 g002
Figure 3. Comparison of TIE in stage i and iii from 2016 to 2020.
Sustainability 15 06342 g003
Figure 4. The technological innovation efficiency of renewable energy enterprise in each province.
Sustainability 15 06342 g004
Figure 5. Different regional renewable energy enterprises’ technological innovation efficiency in China.
Sustainability 15 06342 g005
Table 1. Definitions of all variables.
ModelsVariablesAbbreviationIndicatorsDefinitions
Three-stage
DEA model
Output
variables
RdoScientific research outputNumber of patents granted to the company each year
MonEconomic outputIncrease in intangible assets
Input
variables
PeoTechnical personnel inputThe total number of technical professionals employed annually
RdiR&D capital inputThe total R&D investment
Tobit modelExternal
environmental
variables
TraForeign trade dependencePercentage of regional GDP attributable to total import and export volume
IndIndustrial structureProportion of secondary Industry in GDP
TecLocal science and technology expenditureLocal science and technology expenditure
influencing
factors
GovGovernment subsidyGovernment subsidies/operating income
SaleNet profit marginNet profit/operating income
DebtDebt asset ratioTotal liabilities/total assets
RevPrime operating revenueln(Prime operating revenue)
HumEducation level of employeesNumber of people with at least a bachelor’s degree/total population
SizeEnterprise scaleFinal asset natural logarithm for the business
AgeEnterprise ageCurrent year - the year the company was founded
Table 2. Descriptive statistics.
VariableObsMeanStd. dev.MinMax
PEO15751033.8112423.4222817,917
RDI157537,059.1795,201.89532.24734,700.5
RDO1575130.386277.65912056
MON157513,177.4636,234.220248,527.3
TRA157545.32725.8625.771100.408
IND157539.5647.35715.96748.718
TEC1575423.747305.09232.071168.79
CRSTE15750.1490.1930.0011
GOV15750.0130.01500.083
SALE15750.0510.124−0.6570.283
DEBT15750.4650.1690.0940.848
REVE157522.0841.30619.27525.884
HUM15750.3950.23700.971
ACAD15750.0860.12400.5
SIZE157522.721.18120.41226.438
AGE157520.9985.1371137
Table 3. The regression results of external environmental factors on the slack of input variables.
VariableHuman Resource Slack VariableFinancial Resource Relaxation Variable
Constant term138.064 ***26,434.912 ***
Tra−7.054 ***−241.033 ***
Ind−12.333 ***−878.861 ***
Tec0.542 ***13.181 ***
Sigma Squared5,540,178.74,799,282,500
Gamma0.8680.736
Likelihood−13,186.222−18,963.107
LR1326.188705.589
Note: *** represents significance levels of 1%.
Table 4. Estimation results of Tobit model.
F.crsteModel (1)Model (2)
Gov1.923 ***1.499 ***
(5.983)(4.697)
Sale−0.025−0.039
(−0.813)(−1.265)
Debt−0.078 **−0.140 ***
(−2.090)(−3.741)
Rev0.100 ***0.040 ***
(18.278)(3.884)
Hum 0.002
(0.110)
Size 0.081 ***
(6.949)
Age 0
(0.389)
cons−2.041 ***−2.509 ***
(−17.687)(−19.673)
N12601260
chi2383.011479.382
p0.0000.000
Note: *** and ** represent significance levels of 1% and 5%, respectively. t statistics in parentheses.
Table 5. The robustness test results.
F.crsteModel (1)Model (2)
Gov2.338 ***1.888 ***
(6.557)(5.327)
Sale−0.028−0.049
(−0.698)(−1.216)
Debt−0.071 *−0.135 ***
(−1.710)(−3.243)
Rev0.107 ***0.043 ***
(17.684)(3.785)
Hum −0.013
(−0.544)
Size 0.083 ***
(6.375)
Age 0.001
(1.077)
cons−2.187 ***−2.646 ***
(−17.391)(−18.870)
N945945
chi2382.177457.978
p0.0000.000
Note: *** and * represent significance levels of 1% and 10%, respectively. t statistics in parentheses.
Disclaimer/Publisher’s Note: The statements, opinions and data contained in all publications are solely those of the individual author(s) and contributor(s) and not of MDPI and/or the editor(s). MDPI and/or the editor(s) disclaim responsibility for any injury to people or property resulting from any ideas, methods, instructions or products referred to in the content.

