Abstract
Green travel can decrease energy consumption and air pollution. Many cities in China have implemented measures encouraging residents to take public transport, ride bicycles, or walk. However, non-green travel is still popular in some northern cities due to prolonged cold weather. In order to understand the characteristics of green travel and its use by urban residents in Heilongjiang Province, a typically cold region, this study conducted traffic surveys in 13 cities in Heilongjiang Province. Through investigation and calculation of the data, we obtained key indicators such as the share rate of motorized travel for public transit and the satisfaction derived from green travel. According to the results of the data analysis, green energy buses are becoming increasingly popular in most cities in Heilongjiang Province. However, green travel infrastructure has failed to be updated on time, resulting in low satisfaction with travel in some cities, especially in terms of the waiting environment in winter. Results indicate the level of exploration and development of green transportation resources significantly differed across cities in Heilongjiang Province. By implementing targeted policies such as developing NEBs, obsoleting TEBs and old NEBs, and optimizing the bus network, old industrial cities can be reinvigorated. This will support governmental decisions and contribute to reducing carbon emissions.
1. Introduction
In recent years, environmental pollution, climate change, and sustainable transportation have attracted more and more attention globally. As some developing countries have not yet achieved the carbon peak target, these governments have initiated a series of carbon-reducing activities. China has also actively responded to the call and has formulated the carbon peak target for 2030. Various trades and sectors have correspondingly laid down carbon-reducing programs.
Carbon emissions in the transportation sector have dramatically increased with the acceleration of motorization in China, accounting for about 16% of total carbon emissions [1]. While the convenience and efficiency of cars are enjoyable, we also have to bear the traffic jams, air pollution, and ecological damage resulting from their frequent use. For a higher quality of life, more and more governments have focused on the passive impacts of transportation on the ecological environment. Consequently, hybrid electric vehicles and electric vehicles are widely used in passenger and freight transport.
In order to achieve the carbon peak goal of 2030, it is essential to promote green travel. Green travel is the use of travel methods that have a low environmental impact. It not only saves energy, improves energy efficiency, and reduces pollution, but also contributes to a healthy and efficient way of travel. People are encouraged to take more buses, subways, cooperative rides, eco-friendly driving, or public transportation, such as walking and cycling. Many cities have begun to gradually promote green travel.
In addition to the promotion and use of low-carbon fuel vehicles, some cities encourage individuals to choose green travel, such as the use of public transport, walking, and cycling. Some green travel demonstration cities have come into being. These cities have a better incentive mechanism, higher sharing ratio, better developed infrastructure, and a stronger awareness of green travel. However, these demonstration cities are mostly located in warm regions and have a developed public transport system; fewer cold northern cities are involved. Some northeastern cities in China, which experience very cold temperatures in winter, are not suitable for walking and cycling. Therefore, the quantity of electric buses, non-motorized lanes, the satisfaction provided by green travel, etc., in these cities ought to be further explored.
The main motivation of this study is to examine the basic conditions of green travel in cold regions of China. Furthermore, the satisfaction derived from green travel is understood in various cities. The findings of this research will encourage local governments and traffic businesses to take targeted managerial measures.
The remaining content of this paper is organized as follows. Firstly, previous related research is reviewed. Then, the data resource, questionnaire design, data collection methods, and estimated indicators are introduced. The data analysis, the main part of this paper, reveals the findings from the cities involved. Finally, some measures are presented to improve green travel.
2. Review of the Literature
In order to decrease carbon emissions and alleviate global warming, more and more traffic administrative departments around the world are pushing for the expansion of non-motorized trips. Many scholars have investigated the non-motorized traffic situation and analyzed the influencing factors.
Some researchers have used questionnaires to analyze the choice of green travel. For example, some of them used the natural language processing surveys to evaluate citizens’ satisfaction provided by public transit facilities from 2010 to 2018 in Shanghai, China. Some potential issues were found, and targeted measures were proposed [2]. Other researchers have combined questionnaires and field observation. The participants in one study were asked to wear a head-mounted display and to travel on urban roads. According to the replayed video, they completed the questionnaires after transit. Then, the logit regression model was used to explain the relationship between the cyclists’ satisfaction, traffic conditions, and road characteristics [3]. Generally speaking, the field survey is the most popular means of collecting information in traffic studies, wherein researchers send questionnaires to individuals or families [4].
In addition to conducting traffic surveys, we need to analyze the carbon emissions in transportation. Ma used the model of the United Nations World Tourism Organization to evaluate the carbon emissions from the transportation system in Beijing from 2005 to 2017. It was concluded that passenger traffic per unit GDP was an effective factor that limits the growth of carbon emissions [5]. To accurately model the relationship between the urban transportation system and air pollutants, Jennifer calculated the Integrated Mobile Source Indicator (IMSI) generated using emissions-based ratios. Compared to the traditional calculating methods, the IMSI was more practical for the evaluation of emissions [6]. Some researchers used the URBAIR model to assess the impact of urban planning and traffic management on air quality. In addition, the greenhouse gas generated by the urban traffic was the largest contributor to air pollution [7]. Xu conducted a household survey in Jiangning District, Nanjing, China, to collect travel data. The daily quantity of CO, NOx, and PM2.5 emissions for each household was calculated, and the influencing factors were analyzed. The number of private cars and motorcycles as well as the household income had significant effects on the emissions [8].
As we all know, service quality will affect residents’ travel choices [9]. In particular, green travel infrastructure, such as the network density of public transit and non-motorized lanes, can potentially influence residents’ satisfaction [10]. Based on the multi-objective planning model, Zhang et al. analyzed and studied the traffic structure of Shanghai. They put forward suggestions such as establishing a diversified traffic service system to improve traffic service quality and satisfaction [11]. Their results demonstrated that the quality of traffic facilities was a very important factor that affected traffic satisfaction.
In addition to traditional walking, the popularity of bike sharing in recent years and the introduction of new energy vehicles can provide important assistance in the reduction of carbon emissions. Ma and others analyzed the current technical developments in the new energy vehicle industry in China and put forward constructive opinions [12]. Gao took the main urban area of Guangzhou, China, as an example to investigate the influencing factors of bike sharing. It was found that the service facilities have the most significant impact on the ride destinations in bike sharing, followed by accessibility, land use, and natural environment [13]. Ko and Song studied the minimization of total investment costs, CO2 emissions, and the optimal unit service price of new energy vehicles and developed a sustainable transportation system [14]. Some studies have found that variables related to the physical characteristics of the street were positively correlated with the number of pedestrians, while parking spaces had a negative effect [15]. Based on the passenger flow allocating model of Logit SUE, Zhang and Jia proposed the combined effects of urban bus lines on meeting passengers’ demands [11]. In addition, Yang studied the spatial characteristics of an urban public transit service system using a complex network model. It helped to quantify the role of public transit nodes in the network and optimize the bus stops and routes [16].
There are many other factors affecting residents’ satisfaction and choice of green travel. Joonho and Sugie developed a model based on a social survey in Seoul, South Korea. It was found that the sociodemographic characteristics of passengers significantly influenced their choice of travel modes [17]. Some studies have found that propagating conserved energy, reducing emissions, and a healthy mind could effectively encourage residents to take on walking and cycling [18]. In addition, scientific urban planning and development that considered the promotion of green travel contributed to the shifting of people’s choice from motorized travel to walking and cycling [19]. Anciaes and Jones proposed nine standards for evaluating urban traffic management, including travel quality, travel time, feelings on waiting, and health effects [9]. There are also studies about the relationship between the walking distance, waiting time, in-bus duration, and the satisfaction with public transit [20].
In short, this paper intends to investigate and analyze the development of green travel in Heilongjiang Province, with a view to contributing to low-carbon development in Heilongjiang Province. It is hoped that this could be taken as an example for the implementation of non-motorized trips in other cities in cold zones.
3. Data Research Methods
3.1. Investigation Methods
The field survey and questionnaire survey were applied in this research. We organized investigators to examine the basic information on green travel in 13 cities of Heilongjiang Province. In the questionnaire, we considered the psychological and behavioral factors of the travelers [21]. A small-sample random questionnaire survey was adopted, which was divided into the offline survey and the online survey.
The offline survey was conducted by sending the questionnaires to the residents in the selected areas. At the same time, we conducted the online survey through our circle of friends and group chats. Data were mainly collected using the questionnaire software. Then, we carried out a deep analysis using statistical techniques. Table 1 provides information about the distribution and recovery of the questionnaires.

Table 1.
Quantity and recovery rate for the questionnaires.
The basic part of the data collected includes the number of urban buses and the number of urban transit lines. The urban buses in Heilongjiang Province are mainly composed of new energy buses (NEBs) and traditional energy buses (TEBs). According to a study about the impact of bus electrification on carbon emissions and the actual case of Stockholm, electrical buses are conducive to reducing carbon emissions [22]. Therefore, the number of NEBs and TEBs were obtained from the transportation bureau of the 13 cities in Heilongjiang Province, including Harbin, Daqing, Mudanjiang, Qiqihar, Shuangyashan, Jixi, Hegang, Jiamusi, Qitaihe, Heihe, Suihua, Yichun, and Da Hinggan Ling Prefecture.
Meanwhile, the number of bus lines, the traffic volume of other forms of public transit, the total amount of green travel, and the total amount of urban travel in the 13 cities were also obtained through the transportation bureau. They provide data support for the later investigation and calculation of urban green travel satisfaction.
3.2. Questionnaire Content
The main contents of the questionnaire focused on the following subjects: the amount of public transit travel, the amount of green travel, and the amount of motorized travel. Meanwhile, our questionnaire also included questions about the travel modes of urban residents and the times when they used green travel modes. In order to ensure the accuracy of the questionnaire and the reliability of the statistical data, we placed the questions that would enable us to judge the respondents’ attitude towards the inquiry in the front part of the questionnaire.
3.3. Other Measurement Indexes
In this research, the other indexes of green travel include the average road network density (ARND), urban road area ratio (URR), satisfaction with green travel (SGT), proportion of public transit accounting for motorized travel (PPMT), and proportion of green travel (PGT). The following formulas were used as the basic calculation methods in this survey. The data collected in the previous survey were substituted into each formula. This allowed us to understand the value of every index.
(1) ARND refers to the ratio of the length of the road centerline in the road network of the urban built-up area (RLCN) to the area of the urban built-up area (AUBA).
(2) URR refers to the ratio of the total urban road areas (TURA) to the total urban land areas in the built-up area (TULA).
(3) SGT indicates the proportion of travelers who are satisfied with green travel (TSGT) to the total number of surveyed travelers (TNST).
(4) PPMT indicates the proportion of urban travel using public transit (URPT) to the total motorized trips (TMT).
(5) PGT refers to the amount of green travel (AGT) to the total amount of urban travel (AUR).
4. Results and Discussion
4.1. Public Transit Lines
4.1.1. Number of Urban Buses
The number of buses in the 13 cities in Heilongjiang Province is shown in Table 2.
Table 2.
Number of buses and NEBs in various cities of Heilongjiang Province.
The chart comparing the number of buses and the number of NEBs in 13 cities in Heilongjiang Province is shown in Figure 1.
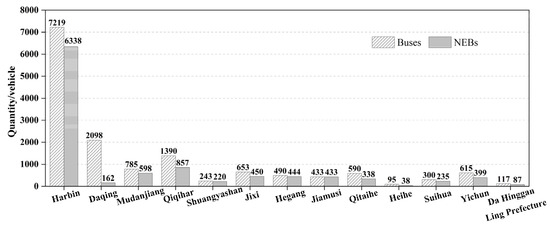
Figure 1.
Comparison of buses and NEBs in various cities in Heilongjiang Province.
As shown in Figure 1, Harbin has the largest number of buses, followed by Daqing. Heihe has the least number of buses. The city with the largest number of NEBs is Harbin, followed by Qiqihar, and the city with the least number of NEBs is Heihe.
Suihua and Jiamusi have the largest proportion of NEBs, reaching 100%, followed by Hegang at 90.61%. The city with the smallest proportion of green energy buses (GEBs) is Daqing, with only 7.72%. The Evaluating Standards of Green Travel Creation Action issued by the Ministry of Transportation of China specify that the proportion of buses with new energy and clean energy in key urban areas accounts for no less than 60%, and no less than 50% in other areas. Except for Heihe and Daqing, the proportion of NEBs in 11 cities is more than 50%, which complies with the Evaluating Standards of Green Travel Creation Action. Therefore, NEBs have gradually replaced traditional buses as the main type of urban buses in Heilongjiang Province in response to the promotion of green travel. The proportion of NEBs in 13 cities in Heilongjiang Province is shown in Figure 2.
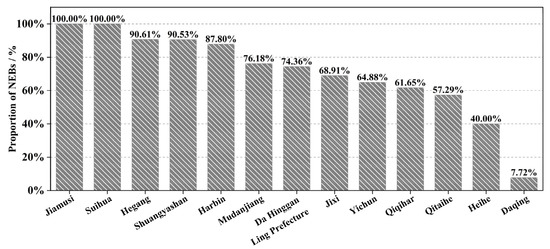
Figure 2.
Proportion of NEBs in 13 cities in Heilongjiang Province.
4.1.2. Number of Public Transit Lines
The number of public transit lines was provided by the transportation bureau of 13 cities in Heilongjiang Province, as shown in Figure 3.
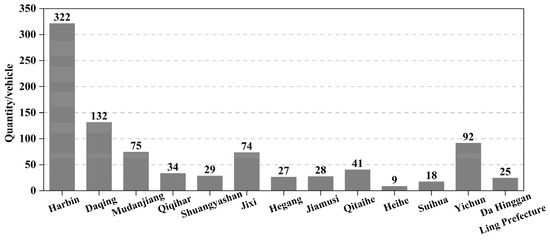
Figure 3.
Comparison of bus routes in various cities in Heilongjiang Province.
The city with the largest number of bus lines in Heilongjiang is Harbin, with a total of 322 lines, followed by Daqing, Yichun, and Mudanjiang. The city with the least number of bus lines is Heihe, with a total of nine lines. It can be seen that the number of buses is unbalanced. This is related to the size of the urban population.
4.1.3. Distribution of Public Transit Lines
According to the related research, the optimal design of urban bus lines can increase travel efficiency and reduce traffic emissions [23]. We investigated the distribution of bus lines in 13 cities in Heilongjiang Province. The corresponding distribution maps for the bus lines are shown in Figure 4, where red means bus lines, blue means rivers, and green means vegetation.
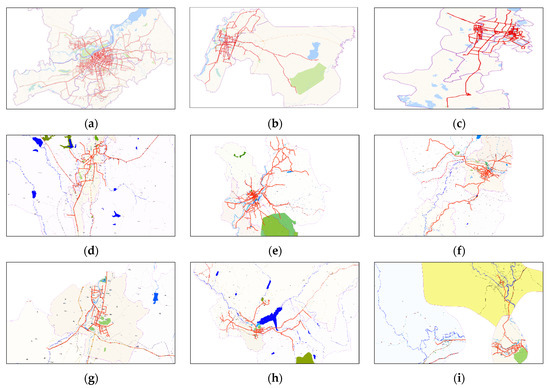
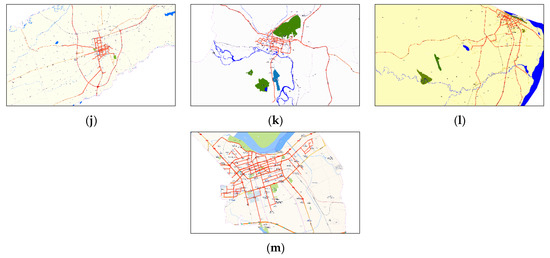
Figure 4.
Distribution maps for the bus networks in the 13 cities. (a) Harbin; (b) Qiqihar; (c) Daqing; (d) Hegang; (e) Mudanjiang; (f) Jixi; (g) Shuangyashan; (h) Qitaihe; (i) Yichun; (j) Suihua; (k) Da Hinggan Ling Prefecture; (l) Heihe; (m) Jiamusi.
As shown in Figure 4, most of the bus lines in the 13 cities are spread in the urban built-up areas, especially in Harbin. This is directly related to the travel demands of the urban residents. Urban built-up areas tend to have a greater concentration of population and businesses. The dense bus lines can meet the corresponding travel demands.
4.2. Urban Road Networks
4.2.1. Average Road Network Density
The urban road condition generally affects people’s choices of travel modes [24]. The total road mileage in the built-up areas of the cities in Heilongjiang Province was obtained from the local transportation bureau. Formula (1) was used to calculate the ARND in the 13 cities, as shown in Table 3.
Table 3.
ARNDs of urban built-up areas in Heilongjiang Province.
The city with the largest ARND in Heilongjiang Province is Mudanjiang, which is 9.82 km/km2. The second is Daqing, which is 8.74 km/km2. The city with the smallest ARND is Suihua, which is 3.19 km/km2. In China, the ARND in urban built-up areas is generally 8 km/km2. Daqing and Mudanjiang meet this requirement.
In the Monitoring Report on Road Network Density in China’s Major Cities in 2021, the ARND of 36 major cities were obtained, as shown in Table 4.
Table 4.
ARND in some urban administrative regions (unit: km/km2).
4.2.2. Urban Road Area Ratio
TURA in the built-up areas of Heilongjiang Province and TULA in the built-up areas were obtained from the province’s transportation bureau. Using Formula (2), the URR could be calculated, as shown in Table 5.
Table 5.
URRs of the cities in Heilongjiang Province.
According to Table 5, the city with the largest URR in Heilongjiang Province is Daqing, which is 14.93%. This is followed by Harbin, which has a URR of 14.35%. The city with the smallest URR is Yichun, which is 6.09%. In China, the URR in urban built-up areas generally reaches 15%. The URR of the 13 cities in Heilongjiang Province did not meet the requirements.
4.3. Satisfaction with Green Travel
We calculated the SGT of 13 cities in Heilongjiang Province with the use of questionnaires. SGT is a comprehensive factor that influences travelers’ choices [25].
The statistical analysis of the returned questionnaires allowed us to obtain the number of people who were satisfied with urban green travel and the total number of respondents. Using Formula (3), the SGT of the 13 cities in Heilongjiang Province could be calculated, as shown in Table 6.
Table 6.
SGTs of cities in Heilongjiang Province.
A heat map of the SGT in Heilongjiang Province is shown in Figure 5.
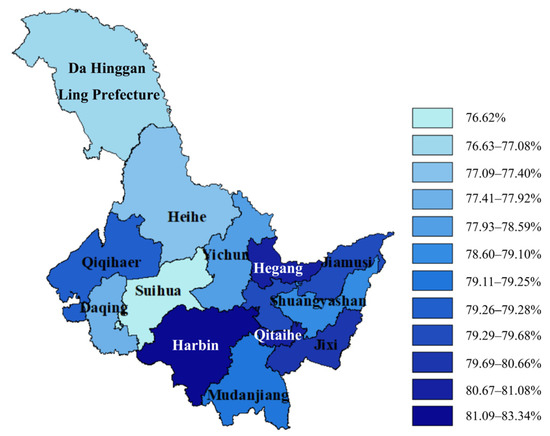
Figure 5.
Heat map of the SGT in Heilongjiang Province.
The city with the highest SGT in Heilongjiang Province is Harbin, with an SGT of 83.34%, followed by Hegang, which reached 80.99%. In contrast, the city with the lowest SGT is Suihua, with 76.62%. SGT is mainly evaluated based on five aspects, including facilities, convenience, information service, comfort, and cost of green travel. Harbin has the highest SGT compared with other cities. The main reasons may be as follows:
- More perfect facilities and convenience. The 500 m coverage of bus stops in Harbin is at 100%, which is much higher than in other cities. The number of buses, bus lines, and shared bicycles in Harbin is also much higher. The facilities of green travel are more easily available for residents in Harbin.
- More travel information. An app and the Electronic Bus Station Board have been widely used by residents in Harbin. Installed at every bus station in downtown Harbin, the Electronic Bus Station Board can track the location of buses and the time they will enter the station in real time, which helps passengers to easily obtain information about the coming buses.
- More comfort. Harbin has the largest number of NEBs. Most of the NEBs are pure electric buses with air conditioners. They can provide a more comfortable inside temperature whether in winter or summer. The Harbin Metro further meets travelers’ demands.
In China, SGT in urban built-up areas generally reaches 80%. Harbin, Jixi, Hegang, and Qitaihe exceed 80%. The other nine cities do not meet the requirements.
4.4. Proportion of Public Transit Accounting for Motorized Travel
By performing a statistical analysis of the returned questionnaires, the URPT and TMT in the 13 cities could be obtained. Formula (4) can be used to calculate the PPMT of the 13 cities in Heilongjiang Province, as shown in Table 7.
Table 7.
PPMTs of cities in Heilongjiang Province.
A heat map of PPMT in the 13 cities in Heilongjiang Province is shown in Figure 6.
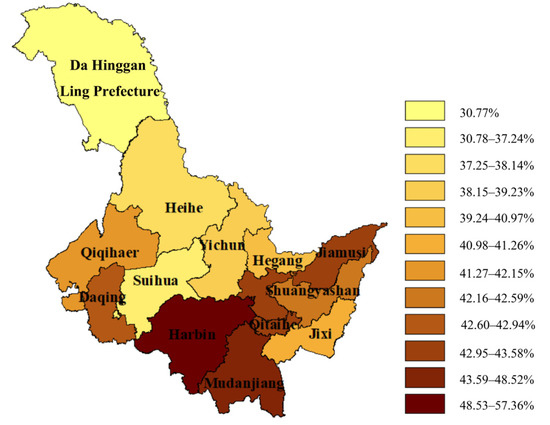
Figure 6.
Heat map of the PPMT in Heilongjiang Province.
The city in Heilongjiang Province with the highest PPMT is Harbin, which reached 57.36%. This is followed by Mudanjiang, which is at 48.52%. However, the city with the lowest PPMT is Da Hinggan Ling Prefecture, which is at 30.77%. Harbin had three Metro lines by the end of 2022, which attracted more travelers as compared with other cities.
In China, the PPMT generally reaches 50% for super or super large cities, 40% for large cities, and 30% for small and medium-sized cities. According to the population of every city in Heilongjiang Province and the Chinese city grading system, the PPMT of 10 cities in Heilongjiang met the requirements, except for Qiqihar, Heihe, and Suihua. Harbin has been a National Public Transit City since 2019. The PPMT of Harbin is the highest, but compared with other cities in China, there is still a certain shortage. We compared the operational index of public transit in similar cities such as Xi’an, Lanzhou, Tianjin, Guangzhou, and Chongqing, as shown in Table 8.
Table 8.
Public transit operational index in some cities.
The PPMT is a key index of green travel in a city. However, the PPMT of Harbin seems to be lower than that of Xi’an, Lanzhou, Tianjin, Guangzhou, and Chongqing. It may be related to the following reasons:
- Xi’an, Tianjin, Guangzhou, and Chongqing have more subway lines than Harbin. The number of average daily subway passengers in Lanzhou is higher than in Harbin. Tianjin and Chongqing also have rail transit systems, such as light rail systems, rail trams, monorail systems, and other rail systems. Furthermore, Guangzhou has city ferries. The more diverse the public transit modes are, the more willing residents are to make a choice.
- Harbin is located in the northeast of China and has a long winter period. Many residents prefer to take private cars or taxis for more comfort. Harbin has a population of more than 10 million. However, the number of buses is only 7219. Insufficient transport capacity thus leads to more waiting time at the bus stations.
- There are 322 bus lines in Harbin, about one quarter of those in Guangzhou. It is insufficient relative to the population, urban scope, and travel demands. Although Harbin’s network of bus stations has high coverage, the residents probably have to deal with more transfers.
4.5. Proportion of Green Travel
Related research has revealed that PGT is an important factor that influences future air pollution, energy consumption, and travel costs [26]. Therefore, we investigated the PGT in the 13 cities in Heilongjiang Province.
After the statistical analysis of the returned questionnaires, the AGT and AUR of every city could be obtained. Using Formula (5), the PGT in Heilongjiang Province can be calculated, as shown in Table 9.
Table 9.
PGTs of cities in Heilongjiang Province.
A heat map of the PGT in every city in Heilongjiang Province is shown in Figure 7.
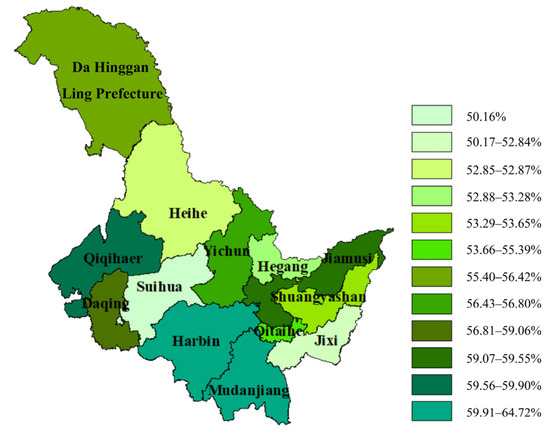
Figure 7.
Heat map of the PGT of cities in Heilongjiang Province.
The city with the highest PGT in Heilongjiang is Harbin, with 64.72%, and it is followed by Mudanjiang with 62.78%. The lowest PGT was found for Suihua at 50.16%. Compared with other cities, the green travel modes in Harbin also include the subway and bike sharing. Table 10 shows the distribution of shared bikes in every city in Heilongjiang Province.
Table 10.
Number of bikes shared in various cities of Heilongjiang Province (unit: vehicles).
Due to climate and topography, some cities in Heilongjiang Province have less shared bicycles or have no bike-sharing facilities. As a unique city with a subway system, Harbin has a higher service level in public transit than the other 12 cities.
In China, the PGT generally needs to reach 70%. The 13 cities in Heilongjiang Province did not meet this requirement by the end of 2021.
5. Conclusions
This study conducted an extensive data survey on green travel in Heilongjiang Province, analyzed the data of green travel in Heilongjiang Province using web crawler technology, learned about the construction of urban roads and public transportation, and calculated corresponding indicators. Through these indicators, we evaluated the current situation of green travel in Heilongjiang Province and the following conclusions were obtained:
- The development of green transportation resources in Heilongjiang Province is insufficient: (a) The ARND of most cities is less than 8 km/km2, and the URR of all cities is less than 15%, which is lower than the general standard for Chinese cities. Obviously, this restricts the further development of green travel in Heilongjiang Province; (b) compared with other cities at the same level in China, the PPMT of the 13 cities mentioned is relatively low; And (c) PGT is insufficient, and the 13 cities in Heilongjiang Province do not meet the 70% common requirement in China. This is related to the cold climate in Heilongjiang Province and the insufficient development of green travel in some cities. Obviously, the existing green travel resources in Heilongjiang Province cannot meet the people’s green daily travel needs.
- The development of green transportation resources in various cities in Heilongjiang Province is uneven: (a) among the 13 cities, only Heihe and Daqing have a GEBs ratio of below 50%, and the GEBs ratio in Daqing is only 7.72%. Obviously, due to the fact that these two cities are old industrial cities, their larger application scale of TEB, slower technological updates, and insufficient promotion of GEBs have led to the lack of widespread application of GEBs; and (b) the SGT of nine cities is below 80% and needs to be further improved.
6. Recommendations and Future Research
Based on the above research, it is recommended that the development planning for green travel in cities located in the cold regions could be as follows:
- Relevant departments should accelerate the elimination of highly polluting and energy consuming TEBs. Meanwhile, NEBs should be widely promoted to accelerate the obsoleting of TEBs with a long service life, and the obsolete TEBs should be cancelled and archived one by one. Further develop and expand the “green travel” industry of NEBs, accelerate the application of NEBs, and promote the steady increase in the number of NEBs.
- The urban bus line network should be designed scientifically and rationally, and the location of urban bus routes and stations should be optimized. Relevant institutions should strengthen the connection between bus schedules and those of the high-speed railway, and further improve bus stop coverage, bus punctuality, and average running speed during peak hours. It is able to achieve a 500 m coverage rate of bus stops and a 100% bus punctuality rate, and actively build bus priority lanes to control bus congestion to a reasonable level during the morning and evening peak hour.
Although this experiment has provided a comprehensive survey of data on green travel in Heilongjiang Province, we still lacked a detailed analysis of the influencing factors of each indicator. Therefore, we will explore the following in our future research:
- We will widen the range of measuring indices. By selecting economic indicators such as the ‘benefit-cost ratio’, we will comprehensively analyze and measure green travel in specific cities in Heilongjiang Province.
- We will investigate the factors that influence the development of green travel in cold regions. This will support the government in developing green travel policies and improving green travel indicators to effectively promote the development of green travel in cold regions.
Author Contributions
Conceptualization, W.Z.; methodology, W.Z.; software, H.C.; validation, Z.S.; formal analysis, W.Z.; investigation, C.W.; data curation, H.Z.; writing—original draft preparation, H.C.; writing—reviewing and editing, W.Z. and Z.S.; visualization, C.W.; supervision, W.Z.; project administration, Z.S.; funding acquisition, W.Z. All authors have read and agreed to the published version of the manuscript.
Funding
This research was supported by the China Fundamental Research Funds for the Central Universities Category D Project Carbon Neutralization Project (No. 2572021DT09).
Institutional Review Board Statement
Not applicable.
Informed Consent Statement
Not applicable.
Data Availability Statement
The data are not publicly available due to privacy restrictions.
Conflicts of Interest
The authors declare no conflict of interest.
References
- Shan, Y.; Huang, Q.; Guan, D.; Hubacek, K. China CO2 Emission Accounts 2016–2017. Sci. Data 2020, 7, 54. [Google Scholar] [CrossRef]
- Liu, Y.; Li, Y.; Li, W. Natural Language Processing Approach for Appraisal of Passenger Satisfaction and Service Quality of Public Transportation. IET Intell. Transp. Syst. 2019, 13, 1701–1707. [Google Scholar] [CrossRef]
- Liu, Q.; Homma, R.; Iki, K. Evaluating Cyclists’ Perception of Satisfaction Using 360° Videos. Transp. Res. Part A-Policy 2020, 132, 205–213. [Google Scholar] [CrossRef]
- Habibian, M.; Hosseinzadeh, A. Walkability Index across Trip Purposes. Sustain. Cities Soc. 2018, 42, 216–225. [Google Scholar] [CrossRef]
- Ma, H.; Liu, J.; Xi, J. Decoupling and Decomposition Analysis of Carbon Emissions in Beijing’s Tourism Traffic. Environ. Dev. Sustain. 2022, 24, 5258–5274. [Google Scholar] [CrossRef]
- Moutinho, J.L.; Liang, D.; Golan, R.; Ebelt, S.T.; Weber, R.; Sarnat, J.A.; Russell, A.G. Evaluating a Multipollutant Metric for Use in Characterizing Traffic-Related Air Pollution Exposures within near-Road Environments. Environ. Res. 2020, 184, 109389. [Google Scholar] [CrossRef]
- Fernandes, P.; Vilaça, M.; Macedo, E.; Sampaio, C.; Bahmankhah, B.; Bandeira, J.M.; Guarnaccia, C.; Rafael, S.; Fernandes, A.P.; Relvas, H.; et al. Integrating Road Traffic Externalities through a Sustainability Indicator. Sci. Total Environ. 2019, 691, 483–498. [Google Scholar] [CrossRef] [PubMed]
- Xu, C.; Wu, S. Evaluating the Effects of Household Characteristics on Household Daily Traffic Emissions Based on Household Travel Survey Data. Sustainability. 2019, 11, 1684. [Google Scholar] [CrossRef]
- Anciaes, P.; Jones, P. Transport Policy for Liveability—Valuing the Impacts on Movement, Place, and Society. Transp. Res. Part A-Policy Pract. 2020, 132, 157–173. [Google Scholar] [CrossRef]
- Friman, M.; Gärling, T.; Ettema, D.; Olsson, L.E. How Does Travel Affect Emotional Well-Being and Life Satisfaction? Transp. Res. A-Policy 2017, 106, 170–180. [Google Scholar] [CrossRef]
- Zhang, L.; Long, R.; Li, W.; Wei, J. Potential for Reducing Carbon Emissions from Urban Traffic Based on the Carbon Emission Satisfaction: Case Study in Shanghai. J. Transp. Geogr. 2020, 85, 102733. [Google Scholar] [CrossRef]
- Ma, J.; Liu, X.; Chen, Y.; Wang, G.; Zhao, X.; He, Y.; Xu, S.; Zhang, K.; Zhang, Y. Current Status and Countermeasures for China’s New Energy Automobile Industry and Technology Development. China J. Highw. Transp. 2018, 31, 1–19. [Google Scholar]
- Gao, F.; Li, S.; Wu, Z.; Lv, D.; Huang, G.; Liu, X. Spatial-Temporal Characteristics and the Influencing Factors of the Ride Destination of Bike Sharing in Guangzhou City. Geogr. Res. 2019, 38, 2859. [Google Scholar] [CrossRef]
- Ko, Y.D.; Song, B.D. Sustainable Service Design and Revenue Management for Electric Tour Bus Systems: Seoul City Tour Bus Service and the Eco-Mileage Program. J. Sustain. Tour. 2019, 27, 308–326. [Google Scholar] [CrossRef]
- Hermida, C.; Orellana, D.; Cordero, M. Analysis of the Influence of Urban Built Environment on Pedestrian Flow in an Intermediate-Sized City in the Andes of Ecuador. Int. J. Sustain. Transp. 2019, 13, 777–787. [Google Scholar] [CrossRef]
- Yang, X.; Lu, S.; Zhao, W.; Zhao, Z. Exploring the Characteristics of an Intra-Urban Bus Service Network: A Case Study of Shenzhen, China. Isprs. Int. J. Geo-Inf. 2019, 8, 486. [Google Scholar] [CrossRef]
- Ko, J.; Lee, S.; Byun, M. Exploring Factors Associated with Commute Mode Choice: An Application of City-Level General Social Survey Data. Transp. Policy 2019, 75, 36–46. [Google Scholar] [CrossRef]
- Geng, J.; Long, R.; Yang, L.; Zhu, J.; Engeda Birhane, G. Experimental Evaluation of Information Interventions to Encourage Non-Motorized Travel: A Case Study in Hefei, China. Sustainability 2020, 12, 6201. [Google Scholar] [CrossRef]
- Hu, H.; Xu, J.; Shen, Q.; Shi, F.; Chen, Y. Travel Mode Choices in Small Cities of China: A Case Study of Changting. Transp. Res. Part D Transp. Environ. 2018, 59, 361–374. [Google Scholar] [CrossRef]
- Meng, M.; Rau, A.; Mahardhika, H. Public Transport Travel Time Perception: Effects of Socioeconomic Characteristics, Trip Characteristics and Facility Usage. Transp. Res. A-Policy 2018, 114, 24–37. [Google Scholar] [CrossRef]
- Zhu, A.; Wen, Y. Green Logistics Location-Routing Optimization Solution Based on Improved GA A1gorithm Considering Low-Carbon and Environmental Protection. J. Math. 2021, 2021, e6101194. [Google Scholar] [CrossRef]
- Xylia, M.; Leduc, S.; Laurent, A.-B.; Patrizio, P.; van der Meer, Y.; Kraxner, F.; Silveira, S. Impact of Bus Electrification on Carbon Emissions: The Case of Stockholm. J. Clean. Prod. 2019, 209, 74–87. [Google Scholar] [CrossRef]
- Yu, Q.; Zhang, H.; Li, W.; Song, X.; Yang, D.; Shibasaki, R. Mobile Phone GPS Data in Urban Customized Bus: Dynamic Line Design and Emission Reduction Potentials Analysis. J. Clean. Prod. 2020, 272, 122471. [Google Scholar] [CrossRef]
- Zhou, Q.; Che, M.; Koh, P.P.; Wong, Y.D. Effects of Improvements in Non-Motorised Transport Facilities on Active Mobility Demand in a Residential Township. J. Transp. Health 2020, 16, 100835. [Google Scholar] [CrossRef]
- Fahim, A.U.; Rahman, M.M.; Abir, F.A.; Bhuiyan, A.-F. An Investigation of Users’ Perception on Non-Motorized Transport Services in a Municipality Area: A Cross-Sectional Study on Pabna Municipality. Case Stud. Transp. Policy 2022, 10, 657–663. [Google Scholar] [CrossRef]
- Zope, R.; Vasudevan, N.; Arkatkar, S.S.; Joshi, G. Benchmarking: A Tool for Evaluation and Monitoring Sustainability of Urban Transport System in Metropolitan Cities of India. Sustain. Cities Soc. 2019, 45, 48–58. [Google Scholar] [CrossRef]


Disclaimer/Publisher’s Note: The statements, opinions and data contained in all publications are solely those of the individual author(s) and contributor(s) and not of MDPI and/or the editor(s). MDPI and/or the editor(s) disclaim responsibility for any injury to people or property resulting from any ideas, methods, instructions or products referred to in the content. |
© 2023 by the authors. Licensee MDPI, Basel, Switzerland. This article is an open access article distributed under the terms and conditions of the Creative Commons Attribution (CC BY) license (https://creativecommons.org/licenses/by/4.0/).