Article

Prediction of Salt-Tolerant Earthworms’ Cultivation Conditions Based on the Robust Artificial Intelligence Model

1
Country College of Life Science, Jilin Agricultural University, Changchun 131018, China
2
Key Laboratory of Straw Comprehensive Utilization and Black Soil Conservation, Ministry of Education, Changchun 130118, China
3
Key Laboratory of Mollisols Agroecology, Northeast Institute of Geography and Agroecology, Chinese Academy of Sciences, Changchun 130102, China
*
Authors to whom correspondence should be addressed.
Sustainability 2023, 15(8), 6484; https://doi.org/10.3390/su15086484
Submission received: 4 January 2023 / Revised: 16 March 2023 / Accepted: 6 April 2023 / Published: 11 April 2023

Abstract

:
Soil pollution is a very important field among current global ecological environmental problems. Many countries have focused their scientific research power on the process of soil remediation and biological detoxification, hoping to achieve the remediation effect of contaminated soil by means of biological free activity and survival mechanisms. These studies are meant to achieve a virtuous ecological cycle and provide a biological basis for the sustainable utilization and development of resources. The purpose of this study was: (1) to screen the best conditions for the cultivation and domestication of salt-tolerant earthworms; (2) to explore the influence (correlation) relationship between salt-tolerant earthworms’ growth variables and living environmental factors; (3) an improved BP neural network model was constructed to predict the expected values of variables such as C:N, N a H C O 3 : N a 2 C O 3 and base:soil, so as to provide an initial cultivation model for earthworm-resistant cultivators. The materials used in this study are cow dung that was collected from Changchun LvYuan District PengYu farm; straw that was collected from the Key Laboratory of Comprehensive Straw Utilization and Black Land Protection; soil that was collected from ordinary soil in the experimental shed of Jilin Agricultural University. We also purchased “Daping No. 2” earthworms from Hunan Zengren Earthworm Breeding Base. In order to simulate the extreme living environment with high salinity and alkalinity, this paper prepared 0.1 mol/L and 0.15 mol/L N a H C O 3 solution, 0.1 mol/L, and 0.2 mol/L N a 2 C O 3 solutions. We mixed the above solutions according to the proportion of 0.1 mol/L N a H C O 3 solution: 0.1 mol/L N a 2 C O 3 solutions, 0.15 mol/L N a H C O 3 solution: 0.1 mol/L N a 2 C O 3 solution, 0.1 mol/L N a H C O 3 solution: 0.2 mol/L N a 2 C O 3 solutions. At the same time, we prepared the mixed environment of base material and soil (base material:soil = 1:1; base material:soil = 1:2); the base material was composed of cow dung and straw. The conclusions are as follows: (1) earthworms living under simulated conditions have stronger tolerance to the saline-alkali environment; (2) the situation of C:N = 30:1, N a H C O 3 : N a 2 C O 3   = 1:1, base:soil = 1:2 is the ideal state for earthworms to survive; (3) earthworms with a high tolerance can provide more enzyme activities for the simulated environment, especially cellulase activity, urease activity, sucrase activity, and alkaline phosphatase activity; (4) compared with the ordinary practical operation, the average prediction accuracy of a three output neuron BP prediction model is 99.40% (>95%). The results of this study indicate that the BP neural training set established can be used to reduce breeding costs, and also to improve the productivity of earthworms, provide a mathematical model basis for ecological sustainable utilization and circular production between earthworms and soil, and rapidly encourage the ability of earthworms to repair contaminated soil or transform agricultural waste, providing basic data support conditions for soil ecological remediation systems and the sustainable utilization of agricultural waste.

1. Introduction

Soil pollution hinders the ecosystem’s normal operation process, poses a great threat to soil life, reduces the degradation rate of organic matter, and seriously persecutes plant growth [1]. Soil pollution is mainly divided into organic pollution and inorganic pollution [2]. Organic pollution includes organic pesticides, phenols, and synthetic detergents; while inorganic pollution mainly comes from acids, alkalis, heavy metals, salts, or radionuclides [3]. Their existence undoubtedly brings great challenges to the survival of animals and plants. A report on soil pollution in 2018, called “Soil Pollution: A Hidden Reality”, once again sounded the alarm for global soil remediation and protection. According to statistics, Australia is currently facing the problem of treating 80,000 contaminated areas, and the United States is also dealing with more than 1300 heavy pollution sites. These pollutions are mainly made up of dangerous elements (cadmium, lead, arsenic, mercury, etc.), polycyclic aromatic hydrocarbons (PAH), pesticides, pathogenic microorganisms, and persistent organic pollutants. It is reported that China has listed 16% of its soil and 19% of its agricultural soil as contaminated soil. According to incomplete statistics, China handles about 12 million tons of contaminated food every year. In addition, since the Fukushima nuclear accident in 2011, Japan’s soil pollution has become more serious, with the total amount of soil pollution reaching 14 million cubic meters. Studies have shown that long-term contaminated soil has stronger carcinogenicity, teratogenicity, or mutagenicity than normal nutrient soil [4]. Some scholars had found that different types of mice living in heavy metal-polluted environments had evolved at the biochemical, histological, and physiological levels [5]; these changes were mainly reflected in the morphological mutation of the mandible. Some authors have proven that the morphological change of the mandible was significantly related to its function, and this correlation was closely related to the food types of target animals [6]. This mutation is particularly evident in plant growth. In 2019, a team simulated radioactively contaminated soil by mixing the refuse of a shut thermal power plant (ATPP) with soil, and discovered that 2% concentration of radioactivity could distort the morphology of potatoes and pumpkins [7]. At 4% concentration, the growth of two plant types were limited, and the germination number decline was accompanied by sparse fruit. At 6% concentration, the fruit volume was reduced and accompanied by genotoxicity. During this period, obvious mutagenicity occurred in both types of plants at different concentrations [8]. Although people have realized that soil pollution has an absolute impact on animals and plants, and the research on soil pollution remediation and improvement has gradually broken through the limitations of methods, it has still been unable to completely solve the problem of soil pollution. Earthworms and earthworm dung can, however, improve the soil environment, promote the function of soil microorganisms, and enhance soil purification in a specific environment. However, the advancement of urbanization and the accelerated development of industrialization have led to essential changes in some areas of soil in many countries. There are large areas of organic and inorganic pollutants in the world, such as saline-alkali land, heavy metal pollution land, high-concentration pesticide residue land, and so on [9]. According to incomplete statistics, the total saline-alkali land area in the world is about 954.832 million hectares, which is mainly distributed in Australia, China, and other countries [8]. Moreover, the pollution area of soils with the heavy metal, arsenic, in the world is large. Only the arsenic concentration of soil in southwest Poland is as high as 18,100 mg/kg, far exceeding the limit (24 mg/kg) specified by the National Environmental Protection Agency (USEPA), and the heavy metal pollution of soil in other countries is also common.
However, different varieties and regions of earthworms also showed obvious differences in the soil improvement process and enzyme system’s subsequent changes [9]. It is mainly reflected in the evaluation of enzyme activities such as fibrin, superoxide dismutase (SOD), catalase (CAT), and antioxidant enzymes (POD, GST). This was related to the capacity size of earthworms to repair polluted soil environments and the stability mechanism [10]. It has been proven that earthworms can effectively deal with pathogenic microorganisms and toxins in earthworm coelomic and living environment systems (A Zeb, 2020). Earthworms play an extremely important role in central regulation [11]. This is mainly due to the advantages of earthworms’ innate immune defense system, secretion, and transportation of body-cavity fluid, production, and decomposition of intestinal digestive enzymes, etc. They cooperate with the defense molecules in earthworms to build the earthworm immune response mechanism [11]. This response mechanism is one of the main assets in terms of soil protection and remediation fields. Therefore, learning to use earthworms’ self-repair function to provide sustainable utilization and development conditions for soil ecology is the focus of this study. Especially in extreme environments, the cultivation and discussion of tolerant earthworms is seen as a low-cost improvement method for remediation and improvement of different types of soil pollution today.
The purpose of this study was: (1) to screen the best conditions for the cultivation and domestication of salt-tolerant earthworms; (2) to explore the influence (correlation) relationship between salt-tolerant earthworms’ growth variables and living environmental factors; (3) to improve the BP neural network model that is constructed to predict the expected values of variables such as C:N, N a H C O 3 : N a 2 C O 3 and base:soil, so as to provide an initial cultivation model for earthworm-resistant cultivators.

2. Materials and Methods

2.1. Preparation of Experimental Materials

Cow dung was collected from Changchun LvYuan District PengYu farm. The straw was collected from the Key Laboratory of Straw Comprehensive Utilization and Black Land Protection, and the soil was collected from the ordinary soil in the experimental shed of Jilin Agricultural University. We purchased “Daping No. 2” earthworms from Hunan Zengren Earthworm Breeding Base. This paper selected 160 adult eisenia foetida earthworms of 0.3 g to 0.5 g and with clitellum of 0.2 cm to 0.4 cm as the test earthworms. The tested straw and cow dung were proportioned into base materials with a carbon to nitrogen ratio of 30:1 and 25:1, and prepared N a H C O 3 and N a 2 C O 3 drugs, then purchased 20 experimental aluminum boxes of 70 mm × 38 mm, 1000 8-wire plastic bags of 11 cm × 16 cm, and 25 material boxes of 440 mm × 330 mm × 210 mm.

2.2. Simulation Experiment

In order to simulate the extreme living environment with high salinity and alkalinity, this paper prepared a 0.1 mol/L and 0.15 mol/L N a H C O 3 solution and a 0.1 mol/L and 0.2 mol/L N a 2 C O 3 solution, respectively. We mixed the above solutions according to the proportion of 0.1 mol/L N a H C O 3 solution: 0.1 mol/L N a 2 C O 3 solution, 0.15 mol/L N a H C O 3 solution: 0.1 mol/L N a 2 C O 3 solution, 0.1 mol/L N a H C O 3 solution: 0.2 mol/L N a 2 C O 3 solution. At the same time, we prepared the mixed environment of base material and soil (base material:soil = 1:1; base material:soil = 1:2), and the base material was composed of cow dung and straw. The paper set up parallel experiments in different groups. The observation period was 105 days. The living environment was replaced at the time node of 60 days (consistent with the original living environment). We ensured that samples were taken every 15 days for the determination of relevant indicators (including eight indicators such as pH, temperature, humidity, cellulase activity, urease activity, catalase activity, sucrase activity, and alkaline phosphatase activity in the soil system; four indicators such as earthworm reproduction rate, death rate, new growth, and death). The sampling standard was to take samples every 15 days, which were divided into C:N = 25:1, C:N = 30:1, soil ratio 1:2 and 1:1, solution ratio of two large module units, and each unit was set with three parallel samples, a total of 12 samples per time, and 100 g sample in each aluminum box when testing humidity.

2.3. Determination Method and Instrument

The paper used sodium phenol sodium hypochlorite colorimetry (to determine urease activity), disodium diphenyl phosphate colorimetry (to determine soil phosphatase activity), 3–5 dinitrosalicylic acid colorimetry (to determine sucrase activity and cellulase activity), and potassium permanganate titration (to determine catalase activity).

2.4. Mathematical Statistical Methods

The mathematical calculation method is used to express the reproduction rate and lethal rate of the target earthworm. The process is as follows.
There are three earthworms in each group and 15 earthworm samples in five groups. The earthworms, after intestinal cleaning, are measured by electronic balance and the experimental data are recorded.
W e i g h t e a r t h w o r m = W e i g h t f i n a l   W e i g h t i n i t i a l   / W e i g h t n u m b e r  
F = D a D
S = S A D a
G = 1 - S = 1 - S A D a
where D a is the total number of earthworms newly added, D is the total number of earthworms initially tested, F is the reproduction rate, and G is the mortality rate.

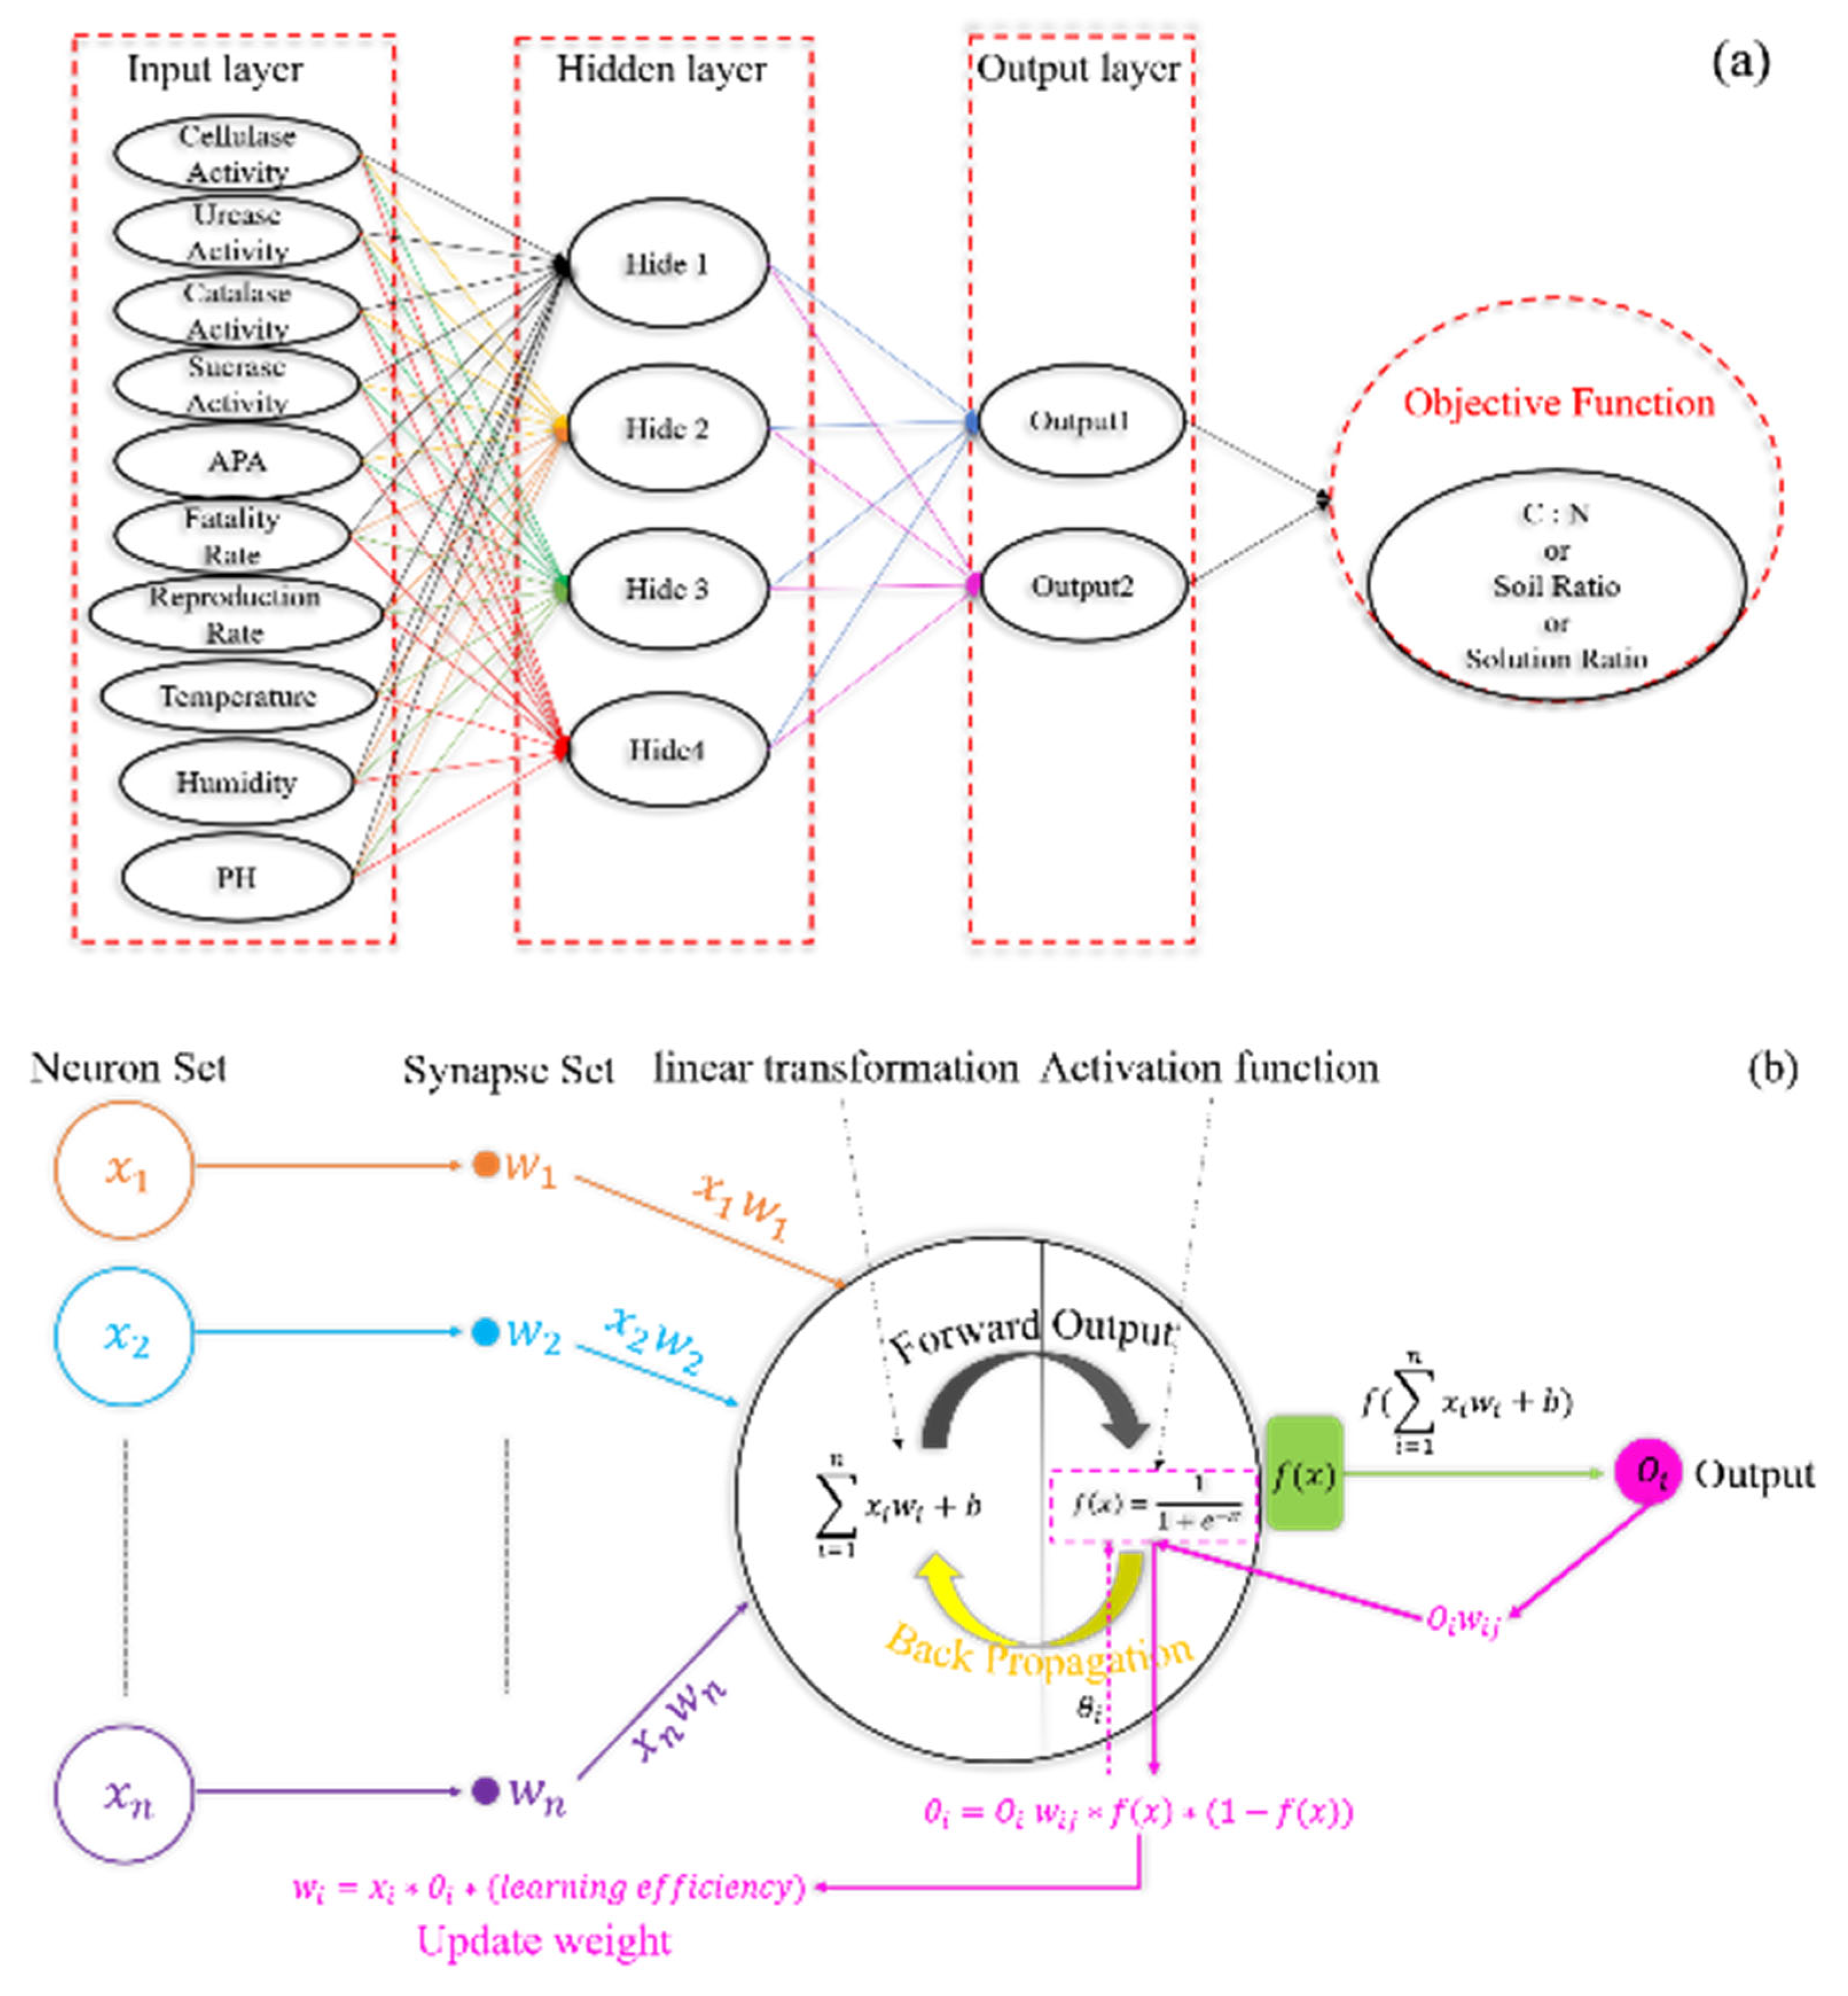
2.5. BP Neural Network Algorithm

The BP neural network algorithm is widely used in machine learning, and it is mainly used in nonlinear classification problems. The construction idea of the BP neural network algorithm comes from the simulation of biological neural network, that is, “in the process of biological neuron connection. When a neuron reaches the excitation boundary point, other neurons will respond successively”. A BP neural network is commonly expressed by activation functions, include sigmoid, tanh, and RELU functions [12]. The scenarios faced by different activation functions are different. The sigmoid activation function is f x = 1 1 + e x and the output space can be compressed to between [0,1] to ensure that the data does not easily diverge, but it is often prone to problems such as oversaturation or loss of gradient in the process of activation or propagation. The tanh activation function is Tan h x = 2 sigmoid 2 x 1 and it can compress the data to the [−1,1] section. However, it will also encounter the problem that it is consistent with the sigmoid activation function. The RELU activation function is f x = max 0 , x . However, the RELU function does not have the problem of supersaturation or loss of gradient and the convergence speed is fast. It always faces the problems of fragile training or neuronal necrosis [9]. Therefore, in order to avoid neuron output necrosis, most studies often choose sigmoid or tanh function as neuron activation function, and usually reset the initial value of parameters to solve the gradient supersaturation or loss problem in sigmoid function. In this study, because the previous data have been collected from segmented and classified nodes, the sigmoid function was used as neuron activation function and the prediction model was based on BP neural network algorithm (sigmoid function) (Figure 1).

2.6. Statistical Analysis and Software Selection

The changes and differences of earthworm physiological indexes and soil biomarker indexes were investigated from three different levels of carbon: nitrogen ratio, base material to soil ratio, and mixed solution ratio. The collected data are processed by Shapiro Wilk test, correlation analysis, and single factor analysis. With the help of interval prediction and the BP neural network model theory, the paper built a basic prediction model and a modified prediction model. R 4.1.2, rstudio-2021.09.1–372, MATLAB 2017A, SPSS 22.0 and Adobe Photoshop were used in the study.

3. Results and Discussion

3.1. Scheme Combination

Before finding the best living conditions for salt-tolerant earthworms, C:N, N a H C O 3 : N a 2 C O 3 , and base:soil are regarded as three layers of a binary tree, and 23 leaf nodes are constructed. The 14 nodes of the above binary tree are compared and combined in the initial scheme, and 8 × 3 schemes and 4 × 3 combination schemes are established. According to different combination schemes, the influence trends between the lethal rate, reproductive rate, and soil environmental indicators of saline-alkali-tolerant earthworms under different objectives were compared, so as to judge the best cultivation scheme.

3.2. Determination of C:N Boundary Point

Under different C:N ratio levels, C:N ratio (20:1, 30:1) increased in proportion to reproductive rate, cellulase activity, urease, catalase, sucrase, and alkaline phosphatase (Figure 2). The combination table gives the C:N combination scheme under four scenarios, and the fluctuation trend of the smooth curve determined by the spline interpolation method is obvious. Under the conditions of 20:1 (blue marking) and 30:1 (red marking) in the same cultivation days, the soil enzyme index value in the 30:1 environment is slightly higher than that in the 20:1 environment (except cellulase and alkaline phosphatase). The growth rate of cellulase in the 30:1 environment is the fastest, and the growth rate of sucrase is faster than that of other enzyme activity indexes, indicating that the carbon: nitrogen ratio is the main factor affecting the enzymatic indexes in the salt-tolerant earthworms’ living environment, and a high C:N ratio can improve the enzyme activity of relevant enzymatic indexes. The saline-alkali-tolerant earthworms’ death rate in the 20:1 condition after a certain inflection point (distributed in [30,45]) is much higher than that in the 30:1 cultivation condition. Although the two C:N ratios have inflection points in C 1 and C 2 , respectively, the inflection point does not affect the lethal mutation. Similarly, in the interval [35,60], there are inflection points of reproductive rate at 20:1 and 30:1. Before the inflection point C 1 , the saline-alkali-tolerant earthworms’ reproductive rate in the 30:1 condition is slightly higher than in the 20:1. However, after the inflection point C 2 , the two states remain opposite for a period of time, and then show a basically consistent decline rate. The pH and humidity indexes in the 20:1 situation are lower than in the 30:1. However, it rose rapidly at the 75 boundary point, which is due to the fact that we reconfigured and changed the same living environment in the 75 day cultivation conditions, with the goal of providing sufficient nutrition for the salt-tolerant earthworm cultivation.

3.3. Determination of Nahco3: Na2co3 Boundary Point

Horizontal observation shows that when N a H C O 3 : N a 2 C O 3 is 1.5:1 (the red mark here is 1.5:1 and the blue mark is 1:1), the death rate is more than 1:1 (Figure 3). The death rate is consistent with the pH value, and the death rate is inversely proportional to the indexes such as cellulase, urease, catalase, sucrase, and alkaline phosphatase. This research showed that the higher the concentration of mixed solution, the more the value of enzyme activity (decrease) is affected. Although in some sections, the earthworms reproduction rate and survival rate in the case of 1.5:1 are slightly higher than that in the case of 1:1. However, this did not improve the basic characteristics of the living environment from the perspective of enzymatic indicators (especially in Figure 3D). Under the conditions of both solutions, pH maintains a downward trend, but the decline rate of 1.5:1 is always lower than that of 1:1. The conclusion of this paper is that the higher the proportion of N a H C O 3 : N a 2 C O 3 mixed solution, the less it has the characteristic of reducing pH value.

3.4. Base: Soil Determination of Boundary Points

By observing the four groups of schemes (Figure 4), we can draw the following conclusions: ① the mortality rate of salt-tolerant earthworms in a 1:2 environment is lower than 1:1 (the two cases in Figure 4A [0, C1] section have the opposite state in a short time, the red marking is 1:2 and the blue marking is 1:1). ② In the 1:2 environment, the saline-alkali-tolerant earthworm’s reproduction rate in [0,35] section is higher than 1:1 (except for Figure 4B), and the reproduction rate (1:2) in [35,60] section is lower than 1:1 (except for Figure 4D), and the reproduction rate (1:2) in [60,105] section is higher than 1:1. It can be concluded that the bigger the ratio (base material to soil), the better the physiological indexes of the saline-alkali-tolerant earthworm. ③ The “rapid decline rise decline” feature of soil pH in the 1:2 environment is consistent with the humidity, which is mainly caused by the replacement of the living environment at the boundary point of T = 75. The 1:2 environment pH is significantly lower than that in the 1:1 environment. On this basis, the values of cellulase activity, urease activity, catalase activity, sucrase activity, and alkaline phosphatase activity in 1:2 environment are higher than those in the 1:1 environment. The higher the pH, the more unfavorable the survival system is to the soil enzymes development. On the whole, the 1:2 living environment is more suitable for salt-tolerant earthworm cultivation, but special attention should be paid to the control of pH inflection point fluctuation.
To sum up, this study found that the cultivation conditions under the situation of C:N = 30:1, N a H C O 3 : N a 2 C O 3 = 1:1, base:soil = 1:2 is more suitable for saline-alkali-resistant earthworm cultivation, which can not only promote the reproduction rate and growth of earthworms, but also improve the relevant indicators in the living environment, and have a certain effect on the soil environment and quality improvement.

4. Establish BP Prediction Model

4.1. Correlation Analysis

With the help of r4.1.2, the reproductive rate, lethal rate, temperature, humidity, pH, days, and five living environment enzyme indexes in the best cultivation scheme (C:N (30:1), soil ratio (1:2), solution ratio (1:1)) are drawn, and the unordered pie shaped correlation coefficient diagram is drawn (Figure 5).
The correlation of cellulase activity, urease activity, catalase activity, sucrase activity, alkaline phosphatase activity, fatality rate, reproduction rate, humidity, pH, and days is obvious. Red represents a negative correlation, blue represents a positive correlation, orange represents an autocorrelation, and the darker the color, the stronger the correlation. The research draws the following conclusions: (1) in the temperature range of 15~28, the higher the temperature, the better the living state of earthworms; (2) humidity had a positive effect on the reproductive rate, pH, urease activity, and catalase activity of earthworms. Although there is an obvious correlation between many factors, in the above index system, how many correlation layers can be divided, and what factors of each correlation layer plays a central role? Next, the paper uses GepHi software to draw the network topology between factors (Figure 6).
The research can draw the following conclusions: ① pH and days are the two factors with the most correlation in the salt- and alkali-tolerant survival system and have global correlation; ② in the peripheral correlation layer, day is mainly related to cellulase activity, urease activity, catalase activity, sucrase activity, alkaline phosphatase activity, temperature, and humidity. ③ In the inner correlation layer, pH is mainly related to factors such as mortality, reproduction rate, new birth, death, C:N, solution ratio, soil ratio, etc. This is consistent with our previous conclusion of correlation analysis, by smooth curve theory. In the actual process of earthworm breeding and cultivation, there is a need to focus on the impact of pH and days on different living environmental factors and the correlation mechanism between global control factors.
Although this paper has found that pH and days are the main pivotal factors related to all factors in the above survival system, it is necessary to understand how to express the internal and external linkage process of these correlation layers, or whether we can complete each factor’s prediction effect in the survival system under correlation layers topology, which will be our next exploration.

4.2. Initial Prediction Identification

The correlation layer’s establishment makes clear to us that the survival environment factors into the global relationship in salt-tolerant earthworm cultivation. However, it does not reveal the linkage change process between different factors from the functional structure level. In order to better predict the reproduction rate, mortality rate, pH, and other factors of the above salt-tolerant earthworms, there is a need to make basic predictions on the constructed database (Figure 7 and Figure 8). In the above statement, this research found that the number of days is the main central factor in the peripheral correlation layer, which has a high correlation with the other five enzymatic indexes, and there is also a correlation with the factors in the inner correlation layer. Therefore, the changing trend of factors based on time series is drawn. The research can draw the following conclusions: ① the new quantity has a relatively stable and slow growth trend, and its confidence section is large, indicating that the error is small in the later prediction; ② the growth of reproduction rate shows a continuous upward trend, and the error of confidence interval is small in the [9.5,10.0] section of standardized number axis, indicating that it is reasonable to predict this index from the 75th to 90th day in the later stage. ③ The growth rate of mortality is stronger, and the tolerance of medium-term estimation error is relatively small, especially in the 90 day neighborhood; ④ the initial trend prediction of the above four factors is observed globally, and it is found that the four factors’ starting point and confidence interval in the third group of samples are abnormal. Therefore, it is necessary to properly consider dimensioning the data in advance in the prediction segment.
In the initial prediction process, the growth index of saline-alkali-tolerant earthworm always shows a continuous upward trend, its confidence section is also large, and its tolerance to the actual error is relatively large. However, this is not in line with the empirical conclusion obtained by our actual operation. Therefore, this research predicted the basic trend of humidity and five enzyme activity factors in the next 7 days with the help of R software (Gray Part). The grouped scatter confidence section prediction diagram of five enzymatic factors clearly shows that the tolerance of prediction error is small, and the prediction effect is more consistent with the reality. For example, the humidity prediction effect in the next 7 days has small fluctuation error in the early stage, but the later prediction may have large error due to the confidence section widening in the later stage. Then, the application of simple linear prediction is bound to bring the problems of large error and prediction effect low accuracy. Of course, not all single factor trend prediction results are ideal this time. The position with the large prediction scanning area indicates that the later prediction error tolerance is large, especially urease activity, catalase activity, sucrase activity, and other factors. The prediction tolerance of humidity, cellulase activity, and alkaline phosphatase activity fluctuates. Introducing the curve function, exponential function, or logarithmic function into the later single factor prediction was considered.
At the initial stage, the confidence section prediction method screened out some basic functions that do not conform to the single factor function relationship, but the specific functions used to explain the functional relationship between time series changes and different factors still need to be further explored. In previous research on the factor interaction mechanism, many research fields expect to explore the relationship between single factor and time series through simple univariate regression function. This research model and method is particularly common in economics and ecology. In order to fully reveal the function structure of single factor or multifactor among different factors in microbiology, in order to verify the above conclusion that the initial prediction error is large, this research made a basic test of univariate linear regression for different factors.
Under the conditions of 1:1 and 1:1.5 mixed solution ratio, the prediction effect of single factor linear regression function between different time nodes and different factors is not ideal. The data cases show that the factors in this case do not have the basis for constructing the unit linear regression equation, and the selection of single factor linear regression function cannot explain the function influence mechanism between two variables. For example, the adjusted fitting degree of the regression function between reproduction rate and days is 0.6516 (p < 0.01) and the significance is 0.01736 (>0.0). It is necessary to accept the original hypothesis (there is no univariate linear regression relationship between the two variables). In general, the relationship between multiple factors and time series cannot be explained by a simple single factor linear regression equation. When the research excludes the single factor regression function relationship, it is helpful to consider using the global relationship to predict the linkage process between different factors. This paper builds a multivariable and multi-neuron BP neural network model, which is expected to output different cultivation conditions in the form of input single variable. This will hide the logical relationship between multiple factors at the structural level and predict the cultivation conditions as a whole (including the number of days).

5. BP Neural Network Model Establishment and Backtracking

5.1. Establish BP Neural Network Model

Based on the BP neural network structure, we divided the salt-tolerant earthworms into three parallel systems (C:N, soil ratio and solution ratio) for block prediction and combined the prediction data into new cultivation conditions. In the data matrix of 56 × 14 , three 28 × 12 data matrices are randomly selected from the three systems of C:N, soil ratio, and solution ratio. Before constructing the BP neural network model, there was a need to improve or use the three counter methods in the model in order to maximize the prediction accuracy.
When calculating the neurons in the neural network model, we chose the improved formula k = p + q + a ,   a 1 , 10 , where p is the number of nodes in the output layer and Q is the number of nodes in the input layer. We logarithmically converted the above formula to k = log 2 p + q , thus, the improved neuron counting algorithm can minimize the probability of blindly selecting nodes number in the network hidden layer. After calculation, the neurons number is 5 (C:N), 15 (soil ratio) and 15 (solution ratio).
After the hidden layer neurons are determined, the initial learning efficiency needs to be set. The learning efficiency diminishing method is affected by the number of iterations. This paper uses θ f = e τ θ f 1 , 0.0001 τ 0.001 , in the iterative process, the learning efficiency will be reduced according to a certain proportion coefficient based on the iteration number. After calculation, the learning efficiency is 0.01 (C:N), 0.01 (soil ratio), and 5 × 10⁻³ (solution ratio).
After setting the learning efficiency and the number of neurons, the research tested the database established in this study through R software (including the optimal cultivation conditions and insufficient cultivation conditions. Before the test, we needed to standardize the data conversion operation), then we constructed the BP neural network models and prediction accuracy in the three divided parallel systems (Figure 9, Figure 10 and Figure 11).
The prediction result is closely related to the size and effect of the training set, and the simulation experiment tells us: ① the prediction accuracy of 1:1 and comprehensive cultivation conditions in soil ratio system are 96.43% and 98.21%, respectively, which are less than the prediction accuracy corresponding to C:N and the solution ratio system. This paper calculates the weights of neurons corresponding to input and output layer elements; ② the prediction accuracy of C:N and the solution ratio systems is good, both of which are 100%, indicating that the BP neural network established in this section is reasonable for predicting and outputting the actual cultivation conditions.

5.2. BP Neural Network Model Backtracking and Verification

Although the research has established BP neural prediction models of three parallel systems (C:N, soil ratio, and solution ratio) (the purpose of prediction is to output relevant theoretical cultivation conditions for actual earthworm farmers), however, the prediction model needs to be backtracked and tested to show that the model has the significance of practical operation guidance (prediction efficiency and iteration of the model, Table 1).
The factors within the solution ratio level have the highest iterative efficiency, and their prediction results are also good, which means that the cultivation condition prediction model established by us has good practical feasibility, and the computer prediction effect and results are in good agreement with the actual operation.
The above prediction results are consistent with the BP neural network prediction accuracy in the early stage, which shows that it is feasible to use BP, the neural network model, when exploring the microbial survival environment and animal ontological growth factors. Next, we verified whether the established BP neural network could output the corresponding cultivation conditions by inputting random numbers (Table 2). The data that we initially verified were split into two groups, and the output neurons, such as base material and soil ratio, carbon: nitrogen ratio, and mixed solution ratio were not assigned. The growth variables and living environment variables of other salt-tolerant earthworms were assigned initially (Table 2).
Above Table 2, the random number is input into the improved BP neural network model established in this study, and the predicted values of C:N, base:soil, NaHCO3:Na2CO3, and other neurons can be output at the output layer.
In this paper, there were two kinds of prediction results in the two groups of random numbers input. The prediction system output by test group 1 is 30:1 (C:N) and 1:1 (base:soil) and 1:1 ( N a H C O 3 : N a 2 C O 3 ), and the prediction system output by test group 2 is 25:1 (C:N) and 1:2 (base:soil) and 1:1 ( N a H C O 3 : N a 2 C O 3 ). In the process of practical breeding, which means that if you want to obtain the quantitative bound value of the corresponding variables in the random number and cultivation, you need to meet the above prediction system before you can achieve the goal.

6. Conclusions

In this study, the salt-tolerant earthworm cultivation process and cultivation conditions prediction were studied. By conducting dataset training on the survival conditions set during the cultivation process of earthworms with different tolerance, we explore the impact of cultivation conditions on the survival status of earthworms with different tolerances. A complete microecosystem needs to maintain a relatively stable and optimal survival condition for a long time. Screening and optimization of this condition is a necessary condition to ensure that animals and plants can continue to survive and grow in the current ecosystem and is also the foundation for maintaining sustainable development and utilization of the microecosystem. This study uses reasonable mathematical modeling ideas and screening the optimal conditions for breeding tolerant earthworms. This paper mainly explores the linkage prediction relationship between the growth characteristics of salt-tolerant earthworms and the living environment variables and predicts the cultivation conditions in the practical cultivation process of salt-tolerant earthworms with the help of the established improved BP neural network model. The conclusions are as follows: (1) earthworms living under simulated conditions have stronger tolerance to the saline-alkali environment; (2) the situation of C:N = 30:1, N a H C O 3 : N a 2 C O 3   = 1:1, base:soil = 1:2 is the ideal state for earthworms to survive; (3) earthworms with a high tolerance can provide more enzyme activities for the simulated environment, especially cellulase activity, urease activity, sucrase activity, and alkaline phosphatase activity; (4) compared with the ordinary practical operation, the average prediction accuracy of a three output neuron BP prediction model is 99.40% (>95%). The experimental data and model results show that the model can minimize the breeding cost, improve the reproduction rate of salt-tolerant earthworms and shorten the optimization time of salt-tolerant earthworm breeding conditions in the future. Improving the possibility of tolerant earthworms to improve contaminated soil provides a more reasonable and low-cost bioremediation method for the sustainable development and utilization of soil microecosystems.

Author Contributions

Conceptualization, M.W., S.Z., S.C. and Q.W.; methodology, C.T., Y.F., G.C. and S.Z.; software, S.C., G.C., Y.F. and M.W.; validation, Q.W., S.C., S.Z. and M.W.; formal analysis, S.C., Q.W., G.C. and C.T.; investigation, M.W., Y.F., G.C. and C.T.; resources, S.Z., G.C., M.W. and S.C.; data curation, Y.F., C.T., Q.W. and S.Z.; writing—original draft preparation, M.W., S.Z., S.C., Q.W., Y.F. and G.C.; writing—review and editing, M.W. and S.C.; visualization, Y.F., G.C. and S.C.; supervision, S.Z. and G.C.; project administration, G.C. and S.Z. All authors have read and agreed to the published version of the manuscript.

Funding

This study was funded by the Key Projects of the Jilin Province Science and Technology Development Plan (20210203117SF) and the National and Provincial College Student Innovation and Entrepreneurship Training Program (202010193143). The authors thank the Key Laboratory of Straw Comprehensive Utilization and Black Soil Conservation, Ministry of Education.

Data Availability Statement

Data can be available upon request for academic purposes through the corresponding author.

Acknowledgments

This study thanks the teachers and students at the Key Laboratory of Straw Comprehensive Utilization and Black Land Protection for their help.

Conflicts of Interest

The authors declare that the research was conducted in the absence of any commercial or financial relationships that could be construed as a potential conflict of interest.

References

  1. Wołejko, E.; Jabłońska-Trypuć, A.; Wydro, U.; Butarewicz, A.; Łozowicka, B. Soil biological activity as an indicator of soil pollution with pesticides—A review. Appl. Soil Ecol. 2019, 147, 103356. [Google Scholar] [CrossRef]
  2. Waigi, M.G.; Sun, K.; Gao, Y. Sphingomonads in Microbe-Assisted Phytoremediation: Tackling Soil Pollution. Trends Biotechnol. 2017, 35, 883–899. [Google Scholar] [CrossRef] [PubMed]
  3. Tang, J.; Zhang, J.; Ren, L.; Zhou, Y.; Gao, J.; Luo, L.; Yang, Y.; Peng, Q.; Huang, H.; Chen, A. Diagnosis of soil contamination using microbiological indices: A review on heavy metal pollution. J. Environ. Manag. 2019, 242, 121–130. [Google Scholar] [CrossRef] [PubMed]
  4. Nagajyoti, P.C.; Lee, K.D.; Sreekanth, T.V.M. Heavy metals, occurrence and toxicity for plants: A review. Environ. Chem. Lett. 2010, 8, 199–216. [Google Scholar] [CrossRef]
  5. Quina, A.S.; Durão, A.F.; Muñoz-Muñoz, F.; Ventura, J.; Mathias, M.D.L. Population effects of heavy metal pollution in wild Algerian mice (Mus spretus). Ecotoxicol. Environ. Saf. 2019, 171, 414–424. [Google Scholar] [CrossRef] [PubMed]
  6. Michaux, J.; Chevret, P.; Renaud, S. Morphological diversity of Old World rats and mice (Rodentia, Muridae) mandible in relation with phylogeny and adaptation. J. Zoöl. Syst. Evol. Res. 2007, 45, 263–279. [Google Scholar] [CrossRef]
  7. Negm, H.; Younes, N.; Rabee, A.; Youssef, M. Variations in growth behavior, yield and DNA stability of two vegetable crops cultivated in radioactive spiked soils. Environ. Pollut. 2019, 259, 113891. [Google Scholar] [CrossRef] [PubMed]
  8. Zhao, W.; Zhou, Q.; Tian, Z.; Cui, Y.; Liang, Y.; Wang, H. Apply biochar to ameliorate soda saline-alkali land, improve soil function and increase corn nutrient availability in the Songnen Plain. Sci. Total Environ. 2020, 722, 137428. [Google Scholar] [CrossRef] [PubMed]
  9. Sahariah, B.; Goswami, L.; Kim, K.-H.; Bhattacharyya, P.; Bhattacharya, S.S. Metal remediation and biodegradation potential of earthworm species on municipal solid waste: A parallel analysis between Metaphire posthuma and Eisenia fetida. Bioresour. Technol. 2015, 180, 230–236. [Google Scholar] [CrossRef] [PubMed]
  10. Gautam, A.; Ray, A.; Mukherjee, S.; Das, S.; Pal, K.; Das, S.; Karmakar, P.; Ray, M.; Ray, S. Immunotoxicity of copper nanoparticle and copper sulfate in a common Indian earthworm. Ecotoxicol. Environ. Saf. 2018, 148, 620–631. [Google Scholar] [CrossRef] [PubMed]
  11. Köhlerová, P.; Beschin, A.; Šilerová, M.; De Baetselier, P.; Bilej, M. Effect of experimental microbial challenge on the expression of defense molecules in Eisenia foetida earthworm. Dev. Comp. Immunol. 2004, 28, 701–711. [Google Scholar] [CrossRef] [PubMed]
  12. Kumar, P.S.; Behera, H.; K, A.K.; Nayak, J.; Naik, B. Advancement from neural networks to deep learning in software effort estimation: Perspective of two decades. Comput. Sci. Rev. 2020, 38, 100288. [Google Scholar] [CrossRef]
Figure 1. Prediction model of BP neural network algorithm (sigmoid function); (a) prediction model; (b) neuron structure.
Sustainability 15 06484 g001
Figure 2. Smooth curve of carbon: nitrogen ratio: (A) N a H C O 3 : N a 2 C O 3 = 1:1; base:soil = 1:1; (B) N a H C O 3 : N a 2 C O 3 = 1:1.5; base:soil = 1:1; (C) N a H C O 3 : N a 2 C O 3 = 1:1; base:soil = 1:2; (D) N a H C O 3 : N a 2 C O 3 = 1:1.5; base:soil = 1:2.
Sustainability 15 06484 g002
Figure 3. Smooth curve carbon: nitrogen ratio: (A) C:N = 25:1; base:soil = 1:1; (B) C:N = 25:1; base:soil = 1:2; (C) C:N = 30:1; base:soil = 1:1; (D) C:N = 30:1; base:soil = 1:2.
Sustainability 15 06484 g003
Figure 4. Smooth curve carbon nitrogen ratio: (A) C:N = 25:1; NaHCO3: N a 2 C O 3 = 1:1; (B) C:N = 25:1; N a H C O 3 : N a 2 C O 3 = 1:1.5; (C) C:N = 30:1; N a H C O 3 : N a 2 C O 3 = 1:1; (D) C:N = 30:1; N a H C O 3 : N a 2 C O 3 = 1:1.5.
Sustainability 15 06484 g004
Figure 5. Correlation analysis between different factors in the best cultivation conditions.
Sustainability 15 06484 g005
Figure 6. Network topology of factors within the optimal cultivation conditions.
Sustainability 15 06484 g006
Figure 7. Initial prediction trend of new birth, death, mortality, reproduction rate, and other factors at different levels.
Sustainability 15 06484 g007
Figure 8. Initial prediction trend of days and five humidity enzyme indexes at different levels.
Sustainability 15 06484 g008
Figure 9. BP neural network and prediction accuracy model at C:N level.
Sustainability 15 06484 g009
Figure 10. BP neural network and prediction accuracy model at soil ratio level.
Sustainability 15 06484 g010
Figure 11. BP neural network and prediction accuracy model at soil ratio level.
Sustainability 15 06484 g011
Table 1. BP neural network model prediction values at different levels.
Horizontal TypeNeurons Number in Input LayerNeurons Number in Hidden LayerNeurons Number in Output LayerWeight NumbersIteration Value (100 Times)Prediction Accuracy
Initial IterationFinal Iteration
Solution Ratio1115119643.4719380.101370100%
Soil Ratio1015118139.43674910.92349198.21%
C:N10516137.7922881.544886100%
Table 2. Generation of cultivation conditions random number.
DaysFatalityReproductivePHTemperature
Test Group 1300.080.248.7825
Test Group 2450.30.2625
HumidityCellulaseUreaseCatalaseSucrase
Test Group 10.482.522.0042.84114.28
Test Group 20.4520.81.512.28
Disclaimer/Publisher’s Note: The statements, opinions and data contained in all publications are solely those of the individual author(s) and contributor(s) and not of MDPI and/or the editor(s). MDPI and/or the editor(s) disclaim responsibility for any injury to people or property resulting from any ideas, methods, instructions or products referred to in the content.

