
Analysis on Trade Competition and Complementarity of High-Quality Agricultural Products in Countries along the Belt and Road Initiative
Abstract
1. Introduction
2. Materials and Methods
2.1. Research Methods
2.1.1. The Revealed Comparative Advantage (RCA) of Agricultural Products
2.1.2. The Export Similarity Index (ESI) of Agricultural Products
2.1.3. The Trade Complementarity Index (TCI) of Agricultural Products
2.2. Data Sources and Explanations
3. Results
3.1. The Competitiveness and Complementarity of the Agricultural Product Trade
3.1.1. Comparative Advantage Analysis of Agricultural Products
3.1.2. Competitive Analysis of the Agricultural Product Trade
3.1.3. Trade Complementarity Analysis of the Agricultural Product Trade
3.2. The Influence Factors of Competitiveness and Complementarity of Agricultural Products
3.2.1. The Influence Factors of Export Competitiveness of Agricultural Products
3.2.2. The Influence Factors of Export Complementarity of Agricultural Products
3.3. Expansion Analysis
3.3.1. Quality Calculation of Agricultural Products
3.3.2. Data Sources and Model Setting
3.3.3. Empirical Results and Analysis
- Baseline Regression
- 2.
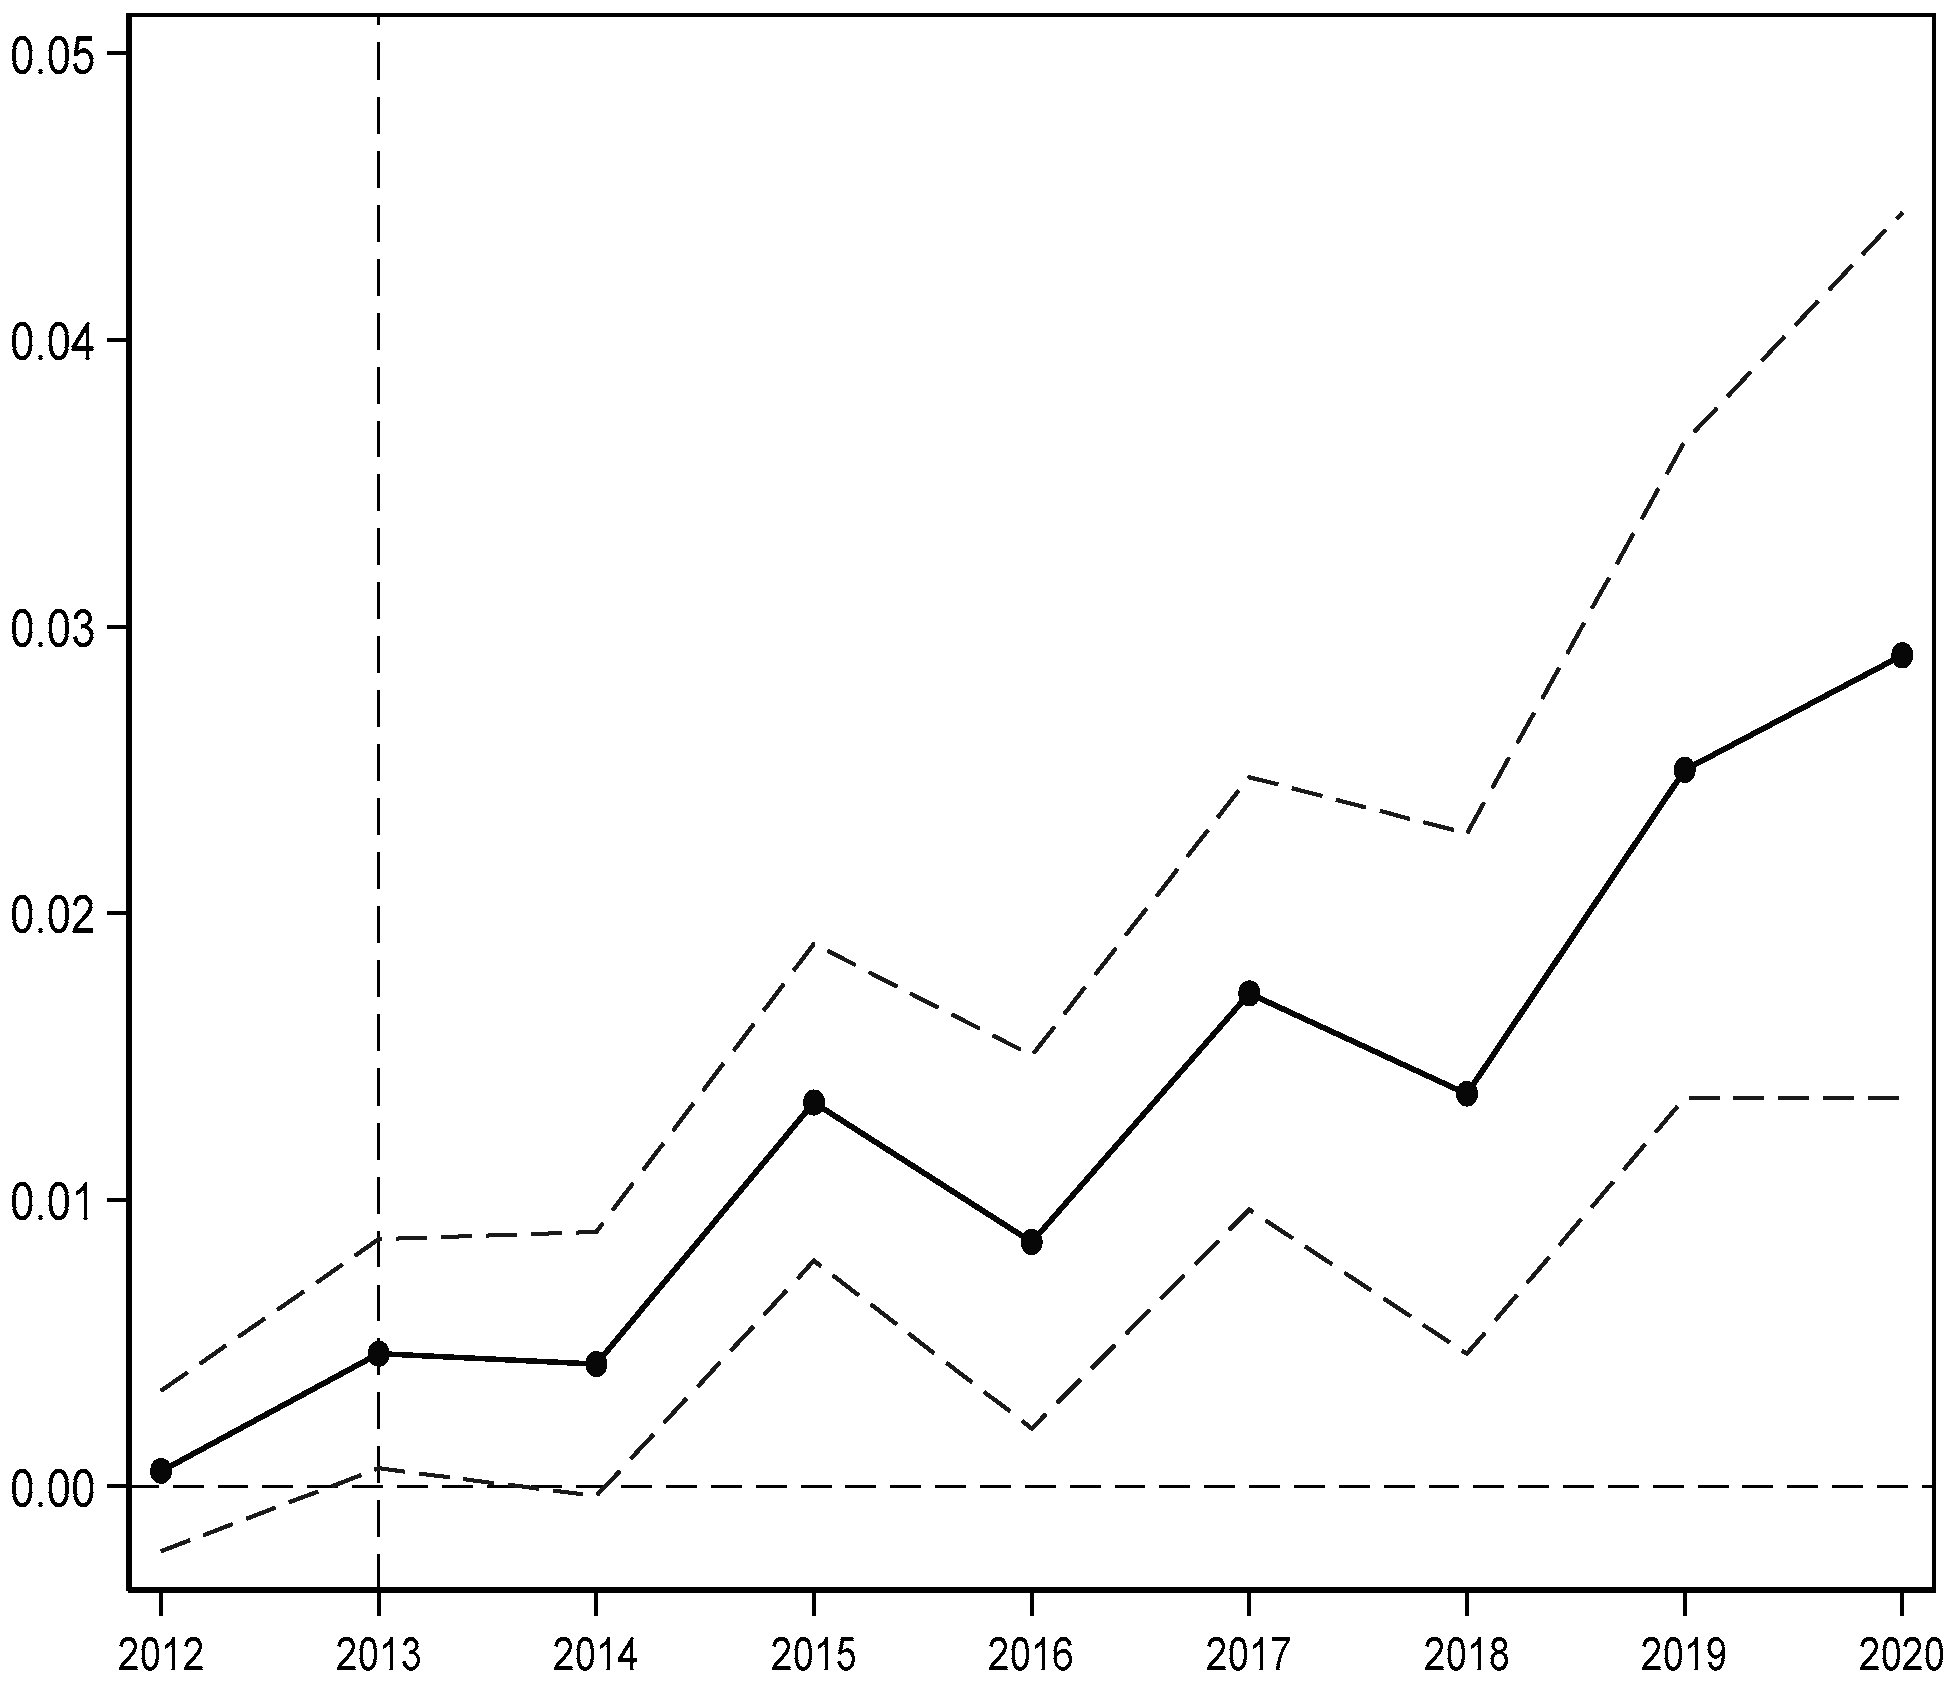
- Parallel Trend Test
- 3.
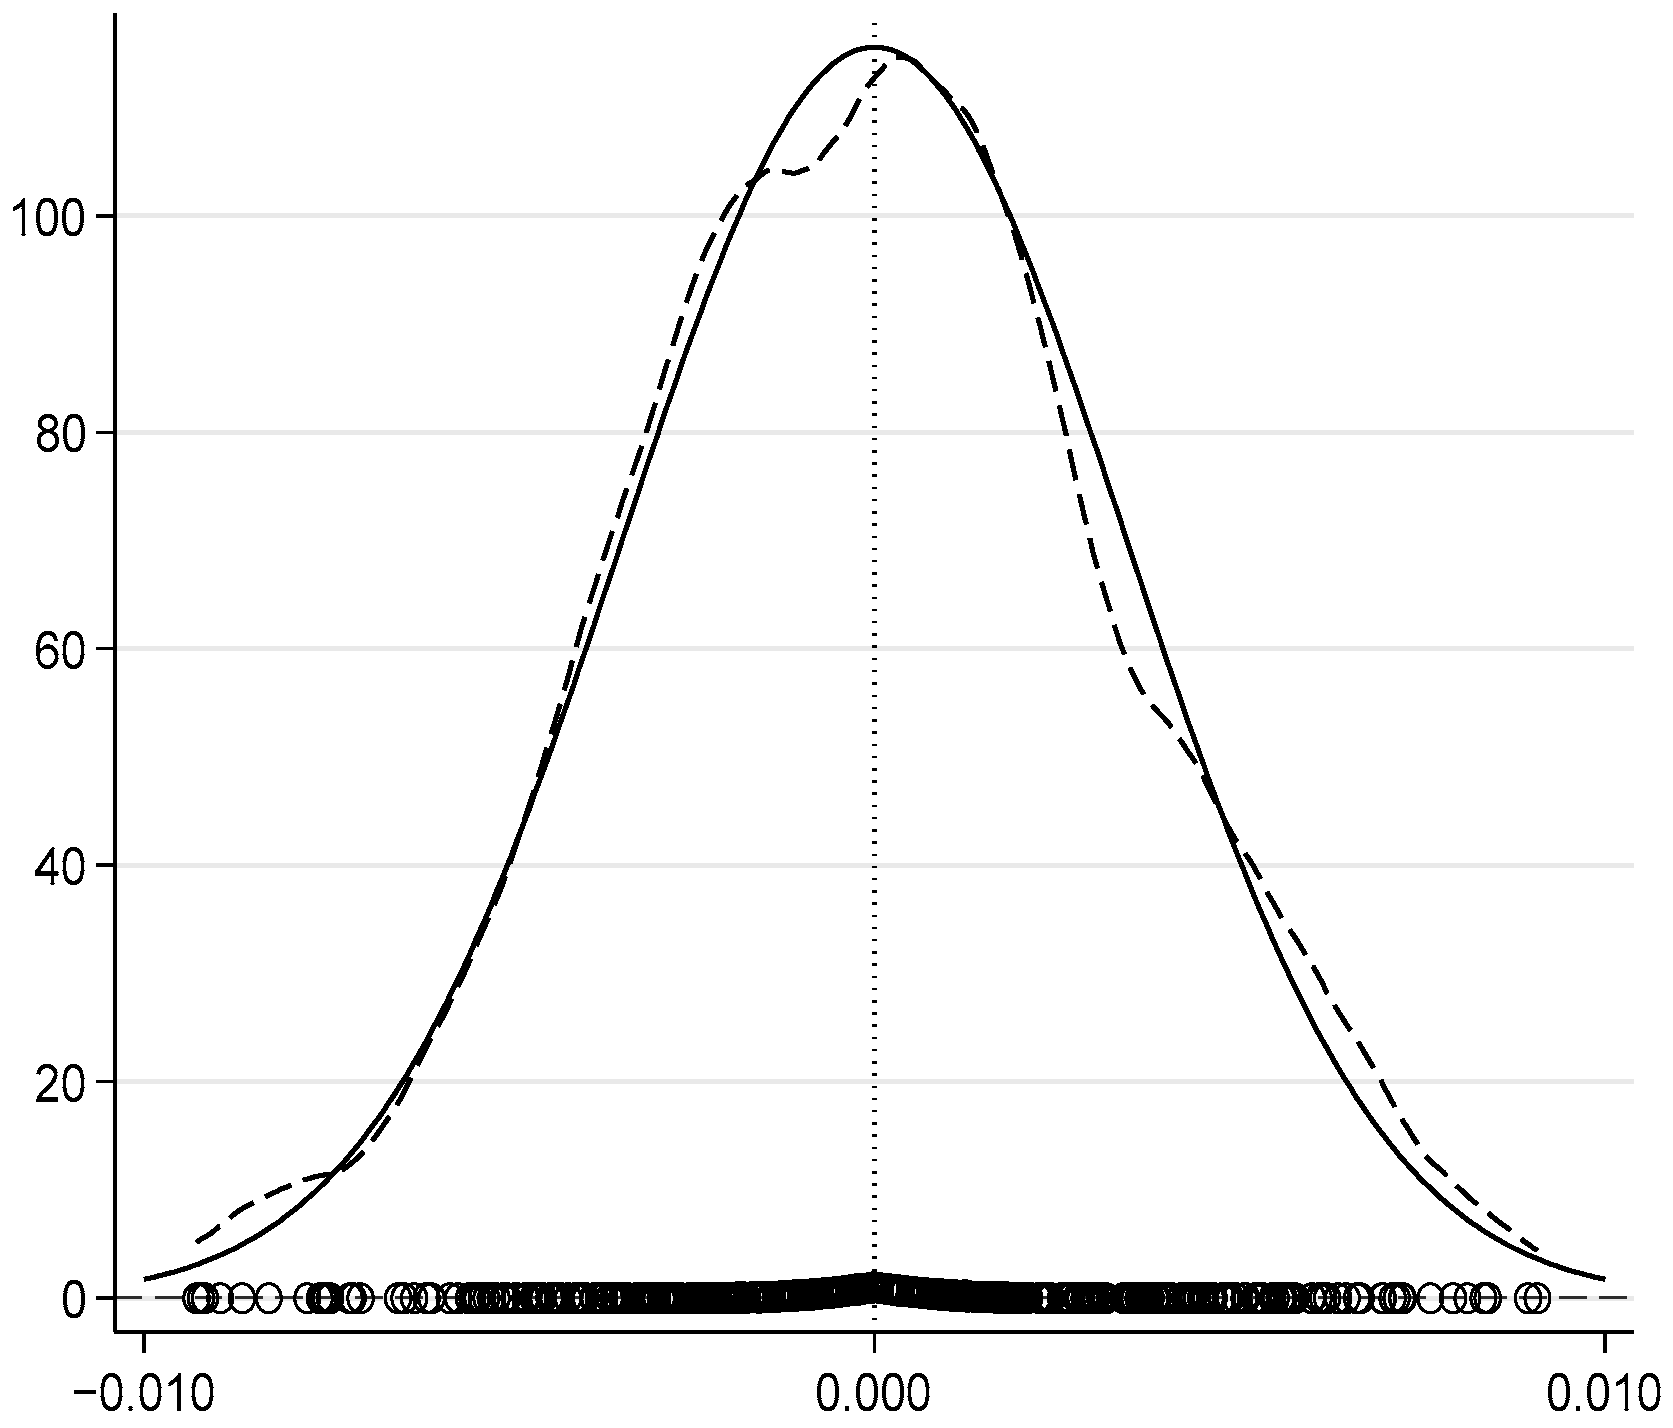
- Placebo Test
- 4.
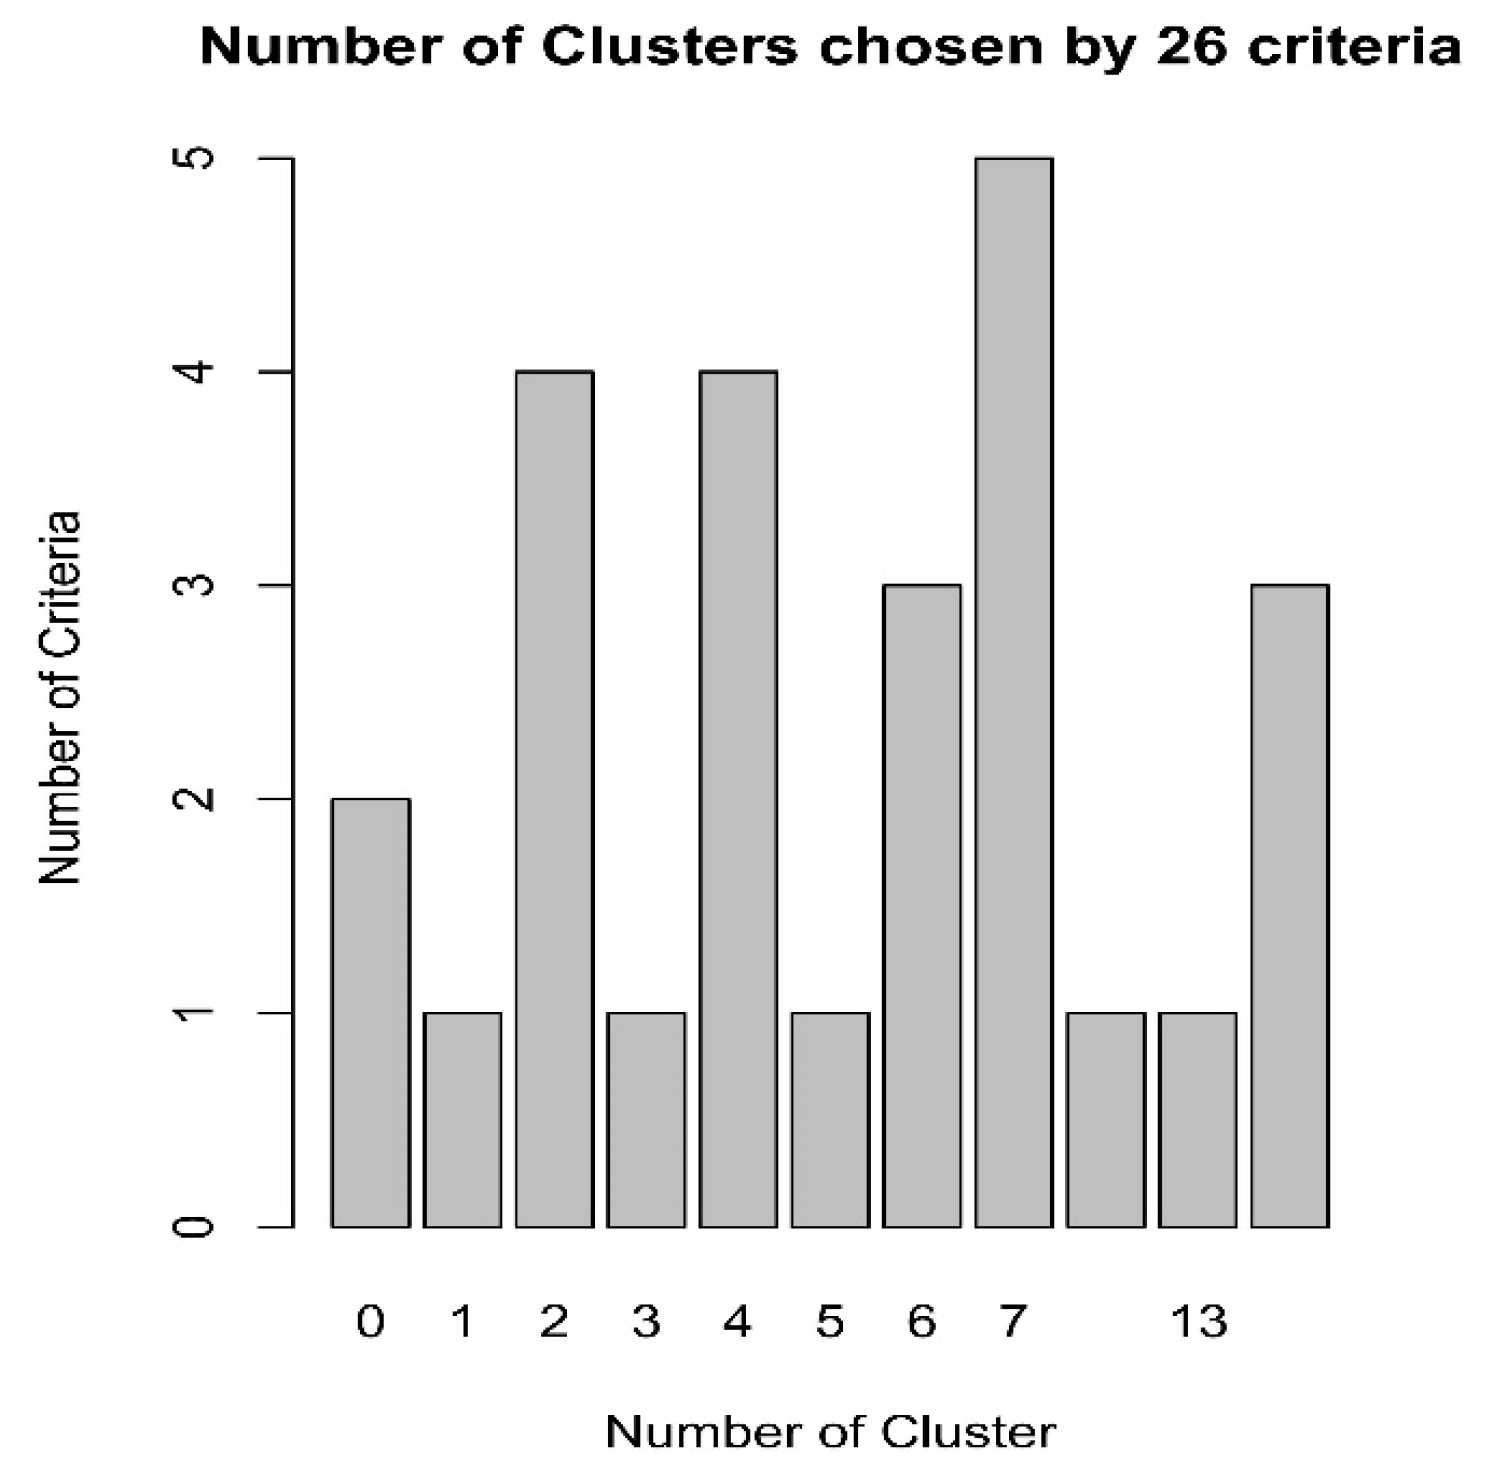
- Cluster Analysis and Heterogeneity Analysis
4. Discussion
5. Conclusions
Author Contributions
Funding
Institutional Review Board Statement
Informed Consent Statement
Data Availability Statement
Acknowledgments
Conflicts of Interest
Appendix A

| Type | Year | China | Central Asia | Northeast Asia | Southeast Asia | South Asia | Central and Eastern Europe | South Asia, Middle East |
|---|---|---|---|---|---|---|---|---|
| Planting industry | 2012 | 0.7771 | 1.8389 | 0.9369 | 0.9620 | 1.4327 | 1.0178 | 1.4210 |
| 2013 | 0.8074 | 1.8358 | 3.4084 | 0.9450 | 1.3638 | 1.0050 | 1.4050 | |
| 2014 | 0.7821 | 1.7323 | 0.1342 | 0.9653 | 1.3717 | 1.0212 | 1.4007 | |
| 2015 | 0.7838 | 1.7729 | 0.5124 | 0.9663 | 1.3596 | 1.0302 | 1.4010 | |
| 2016 | 0.8056 | 1.7733 | 1.4100 | 0.9704 | 1.3234 | 1.0251 | 1.4045 | |
| 2017 | 0.8141 | 1.7541 | 0.7945 | 1.0147 | 1.2864 | 0.9940 | 1.3907 | |
| 2018 | 0.8103 | 1.7989 | 3.7217 | 0.9919 | 1.3284 | 0.9815 | 1.4281 | |
| 2019 | 0.8452 | 1.7970 | 0.1599 | 0.9793 | 1.3047 | 1.0193 | 1.4724 | |
| 2020 | 0.8654 | 1.3903 | 0.6009 | 0.9856 | 1.4219 | 0.9896 | 1.2885 | |
| Forest industry | 2012 | 1.5164 | 0.0904 | 1.6462 | 1.8218 | 0.1228 | 1.7005 | 0.3930 |
| 2013 | 1.4832 | 0.0501 | 0.9490 | 1.8837 | 0.1030 | 1.7215 | 0.3535 | |
| 2014 | 1.5071 | 0.0246 | 3.2195 | 1.8389 | 0.1171 | 1.6920 | 0.3294 | |
| 2015 | 1.5803 | 0.0169 | 0.1298 | 1.7010 | 0.1477 | 1.6818 | 0.2967 | |
| 2016 | 1.5074 | 0.0768 | 0.5529 | 1.6131 | 0.1484 | 1.6983 | 0.2823 | |
| 2017 | 1.4578 | 0.0978 | 1.3958 | 1.6165 | 0.1554 | 1.7823 | 0.3221 | |
| 2018 | 1.4560 | 0.1369 | 0.8998 | 1.5046 | 0.1578 | 1.7864 | 0.3126 | |
| 2019 | 1.4285 | 0.1251 | 3.3172 | 1.5151 | 0.2009 | 1.7281 | 0.2905 | |
| 2020 | 1.4415 | 0.2275 | 0.1397 | 0.9625 | 0.4305 | 1.4144 | 0.5760 | |
| Animal husbandry | 2012 | 0.6577 | 0.0994 | 0.5354 | 0.1872 | 0.4994 | 1.1678 | 0.7601 |
| 2013 | 0.5866 | 0.1405 | 1.5305 | 0.1912 | 0.5688 | 1.1647 | 0.8448 | |
| 2014 | 0.6287 | 0.4782 | 0.9549 | 0.2004 | 0.5812 | 1.1011 | 0.8552 | |
| 2015 | 0.6204 | 0.2498 | 3.1188 | 0.2174 | 0.6258 | 1.1096 | 0.8696 | |
| 2016 | 0.5828 | 0.2385 | 0.1507 | 0.2180 | 0.6407 | 1.1309 | 0.8339 | |
| 2017 | 0.6004 | 0.2984 | 0.4970 | 0.2042 | 0.5711 | 1.1769 | 0.8336 | |
| 2018 | 0.6210 | 0.3485 | 1.4252 | 0.2371 | 0.5342 | 1.1762 | 0.8182 | |
| 2019 | 0.6814 | 0.4233 | 0.9485 | 0.2380 | 0.5492 | 1.0970 | 0.6805 | |
| 2020 | 0.4919 | 0.6126 | 3.3771 | 0.5333 | 0.4671 | 1.0241 | 0.9942 | |
| Agricultural and sideline industry | 2012 | 0.8648 | 0.2442 | 0.1726 | 0.7056 | 0.5891 | 0.7312 | 0.6222 |
| 2013 | 0.7952 | 0.2724 | 0.4820 | 0.7825 | 0.6525 | 0.7369 | 0.6282 | |
| 2014 | 0.8738 | 0.2979 | 1.3492 | 0.7910 | 0.5127 | 0.7394 | 0.6616 | |
| 2015 | 0.8923 | 0.2869 | 1.0508 | 0.8142 | 0.4156 | 0.7294 | 0.6119 | |
| 2016 | 0.9409 | 0.2788 | 2.8529 | 0.8443 | 0.3778 | 0.7322 | 0.6212 | |
| 2017 | 0.9218 | 0.2956 | 0.1635 | 0.8130 | 0.4702 | 0.7483 | 0.6433 | |
| 2018 | 0.8989 | 0.2500 | 0.3951 | 0.9244 | 0.4878 | 0.7707 | 0.5909 | |
| 2019 | 0.8540 | 0.2397 | 1.3710 | 0.9787 | 0.4677 | 0.7810 | 0.5872 | |
| 2020 | 0.7987 | 0.6410 | 0.9169 | 1.2085 | 0.5039 | 0.9799 | 0.7127 | |
| Aquaculture | 2012 | 1.6447 | 0.2648 | 3.1705 | 2.2629 | 1.0700 | 0.4787 | 0.4215 |
| 2013 | 1.6819 | 0.3264 | 0.2167 | 2.1865 | 1.2916 | 0.5045 | 0.4443 | |
| 2014 | 1.6454 | 0.3346 | 0.4851 | 2.0665 | 1.4857 | 0.5290 | 0.4535 | |
| 2015 | 1.5894 | 0.3472 | 1.6171 | 1.9603 | 1.5216 | 0.5212 | 0.4671 | |
| 2016 | 1.5540 | 0.2951 | 1.0308 | 1.8938 | 1.6836 | 0.5200 | 0.5024 | |
| 2017 | 1.5772 | 0.2877 | 1.7146 | 1.8980 | 1.7880 | 0.5272 | 0.4981 | |
| 2018 | 1.5972 | 0.1912 | 0.6304 | 1.8304 | 1.6956 | 0.5319 | 0.5278 | |
| 2019 | 1.5038 | 0.1650 | 0.7934 | 1.8494 | 1.8017 | 0.5270 | 0.5667 | |
| 2020 | 1.6426 | 0.2804 | 1.1845 | 1.4771 | 1.1114 | 0.6921 | 0.4434 |
| Year | State | State | Planting Industry | Forest Industry | Animal Husbandry | Agricultural and Sideline Industry | Aquaculture |
|---|---|---|---|---|---|---|---|
| 2013 | China | 5 Central Asian countries | 0.4142 | 0.0083 | 0.0210 | 0.0409 | 0.0588 |
| Mongolia | 0.3907 | 0.1092 | 0.0402 | 0.0903 | 0.0842 | ||
| 11 Southeast Asian countries | 0.3960 | 0.1328 | 0.0266 | 0.0596 | 0.1234 | ||
| 8 South Asian countries | 0.3243 | 0.0360 | 0.0283 | 0.0561 | 0.0985 | ||
| 19 Central and Eastern European countries | 0.3649 | 0.1369 | 0.0544 | 0.0849 | 0.0539 | ||
| Southwest Asia, 19 Middle Eastern countries | 0.3884 | 0.0281 | 0.0509 | 0.0723 | 0.0508 | ||
| 2016 | China | 5 Central Asian countries | 0.4258 | 0.0093 | 0.0318 | 0.0313 | 0.0556 |
| Mongolia | 0.4258 | 0.1071 | 0.0355 | 0.0629 | 0.0815 | ||
| 11 Southeast Asian countries | 0.3956 | 0.1357 | 0.0272 | 0.0729 | 0.1246 | ||
| 8 South Asian countries | 0.3569 | 0.0358 | 0.0216 | 0.0604 | 0.1035 | ||
| 19 Central and Eastern European countries | 0.3785 | 0.1373 | 0.0481 | 0.0918 | 0.0557 | ||
| Southwest Asia, 19 Middle Eastern countries | 0.4019 | 0.0254 | 0.0440 | 0.0837 | 0.0510 | ||
| 2019 | China | 5 Central Asian countries | 0.4348 | 0.0118 | 0.0345 | 0.0358 | 0.0162 |
| Mongolia, Russia | 0.2810 | 0.0977 | 0.0463 | 0.0611 | 0.1899 | ||
| 11 Southeast Asian countries | 0.4011 | 0.1209 | 0.0352 | 0.0735 | 0.1177 | ||
| 8 South Asian countries | 0.3696 | 0.0281 | 0.0236 | 0.0713 | 0.1124 | ||
| 19 Central and Eastern European countries | 0.3693 | 0.1303 | 0.0563 | 0.0959 | 0.0600 | ||
| Southwest Asia, 19 Middle Eastern countries | 0.4021 | 0.0168 | 0.0487 | 0.0742 | 0.0699 | ||
| 2013 | Mongolia, Russia | 5 Central Asian countries | 0.3907 | 0.0122 | 0.0256 | 0.0425 | 0.0335 |
| 11 Southeast Asian countries | 0.5067 | 0.0124 | 0.0144 | 0.0335 | 0.0404 | ||
| 8 South Asian countries | 0.5039 | 0.0103 | 0.0160 | 0.0312 | 0.0358 | ||
| 19 Central and Eastern European countries | 0.4808 | 0.0131 | 0.0295 | 0.0446 | 0.0305 | ||
| Southwest Asia, 19 Middle Eastern countries | 0.5734 | 0.0154 | 0.0286 | 0.0391 | 0.0285 | ||
| 2016 | Mongolia, Russia | 5 Central Asian countries | 0.5620 | 0.0157 | 0.0403 | 0.0288 | 0.0272 |
| 11 Southeast Asian countries | 0.5358 | 0.0131 | 0.0230 | 0.0268 | 0.0391 | ||
| 8 South Asian countries | 0.5272 | 0.0110 | 0.0198 | 0.0246 | 0.0360 | ||
| 19 Central and Eastern European countries | 0.4951 | 0.0158 | 0.0455 | 0.0307 | 0.0231 | ||
| Southwest Asia, 19 Middle Eastern countries | 0.5987 | 0.0170 | 0.0425 | 0.0288 | 0.0221 | ||
| 2019 | Mongolia, Russia | 5 Central Asian countries | 0.2850 | 0.0197 | 0.0468 | 0.0326 | 0.0162 |
| 11 Southeast Asian countries | 0.5362 | 0.0123 | 0.0239 | 0.0301 | 0.0142 | ||
| 8 South Asian countries | 0.5329 | 0.0106 | 0.0186 | 0.0298 | 0.0135 | ||
| 19 Central and Eastern European countries | 0.4639 | 0.0197 | 0.0480 | 0.0354 | 0.0153 | ||
| Southwest Asia, 19 Middle Eastern countries | 0.6168 | 0.0165 | 0.0412 | 0.0304 | 0.0142 | ||
| 2013 | 5 Central Asian countries | 11 Southeast Asian countries | 0.3781 | 0.0870 | 0.0228 | 0.0634 | 0.0529 |
| 8 South Asian countries | 0.3067 | 0.0295 | 0.0274 | 0.0592 | 0.0447 | ||
| 19 Central and Eastern European countries | 0.3483 | 0.0870 | 0.0814 | 0.0914 | 0.0302 | ||
| Southwest Asia, 19 Middle Eastern countries | 0.3710 | 0.0182 | 0.0963 | 0.0767 | 0.0277 | ||
| 2016 | 5 Central Asian countries | 11 Southeast Asian countries | 0.4665 | 0.0792 | 0.0274 | 0.0492 | 0.0565 |
| 8 South Asian countries | 0.4340 | 0.0226 | 0.0236 | 0.0436 | 0.0485 | ||
| 19 Central and Eastern European countries | 0.4395 | 0.0827 | 0.0688 | 0.0593 | 0.0340 | ||
| Southwest Asia, 19 Middle Eastern countries | 0.4892 | 0.0174 | 0.0734 | 0.0545 | 0.0311 | ||
| 2019 | 5 Central Asian countries | 11 Southeast Asian countries | 0.2667 | 0.0699 | 0.0315 | 0.0468 | 0.1175 |
| 8 South Asian countries | 0.2440 | 0.0186 | 0.0230 | 0.0466 | 0.1138 | ||
| 19 Central and Eastern European countries | 0.2502 | 0.0835 | 0.0826 | 0.0584 | 0.0607 | ||
| Southwest Asia, 19 Middle Eastern countries | 0.2675 | 0.0129 | 0.0785 | 0.0487 | 0.0703 | ||
| 2013 | 11 Southeast Asian countries | 8 south Asian countries | 0.3743 | 0.0332 | 0.0171 | 0.0506 | 0.0619 |
| 19 Central and Eastern European countries | 0.3992 | 0.1045 | 0.0276 | 0.0709 | 0.0373 | ||
| Southwest Asia, 19 Middle Eastern countries | 0.4410 | 0.0245 | 0.0264 | 0.0617 | 0.0356 | ||
| 2016 | 11 Southeast Asian countries | 8 South Asian countries | 0.4073 | 0.0269 | 0.0165 | 0.0590 | 0.0692 |
| 19 Central and Eastern European countries | 0.4097 | 0.1015 | 0.0322 | 0.0789 | 0.0417 | ||
| Southwest Asia, 19 Middle Eastern countries | 0.4596 | 0.0224 | 0.0299 | 0.0748 | 0.0382 | ||
| 2019 | 11 Southeast Asian countries | 8 South Asian countries | 0.4133 | 0.0237 | 0.0175 | 0.0653 | 0.0729 |
| 19 Central and Eastern European countries | 0.3890 | 0.0938 | 0.0355 | 0.0832 | 0.0423 | ||
| Southwest Asia, 19 Middle Eastern countries | 0.4573 | 0.0155 | 0.0313 | 0.0637 | 0.0473 | ||
| 2013 | 8 South Asian countries | 19 Central and Eastern European countries | 0.3534 | 0.0322 | 0.0344 | 0.0701 | 0.0340 |
| Southwest Asia, 19 Middle Eastern countries | 0.4072 | 0.0122 | 0.0327 | 0.0628 | 0.0352 | ||
| 2016 | 8 South Asian countries | 19 Central and Eastern European countries | 0.3822 | 0.0273 | 0.0289 | 0.0644 | 0.0370 |
| Southwest Asia, 19 Middle Eastern countries | 0.4384 | 0.0124 | 0.0261 | 0.0652 | 0.0380 | ||
| 2019 | 8 South Asian countries | 19 Central and Eastern European countries | 0.3675 | 0.0246 | 0.0268 | 0.0793 | 0.0417 |
| Southwest Asia, 19 Middle Eastern countries | 0.4418 | 0.0112 | 0.0232 | 0.0633 | 0.0489 | ||
| 2013 | 19 Central and Eastern European countries | Southwest Asia, 19 Middle Eastern countries | 0.4154 | 0.0257 | 0.0882 | 0.0872 | 0.0280 |
| 2016 | 19 Central and Eastern European countries | Southwest Asia, 19 Middle Eastern countries | 0.4321 | 0.0231 | 0.0731 | 0.0872 | 0.0283 |
| Year | State | State | Planting Industry | Forest Industry | Animal Husbandry | Agricultural and Sideline Industry | Aquaculture |
|---|---|---|---|---|---|---|---|
| 2012 | China | 5 Central Asian countries | 0.1976 | 0.4773 | 0.5833 | 0.5785 | 0.5657 |
| Mongolia, Russia | 0.3000 | 0.5482 | 0.5977 | 0.9998 | 0.9086 | ||
| 11 Southeast Asian countries | 0.5204 | 0.9928 | 0.8755 | 0.6722 | 0.9999 | ||
| 8 South Asian countries | 0.5011 | 0.8954 | 0.9996 | 0.5069 | 0.9978 | ||
| 19 Central and Eastern European countries | 0.3660 | 0.7600 | 0.6450 | 0.6291 | 0.9887 | ||
| Southwest Asia, 19 Middle Eastern countries | 0.5034 | 0.5370 | 0.8744 | 0.6460 | 0.6188 | ||
| 2020 | China | 5 Central Asian countries | 0.4344 | 0.5069 | 0.5281 | 0.8479 | 0.5157 |
| Mongolia, Russia | 0.9560 | 0.6350 | 0.5914 | 0.7810 | 0.7575 | ||
| 11 Southeast Asian countries | 0.5905 | 0.7846 | 0.5303 | 0.7584 | 0.7765 | ||
| 8 South Asian countries | 0.3591 | 0.9967 | 0.4960 | 0.7529 | 0.5064 | ||
| 19 Central and Eastern European countries | 0.5306 | 0.6208 | 0.5595 | 0.8638 | 0.7525 | ||
| Southwest Asia, 19 Middle Eastern countries | 0.5788 | 0.5191 | 0.7019 | 0.5011 | 0.5124 | ||
| 2012 | 5 Central Asian countries | China | 0.4769 | 0.5289 | 0.5479 | 0.8134 | 0.5236 |
| Mongolia, Russia | 0.5580 | 0.8717 | 0.7350 | 0.7773 | 0.5915 | ||
| 11 Southeast Asian countries | 0.4575 | 0.9998 | 1.0000 | 0.9397 | 0.4879 | ||
| 8 South Asian countries | 0.5073 | 1.0000 | 0.5713 | 0.5914 | 0.5028 | ||
| 19 Central and Eastern European countries | 0.6349 | 0.8364 | 1.0000 | 0.8979 | 0.9964 | ||
| Southwest Asia, 19 Middle Eastern countries | 0.9877 | 1.0000 | 1.0000 | 0.6592 | 0.5705 | ||
| 2020 | 5 Central Asian countries | China | 0.2522 | 0.8496 | 0.5272 | 0.6667 | 0.5243 |
| Mongolia, Russia | 0.6941 | 0.5094 | 0.5453 | 0.7283 | 0.5706 | ||
| 11 Southeast Asian countries | 0.5304 | 0.5000 | 0.6850 | 0.6860 | 0.5542 | ||
| 8 South Asian countries | 0.5021 | 1.0000 | 0.8459 | 0.9936 | 0.5491 | ||
| 19 Central and Eastern European countries | 0.3700 | 0.8627 | 0.5415 | 0.9997 | 0.5378 | ||
| Southwest Asia, 19 Middle Eastern countries | 0.8115 | 0.6455 | 0.5059 | 0.7854 | 0.5748 | ||
| 2012 | Mongolia, Russia | China | 0.5804 | 0.7423 | 0.5012 | 0.6938 | 0.6502 |
| 5 Central Asian countries | 0.2694 | 0.5945 | 0.5117 | 0.8555 | 0.6101 | ||
| 11 Southeast Asian countries | 1.0000 | 0.9993 | 0.8639 | 0.5069 | 0.6109 | ||
| 8 South Asian countries | 0.6261 | 0.9998 | 1.0000 | 0.8097 | 1.0000 | ||
| 19 Central and Eastern European countries | 0.4546 | 0.7262 | 0.7493 | 0.9708 | 0.9846 | ||
| Southwest Asia, 19 Middle Eastern countries | 0.8526 | 0.9995 | 0.9749 | 0.7532 | 0.5473 | ||
| 2020 | Mongolia, Russia | China | 0.3539 | 0.7608 | 0.7467 | 0.8220 | 0.6069 |
| 5 Central Asian countries | 0.9992 | 1.0000 | 0.8522 | 0.8821 | 0.5329 | ||
| 11 Southeast Asian countries | 0.5004 | 0.5232 | 0.7036 | 0.8802 | 0.5008 | ||
| 8 South Asian countries | 0.4996 | 0.4976 | 0.5171 | 0.8100 | 0.8798 | ||
| 19 Central and Eastern European countries | 0.4497 | 0.8253 | 1.0000 | 0.8811 | 0.6151 | ||
| Southwest Asia, 19 Middle Eastern countries | 0.9385 | 0.5069 | 0.5140 | 0.8127 | 0.5554 | ||
| 2012 | 11 Southeast Asian countries | China | 0.4982 | 0.6504 | 0.5551 | 0.7082 | 0.6674 |
| 5 Central Asian countries | 0.5486 | 0.6053 | 0.9970 | 0.9991 | 0.5836 | ||
| Mongolia, Russia | 0.5210 | 0.9618 | 0.5026 | 0.8967 | 0.4999 | ||
| 8 South Asian countries | 0.9318 | 0.8962 | 0.5055 | 0.8901 | 0.7387 | ||
| 19 Central and Eastern European countries | 0.6829 | 0.7185 | 0.6892 | 0.6619 | 0.5567 | ||
| Southwest Asia, 19 Middle Eastern countries | 0.6674 | 0.9551 | 1.0000 | 0.8756 | 0.7047 | ||
| 2020 | 11 Southeast Asian countries | China | 0.3640 | 0.6170 | 0.5673 | 0.8528 | 0.7684 |
| 5 Central Asian countries | 0.6052 | 1.0000 | 0.7492 | 0.7933 | 0.9155 | ||
| Mongolia, Russia | 0.5016 | 0.5340 | 0.5403 | 0.6882 | 0.6871 | ||
| 8 South Asian countries | 0.5044 | 0.9987 | 0.5008 | 0.9067 | 0.7381 | ||
| 19 Central and Eastern European countries | 0.5376 | 0.6201 | 0.5185 | 0.9890 | 0.5560 | ||
| Southwest Asia, 19 Middle Eastern countries | 0.5111 | 0.9747 | 0.5000 | 0.8302 | 0.5937 | ||
| 2012 | 8 South Asian countries | China | 0.4019 | 0.4727 | 0.5151 | 0.7451 | 0.5847 |
| 5 Central Asian countries | 0.3797 | 0.4882 | 1.0000 | 0.9998 | 0.5760 | ||
| Mongolia, Russia | 0.5016 | 0.8506 | 0.5812 | 0.7284 | 0.5445 | ||
| 11 Southeast Asian countries | 0.5018 | 0.7145 | 0.7383 | 0.7689 | 0.9997 | ||
| 19 Central and Eastern European countries | 0.4727 | 0.5672 | 0.6111 | 0.6444 | 0.5789 | ||
| Southwest Asia, 19 Middle Eastern countries | 0.7197 | 0.5657 | 0.6568 | 0.7000 | 0.5964 | ||
| 2020 | 8 South Asian countries | China | 0.2872 | 0.5205 | 0.7675 | 0.8329 | 0.9056 |
| 5 Central Asian countries | 0.5181 | 1.0000 | 0.6892 | 0.7063 | 0.4882 | ||
| Mongolia, Russia | 0.5007 | 0.6055 | 0.7195 | 0.5224 | 0.7527 | ||
| 11 Southeast Asian countries | 0.6074 | 0.6818 | 0.5047 | — | 0.9190 | ||
| 19 Central and Eastern European countries | 0.3788 | 0.5894 | 0.4985 | 0.8287 | 0.4933 | ||
| Southwest Asia, 19 Middle Eastern countries | 0.6085 | 0.5289 | 1.0000 | 0.6105 | 0.5142 | ||
| 2012 | 19 Central and Eastern European countries | China | 0.5774 | 0.6617 | 0.6038 | 0.8746 | 0.7157 |
| 5 Central Asian countries | 0.3448 | 0.5638 | 0.6222 | 0.7972 | 0.7411 | ||
| Mongolia, Russia | 0.5439 | 0.7716 | 0.6463 | 0.9994 | 0.6127 | ||
| 11 Southeast Asian countries | 1.0000 | 0.5060 | 0.5079 | 0.8483 | 0.6181 | ||
| 8 South Asian countries | 1.0000 | 0.6552 | 0.5602 | 0.8087 | 0.7213 | ||
| Southwest Asia, 19 Middle Eastern countries | 0.7165 | 0.7427 | 0.7954 | 0.6637 | 0.6557 | ||
| 2020 | 19 Central and Eastern European countries | China | 0.3820 | 0.7652 | 0.6055 | 0.8227 | 0.4886 |
| 5 Central Asian countries | 0.5171 | 1.0000 | 0.7664 | 0.8687 | 0.6668 | ||
| Mongolia, Russia | 0.9490 | 0.5179 | 0.5832 | 0.8120 | 0.5958 | ||
| 11 Southeast Asian countries | 0.5048 | 0.9659 | 0.5059 | 0.7472 | 0.4992 | ||
| 8 South Asian countries | 0.9999 | 0.5268 | 0.5287 | 0.7127 | 0.9932 | ||
| Southwest Asia, 19 Middle Eastern countries | 0.5258 | 0.5415 | 0.6443 | 0.5633 | 0.5010 | ||
| 2012 | Southwest Asia, 19 Middle Eastern countries | China | 0.4218 | 0.6417 | 0.5138 | 0.8692 | 0.7076 |
| 5 Central Asian countries | 0.5780 | 0.6078 | 0.9996 | 0.8260 | 0.6781 | ||
| Mongolia, Russia | 0.5244 | 0.9997 | 0.4998 | 0.9814 | 0.5535 | ||
| 11 Southeast Asian countries | 0.5105 | 0.9731 | 0.5077 | 0.8463 | 0.8600 | ||
| 8 South Asian countries | 1.0000 | 0.9993 | 0.7407 | 0.8460 | 0.8958 | ||
| 19 Central and Eastern European countries | 0.8004 | 0.8331 | 0.6824 | 0.8582 | 0.5406 | ||
| 2020 | Southwest Asia, 19 Middle Eastern countries | China | 0.2762 | 0.5380 | 0.6042 | 0.8909 | 0.6005 |
| 5 Central Asian countries | 0.5127 | 0.6908 | 0.7006 | 0.9194 | 0.6100 | ||
| Mongolia, Russia | 0.6576 | 0.5649 | 0.9675 | 0.8577 | 0.9598 | ||
| 11 Southeast Asian countries | 0.6046 | 0.6866 | 0.5198 | 0.8027 | 0.7489 | ||
| 8 South Asian countries | 0.5744 | 0.5299 | 0.8145 | 0.5917 | 0.5098 | ||
| 19 Central and Eastern European countries | 0.6171 | 0.7813 | 0.6252 | 0.8790 | 0.5636 |
| Number | Country | Number | Country | Number | Country |
|---|---|---|---|---|---|
| 1 | China | 23 | Afghanistan | 45 | Belarus |
| 2 | Kazakhstan | 24 | Nepal | 46 | Moldova |
| 3 | Kyrgyzstan | 25 | Bhutan | 47 | Turkey |
| 4 | Tajikistan | 26 | Sri Lanka | 48 | Iran |
| 5 | Uzbekistan | 27 | Maldives | 49 | Syria |
| 6 | Turkmenistan | 28 | Poland | 50 | Iraq |
| 7 | Mongolia | 29 | Czech Republic | 51 | United Arab Emirates |
| 8 | Russia | 30 | Slovakia | 52 | Saudi Arabia |
| 9 | Vietnam | 31 | Hungary | 53 | Qatar |
| 10 | Laos | 32 | Slovenia | 54 | Bahrain |
| 11 | Cambodia | 33 | Croatia | 55 | Kuwait |
| 12 | Thailand | 34 | Romania | 56 | Lebanon |
| 13 | Malaysia | 35 | Bulgaria | 57 | Oman |
| 14 | Singapore | 36 | Serbia | 58 | Yemen |
| 15 | Indonesia | 37 | Montenegro | 59 | Jordan |
| 16 | Brunei | 38 | Macedonia | 60 | Israel |
| 17 | Philippines | 39 | Bosnia and Herzegovina | 61 | Palestine |
| 18 | Myanmar | 40 | Albania | 62 | Armenia |
| 19 | Timor-Leste | 41 | Estonia | 63 | Georgia |
| 20 | India | 42 | Lithuania | 64 | Azerbaijan |
| 21 | Pakistan | 43 | Latvia | 65 | Egypt |
| 22 | Bangladesh | 44 | Ukraine |
References
- Czerewacz-Filipowicz, K. The Eurasian Economic Union as an Element of the Belt and Road Initiative. Sciendo 2019, 22, 23–37. [Google Scholar] [CrossRef]
- Huang, Y.P. Understanding China’s Belt & Road Initiative: Motivation, framework and assessment. China Econ. Rev. 2016, 40, 314–321. [Google Scholar]
- Johnson, D.G. Role of Agriculture in Economic Development Revisited. Agric. Econ. 1993, 8, 421–434. [Google Scholar] [CrossRef]
- Wu, Z.H.; Hou, G.S.; Xin, B.G. Has the Belt and Road Initiative Brought New Opportunities to Countries Along the Routes to Participate in Global Value Chains? SAGE Open. 2020, 10, 2158244020902088. [Google Scholar] [CrossRef]
- Zheng, Z.; Liu, W.D.; Song, Z.Y. Does the Belt and Road Initiative Promote Value Chain Connection Between China and the Silk Road Countries? Chin. Geogr. Sci. 2021, 5, 979–995. [Google Scholar] [CrossRef]
- Lu, Y.; Lu, Y.L.; Zeng, K.; Li, Y.D. China’s Outward Foreign Direct Investment and the Margins of Trade: Empirical Evidence from "One Belt, One Road" Countries. China 2018, 16, 129–151. [Google Scholar] [CrossRef]
- Martin, J.; Mejean, I. Low-wage Country Competition and the Quality Content of High-wage Country exports. J. Int. Econ. 2014, 93, 140–152. [Google Scholar] [CrossRef]
- Zhai, F. China’s belt and road initiative: A preliminary quantitative assessment. J. Asian Econ. 2018, 55, 84–92. [Google Scholar] [CrossRef]
- Arrfat, Y. Aligning the Global Value Chains of China and Pakistan in the Context of the Belt and Road Initiative. China’s Belt Road Initiat. A Glob. Context 2019, 1, 203–226. [Google Scholar]
- Zhou, L.Z.; Tong, G.J. Research on the competitiveness and influencing factors of agricultural products trade between China and the countries along the "Belt and Road". Alex. Eng. J. 2022, 61, 8919–8931. [Google Scholar] [CrossRef]
- Liu, C.L.; Xu, J.Q.; Zhang, H. Competitiveness or Complementarity? A Dynamic Network Analysis of International Agri-Trade along the Belt and Road. Appl. Spat. Anal. Policy 2020, 13, 349–374. [Google Scholar] [CrossRef]
- Zhang, Z.; Gao, Y.; Wei, T.Y. The Impact of Trade Barrier Reductions on Global Value Chains for Agricultural Products in China and Countries along the ‘Belt and Road’. World Trade Rev. 2022, 21, 224–248. [Google Scholar] [CrossRef]
- Clough, S.B. Applied Economics: Aspects of the World Economy in War and Peace; Brown, A.J., Ed.; Rinehart and Company: New York, NY, USA, 1949; Volume 9, pp. 112–113. [Google Scholar]
- Bouët, A.; Cosnard, L.; Laborde, D. Measuring Trade Integration in Africa. J. Econ. Integr. 2017, 32, 937–977. [Google Scholar] [CrossRef]
- Balassa, B. Trade Liberalization and "Revealed" Comparative Advantage. Manch. Sch. Econ. Soc. Stud. 1965, 33, 99–123. [Google Scholar] [CrossRef]
- Zhang, F.H. Competitiveness or Complementarity: Analysis of Agricultural Trade between China and Brazil. Probl. Perspect. Manag. 2021, 19, 258–269. [Google Scholar] [CrossRef]
- Blázquez-Lido, J.; Rodríguez, J.; Santiso, J. Angel or Devil? China’s Trade Impact on Latin American Emerging Markets. Soc. Sci. Res. Netw. 2008, 11, 15–41. [Google Scholar]
- Nurgazina, Z.; Lu, Q.; Zhang, S.X.; Ali, U. Competitiveness of Agricultural Trade between Kazakhstan and China. Pak. J. Agric. Sci. 2020, 57, 1447–1454. [Google Scholar]
- Hatab, A.A.; Romstad, E.; Huo, X. Determinants of Egyptian Agricultural Exports: A Gravity Model Approach. Mod. Econ. 2010, 1, 134–143. [Google Scholar] [CrossRef]
- Zwane, E.M. Impact of climate change on primary agriculture, water sources and food security in Western Cape, South Africa. J. Disaster Risk Stud. 2019, 11, 562. [Google Scholar] [CrossRef]
- Putri, R.F.; Naufal, M.; Nandini, M.; Dwiputra, D.S.; Wibirama, S.; Sumantyo, J. The Impact of Population Pressure on Agricultural Land towards Food Sufficiency (Case in West Kalimantan Province, Indonesia). IOP Conf. Ser. Earth Environ. Sci. 2019, 256, 012050. [Google Scholar] [CrossRef]
- Ang, J.B. Agricultural Legacy and Individualistic Culture. J. Econ. Growth 2019, 24, 397–425. [Google Scholar] [CrossRef]
- Shamdasani, Y. Rural road infrastructure & agricultural production: Evidence from India. J. Dev. Econ. 2021, 152, 102686. [Google Scholar]
- Sanjuan-Lopez, A.I.; Dawson, P.J. Agricultural Exports and Economic Growth in Developing Countries: A Panel Cointegration Approach. J. Agric. Econ. 2010, 61, 565–583. [Google Scholar] [CrossRef]
- Huo, D.; Chen, Y.; Hung, K.; Song, Z.N.; Guan, J.L.; Ji, A. Diamond model and the export competitiveness of the agriculture industry from emerging markets: An exploratory vision based on a spatial effect study using a genetic algorithm. Ekon. Istraz. 2020, 33, 2427–2443. [Google Scholar] [CrossRef]
- Okpe, A.E.; Ikpesu, F. Effect of Inflation on Food Imports and Exports. J. Dev. Areas 2021, 55, 1–10. [Google Scholar] [CrossRef]
- Jagdambe, S.; Kannan, E. Effects of ASEAN-India Free Trade Agreement on agricultural trade: The gravity model approach. World Dev. Perspect. 2020, 19, 100212. [Google Scholar] [CrossRef]
- Istudor, N.; Constantin, M.; Ignat, R.; Chiripuci, B.C.; Petrescu, I.E. The Complexity of Agricultural Competitiveness: Going Beyond the Balassa Index. J. Compet. 2022, 14, 61–77. [Google Scholar]
- Finger, J.M.; Kreinin, M.E. A Measure of ‘Export Similarity’ and Its Possible Uses. Econ. J. 1979, 89, 905–912. [Google Scholar] [CrossRef]
- Grubel, H.G.; Lloyd, P.J. The Empirical Measurement of Intra-Industry Trade. Econ. Rec. 1971, 47, 494–517. [Google Scholar] [CrossRef]
- Korinek, J.; Sourdin, P. Clarifying Trade Costs: Maritime Transport and Its Effect on Agricultural Trade. Appl. Econ. Perspect. Policy 2010, 32, 417–435. [Google Scholar] [CrossRef]
- Narayan, S.; Bhattacharya, P. Relative export competitiveness of agricultural commodities and its determinants: Some evidence from India. World Dev. 2019, 117, 183. [Google Scholar] [CrossRef]
- Janeba, E. International Trade and Consumption Network Externalities. Eur. Econ. Rev. 2007, 51, 781–803. [Google Scholar] [CrossRef]
- Canzoneri, M.B.; Cumby, R.E.; Diba, B.T. The Need for International Policy Coordination: What’s Old, What’s New, What’s yet to Come? J. Int. Econ. 2005, 66, 363–384. [Google Scholar] [CrossRef]
- Yu, J.P. Comparative Advantage and Trade Complementarity between China and Major Countries and Regions in East Asia. World Econ. 2003, 5, 33–40. [Google Scholar]
- Donaldson, D. Railroads of the Raj: Estimating the Impact of Transportation Infrastructure. Am. Econ. Rev. 2018, 108, 899–934. [Google Scholar] [CrossRef]
- Portugal-Perez, A.; Wilson, J.S. Export Performance and Trade Facilitation Reform: Hard and Soft Infrastructure. World Dev. 2012, 40, 1295–1307. [Google Scholar] [CrossRef]
- Haggai, K. One Belt One Road Strategy in China and Economic Development in the Concerning Countries. World J. Soc. Sci. Humanit. 2016, 2, 10–14. [Google Scholar]
- Khandelwal, A.K.; Schott, P.K.; Wei, S.J. Trade Liberalization and Embedded Institutional Reform: Evidence from Chinese Exporters. Am. Econ. Rev. 2013, 103, 2169–2195. [Google Scholar] [CrossRef]
- Broda, C.M.; Weinstein, D.E. Globalization and the Gains from Variety. Q. J. Econ. 2006, 121, 541–585. [Google Scholar] [CrossRef]
- Beck, T.; Levine, R.; Levkov, A. Big Bad Banks? The Winners and Losers From Bank Deregulation in the United States. J. Financ. 2010, 65, 1637–1667. [Google Scholar] [CrossRef]
- Draca, M.; Machin, S.; Van Reenen, J. Minimum Wages and Firm Profitability. Am. Econ. J.-Appl. Econ. 2011, 3, 129–151. [Google Scholar] [CrossRef]
- Jacobson, L.S.; LaLonde, R.J.; Sullivan, D.G. Earnings Losses of Displaced Workers. Am. Econ. Rev. 1993, 83, 685–709. [Google Scholar]
- Li, P.; Lu, Y.; Wang, J. Does Flattening Government improve Economic Performance? Evidence from China. J. Dev. Econ. 2016, 123, 18–37. [Google Scholar] [CrossRef]
- Fan, H.L.; Thi, V.; Zhang, W.; Li, S. The influence of trade facilitation on agricultural product exports of China: Empirical evidence from ASEAN countries. Ekon. Istraz. 2022, 23. [Google Scholar] [CrossRef]
- Xing, L.R.; Yin, X.M.; Cao, C.X.; Elahi, E.; Wei, T.Y. The Impact of Multidimensional Distance on Agricultural Exports: Evidence from China Based on the Technological Added Value. Sustainability 2023, 15, 393. [Google Scholar] [CrossRef]
- Kandilov, I.T. The effects of exchange rate volatility on agricultural trade. Am. J. Agr. Econ. 2008, 90, 1028–1043. [Google Scholar] [CrossRef]


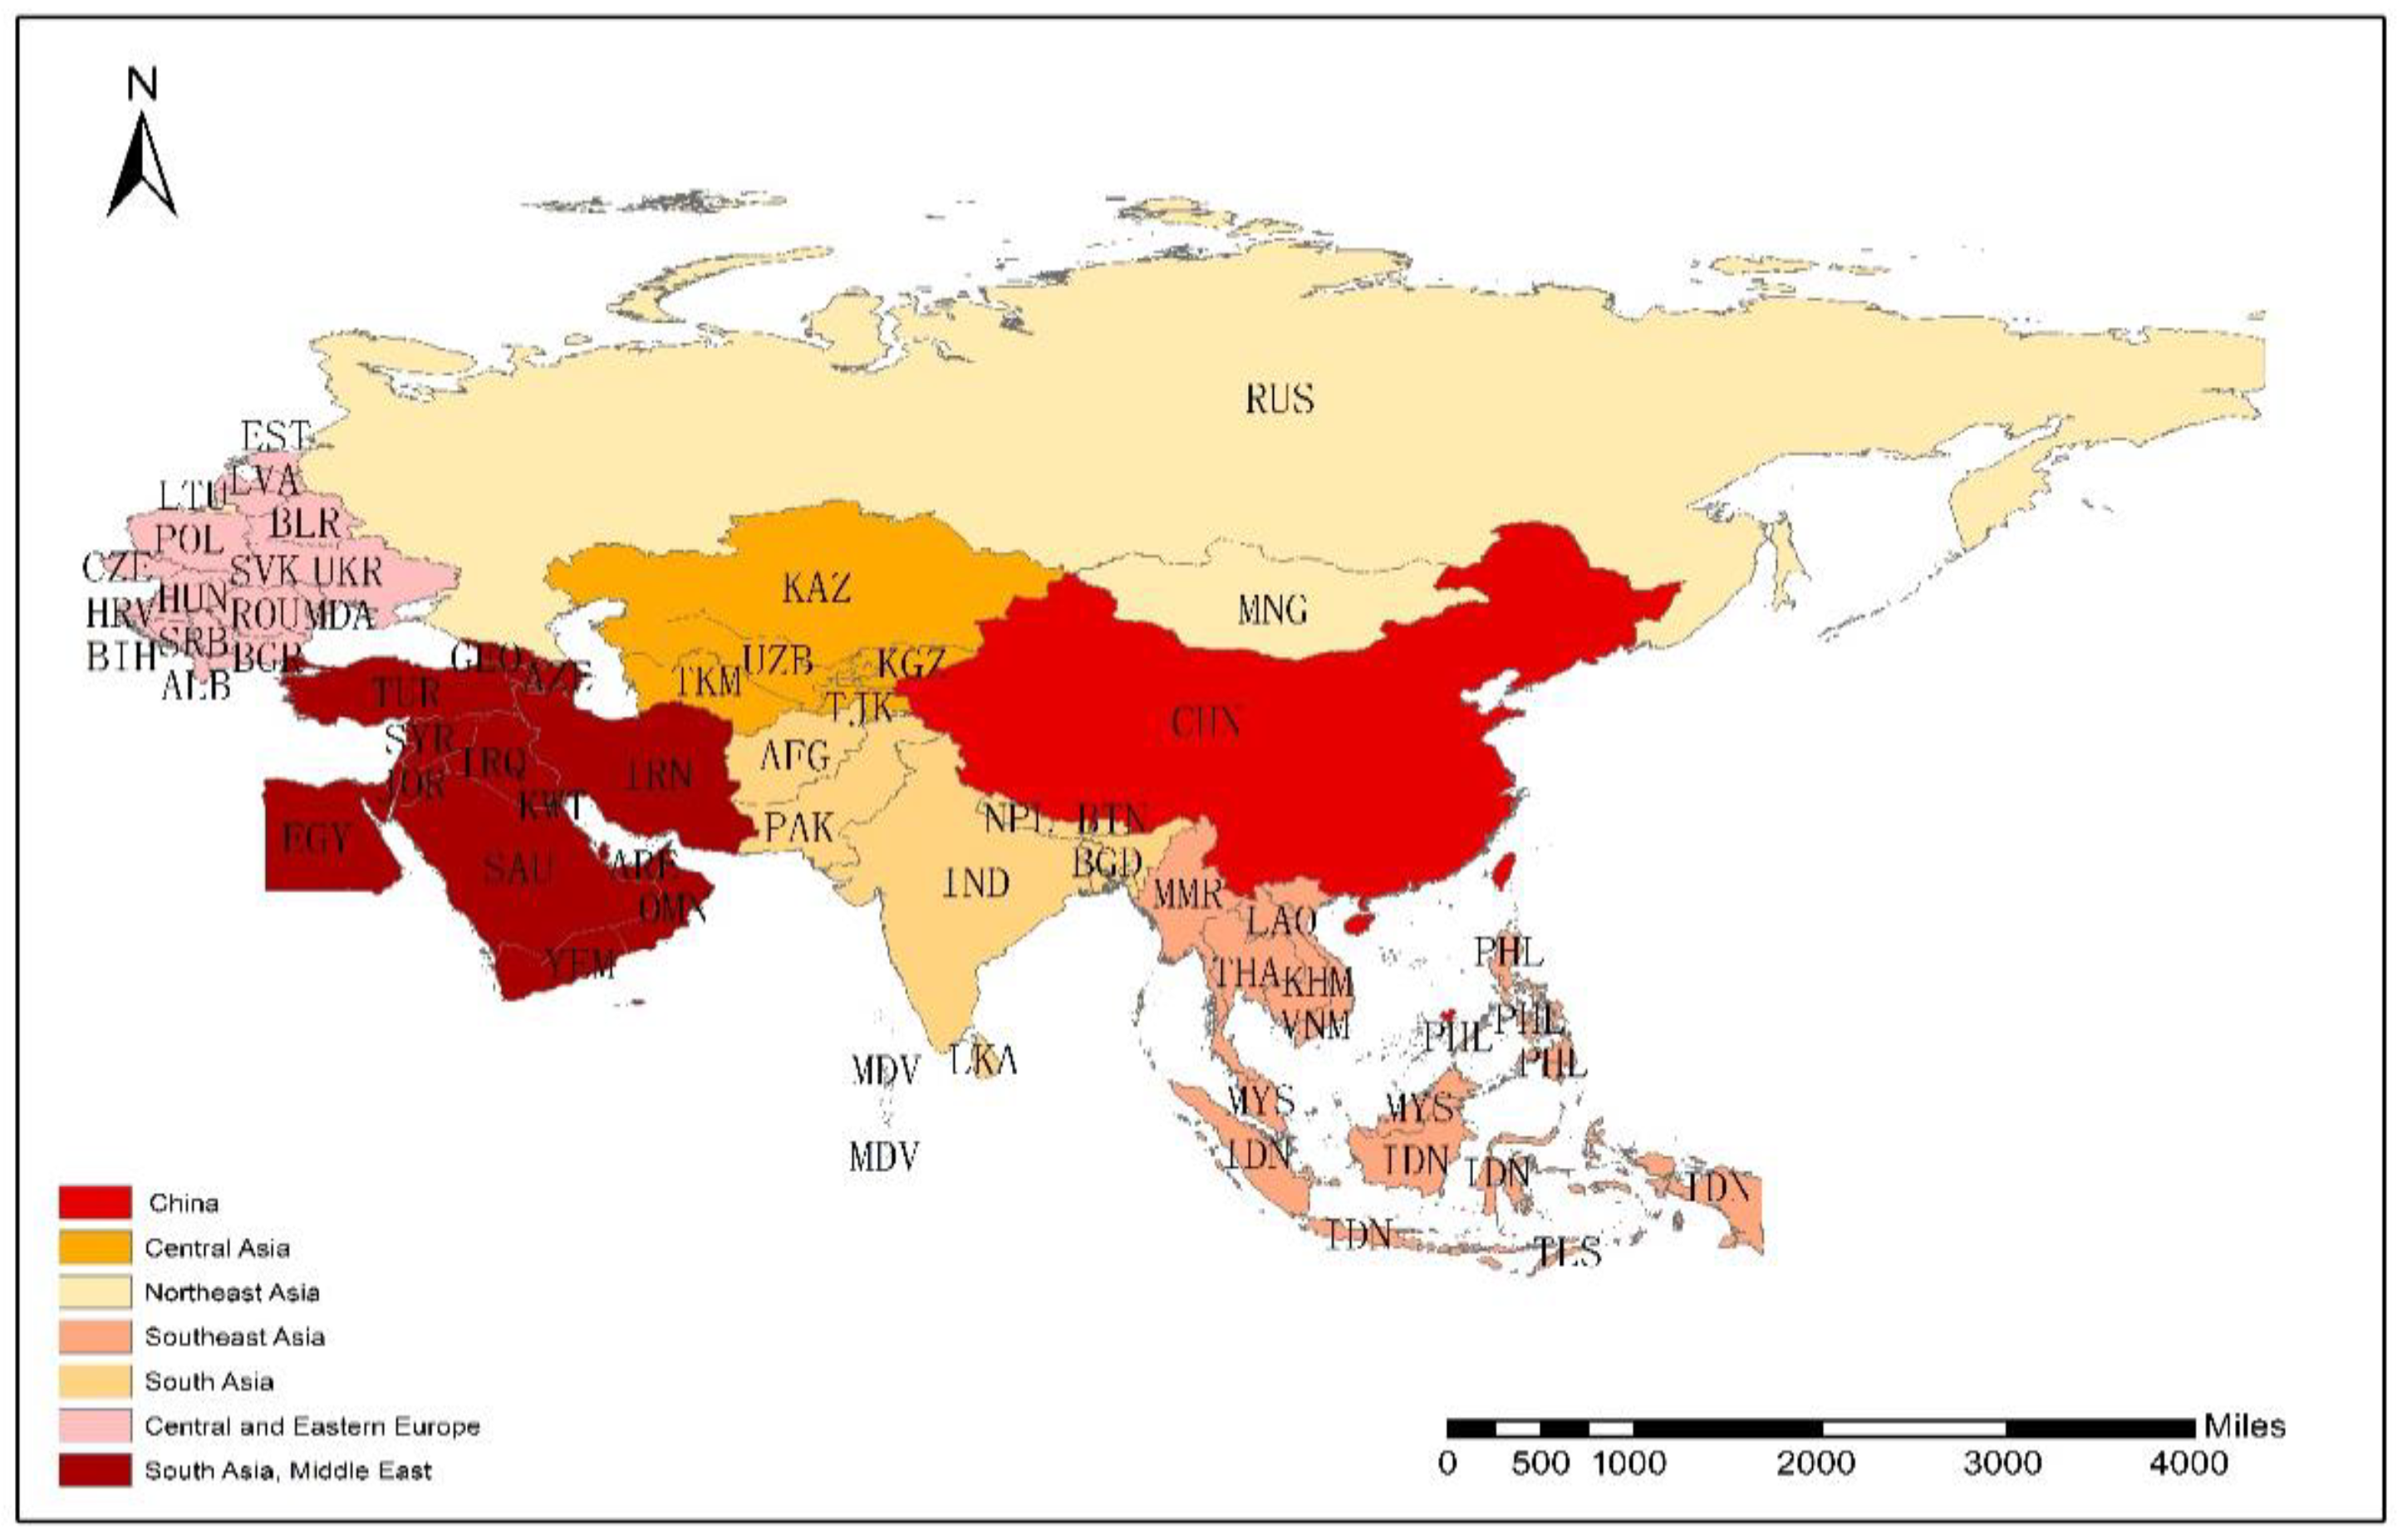
| Area | Main Countries |
|---|---|
| China | China |
| Central Asia (5 countries) | Kazakhstan, Kyrgyzstan, Tajikistan, Uzbekistan, Turkmenistan |
| Northeast Asia (2 countries) | Mongolia, Russia |
| Southeast Asia (11 countries) | Vietnam, Laos, Cambodia, Thailand, Malaysia, Singapore, Indonesia, Brunei, Philippines, Myanmar, Timor-Leste |
| South Asia (8 countries) | India, Pakistan, Bangladesh, Afghanistan, Nepal, Bhutan, Sri Lanka, Maldives |
| Central and Eastern Europe (19 countries) | Poland, Czech Republic, Slovakia, Hungary, Slovenia, Croatia, Romania, Bulgaria, Serbia, Montenegro, Macedonia, Bosnia and Herzegovina, Albania, Estonia, Lithuania, Latvia, Ukraine, Belarus, Moldova |
| South Asia, Middle East (19 countries) | Turkey, Iran, Syria, Iraq, United Arab Emirates, Saudi Arabia, Qatar, Bahrain, Kuwait, Lebanon, Oman, Yemen, Jordan, Israel, Palestine, Armenia, Georgia, Azerbaijan, Egypt |
| Agricultural Products Industry | HS Coding | Detailed Description |
|---|---|---|
| Planting industry | Chapters 6–14, 17–20, 24 | Planting products |
| Forest industry | Chapter 44–46 | Wood and wood products, charcoal, cork and cork products, woven goods |
| Animal husbandry | Chapters 1–2, 4–5, 16 (catalogue 1–3) | Live animals, meat, dairy products, eggs, honey and other animal products |
| Agricultural and sideline industry | Chapter 21–23 | Beverage, wine, vinegar, residues of food industry, animal feed |
| Aquaculture | Chapter 3, chapter 16 (catalogue 4) | Fish and other aquatic animals, aquatic invertebrate products |
| Type | Year | China | Central Asia | Northeast Asia | Southeast Asia | South Asia | Central and Eastern Europe | South Asia, Middle East |
|---|---|---|---|---|---|---|---|---|
| Planting industry | 2012 | 0.7771 | 1.8389 | 0.9369 | 0.9620 | 1.4327 | 1.0178 | 1.4210 |
| 2020 | 0.8654 | 1.3903 | 0.6009 | 0.9856 | 1.4219 | 0.9896 | 1.2885 | |
| Forest industry | 2012 | 1.5164 | 0.0904 | 1.6462 | 1.8218 | 0.1228 | 1.7005 | 0.3930 |
| 2020 | 1.4415 | 0.2275 | 0.1397 | 0.9625 | 0.4305 | 1.4144 | 0.5760 | |
| Animal husbandry | 2012 | 0.6577 | 0.0994 | 0.5354 | 0.1872 | 0.4994 | 1.1678 | 0.7601 |
| 2020 | 0.4919 | 0.6126 | 3.3771 | 0.5333 | 0.4671 | 1.0241 | 0.9942 | |
| Agricultural and sideline industry | 2012 | 0.8648 | 0.2442 | 0.1726 | 0.7056 | 0.5891 | 0.7312 | 0.6222 |
| 2020 | 0.7987 | 0.6410 | 0.9169 | 1.2085 | 0.5039 | 0.9799 | 0.7127 | |
| Aquaculture | 2012 | 1.6447 | 0.2648 | 3.1705 | 2.2629 | 1.0700 | 0.4787 | 0.4215 |
| 2020 | 1.6426 | 0.2804 | 1.1845 | 1.4771 | 1.1114 | 0.6921 | 0.4434 |
| Year | State | State | Planting Industry | Forest Industry | Animal Husbandry | Agricultural and Sideline Industry | Aquaculture |
|---|---|---|---|---|---|---|---|
| 2013 | China | 5 Central Asian countries | 0.4142 | 0.0083 | 0.0210 | 0.0409 | 0.0588 |
| Mongolia | 0.3907 | 0.1092 | 0.0402 | 0.0903 | 0.0842 | ||
| 11 Southeast Asian countries | 0.3960 | 0.1328 | 0.0266 | 0.0596 | 0.1234 | ||
| 8 South Asian countries | 0.3243 | 0.0360 | 0.0283 | 0.0561 | 0.0985 | ||
| 19 Central and Eastern European countries | 0.3649 | 0.1369 | 0.0544 | 0.0849 | 0.0539 | ||
| Southwest Asia, 19 Middle Eastern countries | 0.3884 | 0.0281 | 0.0509 | 0.0723 | 0.0508 | ||
| 2016 | China | 5 Central Asian countries | 0.4258 | 0.0093 | 0.0318 | 0.0313 | 0.0556 |
| Mongolia | 0.4258 | 0.1071 | 0.0355 | 0.0629 | 0.0815 | ||
| 11 Southeast Asian countries | 0.3956 | 0.1357 | 0.0272 | 0.0729 | 0.1246 | ||
| 8 South Asian countries | 0.3569 | 0.0358 | 0.0216 | 0.0604 | 0.1035 | ||
| 19 Central and Eastern European countries | 0.3785 | 0.1373 | 0.0481 | 0.0918 | 0.0557 | ||
| Southwest Asia, 19 Middle Eastern countries | 0.4019 | 0.0254 | 0.0440 | 0.0837 | 0.0510 | ||
| 2019 | China | 5 Central Asian countries | 0.4348 | 0.0118 | 0.0345 | 0.0358 | 0.0162 |
| Mongolia, Russia | 0.2810 | 0.0977 | 0.0463 | 0.0611 | 0.1899 | ||
| 11 Southeast Asian countries | 0.4011 | 0.1209 | 0.0352 | 0.0735 | 0.1177 | ||
| 8 South Asian countries | 0.3696 | 0.0281 | 0.0236 | 0.0713 | 0.1124 | ||
| 19 Central and Eastern European countries | 0.3693 | 0.1303 | 0.0563 | 0.0959 | 0.0600 | ||
| Southwest Asia, 19 Middle Eastern countries | 0.4021 | 0.0168 | 0.0487 | 0.0742 | 0.0699 |
| Year | State | State | Planting Industry | Forest Industry | Animal Husbandry | Agricultural and Sideline Industry | Aquaculture |
|---|---|---|---|---|---|---|---|
| 2012 | China | 5 Central Asian countries | 0.1976 | 0.4773 | 0.5833 | 0.5785 | 0.5657 |
| Mongolia, Russia | 0.3000 | 0.5482 | 0.5977 | 0.9998 | 0.9086 | ||
| 11 Southeast Asian countries | 0.5204 | 0.9928 | 0.8755 | 0.6722 | 0.9999 | ||
| 8 South Asian countries | 0.5011 | 0.8954 | 0.9996 | 0.5069 | 0.9978 | ||
| 19 Central and Eastern European countries | 0.3660 | 0.7600 | 0.6450 | 0.6291 | 0.9887 | ||
| Southwest Asia, 19 Middle Eastern countries | 0.5034 | 0.5370 | 0.8744 | 0.6460 | 0.6188 | ||
| 2020 | China | 5 Central Asian countries | 0.4344 | 0.5069 | 0.5281 | 0.8479 | 0.5157 |
| Mongolia, Russia | 0.9560 | 0.6350 | 0.5914 | 0.7810 | 0.7575 | ||
| 11 Southeast Asian countries | 0.5905 | 0.7846 | 0.5303 | 0.7584 | 0.7765 | ||
| 8 South Asian countries | 0.3591 | 0.9967 | 0.4960 | 0.7529 | 0.5064 | ||
| 19 Central and Eastern European countries | 0.5306 | 0.6208 | 0.5595 | 0.8638 | 0.7525 | ||
| Southwest Asia, 19 Middle Eastern countries | 0.5788 | 0.5191 | 0.7019 | 0.5011 | 0.5124 |
| Variable | Obs | Mean | Std. Dev. | Min | Max |
|---|---|---|---|---|---|
| ESI | 17049593 | −3.9524 | 3.8392 | −14.6835 | 3.4589 |
| TCL | 5,609,330 | −11.1765 | 3.0863 | −19.572 | −4.9170 |
| DIS | 17049593 | 8.0369 | 0.8707 | 5.1517 | 9.2415 |
| DPG | 17049593 | −0.1076 | 1.3084 | −4.0026 | 3.3739 |
| FTA | 17049593 | 0.2741 | 0.4461 | 0 | 1 |
| DOP | 17049593 | 0.4502 | 0.3472 | 0 | 1.6697 |
| LAN | 17049593 | 0.0448 | 0.2067 | 0 | 1 |
| DVA | 16397459 | 1.5668 | 1.1636 | −2.2652 | 3.3618 |
| EXR | 17049593 | 0.0616 | 4.2242 | −9.8209 | 9.7212 |
| DIN | 17049593 | −0.9477 | 1.2113 | −4.8928 | 2.2734 |
| Agriculture | Planting Industry | Forest Industry | Animal Husbandry | Agricultural and Sideline Industry | Aquaculture | |
|---|---|---|---|---|---|---|
| (1) | (2) | (3) | (4) | (5) | (6) | |
| VARIABLES | ESI | ESI | ESI | ESI | ESI | ESI |
| DIS | −0.1741 *** | −0.1469 *** | −0.1952 *** | −0.1681 *** | −0.1042 *** | −0.2530 *** |
| (0.0081) | (0.0099) | (0.0256) | (0.0196) | (0.0192) | (0.0230) | |
| DPG | −0.0167 *** | −0.0205 *** | −0.0350 *** | −0.0209 ** | −0.0178 ** | 0.0007 |
| (0.0025) | (0.0027) | (0.0062) | (0.0080) | (0.0072) | (0.0070) | |
| FTA | 0.0757 *** | 0.0735 *** | 0.0487 ** | 0.0699 *** | 0.0620 ** | 0.1532 *** |
| (0.0088) | (0.0102) | (0.0242) | (0.0229) | (0.0242) | (0.0284) | |
| DOP | −0.0918 *** | −0.0345 *** | −0.1126 *** | −0.1553 *** | −0.1826 *** | −0.1181 *** |
| (0.0111) | (0.0131) | (0.0312) | (0.0320) | (0.0409) | (0.0260) | |
| LAN | −0.0148 | −0.0269 | 0.0125 | 0.1115 ** | 0.0694 ** | −0.1548 *** |
| (0.0141) | (0.0169) | (0.0372) | (0.0459) | (0.0344) | (0.0410) | |
| DVA | −0.0093 *** | −0.0032 | −0.0045 | −0.0522 *** | −0.0144 ** | −0.0140 * |
| (0.0024) | (0.0026) | (0.0051) | (0.0095) | (0.0064) | (0.0073) | |
| EXR | 0.0451 *** | 0.0549 *** | 0.0559 | 0.0415 | 0.0087 | −0.0018 |
| (0.0112) | (0.0141) | (0.0353) | (0.0336) | (0.0421) | (0.0339) | |
| DIN | −0.0509 *** | −0.0448 *** | −0.0062 | −0.1135 *** | −0.0372 * | −0.0742 *** |
| (0.0072) | (0.0089) | (0.0152) | (0.0293) | (0.0204) | (0.0185) | |
| Constant | −9.6690 *** | −9.9536 *** | −9.3923 *** | −9.6113 *** | −9.3642 *** | −9.7130 *** |
| (0.0674) | (0.0813) | (0.2116) | (0.1697) | (0.1663) | (0.1966) | |
| Fixed effect of year | Yes | Yes | Yes | Yes | Yes | Yes |
| Fixed effect of country i | Yes | Yes | Yes | Yes | Yes | Yes |
| Fixed effect of country j | Yes | Yes | Yes | Yes | Yes | Yes |
| Fixed effect of products | Yes | Yes | Yes | Yes | Yes | Yes |
| Observations | 5,372,877 | 3,087,860 | 599,241 | 626,866 | 511,809 | 547,101 |
| R-squared | 0.344 | 0.357 | 0.424 | 0.347 | 0.425 | 0.383 |
| Agriculture | Planting Industry | Forest Industry | Animal Husbandry | Agricultural and Sideline Industry | Aquaculture | |
|---|---|---|---|---|---|---|
| VARIABLES | (1) | (2) | (3) | (4) | (5) | (6) |
| TCI | TCI | TCI | TCI | TCI | TCI | |
| DIS | −0.0448 *** | −0.0334 *** | −0.0219 * | −0.0936 *** | −0.0203 ** | −0.0617 *** |
| (0.0048) | (0.0056) | (0.0125) | (0.0163) | (0.0097) | (0.0120) | |
| DPG | 0.0095 *** | −0.0025 | 0.0222 *** | 0.0250 *** | 0.0071 | 0.0269 *** |
| (0.0022) | (0.0024) | (0.0045) | (0.0055) | (0.0057) | (0.0062) | |
| FTA | 0.0630 *** | 0.0661 *** | 0.0500 *** | 0.0482 *** | 0.0255 | 0.1237 *** |
| (0.0052) | (0.0066) | (0.0136) | (0.0145) | (0.0158) | (0.0156) | |
| DOP | −0.0276 *** | −0.0250 ** | −0.0192 | −0.1471 *** | −0.0496 ** | 0.0101 |
| (0.0101) | (0.0118) | (0.0243) | (0.0333) | (0.0246) | (0.0262) | |
| LAN | 0.0505 *** | 0.0041 | 0.0060 | 0.1915 *** | 0.0775 *** | 0.0460 * |
| (0.0091) | (0.0102) | (0.0221) | (0.0429) | (0.0211) | (0.0261) | |
| DVA | 0.0118 *** | 0.0128 *** | 0.0006 | 0.0079 | 0.0142 *** | 0.0138 ** |
| (0.0017) | (0.0021) | (0.0050) | (0.0050) | (0.0040) | (0.0056) | |
| EXR | −0.0888 *** | −0.0574 *** | −0.2098 *** | −0.1240 *** | −0.1015 *** | −0.0988 ** |
| (0.0132) | (0.0170) | (0.0380) | (0.0391) | (0.0366) | (0.0402) | |
| DIN | −0.1490 *** | −0.1348 *** | −0.1081 *** | −0.1803 *** | −0.0358 | −0.3041 *** |
| (0.0125) | (0.0161) | (0.0281) | (0.0394) | (0.0293) | (0.0327) | |
| Constant | −3.3570 *** | −3.3481 *** | −3.1667 *** | −3.0244 *** | −3.2665 *** | −4.1200 *** |
| (0.0443) | (0.0507) | (0.1007) | (0.1575) | (0.0879) | (0.1161) | |
| Fixed effect of year | Yes | Yes | Yes | Yes | Yes | Yes |
| Fixed effect of country i | Yes | Yes | Yes | Yes | Yes | Yes |
| Fixed effect of country j | Yes | Yes | Yes | Yes | Yes | Yes |
| Fixed effect of products | Yes | Yes | Yes | Yes | Yes | Yes |
| Observations | 16,397,457 | 9,123,268 | 1,784,998 | 2,050,759 | 1,503,853 | 1,934,579 |
| R-squared | 0.245 | 0.256 | 0.349 | 0.257 | 0.328 | 0.308 |
| Variable | Obs | Mean | Std. Dev. | Min | Max |
|---|---|---|---|---|---|
| Quality | 265032 | 0.6015 | 0.2031 | 0 | 1 |
| DID | 265,032 | 0.5312 | 0.4990 | 0 | 1 |
| QFTA | 265045 | 2.7837 | 0.4375 | 1.0986 | 3.3322 |
| EXR | 265045 | 3.0090 | 2.9291 | −1.1929 | 10.2755 |
| PVA | 265045 | 1.9736 | 0.4275 | 1.4794 | 2.8723 |
| FDI | 265045 | 20.6177 | 5.4128 | 0 | 26.2142 |
| INF | 265045 | 1.1452 | 1.1944 | 0.1804 | 8.7936 |
| Export Quality of Agricultural Products | |||
|---|---|---|---|
| (1) | (2) | (3) | |
| VARIABLES | Quality | Quality | Quality |
| DID | 0.0020 ** | 0.0022 ** | |
| (0.0010) | (0.0010) | ||
| D2012 | 0.0004 | ||
| (0.0014) | |||
| D2013 | 0.0047 ** | ||
| (0.0020) | |||
| D2014 | 0.0046 * | ||
| (0.0024) | |||
| D2015 | 0.0143 *** | ||
| (0.0028) | |||
| D2016 | 0.0094 *** | ||
| (0.0033) | |||
| D2017 | 0.0181 *** | ||
| (0.0038) | |||
| D2018 | 0.0143 *** | ||
| (0.0046) | |||
| D2019 | 0.0235 *** | ||
| (0.0059) | |||
| D2020 | 0.0291 *** | ||
| (0.0079) | |||
| QFTA | 0.0190 *** | 0.0205 *** | |
| (0.0031) | (0.0032) | ||
| EXR | 0.0068 *** | 0.0050 *** | |
| (0.0017) | (0.0017) | ||
| PVA | 0.0079 | 0.0120 * | |
| (0.0069) | (0.0071) | ||
| FDI | −0.0001 ** | −0.0001 ** | |
| (0.0001) | (0.0001) | ||
| INF | 0.0161 *** | 0.0158 *** | |
| (0.0028) | (0.0029) | ||
| Fixed effect of time | Yes | Yes | Yes |
| Combined fixed effect of country and product | Yes | Yes | Yes |
| Constant | 0.6043 *** | 0.5110 *** | 0.5023 *** |
| (0.0005) | (0.0171) | (0.0175) | |
| Observations | 254,375 | 254,375 | 254,375 |
| R-squared | 0.717 | 0.718 | 0.718 |
| Central Asia | Northeast Asia | Southeast Asia | South Asia | Central and Eastern Europe | South Asia Middle East | |
|---|---|---|---|---|---|---|
| (1) | (2) | (3) | (4) | (5) | (6) | |
| VARIABLES | Quality | Quality | Quality | Quality | Quality | Quality |
| DID | 0.0137 ** | 0.0090 | 0.0020 | 0.0090 *** | 0.0012 | 0.0020 |
| (0.0067) | (0.0336) | (0.0028) | (0.0029) | (0.0014) | (0.0012) | |
| QFTA | 0.0077 | −0.0688 | 0.0226 *** | 0.0890 *** | 0.0174 *** | −0.0059 ** |
| (0.0275) | (0.1084) | (0.0061) | (0.0236) | (0.0042) | (0.0029) | |
| EXR | 0.0288 *** | −0.0434 | −0.0035 | 0.0174 | −0.0004 | −0.0012 |
| (0.0108) | (0.0787) | (0.0081) | (0.0168) | (0.0017) | (0.0016) | |
| PVA | 0.0128 | 0.1109 ** | 0.0212 *** | 0.0011 | 0.0018 | 0.0079 *** |
| (0.0100) | (0.0476) | (0.0052) | (0.0058) | (0.0033) | (0.0025) | |
| FDI | 0.0009 ** | 0.0000 | 0.0002 | 0.0007 | 0.0000 | −0.0001 |
| (0.0004) | (0.0007) | (0.0002) | (0.0010) | (0.0001) | (0.0001) | |
| INF | 0.0956 *** | 0.0092 | 0.0172 *** | 0.0269 ** | 0.0087 ** | 0.0259 *** |
| (0.0175) | (0.0765) | (0.0040) | (0.0116) | (0.0043) | (0.0032) | |
| Fixed effect of time | Yes | Yes | Yes | Yes | Yes | Yes |
| Combined fixed effect of country and product | Yes | Yes | Yes | Yes | Yes | Yes |
| Constant | 0.3760 *** | 0.4555 *** | 0.7341 * | 0.7173 *** | 0.5228 *** | 0.5414 *** |
| (0.0990) | (0.0538) | (0.4307) | (0.1023) | (0.0129) | (0.0092) | |
| Observations | 10,367 | 7552 | 44,573 | 24,629 | 92,000 | 68,884 |
| R-squared | 0.667 | 0.722 | 0.644 | 0.724 | 0.639 | 0.572 |
Disclaimer/Publisher’s Note: The statements, opinions and data contained in all publications are solely those of the individual author(s) and contributor(s) and not of MDPI and/or the editor(s). MDPI and/or the editor(s) disclaim responsibility for any injury to people or property resulting from any ideas, methods, instructions or products referred to in the content. |
© 2023 by the authors. Licensee MDPI, Basel, Switzerland. This article is an open access article distributed under the terms and conditions of the Creative Commons Attribution (CC BY) license (https://creativecommons.org/licenses/by/4.0/).
Share and Cite
Wang, X.; Shi, J.; Li, J.; Chen, Y.; Liu, J.; Sriboonchitta, S. Analysis on Trade Competition and Complementarity of High-Quality Agricultural Products in Countries along the Belt and Road Initiative. Sustainability 2023, 15, 6671. https://doi.org/10.3390/su15086671
Wang X, Shi J, Li J, Chen Y, Liu J, Sriboonchitta S. Analysis on Trade Competition and Complementarity of High-Quality Agricultural Products in Countries along the Belt and Road Initiative. Sustainability. 2023; 15(8):6671. https://doi.org/10.3390/su15086671
Chicago/Turabian StyleWang, Xiao, Jinming Shi, Jia Li, Yu Chen, Jianxu Liu, and Songsak Sriboonchitta. 2023. "Analysis on Trade Competition and Complementarity of High-Quality Agricultural Products in Countries along the Belt and Road Initiative" Sustainability 15, no. 8: 6671. https://doi.org/10.3390/su15086671
APA StyleWang, X., Shi, J., Li, J., Chen, Y., Liu, J., & Sriboonchitta, S. (2023). Analysis on Trade Competition and Complementarity of High-Quality Agricultural Products in Countries along the Belt and Road Initiative. Sustainability, 15(8), 6671. https://doi.org/10.3390/su15086671