Abstract
An efficient charging time forecasting reduces the travel disruption that drivers experience as a result of charging behavior. Despite the machine learning algorithm’s success in forecasting future outcomes in a range of applications (travel industry), estimating the charging time of an electric vehicle (EV) is relatively novel. It can help the end consumer plan their trip based on the estimation data and, hence, reduce the waste of electricity through idle charging. This increases the sustainability factor of the electric charging station. This necessitates further research into the machine learning algorithm’s ability to predict EV charging time. Foreign object recognition is an essential auxiliary function to improve the security and dependability of wireless charging for electric vehicles. A comparable model is used to create the object detection circuit in this instance. Within this research, the ensemble machine learning methods employed to estimate EV charging times included random forest, CatBoost, and XGBoost, with parameters being improved through the metaheuristic Ant Colony Optimization algorithm to obtain higher accuracy and robustness. It was demonstrated that the proposed Ensemble Machine Learning Ant Colony Optimization (EML_ACO) algorithm achieved 20.5% of R2, 19.3% of MAE, 21% of RMSE, and 23% of MAPE in the training process. In comparison, it achieves 12.4% of R2, 13.3% of MAE, 21% of RMSE, and 12.4% of MAPE during testing.
1. Introduction
Typically, electric vehicles (EVs) are considered a viable and sustainable solution for reducing transportation-related CO2 emissions. This study focused on battery-powered vehicles. Such EVs have an internal traction battery that reserves a portion of the power required for thrust and secondary functions and is recharged through a link to the power grid. Despite the fact that EV sales may have been regarded as insignificant in recent years, this is no longer the case, both internationally and in Germany. In terms of absolute numbers, China has been the market leader for a number of years; in 2018, yearly sales surpassed one million vehicles [1]. Recently, there was a slowdown in the local market, probably due to a reduction in subsidies. However, during the recent Climate Change Conferences (COP26-27) in Glasgow, Scotland, and Egypt respectively, the major powers in the world decided to reduce their dependence on fossil fuels and focus more on sustainable energy sources. Germany, France, Italy, and other European nations have dramatically expanded their subsidies and other regulatory measures [2]. Europe currently has the largest market for global EV sales due to higher EU fleet pollution standards [1]. Germany has been the leader of this development, offering up to EUR 9000 in subsidies for novel battery-powered vehicles, having the fourth-largest proportion of battery and plug-in electric cars globally, and the largest quantities in Europe [1]. During August 2021, the government’s target of selling one million vehicles overall was attained, despite a delay of eight months [3]. Such trends and shifts clearly indicate this market’s expansion. In accordance with the commonly employed diffusion of innovation curve [4], the market is shifting from early innovators to young consumers, or perhaps an even larger market stage. It is necessary to have sufficient public charging infrastructure (CI) for the purpose of customers to have unhindered access to such infrastructures and to rapidly recharge their EVs in order to accomplish the widespread adoption of EV transportation [5,6,7,8]. Many countries, including China, have taken an interest in this aspect, introducing extensive rules and motives to encourage the growth of the novel EV industry since the turn of the twenty-first century [9,10,11]. According to previous studies, the EV market is anticipated to expand in the future, along with the progressive technological development of EVs and an optimized set of EV promotion policies [12,13,14,15].
Presently, German battery-powered vehicle users are charged a fixed amount per kWh for CI usage and occasionally incur an additional charge for parking time. There may be variations in other countries, but these typically do not vary wildly. Fixed-price mechanisms cause the use of CIs to be extremely inequitable, with occupation rates varying greatly across weekdays and between day and night times [16]. This is obviously not desirable since it generates charging hotspots that can be avoided. Moreover, several EVs could already be powered-up and only require to be recharged when the opportunity arises, though other EVs might require urgent recharging. Drivers who have reasonably high battery states of charge during such shortages should be encouraged to give up their chance to recharge, in favor of drivers who have more urgent charging requirements. However, since public CIs should be readily available, it is not possible to implement a system that optimizes CI allocation globally. Shifts in price points are an alternative approach to the aforementioned issue. Should individuals in Germany drive approximately 39 Km daily, recharging is only infrequently necessary since modern vehicle batteries have ranges of ≥300 Km [17]. If selected consumers were price-sensitive, this could persuade them to recharge when there is a sufficient CI, tacitly approving the grid’s demand or capacity. This is the goal of the BeNutz LaSA project [18,19,20], where the authors implemented a comparable price-based incentive system in Germany, together with alliance partners. Especially at reduced-size AC stations, charging typically takes hours, hence, forcing customers to cease charging voluntarily is not practical. Consequently, the current occupation cannot be disregarded in the event of a CI shortage.
Study Aims:
This study aimed to forecast CI usage in order eventually optimize EV recharging prices, prior to the emergence of a hotspot. Such aims also included the precise prediction for the occupation of as many stations as feasible in order to obtain an excellent overview prediction in such a situation. This will result in less waiting time, less idle charging time, and, therefore, less wastage of electricity, making it environmentally sustainable. Consequently, this study’s expected contributions were as follows:
- Identification of the ideal machine learning (ML) methodology that has peak optimization efficacy for charging station performance.
- Offer reduced EV charging costs through minimizing power losses and voltage oscillations.
- Comparative analysis for effectiveness and dependability of various ML approaches for the reduction of the charging cost.
The structure of the present paper is organized as follows: Using machine learning and optimization techniques, related studies for charging electric vehicles are given in Section 2. Section 3 described the suggested methodology, including challenge formulation, an optimization technique, and ensemble machine learning prediction. In Section 4, the performance of the suggested model is shown along with a comparison of existing approaches. Section 5 presents the general conclusion for the proposed models.
2. Literature Survey
Following the global environmental concerns, the world is moving towards a more environmentally conscious and sustainable future. This will likely lead to the adoption of electric vehicles (EVs) broadly. Furthermore, the development of wireless power transfer (WPT) increases the potential of power transfer and efficiency of EVs [21,22]. The main focus of WPT is the development of coils and magnetic cores, dictating the alignment of many studies. Even though the ultimate goal of WPT is increased efficiency and power, safety is also a major concern. The idea is to prevent leakage flux from WPT to human beings [23]. Additionally, exposure of foreign metal objects such as cans and keys to the powerful WPT magnetic fields poses a risk of strong electric discharges that can result in fatal fire accidents. However, a significant number of research studies aim to solve this issue through metal object detection (MOD). MOD is achieved by installing differential detection coils and sensors, responsible for detecting the existence of any metal objects [24,25]. Further research shows that machine learning eliminates the need for detection coils since it employs the classification of the frequency loci of the input impedance of the primary coil [26]. However, this method ignores the contribution of the magnetic core, otherwise needed to increase power transfer efficiency. Furthermore, the method [26] explores proves to be inefficient for loaded cases.
The regulated charging of EVs utilizing metaheuristic optimization approaches, together with ML methods that are discussed in the following sections, are two major research areas that are related to this study.
A novel ML methodology that is comprehensible was used in [27] to forecast the charging station preference behavior of EV users. The findings showed that, when compared to existing ML methods, the XGBoost model had the greatest accuracy in predicting the charging station selection behavior. In order to expedite the problem-solving process and simultaneously attain preferred control performance, an imitating reinforcement learning-based technique—with the best guidance—was also proposed in another article concerning hybrid vehicle energy management [28]. Firstly, offline global optimization was performed to search for power allocation trajectories, while considering a variety of driving conditions. Moreover, in order to create a limited state space, the battery degradation limits in connection to driving distance were added, where the ideal trajectory is combined with reinforcement learning training to promote the development of high-efficiency strategies. In order to address the charging demand forecast issue, Eddine et al. proposed a temporal encoder-decoder +LSTM (T-LSTM-Enc) coupled with a temporal LSTM (T-LSTM-Ori-TimeFeatures) [29]. To comprehend the short-term, long-term, and trend elements of charging demand estimation, this study employed temporal dependencies. Ma et al. developed a novel mixed long/short-term memory neural network for multi-step discontinuous charging occupancy state forecasting that incorporated both time-related features and previous charging state cycles [30]. The suggested model separated various feature types and analyzed them in a variety of manners, using a mixed neural network architecture, in contrast to the existing LSTM networks. The proposed Grey Sail Fish Optimization was used in [31] to generate an effective algorithm for optimal charging scheduling (GSFO). The suggested charge scheduling method incorporated Sail Fish Optimization (SFO) and Grey Wolf Optimizer (GWO). The demand during charging was determined for each EV. To decide the path traveled by the EV to arrive at the charging station, the path choice factor is determined. In [32], the order favored by the resemblance to idealized solution (ETOPSIS) approach and the hybrid particle swarm optimization (HPSO) technique were integrated, in order to provide a revolutionary approach. Particularly, Pareto solutions were found using the HPSO algorithm, and the best strategy was identified through the ETOPSIS approach. A local search-based backward training competitive particle swarm optimization (SW-OBLCSO) approach was also established [33]. The standard IEEE-33 node distribution network was used in this method as the research object. Competitive learning and reverse-learning techniques are used in the SW-OBLCSO algorithm. Four standard test functions are employed to evaluate the SW-OBLCSO algorithm, with numerous optimization techniques in various dimensions, allowing for algorithm performance to be verified. Ding et al. proposed an ideal EV charging plan within a distribution network to optimize the operators’ profit, while also adhering to all physical constraints. In order to study the effects of uncertainties upon charging strategy, and to describe the time—series data for unpredictability, a deep deterministic policy gradient-based reinforcement learning technique was combined with a Markov decision technique [34]. In [35], three different objective functions (OFs), Objective Function Zero (OF0), Advanced Objective Function Zero (AOF0), and Minimum Rank with Hysteresis Objective Function (MRHOF) for RPL—in the static environment for differing node numbers—were compared. The findings demonstrated that altering all three OFs had a significant impact on RPL.
The use of optimization techniques such as dynamic programming and quadratic programming for optimizing electrical grid efficiency and consumer requirements is the main drawback of such aforementioned studies. The application of such strategies necessitates the meticulous and depicted problem-solving processes [36]. Within this study, ML was employed as an optimization method that was less complex to utilize. Except for the process of parameter adjustment, which is dependent on heuristic and trial-and-error issues, ML algorithms merely require the presence of an acceptable dataset, and consequently operate automatically. Therefore, it is not necessary to formulate complex equations or optimization restrictions. Table 1 below outlines the pros and cons of different methodologies utilized for such purposes.

Table 1.
List of advantages and disadvantages for differing algorithm-based methodologies.
3. Problem Formulation
The capacitated electric vehicle routing problem (CEVRP) aims to identify an ideal collection of paths that minimizes the overall trip distance, while also taking into account a number of restrictions implying a fleet of identical EVs. A balanced, unsupervised graph that is entirely linked, where CEVRP can be properly defined. The collection of graph nodes is represented by . The depot has an index of zero. represents the customers.
is a prolonged collection of charging stations that contains replicas of every recharging point . Each customer has a fixed cargo demand .
The construction of duplicate charging stations enables numerous visits to each charging station. is referred to The worst-case situation demands each EV to perform a single-stop at every station along both routes, in order to service a client prior to returning back to the depot, where is the collection of arcs. Each arc
has a weight that corresponds to the distance between and . There is a maximum amount of battery capacity and freight demands for each EV. The battery’s consumption rate is indicated by . An EV will utilize the equivalent of for each of the arcs of the battery to pass through it is .
The mathematical definition of CEVRP is presented below by adding two additional variables, and , which indicate the remaining load capacity and battery status of a Vehicle at node , accordingly.
The algorithms also suggest that all Vehicles should leave and return to the depot, despite the stated limits that they display.
4. Process of Ant Colony Optimization Algorithm (ACOA)
The algorithm’s elements and parameters are originally initialized. The ants consequently construct their solutions sequentially in each generation. The produced solutions are analyzed in order to update the pheromone boundaries, pheromones matrix, repetition optimum solution, and the overall ideal solution. The global optimum outcome is further improved using a restricted enumeration method if the halting requirement is satisfied. The entire algorithm concludes at this point and returns an overall ideal solution. It requires two phases to develop a reasonable solution in ACOA, which corresponds to the two tiers of sub-problems. Initially, by removing the electrical restriction and the charging system, the CEVRP is lowered to a comparable portion. The objective values are assessed once the solutions are generated in order to update the pheromone matrix and the overall ideal solution. The Removal Heuristic (RH) algorithm is consistent. The routes of the associated fitness values of the CEVRP are mapped using a single value.
Pheromone Setting: The ants are assisted in creating paths through a controlled pheromone matrix. Firstly, the pathways are constructed for the relevant CVRP, without considering the charging stations. The dimensions of the pheromone matrix is , where is the total number of clients including the depot. The value of the pheromone for moving from to is represented by each element, , since the employed ACO algorithm uses two boundaries and xx of the pheromone values to preserve the algorithm’s capacity for exploration.
Step-1: Initialization
- Read system data and configure system parameters
- Initialize iteration; t = 0
- Set as a control vector of an ant
- Initial probability distribution and trail intensity are set at and accordingly, for the route.
- When determining the heuristic function, it is known as the visibility of the station’s objective function at the vehicle, which is represented as in
Step-2: Generating ant solutions
- Update iteration
- Constructing ant population: An ant of of station chooses the bus by applying the pseudo-random proportion rule using the following equation as the state transition rule:
Step-3: A candidate solution is one that can be reached by evaluating the objective function in order to discover the best option. All new ants have their objective functions assessed under all restrictions. The sorting approach is used to find the new-best solution out of all the candidate solutions. The old-best solution from the previous iteration is consequently contrasted with the new-best solution. The best solution to the problem will be determined by whether the new-best solution is superior to the previous best solution.
Step-4: Evaluation of the new solutions’ objective functions. If the new solutions’ objective functions are determined to be superior to those of the most recent best solution, then they will be considered as the most updated solutions to the problem.
Step-5: The best ant team from all ants implements the global updating rule. Implementation of the update pheromone is accomplished as follows:
where is the maximum of the objective function and the objective function of the best solution is .
Step-6: Reinitializing the trail intensity—when an ant is searching, it may exhibit stagnation behavior in an effort to reduce the overabundance of pheromones on specific pathways.
Step-7: Stopping Criteria: If the program’s is the total CPU time (measured in seconds) exceeding the , the program is considered to have terminated. Otherwise, the program advances to step 2.
5. Optimization of Power Losses, Voltage Profile, and Charging Expenditure
To improve the power quality and the voltage profile, it is important to minimize the power losses in the distribution network. The main objective function for reducing power losses is presented in:
where B is the total number of buses or branches in the power system. b is an index that represents a specific branch or bus in the power system. It varies from 1 to B. Ib,b+1 is the magnitude of the current flowing in branch b connecting bus b to bus b+1. t is the time duration for which the power flow is being considered. Rb,b+1 is the resistance of branch b connecting bus b to bus b + 1.
A radial distribution system’s concern with load flow can be efficiently solved using MATLAB to identify the currents in each line. Power losses are highly correlated with the voltage profile. By reducing power losses, the voltage profile will be improved and voltage fluctuations will be reduced. Both user requirements and the distribution system should be accounted for in order to utilize EV charging to its greatest potential. Therefore, it is important to reduce charging costs, in order to improve user experience. Equation (10) provides the goal function for reducing the charging cost. It is to be noted that the recharging price is decreased in proportion to the minimization of load fluctuation and power losses if the user adheres to the suggested payment scheme.
where is the index for the initial time of the charging period. is the index for the final time of the charging period. is the index for the electric vehicle. is the index for the charging station. is the integral over time, from the initial time to the final time . is the initial state of charge (SOC) of the electric vehicle e at charging station at time . is the final SOC of the electric vehicle at charging station at time . (t) is the charging price at time . is the charging power level of the electric vehicle at charging station at time , which is the difference in the SOC of the vehicle at time and the previous time , divided by the time step. is the time step of the integration.
6. Ensemble Machine Learning-Based Prediction
The core principle driving these methods is combining fundamental models to produce a composite prediction model, as demonstrated in Figure 1.
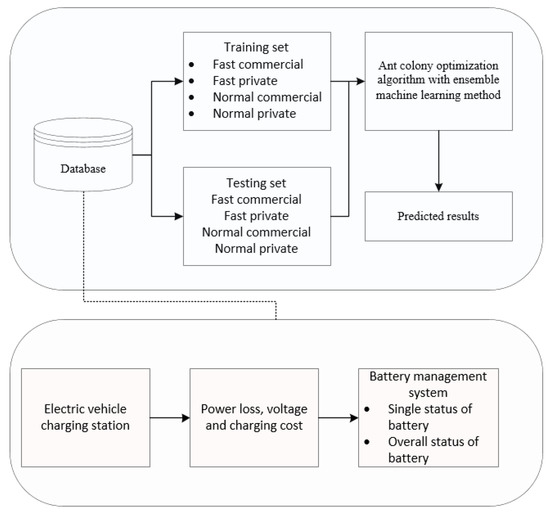
Figure 1.
Electric vehicle charging time prediction model.
To estimate the EV recharge time, this study utilized four ensemble-learning approaches, including RF, CatBoost, and LightGBM. An ML model type, known as the EML technique, accomplished learning tasks by creating and combining several learners (weak or base learners). Boosting and bagging, two well-known approaches, were used to develop the fundamental learners. Bagging lowers variance, improving the model’s ability to generalize. Among the several decision tree-based ensemble methods used in bagging, RF is a popular, highly effective, and widely utilized ensemble method that is less susceptible to over-fitting.
7. Random Forest (RF)
The RF approach employs a large number of distinct decision trees, each of which is created from a randomly selected subset (bootstrap sample) of the training examples. The optimal split for every node is determined throughout the tree-building procedure by selecting candidate factors arbitrarily. The size is [], and the variable is randomly selected at each decision node, based upon the training data sample. Using the training data, a bootstrap of sample size is constructed, and the total number of trees is evaluated. Consequently, to segregate the data into several leaf nodes, the generation of individual tree-based bootstrapped data is selected by repeatedly selecting the f factor and an appropriate factor at the decision point. In order to reach the maximum depth size, the technique is repeated.
The model using test data supplies the test data to every tree that has been produced throughout the test, averaging all results. The following is a statement of the regression output:
where x stands for the test sample, T stands for all trees, and DT stands for the trees.
8. Categorical Boosting (CatBoost)
For every classification, the initial parameter is replaced in CatBoost with a new binary feature. It selects the tree topology, employing random permutations to establish leaf numbers and avoid overfitting caused by traditional gradient-boosting approaches. Binary decision trees serve as CatBoost’s primary predictor. The estimated output fits into the following categories:
where denotes the decision tree’s function for the independent variable and denotes the irregular area that is representative of the tree’s leaves.
9. Extreme Gradient Boosting (XGBoost)
The adoption of a normalized approach formalization by XGBoost prevents overfitting and leads to improved performance. To reduce the variation and increase the final model’s capacity for prediction, the integrated approach employs a random sampling approach.
where ft(xi) denotes each tree output function and denotes the independent variables. To enhance and strengthen the model’s predictive power, the ideal set of parameters must be chosen. Specifically, the regularization term in XGBoost renders the classification function of the tree smaller and more repeatable.
10. Analysis of the Effects of Under- and Over-Estimating the Duration of the Connection
This study utilized the concept of a cost function to evaluate the impacts of both an accurate and inaccurate estimate for inter-connection length. This study used weights, regarded as parameters, to combine several criteria. This study probed T distinct charging periods, and the provided amounted as distinct criteria for assessing the effects of under- and over-estimating connection length upon an efficient charging process.
- —The total amount of energy that is collected at a positive (positively charged) or negative (negatively charged) power compared to the charging power used by the optimization and EML method.
- —due to an earlier departure than anticipated, no energy was charged.
The cost function is to be calculated as:
where and are non-negative weights. Likewise, for the ToU (time-of-use) charging method, the following criteria were examined:
—energy charged overall during the off-peak price period over all T individual charging sessions
—total energy charged during the time of highest pricing over all T separate charging sessions,
—total energy that was unable to be charged in each of the T individual charging sessions, due to insufficient charging time brought on by an over-estimation of the connection duration
Thus, the cost function is to be calculated as:
where are non-negative weights. is independent of the loss function parameters a and b. Hence, this study determined the ToU scheme in the parameter space provided by the differences and .
11. Performance Analysis
The parameters used for evaluation in the study were R2, MAE, RMSE, and MAPE. The proposed EML ACO is contrasted with four established methods: Markov Decision Process (MDP), Temporal Encoder-Decoder + LSTM (T-LSTM-Enc), and imitation reinforcement learning-based algorithm (IRLA) (MDP).
12. Dataset Description
The EV data gathering is briefly described in this section. The collection largely uses diverse data from 500 private and commercial vehicles for both slow and rapid EV charging stations. The EV connects to a 240-V outlet to charge normally, requiring a number of hours. Typically, charging activities occur overnight within private residences. Since it is the most popular method of charging, and most charging takes place while vehicles are stationary, conventional charging events usually receive the most attention. Fast charging often uses voltages of 480 volts or greater and can charge an object to 80% capacity within 30 min. Quick-charging events are typically held at parking lots, offices, recreation areas, and vehicle dealerships. When traveling long distances, or in the case of an emergency, fast-charging events are crucial. Both residential and business vehicles use the 500 EVs. Private automobiles are those that belong to specific homes. This does not pertain to anyone who is only allowed to drive a vehicle, since they agreed to pay for the use of both the vehicle and the driver on a particular trip. Government and commercial vehicles that are part of a fleet are considered commercial vehicles. To benefit the government or company, commercial vehicles are employed to convey commodities or passengers. The raw data for a single EV, including the vehicle identity, type of vehicle, charging mode, start and end state of charge, initial charging, and final charging, are shown in Table 2. Table 3 highlights an analysis of error metrics for the fast commercial and private training process.
Table 2.
Dataset description.
Table 3.
Analysis of error metrics for fast commercial and private-training process.
Figure 2 illustrates the comparison of error for the fast commercial training process between existing T-LSTM-Enc, IRLA, MDP, and the proposed EML_ACO method, where the x-axis highlights the various analytical methods and the y-axis demonstrates values obtained in percentage. When compared, the proposed EML_ACO achieved 32.1% of , 23.1% of MAE, 21.5% of RMSE, and 23.4% of MAPE.
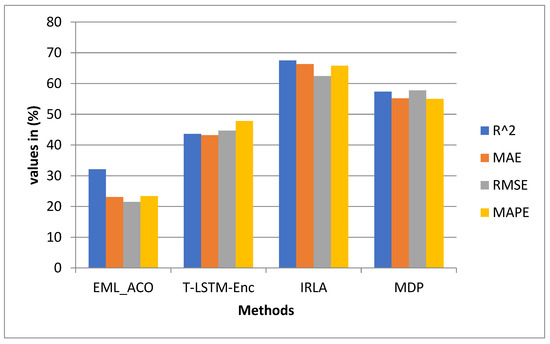
Figure 2.
Analysis of error for fast commercial-training process.
Figure 3 illustrates the comparison of error for the fast private training process between existing T-LSTM-Enc, IRLA, MDP, and the proposed EML_ACO method, where the x-axis shows the various analytical methods and the y-axis shows the values obtained in percentage. When compared, the proposed EML_ACO achieved 21.6% of , 19.7% of MAE, 18.9% of RMSE, and 21.6% of MAPE. Table 4 reflects the analysis of error metrics for the normal commercial and private training process.
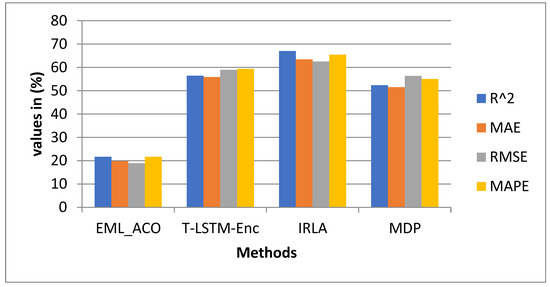
Figure 3.
Analysis of error for the fast private training process.
Table 4.
Analysis of error metrics for the normal commercial and private training process.
Figure 4 illustrates the comparison of error for the normal commercial training process between existing T-LSTM-Enc, IRLA, MDP, and proposed EML_ACO method, where the x-axis shows the various analytical methods and y-axis shows the values obtained in percentage. When compared, the proposed EML_ACO achieved 12.3% of , 11.4% of MAE, 12.5% of RMSE, and 13.7% of MAPE.
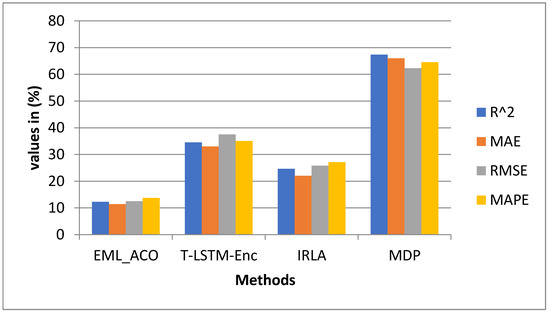
Figure 4.
Analysis of error for the normal commercial training process.
Figure 3 illustrates the comparison of error for the fast private training process between existing T-LSTM-Enc, IRLA, MDP, and the proposed EML_ACO method, where the x-axis shows the various analytical methods and the y-axis shows the values obtained in percentage. When compared, the proposed EML_ACO achieved 21.6% of , 19.7% of MAE, 18.9% of RMSE and 21.6% of MAPE. Table 4 reflects the analysis of error metrics for the normal commercial and private training process.
Figure 4 illustrates the comparison of error for the normal commercial training process between existing T-LSTM-Enc, IRLA, MDP, and the proposed EML_ACO method, where the X-axis shows the various analytical methods and the Y-axis shows the values obtained in percentage. When compared, the proposed EML_ACO achieved 12.3% of , 11.4% of MAE, 12.5% of RMSE and 13.7% of MAPE.
Figure 5 illustrates the comparison of error for the normal private training process between existing T-LSTM-Enc, IRLA, MDP, and the proposed EML_ACO method, where the x-axis shows the various analytical methods and the y-axis shows the values obtained in percentage. When compared, the proposed EML_ACO achieved 14.5% of , 14.3% of MAE, 14.6% of RMSE, and 14.7% of MAPE. Table 5 shows the analysis of error metrics for the fast commercial and private testing process.

Figure 5.
Analysis of error for the normal private training process.
Table 5.
Analysis of error metrics for fast commercial and private testing process.
Figure 6 illustrates the comparison of error for the fast commercial testing process between existing T-LSTM-Enc, IRLA, MDP, and the proposed EML_ACO method, where the x-axis shows the various analytical methods and the y-axis shows the values obtained in percentage. When compared, the proposed EML_ACO achieved 11.5% of , 11.6% of MAE, 12.5% of RMSE, and 13.4% of MAPE.
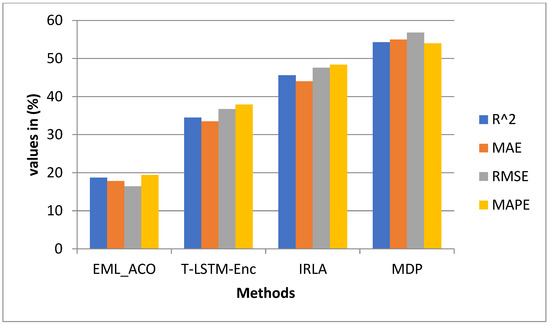
Figure 6.
Analysis of error for the fast commercial testing process.
Figure 7 illustrates the comparison of error for the fast private testing process between existing T-LSTM-Enc, IRLA, MDP, and the proposed EML_ACO method, where the x-axis shows the various analytical methods and the y-axis shows the values obtained in percentage. When compared, proposed EML_ACO achieved 11.5% of , 11.6% of MAE, 12.5% of RMSE and 13.4% of MAPE. The analysis of error metrics for the normal commercial and private testing process is shown in Table 6.
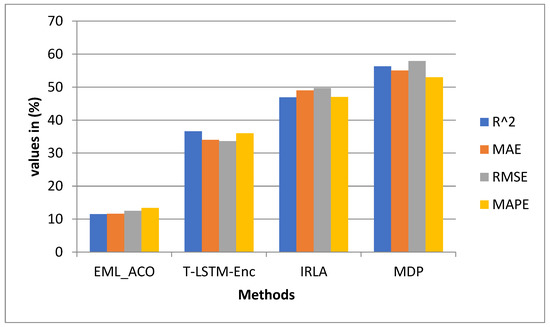
Figure 7.
Analysis of error for the fast private testing process.
Table 6.
Analysis of error metrics for normal commercial and private testing process.
Figure 8 illustrates the comparison of error for the normal commercial testing process between existing T-LSTM-Enc, IRLA, MDP, and the proposed EML_ACO method, where the x-axis shows the various analytical methods and the y-axis shows the values obtained in percentage. When compared, the proposed EML_ACO achieved 14% of , 11.5% of MAE, 11.5% of RMSE, and 11.3% of MAPE.
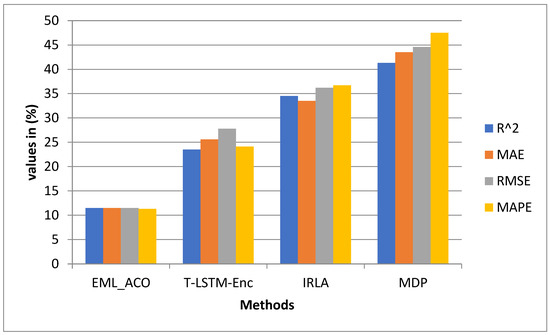
Figure 8.
Analysis of error for the normal commercial testing process.
Figure 9 illustrates the comparison of error for the normal private testing process between existing T-LSTM-Enc, IRLA, MDP, and the proposed EML_ACO method, where the x-axis shows the various analytical methods and the y-axis shows the values obtained in percentage. When compared, the proposed EML_ACO achieved 11.5% of , 14.5% of MAE, 14.3% of RMSE, and 14.3% of MAPE.
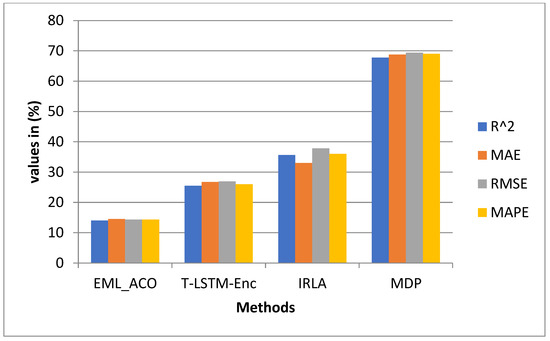
Figure 9.
Analysis of error for the normal private testing process.
13. Conclusions
The findings of this study demonstrate that the suggested approaches can be used to achieve the synchronized charging of PV batteries, while concomitantly preserving the distribution system’s efficient functioning, and meeting operational/priority limitations. Charging costs were found to be reduced more than those incurred via uncoordinated conventional charging. Being efficient, it will also reduce the demand on the local electric grid due to CIs, hence, making it more sustainable. Future research should focus on the user sociodemographic information, driver economic attributes, battery type, charging/discharging cycles, traffic conditions, or network topography, which were not included in this study dataset.
Author Contributions
Methodology, R.C.C.; Software, A.A. All authors have read and agreed to the published version of the manuscript.
Funding
This work was supported by Imam Mohammad Ibn Saud Islamic University (IMSIU), Riyadh, Saudi Arabia, under grant number RP-21-07-10.
Data Availability Statement
All data used in this paper can be obtained by contacting the authors of this study.
Acknowledgments
The authors extend their appreciation to the Deanship of Scientific Research at Imam Mohammad Ibn Saud Islamic University (IMSIU) for funding and supporting this work through Research Partnership Program No. RP-21-07-10.
Conflicts of Interest
The authors declare no conflict of interest.
References
- IEA. Global EV Outlook 2021; IEA: Paris, France, 2021; Available online: https://www.iea.org/reports/global-ev-outlook-2021 (accessed on 23 November 2022).
- Gorner, M.; Paoli, L. How Global Electric Car Sales Defied COVID-19 in 2020. Available online: https://www.iea.org/commentaries/how-global-electric-car-sales-defied-covid-19-in-2020 (accessed on 15 November 2022).
- Bundesregierung. Erstmals Rollen Eine Million Elektrofahrzeuge auf Deutschen Straßen: Mehr als 50 Prozent Dieser Elektrofahrzeuge Sind Rein Batteriebetrieben. Available online: https://www.bmwi.de/Redaktion/DE/Pressemitteilungen/2021/08/20210802-erstmals-rollen-eine-million-elektrofahrzeuge-auf-deutschen-strassen.html (accessed on 11 November 2022).
- Rogers, E.M. Diffusion of Innovations, 5th ed.; Riverside; Free Press: Amsterdam, The Netherlands, 2003; Available online: https://ebookcentral.proquest.com/lib/gbv/detail.action?docID=4935198 (accessed on 24 November 2022).
- Giansoldati, M.; Monte, A.; Scorrano, M. Barriers to the adoption of electric cars: Evidence from an Italian survey. Energy Policy 2020, 146, 111812. [Google Scholar] [CrossRef]
- She, Z.-Y.; Sun, Q.; Ma, J.-J.; Xie, B.-C. What are the barriers to widespread adoption of battery electric vehicles? A survey of public perception in Tianjin, China. Transp. Policy 2017, 56, 29–40. [Google Scholar] [CrossRef]
- ZLing, Z.; Cherry, C.R.; Wen, Y. Determining the Factors That Influence Electric Vehicle Adoption: A Stated Preference Survey Study in Beijing, China. Sustainability 2021, 13, 11719. [Google Scholar]
- Gnann, T.; Funke, S.; Jakobsson, N.; Plötz, P.; Sprei, F.; Bennehag, A. Fast charging infrastructure for electric vehicles: Today’s situation and future needs. Transp. Res. Part D Transp. Environ. 2018, 62, 314–329. [Google Scholar] [CrossRef]
- Jin, L.; He, H.; Cui, H.; Lutsev, N.; Wu, C.; Chu, Y.; Zhu, J.; Xiong, Y.; Liu, X. Driving a Green Future: A Retrospective Review of China’s Electric Vehicle Development and Outlook for the Future. 2021. Available online: https://trid.trb.org/view/1764439 (accessed on 15 November 2022).
- Marquis, C.; Zhang, H.; Zhou, L. China’s Quest to Adopt Electric Vehicles. Stanf. Soc. Innov. Rev. 2013, 11, 52–57. [Google Scholar]
- Hao, H.; Ou, X.; Du, J.; Wang, H.; Ouyang, M. China’s electric vehicle subsidy scheme: Rationale and impacts. Energy Policy 2014, 73, 722–732. [Google Scholar] [CrossRef]
- Xu, Y.; Zhang, W.; Bao, H.; Zhang, S.; Xiang, Y. A SEM–Neural Network Approach to Predict Customers’ Intention to Purchase Battery Electric Vehicles in China’s Zhejiang Province. Sustainability 2019, 11, 3164. [Google Scholar] [CrossRef]
- Nie, Y.; Wang, E.; Guo, Q.; Shen, J. Examining Shanghai Consumer Preferences for Electric Vehicles and Their Attributes. Sustainability 2018, 10, 2036. [Google Scholar] [CrossRef]
- Zhang, G.; Xu, Y.; Zhang, J. Consumer-Oriented Policy towards Diffusion of Electric Vehicles: City-Level Evidence from China. Sustainability 2016, 8, 1343. [Google Scholar] [CrossRef]
- Yue, B.; Sheng, G.; She, S.; Xu, J. Impact of Consumer Environmental Responsibility on Green Consumption Behavior in China: The Role of Environmental Concern and Price Sensitivity. Sustainability 2020, 12, 2074. [Google Scholar] [CrossRef]
- Hecht, C.; Das, S.; Bussar, C.; Sauer, D.U. Representative, empirical, real-world charging station usage characteristics and data in Germany. eTransportation 2020, 6, 100079. [Google Scholar] [CrossRef]
- Hecht, C.; Figgener, J.; Sauer, D.U. ISEAview—Elektromobilität; ISEA Insitute, RWTH Aachen: Aachen, Germany, 2021; Available online: https://www.researchgate.net/publication/349989650_ISEAview_-_Elektromobilitat?channel=doi&linkId=604a4a2192851c1bd4dfae95&showFulltext=true (accessed on 18 November 2022).
- Follmer, R.; Gruschwitz, D. Mobilität in Deutschland—MiD Kurzreport. Ausgabe 4.0; Studie von infas, DLR, IVT und infas 360 im Auftrag des Bundesministers für Verkehr und Digitale Infrastruktur: Bonn, Germany, 2019; Available online: http://www.mobilitaet-in-deutschland.de/pdf/infas_Mobilitaet_in_Deutschland_2017_Kurzreport.pdf (accessed on 27 August 2022).
- Figgener, J.; Tepe, B.; Rücker, F.; Schoeneberger, I.; Hecht, C.; Jossen, A.; Sauer, D.U. The Influence of Frequency Containment Reserve Flexibilization on the Economics of Electric Vehicle Fleet Operation. arXiv 2021, arXiv:2107.03489. [Google Scholar] [CrossRef]
- Hecht, C. BeNutz LaSA: Bessere Nutzung von Ladeinfrastruktur durch Smarte Anreizsysteme. Available online: https://benutzlasa.de/ (accessed on 15 November 2022).
- Ahmad, A.; Alam, M.S.; Chabaan, R. A Comprehensive Review of Wireless Charging Technologies for Electric Vehicles. IEEE Trans. Transp. Electrif. 2018, 4, 38–63. [Google Scholar] [CrossRef]
- Panchal, C.; Stegen, S.; Lu, J. Review of static and dynamic wireless electric vehicle charging system. Eng. Sci. Technol. Int. J. 2018, 21, 922–937. [Google Scholar] [CrossRef]
- Gong, Y.; Otomo, Y.; Igarashi, H. Multi-objective topology optimization of magnetic couplers for wireless power transfer. Int. J. Appl. Electromagn. Mech. 2020, 64, 325–333. [Google Scholar] [CrossRef]
- Sonnenberg, T.; Stevens, A.; Dayerizadeh, A.; Lukic, S. Combined foreign object detection and live object protection in wireless power transfer systems via real-time thermal camera analysis. In Proceedings of the 2019 IEEE Applied Power Electronics Conference and Exposition (APEC), Anaheim, CA, USA, 17–21 March 2019; pp. 1547–1552. [Google Scholar] [CrossRef]
- Xiang, L.; Zhu, Z.; Tian, J.; Tian, Y. Foreign object detection in a wireless power transfer system using symmetrical coil sets. IEEE Access 2019, 7, 44622–44631. [Google Scholar] [CrossRef]
- Gong, Y.; Otomo, Y.; Igarashi, H. Sensorless metal object detection for wireless power transfer using machine learning. COMPEL-Int. J. Comput. Math. Electr. Electron. Eng. 2022, 41, 807–823. [Google Scholar] [CrossRef]
- Ullah, I.; Liu, K.; Yamamoto, T.; Zahid, M.; Jamal, A. Modeling of machine learning with SHAP approach for electric vehicle charging station choice behavior prediction. Travel Behav. Soc. 2023, 31, 78–92. [Google Scholar] [CrossRef]
- Liu, Y.; Wu, Y.; Wang, X.; Li, L.; Zhang, Y.; Chen, Z. Energy management for hybrid electric vehicles based on imitation reinforcement learning. Energy 2023, 263, 125890. [Google Scholar] [CrossRef]
- Eddine, M.D.; Shen, Y. A deep learning based approach for predicting the demand of electric vehicle charge. J. Supercomput. 2022, 78, 14072–14095. [Google Scholar] [CrossRef]
- Ma, T.Y.; Faye, S. Multistep electric vehicle charging station occupancy prediction using hybrid LSTM neural networks. Energy 2022, 244, 123217. [Google Scholar] [CrossRef]
- Rajamoorthy, R.; Arunachalam, G.; Kasinathan, P.; Devendiran, R.; Ahmadi, P.; Pandiyan, S.; Muthusamy, S.; Panchal, H.; Kazem, H.A.; Sharma, P. A novel intelligent transport system charging scheduling for electric vehicles using Grey Wolf Optimizer and Sail Fish Optimization algorithms. Energy Sources Part A Recovery Util. Environ. Eff. 2022, 44, 3555–3575. [Google Scholar] [CrossRef]
- Bai, X.; Wang, Z.; Zou, L.; Liu, H.; Sun, Q.; Alsaadi, F.E. Electric vehicle charging station planning with dynamic prediction of elastic charging demand: A hybrid particle swarm optimization algorithm. Complex Intell. Syst. 2022, 8, 1035–1046. [Google Scholar] [CrossRef]
- Yin, W.J.; Ming, Z.F. Electric vehicle charging and discharging scheduling strategy based on local search and competitive learning particle swarm optimization algorithm. J. Energy Storage 2021, 42, 102966. [Google Scholar] [CrossRef]
- Ding, T.; Zeng, Z.; Bai, J.; Qin, B.; Yang, Y.; Shahidehpour, M. Optimal electric vehicle charging strategy with Markov decision process and reinforcement learning technique. IEEE Trans. Ind. Appl. 2020, 56, 5811–5823. [Google Scholar] [CrossRef]
- Kumar, A.; Sharma, S.; Goyal, N.; Gupta, S.K.; Kumari, S.; Kumar, S. Energy-efficient fog computing in Internet of Things based on Routing Protocol for Low-Power and Lossy Network with Contiki. Int. J. Commun. Syst. 2022, 35, e5049. [Google Scholar] [CrossRef]
- Kumar, A.; Sharma, S.; Goyal, N.; Singh, A.; Cheng, X.; Singh, P. Secure and energy-efficient smart building architecture with emerging technology IoT. Comput. Commun. 2021, 176, 207–217. [Google Scholar] [CrossRef]


Disclaimer/Publisher’s Note: The statements, opinions and data contained in all publications are solely those of the individual author(s) and contributor(s) and not of MDPI and/or the editor(s). MDPI and/or the editor(s) disclaim responsibility for any injury to people or property resulting from any ideas, methods, instructions or products referred to in the content. |
© 2023 by the authors. Licensee MDPI, Basel, Switzerland. This article is an open access article distributed under the terms and conditions of the Creative Commons Attribution (CC BY) license (https://creativecommons.org/licenses/by/4.0/).