Article

Drought Assessment across Erbil Using Satellite Products

by
Mohammed Mustafa Alee
1,
Ali Danandeh Mehr
2,3,
Ozgun Akdegirmen
2 and
Vahid Nourani
4,5,*
1
Department of Information Technology, Choman Technical Institute, Erbil Polytechnic University, Erbil 44001, Iraq
2
Department of Civil Engineering, Antalya Bilim University, Antalya 07190, Turkey
3
MEU Research Unit, Middle East University, Amman 11831, Jordan
4
Centre of Excellence in Hydroinformatics, Faculty of Civil Engineering, University of Tabriz, Tabriz 51666, Iran
5
Faculty of Civil and Environmental Engineering, Near East University, Lefkoşa 99138, Turkey
*
Author to whom correspondence should be addressed.
Sustainability 2023, 15(8), 6687; https://doi.org/10.3390/su15086687
Submission received: 21 January 2023 / Revised: 5 April 2023 / Accepted: 12 April 2023 / Published: 14 April 2023
(This article belongs to the Special Issue Application of MODIS Data for Water Resources Management)

Abstract

:
In this article, meteorological and agricultural droughts across the Erbil province, Iraq, were assessed using remote sensing data and satellite products. To this end, the long-term (2000–2022) Standardized Precipitation Evapotranspiration index (SPEI) at 1- and 3-month accumulation periods (SPEI-1 and SPEI-3) as well as the Normalized Difference Vegetation Index (NDVI) across Erbil were utilized. While the former was retrieved from the global SPEI data repository, the latter was derived from Moderate Resolution Imaging Spectroradiometer (MODIS) products. The spatiotemporal variations in the SPEI indices indicated that two to nine extreme drought events occurred in the province with an increasing northward pattern. An increasing trend in the long-term NDVI series was also detected, having more diversity in vegetation coverage in the northern part of the province. The relationship between the SPEI and MODIS-NDVI was found to be positive but insignificant. Thus, we concluded that short-term meteorological droughts were not the only reason for the agricultural droughts in Erbil. Furthermore, the climate characteristics related to the cumulative water balance over a previous season is not an important trigger for the spatial variation in vegetation coverage across the province.
Keywords:
drought; SPEI; NDVI; Erbil; MODIS; Iraq

1. Introduction

Drought, as one of the most crucial and severe natural hazards, has a significant impact on the economy, ecology, agriculture, and sustainable development of countries [1,2,3,4]. While drought has been defined according to many different characteristics, Şen (2015) categorized drought into four main types: meteorological, agricultural, hydrological, and famine. These are, respectively, the consequences of deficits in precipitation, runoff, soil moisture, and food [5]. To assess meteorological drought, researchers have analyzed different indices such as the Standardized Precipitation Index (SPI; [6]), the Standardized Precipitation Evapotranspiration Index (SPEI; [7]), the Palmer drought severity index (PDSI; [8]), the Standardized Antecedent Precipitation Evapotranspiration Index (SAPEI; [9]), etc. For agricultural drought assessment, the commonly used indices include (but are not limited to) the Crop Moisture Index (CMI; [10]), the Standardized Vegetation Index (SVI; [11]), the Enhanced Vegetation Index (EVI; [12]), and the Normalized Difference Vegetation Index (NDVI; [13]). For a comprehensive list of drought indices and indicators, it is suggested that the reader refer to [14].
Regarding postulate climate change, increasing drought vulnerability has been reported in many studies [15,16]. The Middle East is one of the regions that has been recognized as a hot spot for radical change in its available water resources and agricultural production, with projections that report increasing extreme climate events such as drought and floods [16,17,18,19,20]. For example, [21] investigated meteorological drought across the Eastern Mediterranean, Seyhan, Ceyhan, and the Asi Basins and showed that southern Turkey was closely affected by severe water scarcity owing to climate change. In another study, [22] reported a slight increase in minimum and maximum temperature in the northeast of Iran, indicating higher meteorological and agricultural drought frequencies in the near and far future. The effect of climate variation on the frequency of extreme drought events across Ankara was reported by [16]. The negative effect of increasing temperature on the frequency of agricultural droughts and crop production in Egypt was demonstrated by [23]. As a result, the authors came up with the idea of changing the country’s current infrastructure and cropping system. Similar negative impacts on agriculture, particularly crop failure and water shortage, were reported in Syria [24].
Considering drought assessment studies in the Middle East, numerous studies have investigated trends in various drought categories during the past few decades. For example, [17] investigated the impacts of agricultural drought on Lake Darbandikhan, Iraq, and revealed that the Lake basin experienced the most severe drought events from 2008 to 2009. In a similar study, [25] investigated meteorological drought variations in southern Turkey. The authors showed that the region typically had near-normal drought conditions during the period 1970 to 2014. In another study, [26] investigated meteorological drought across the entirety of Turkey and showed that the total number of dry months had an increasing trend during the period 1995–2014. Analyzing hydrological drought events across the Asi basin using monthly streamflow data from 1954 to 2005 revealed that the number of dry years in the period 1980–2005 was much higher than the number of dry years in the period 1954–1979 [27].
Like most of the Mediterranean countries, Iraq has been subjected to several drought events during the past several decades even though the country had been known as a water-rich country in the Middle East [19,28,29]. Numerous studies have shown the importance of remote sensing, information technology, and automatic monitoring systems to sustainable watershed development [30,31,32]. These approaches have already been applied to assess drought and vegetation coverage across Iraq [33,34,35,36]. For example, [34] used the SPI and the NDVI to develop drought risk maps for Iraq. The authors showed that approximately 24% of Iraq’s territory suffers from severe or extremely severe drought risk. In another study, [36] investigated urban growth and the vegetation coverage extent within and around the city of Erbil using MODIS imagery. The study showed that most of the green area was replaced with urban areas over the period of 2000–2015. More recently, [28] implemented the Landsat dataset to attain the NDVI, the Normalized Difference Water Index, and the SPI to assess meteorological drought and identify changes in the green area and water body extents across Sulaymaniyah Province, Iraq. The authors demonstrated the occurrence of several severe droughts in the region together with a 33% decrease in vegetative coverage by the year 2000.
In this study, our aim was to assess the spatiotemporal variation in meteorological and agricultural drought across Erbil Province during the period of 2000–2022. Following the above-mentioned studies, the study was conducted based on satellite/remote sensing data. To assess meteorological drought, the associated SPEI values at 1- and 3-month accumulation times were retrieved from the global SPEI drought repository “http://spei.csic.es/ (accessed on 20 December 2022)”. To assess the agricultural drought condition, the NVDI series/maps were retrieved from the Moderate Resolution Imaging Spectroradiometer (MODIS) satellite. Differing from the earlier studies, which suggest the use of remote sensing data for drought monitoring at ungauged catchments [28,35], this study for the first time explores the effect of meteorological drought on vegetation coverage across Erbil by evaluating the correlation between the SPEI and the MODIS-NDVI illustrating green vegetation coverage.

2. Materials and Methods

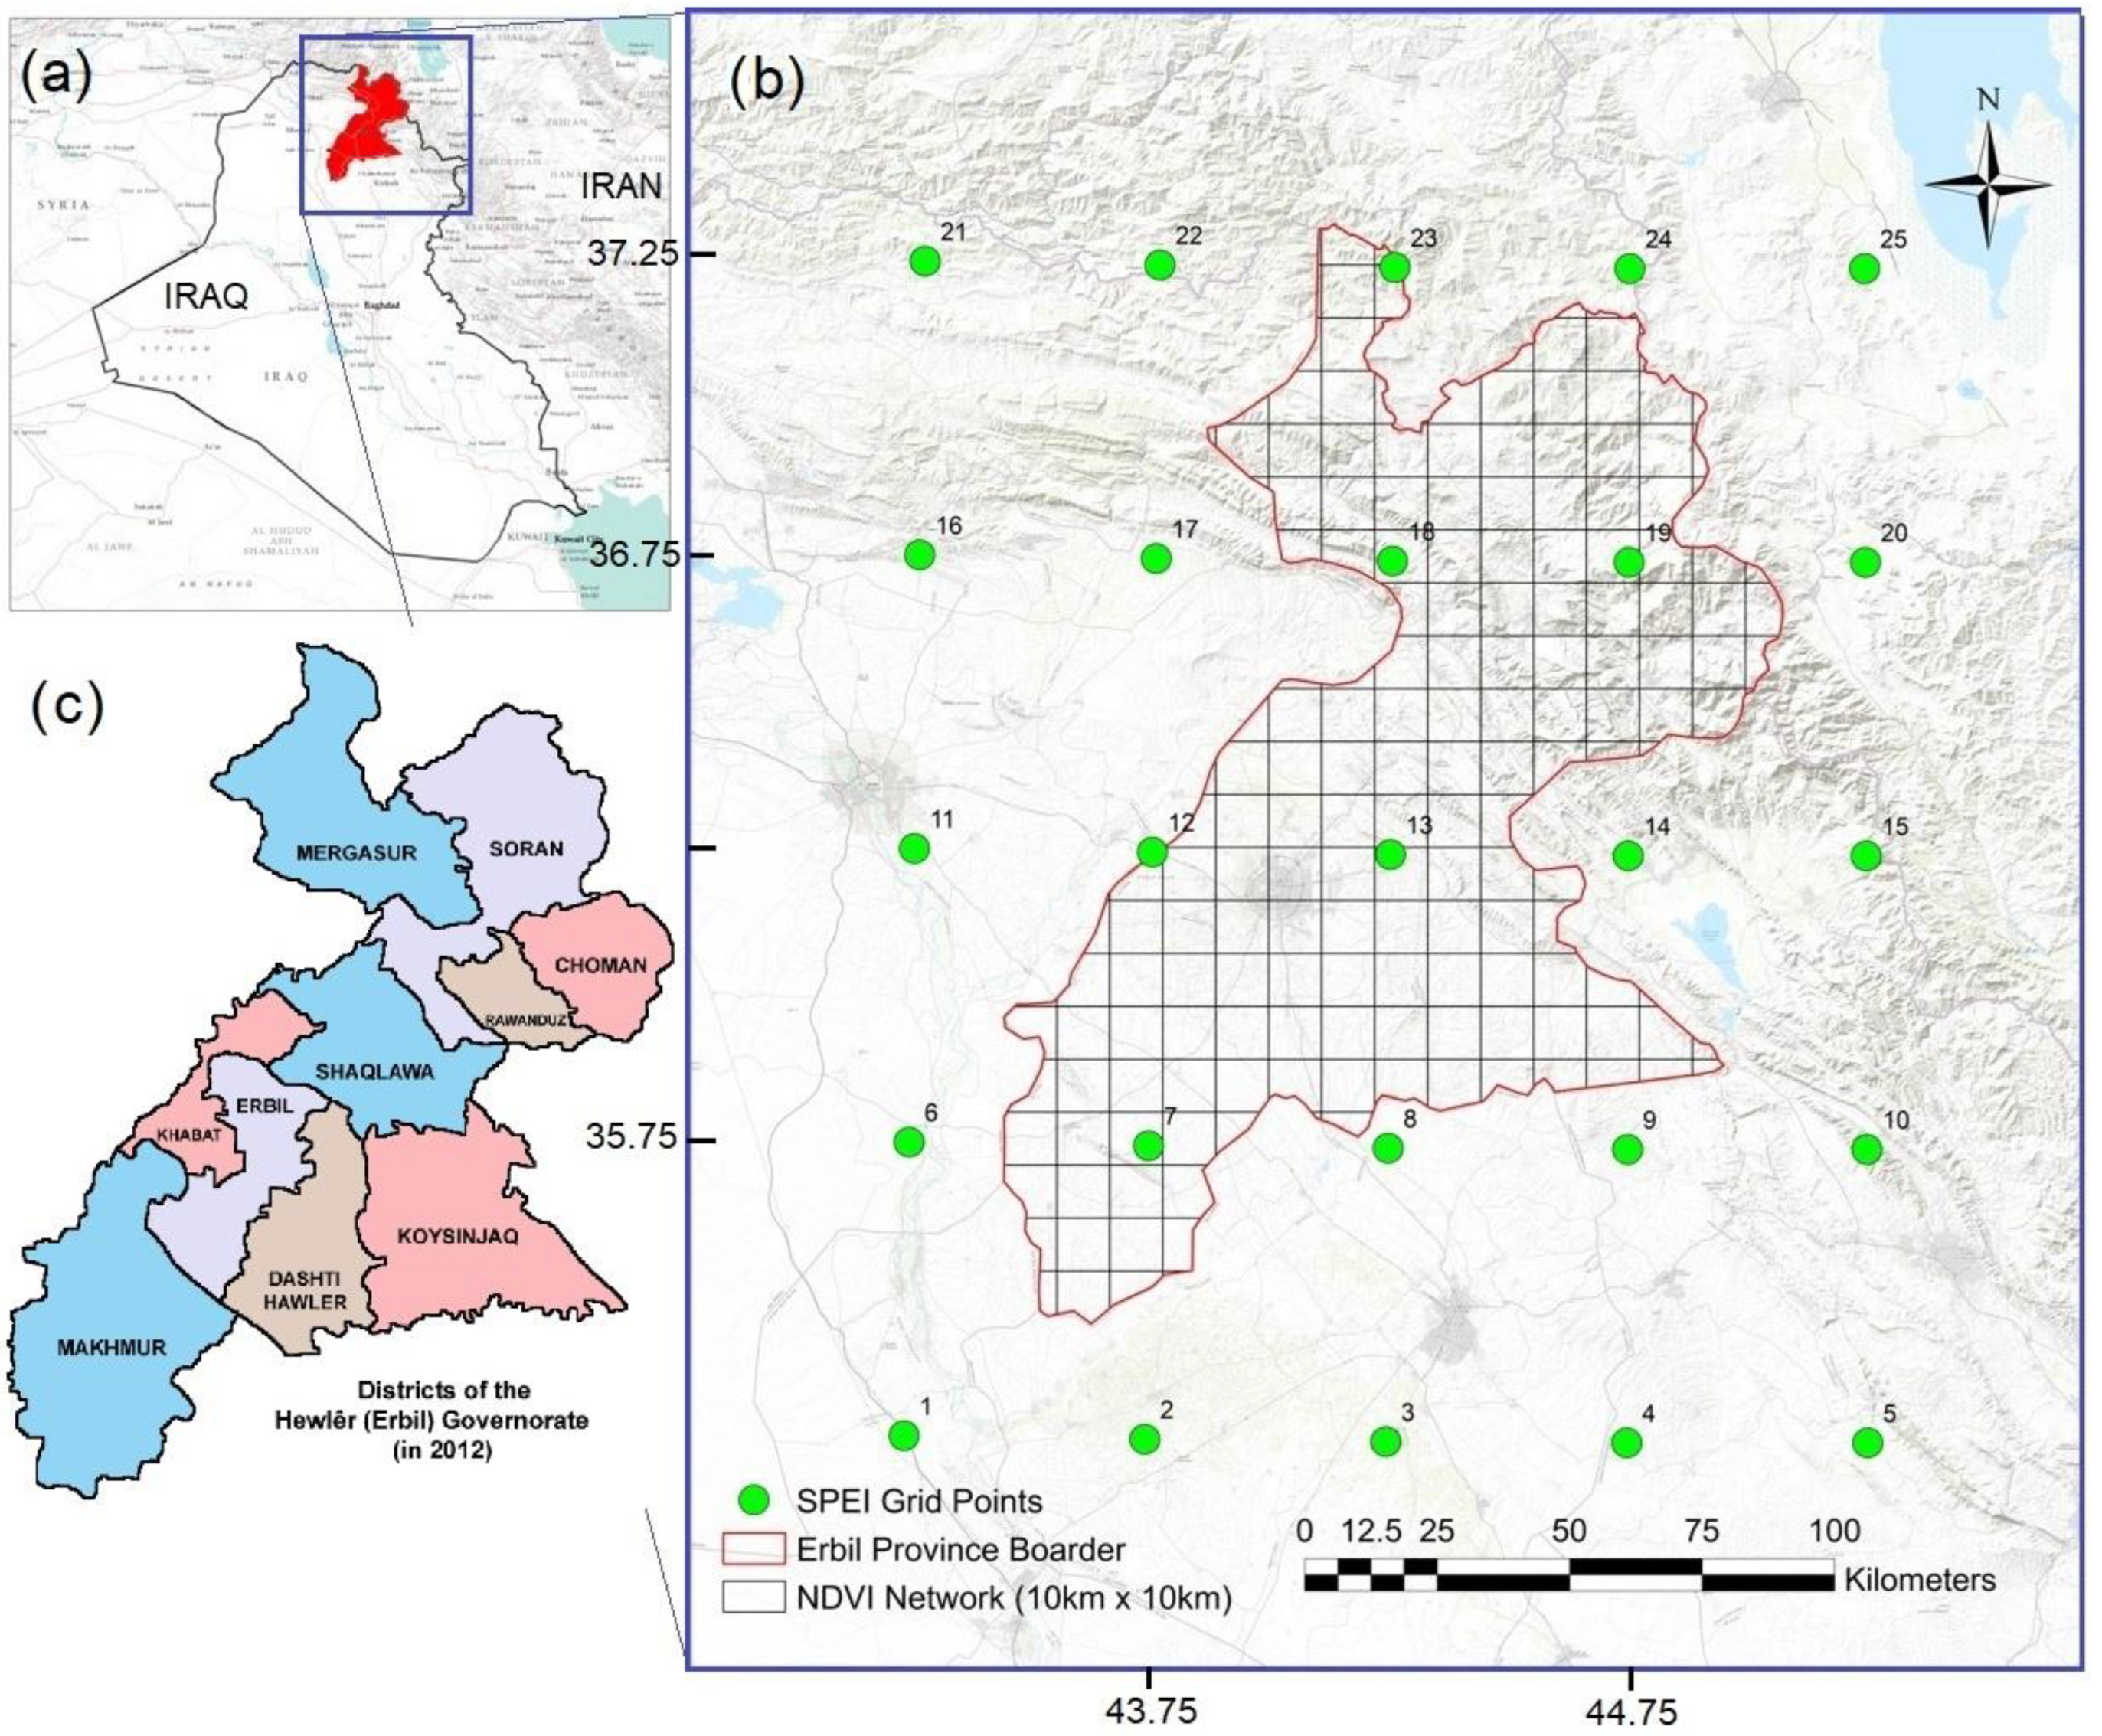
2.1. Study Area and Data

Erbil (Figure 1) is one of the four Kurdish provinces of Iraq, located between latitudes 36°12′11″ and 36°15′10″ N and longitudes 44°12′11″ and 44°15′10″ E. The northern parts of the province have an average elevation of about 2400 m. The province has very hot and dry summers (June to September) with an average temperature of 39 °C to 43 °C. Autumns are dry and mild. The average temperature in October is 25 °C to 30 °C, and it cools down slightly in November. Winters are mild, except in the high mountains. The average high winter temperatures are 7 °C to 13 °C and the average low winter temperatures are 2 °C to 7 °C [37]. The long-term wind rose in the province shows that wind predominantly blows from southwest to northeast. For details on the lithology, morphology, and landscapes of the Erbil Plain, the reader is referred to [38].
To attain local monthly SPEI series over Erbil, the global SPEI database, which supports long-term SPEI series at a global scale with a 0.5° spatial resolution, was utilized. The database has a multi-scale feature that provides SPEI timescales between one and 48 months. The SPEI-1 and SPEI-3 time series for the period between January 2000 and August 2022 at 25 global grid points located within and around the province (see Figure 1b) were extracted. The SPEI-1 and SPEI-3 represent the cumulative water balance over the previous one and three months, respectively. Six points out of the 25—#7, #12, #13, #18, #19, and #23—are located within the province. Thus, we called them representative points, and their associated SPEI and NDVI values were used for a point-by-point correlation analysis in this study.
To attain monthly NDVI series over Erbil, NASA’s AppEEARS system was used [39]. The NDVI values with the original resolution of 1.0 km in the period February 2000 to August 2022 for all 25 points were gathered from the Terra MODIS satellite [40] (Table S1). The MODIS-NDVI pixel data corresponding to the representative points (#7, #12, #13, #18, #19, and #23) were then extracted for the point-by-point analysis. The statistical characteristics of the SPEI and NDVI series at the representative points were summarized in Table 1. According to Table 1, negative NDVI values were measured at points 19 and 23 (i.e., Choman and Mergasur districts; Figure 1c) that represent the existence of high-flow periods at tributaries in the mountainous and hilly regions of the province. The biggest range (i.e., max–min) and standard deviation were also observed at point 23 with a value of 0.70706 and 0.1938, respectively.

2.2. Overview of the Implemented Drought Indices

2.2.1. SPEI

The SPEI is a multi-scalar probabilistic meteorological drought index suggested by [7]. It has been widely used in previous studies because it considers variation in both precipitation and temperature and therefore correlates better with hydrological and ecological variables. Thus, long-term monthly precipitation and evapotranspiration data are required for SPEI calculation. To calculate the SPEI, first, the water balance deficiency (Di) is acquired by subtracting the potential evapotranspiration (PETi) from the total precipitation (P) value at various time scales i (Equation (1)) (i.e., over one month, two months, etc.). Then, the most suitable theoretical log-logistic cumulative density function is fitted to the Di time series aggregated at different time scales. Finally, the SPEI is obtained as the standardized values of the probability density function of Di. For details on the calculations of the SPEI, the interested reader is referred to [7].
Di = Pi − PETi
A critical task in assessing drought conditions based on the SPEI is the determination of SPEI thresholds based on the severity of the SPEI, which allows the user to separate the dry and wet periods and classify them into extreme, severe, or moderate events. Many researchers have used the SPI thresholds for SPEI classification regardless of the fact that the SPI thresholds were attained through the Gaussian distribution model. Inasmuch as the global SPEI data repository uses a log-logistic distribution function to calculate the SPEI values, the threshold values suggested by [16] were used in this study (see Table 2).

2.2.2. NDVI

The NDVI is a remote sensing index used to measure plant health and plant area of coverage in a broad sense. The earliest mention of the index is in 1973 with the development of Near-Infrared (NIR) sensors for satellites. The index is based on the reflection of the near-infrared spectrum and the absorption of the visible red of green vegetation. The NDVI values range between −1.0 and 1.0 and are calculated by the difference between near-infrared reflectance and optical red reflectance relative to the sum of near-infrared and optical red reflectance (Equation (2)). While negative values indicate snow-covered areas and clouds or water bodies, an increase in NDVI values close to 1.0 indicates the presence of dense forest areas [41].
NDVI = NIR     Red NIR   +   Red
where RED and NIR are the red portion (0.6–0.7 μm) and near infrared portion (0.75–1.5 μm) of the electromagnetic spectrum, respectively.
Several satellite-based data repositories, such as USGS Earth Explorer, provide remotely sensed images that can be used for calculating the NDVI taking NIR and RED bands. The gridded daily NDVI data are also available from NOAA CDR (from 1981 onward). In this study, the long-term NDVI values were collected for the study area from the Terra MODIS satellite. There is no absolute coverage that can be assigned to the NDVI. Here, we interpret NDVI values as listed in Table 3. The higher these ratio outputs are, the more actively the plant is growing.

2.3. Adopted Methodology

Figure 2 illustrates the general methodology implemented in the present study, showing the underlying process of spatiotemporal drought and vegetation coverage monitoring across Erbil.
As previously mentioned, at the first step, SPEI Global Drought Monitor and MODIS web were used to respectively retrieve monthly SPEI and NDVI series across the province. As the spatial resolutions of SPEI Global Drought Monitor and MODIS-NDVI images are different, the NDVI data corresponding to the exact location of the representative points were extracted to conduct a point-by-point timeseries and statistical analysis. Then, to evaluate the spatial variation in the monthly NDVI within the boundaries of the province, the entire area was divided into 10 km × 10 km cells (Figure 1b, black grids). In this stage, the ArcGIS model builder was applied to calculate the mean NDVI values (NDVIm hereafter) at each cell and determine the percentage of each individual coverage type (land use) in the province. Moreover, using the co-kriging approach, spatial variation in the point SPEI values was interpolated across the province regarding its digital elevation model (topography map). Traditional interpolation (mapping) methods such as simple areal weighting only use data available at the target location and fail to use existing spatial correlations between the primary attribute to be estimated and secondary data points. As the geostatistical co-kriging method has the advantage of covariance between two or more regionalized variables, and the representative SPEI points are sparse, but the related secondary information (elevation) is abundant, it yields more reliable SPEI estimations because it capitalizes on the strengths of both data types.
To reflect the inter-annual/annual vegetation volatility, the coefficient of variation (CV) of the NDVI data at each pixel for the period 2000–2022 was also calculated through Equation (3) as suggested in the literature [42,43].
CV = σ NDVIm
where σ denotes the standard deviation of NDVI series. Eventually, cross-correlation analysis between NDVIm and the spatial distribution of SPEI values was performed to detect the response of vegetation coverage to meteorological drought. Time series plots are suitable for reckoning crop stage or growing phase (i.e., seeding, vegetative development, flowering, grain-filling, etc.), and cross-correlation analysis helps in realizing when periods of dryness or drought stress occurred during the growing season.

3. Results

3.1. Spatiotemporal Variation in SPEI

The SPEI time series attained at each representative point are depicted in Figure 3. The figure indicates that dry and wet periods did not necessarily occur in the same months at each point. Moreover, the drought frequency is not identical. Thus, it is concluded that the province has different microclimates in its various parts. To specify the exact number of different drought events, the dry periods (SPEI ≤ −1.0) at each point, the associated time series were classified into MD, ED, and SD classes according to the thresholds given in Table 2. The total number for each event is tabulated in Table 4. In addition, the table provides the total length of the event that occurred during the monitoring period.
Considering the SPEI-1, the maximum number of MD events was 41, which occurred at point 19 (Mergasur district). Indeed, the district suffered from a total of 34 months of moderately dry conditions during the period from 2000 to 2022. The maximum numbers of SD and ED events were observed at the same location, with 21 and 20 events, respectively. Although the number of the observed ED events was one event less than those of SD, it lasted four months more at this point. According to the SPEI-3, the maximum number of MD, SD, and ED events was observed at points 23 and 19. The lower the drought severity, the higher its duration. During the past 22 years, the longest MD was seen at point 12 (Khabat district). Surprisingly, the cumulative length of SD events (41 months) is strikingly higher than those of MD and ED (29 and 21 months, respectively). Considering both 1- and 3-month timescales, the table also indicates that points/districts located at higher latitudes experienced more drought events than the southern regions of the province. The table also shows that the total number of drought events decreases as a higher accumulation period is considered at each point.
Figure 4 lists the results of correlation analysis (Pearson coefficients; r) performed using the SPEI series at each point. A strong positive correlation exists among all points except point 19 (Choman City), which represents the highest altitudes (~1500 m above sea level) of the province. Focusing on SPEI-1 (Figure 4a), a slightly negative correlation between point 7 (Makhmur district) and point 19 (Choman highlands) is seen. As point 7 is at the lowest altitude (~250 m above sea level), such a negative correlation may be associated with the elevation difference between the southern and northern parts of the province.
To assess the range of the SPEI and the density of wet and dry periods at the representative points, box diagrams were plotted as shown in Figure 5. Overall, the figure indicates that the wet and dry spells are distributed symmetrically around the median at points 12, 13, and 18. In these points, the mean and median are approximately equal to zero, and the interquartile range (Q3–Q1) is within the near-normal category (see Table 2). From a geographical perspective, points 12 and 13 are at the same latitude. Although point 18 is located at a higher latitude than point 13, the figure surprisingly shows similar SPEI distributions at these points. This implies that the middle part of the province, where the city of Erbil is located, has the same microclimate. By contrast, different climates were observed in the southern and northern parts of the province. While in the southern regions (representative point 7) the median shifted upward, points 19 and 23 show a negative median and mean value. The outliers are mostly seen on the negative side, indicating a higher frequency of ED than flooding events in the province.
Figure 6 illustrates the spatial variation in the most radical ED and EW events that occurred during the study period independently of the month of the year. Regarding both SPEI-1 and SPEI-3, the figure, in general, indicates that eastern Erbil experienced the most radical wet (EW), but the least dry (ED) events. These areas are the foothills of the Zagros Mountain range. Since the prevailing wind in the region blows from the southwest to the northeast, the authors believe that the main cause of such a pattern in this region is the orographic phenomenon. Regarding ED (Figure 6a,c), the hotspot (yellow to red colors) in both the SPEI series is the Koysincaq district in the southeast, which experiences the worst drought conditions with a severity less than −4.0.

3.2. Spatiotemporal Variation in NDVI

The monthly NDVI time series attained at each representative point are depicted in Figure 7. In addition, the attained NDVIm time series for a total of generated 183 cells are presented in Table S2. Figure 6 indicates different patterns in different points ranging from no vegetation (desert) to very healthy vegetation (dense forest); however, an increasing trend is seen at all points, particularly at point 18. At point 7, the NDVI varies in the range of 0.1 to 0.45 with a mean of 0.17 (see Table 1) indicating sparse vegetation. At point 12, the total green area is slightly higher than point 7, but the dense green vegetation (NDVI ≥ 0.6) merely observed in some months is associated with the growing crop yields. Similar conditions are observed at representative points 13, 18, and 19. The higher positive values at points 19 and 23 together with the negative ones respectively show denser vegetation and cloud cover in these districts (Choman, Soran, and Mergasur).
Figure 8a illustrates the results of the cross-correlation analysis performed using the monthly NDVI series at the representative points. A strong positive correlation (r ≥ 0.7) exists among points 7, 12, and 13. By moving away from point 7, the associated values gradually decrease and achieve negative ones at points 19 and 23. This indicates that vegetation growth in southern Erbil increases when cloud-dense/snow cover decreases in the northern part of the province. Additionally, the range of NDVI for the representative points across Erbil is evaluated in Figure 8b. It is observed that point 23 had the highest diversity in monthly land coverage (interquartile range IQR = 0.22). Furthermore, an increasing trend in all quartiles is seen from the southern points (#7) to the northern points (#23) with approximately the same median at points 18 and 19, which are in the same latitude.
The spatial distribution of the average NDVI and the associated coefficient of variation (CV) for the growing season from 2000 to 2022 are shown in Figure 9. Figure 9a shows that the NDVI gradually increased from south to north. The transition zone between the Mergasur and Soran districts had the highest NDVI values, while the Soran and Choman highlands had the lowest ones. The figure also indicates that transitions between the Erbil, Khabat, and Makmur districts had the highest NDVI value, although surface coverage remains within the moderate healthy vegetation range. Evaluation of the descriptive statistics of the NDVI values for the study area pointed out that the Soran, Choman, and Ravanduz districts had a similar spatial pattern, having the highest vegetation coverage variability. As depicted in Figure 9b, we classified the associated CV values into five categories (i.e., lower (CV ≤ 0.394), low (0.394 < CV ≤ 0.789), moderate (0.78 < CV ≤ 1.58), high (1.58 < CV ≤ 1.97), and higher (CV ≥ 1.97)) using 20, 40, 60, and 80 quantiles to compare surface coverage variability precisely. According to the figure, areas with a higher NDVI exhibited lower variation during the period 2000–2022. Similarly, the lower the NDVI, the higher the variation. Assessment of the quantiles of CV values revealed that most of the study area had low and lower variability: 64.68% and 29.94%, respectively. Lands with moderate, high, and higher variations cumulatively encompass 5.38% of the province, which mostly extended to the northeastern regions of the study area along the Iraq and Iran borders.

3.3. Response of Vegetation Coverage to Meteorological Drought

It is a rational assumption to suppose that not only the preceding month’s water deficit (SPEI-1) but also the climate characteristics related to the cumulative water balance over one previous season (SPEI-3) may play a significant role in clarifying the spatial distribution of vegetative coverage. Therefore, to estimate the cumulative effect of precipitation and evaporation on vegetation coverage across the study area, the spatial distribution of the Pearson coefficient, r, between the drought indices and the MODIS-NDVI time series are depicted in Figure 10.
Comparing the maximum correlation attained for each cell shows higher correlations existing between SPEI-3 and the NDVI. In both, the maximum correlation is seen in eastern Erbil, where the most extreme wet events also happened (see Figure 5). Thus, it is concluded that the correlations are generally stronger during the growing season. Interestingly, the location of maximum correlation is in the southeastern district, where the most radical drought events (SPEI ≤ −2.8) have occurred. Inasmuch as the attained correlation values remain in the range of −0.30 to +0.35, we cannot conclude a strong linear relationship between the current-month NDVI and that of the month ahead as well as the season-ahead SPEI values. This is generally in agreement with previous studies that found that the NDVI has a low and insignificant correlation coefficient with the SPI in the Iraqi Kurdistan Region [28].

4. Discussion

Among the variety of meteorological indices, the SPEI has received striking attention in recent studies, and several researchers have attempted to produce the SPEI with a higher resolution for different regions. For example, [44] produced a high spatial resolution SPEI dataset (5 km) that covers the whole of Africa at a monthly temporal resolution from 1981 to 2016. In a similar study, [45] produced an SPEI dataset for Central Asia with a special resolution of 5 km with different time scales in 1981–2018. Despite providing a higher spatial resolution, these studies have a limited time span, and the produced SPEI data are not updated over time. The main advantages of the global SPEI dataset used in this study are (i) its continuing feature and (ii) its global areal extent. At the end of each month, the associated SPEI is calculated and added to the relevant repository. Thus, more recent data are available to assess drought conditions in a larger domain on the earth. This is of paramount importance where reliable and long-term observatory meteorological stations, such as Erbil Province, are not available. On the contrary, the dataset suffers from a coarser spatial resolution that may include uncertainties when quantitative SPEI estimates are required for catchment-scale studies. Following [46], the authors believe that the dataset is reliable enough to provide a general perspective on the long-term spatiotemporal variation in meteorological drought across Erbil Province. It is worth mentioning that downscaling the global SPEI dataset to station scale may yield more accurate estimations, provided that accurate records of observed precipitation and evapotranspiration are available.
Over the past decades, only a few studies have investigated long-term spatiotemporal variation in meteorological and agricultural drought across Iraq. Regarding the Erbil governorates, the correlation analysis showed that the relationship between the SPEI and the MODIS-NDVI is positive but insignificant. This finding is in line with the results of [36], which demonstrated no evidence of a correlation between any climate variable compared to the vegetation indices over the city of Erbil and its surroundings. A similar conclusion was reported by [28], in which a correlation analysis between the SPI and NDVI was carried out. Although the multiple time scales and multivariable index used in our study reflect a clearer picture of the role of meteorological drought conditions in the province in comparison to [28], both studies reveal that short-term meteorological drought is not the only reason for the vegetative droughts in Erbil Province.
Our study was limited to the use of single representative meteorological (i.e., SPEI) and agricultural (i.e., NDVI) drought indices. Future studies may consider a variety of drought indices such as the Reconnaissance Drought Index [47], which might reveal better correlations between meteorological and agricultural drought.

5. Conclusions

The results of the spatiotemporal SPEI analysis demonstrated that the regions located at higher latitudes were subjected to more drought events than those located in the southern regions of the province. As the dominant wind direction is northward, we concluded that drought propagation was parallel to the local wind direction in the province. Lasting for five months (April to August) with an average severity of −1.88, the province experienced its longest ED event in the year 2011; however, the most radical ED, having the highest average severity of −2.70, occurred in 2021 and lasted for three months (April to June). The results also pointed out that the frequency and severity of meteorological droughts have increased in the recent decade (2011–2022) compared to the preceding decade (2000–2010).
The NDVI assessment results revealed that the MODIS-NDVI values had a slightly increasing trend with gradually increasing values in northern districts. The highest NDVI values at the representative points were 0.7076 in April 2018, 0.682 in March 2015, 0.642 in April 2019, 0.5981 in April 2015, 0.5967 in April 2018, and 0.431 in February 2019 for points 23, 12, 18, 13, 19, and 7, respectively. Our findings showed that vegetation growth in southern Erbil increases when cloud-dense/snow cover decreases in the northern part of the province. The spatial distribution of the average NDVI and their associated CV for the growing season confirmed that the southern districts had surface coverage within the no vegetation to sparse vegetation range. This pattern gradually changes to moderate healthy vegetation at higher latitudes. While the northern Koysinjaq and Shaqlava districts had the lowest variability, the Choman district at Iran’s border showed the highest variability during the study period. Ultimately, the results of the cross-correlation analysis between the drought indices and the NDVI time series demonstrated that they are not strongly correlated. Thus, the temporal variations in the NDVI are not affected by short-term (up to 3 months) water deficit. This could perhaps be owing to the plant types that can withstand water deficits, thus meaning that vegetation reaction to water deficit is slow.

Supplementary Materials

The following supporting information can be downloaded at: https://www.mdpi.com/article/10.3390/su15086687/s1, Table S1: Monthly MODIS-NDVI values at 25 points within and around the Erbil Province recorded in the period of February 2000 to August 2022; Table S2: Monthly MODIS-NDVI time series interpolated for a total of 183 cells (10 km × 10 km) across the Erbil Province.

Author Contributions

Conceptualization, M.M.A. and A.D.M.; methodology, A.D.M. and V.N.; software, M.M.A. and O.A.; validation, V.N. and A.D.M.; formal analysis, M.M.A. and O.A.; investigation, M.M.A. and A.D.M.; resources, M.M.A. and A.D.M.; data curation, V.N. and A.D.M.; writing—original draft preparation, M.M.A. and A.D.M.; writing—review and editing, V.N. and A.D.M.; visualization, M.M.A. and A.D.M.; supervision, V.N. and A.D.M. All authors have read and agreed to the published version of the manuscript.

Funding

This research received no external funding.

Institutional Review Board Statement

Not applicable.

Informed Consent Statement

Not applicable.

Data Availability Statement

The SPEI data are publicly available at “https://www.spei.es (accessed on 20 December 2022)”.

Acknowledgments

The authors are thankful for the reviewers.

Conflicts of Interest

The authors declare no conflict of interest.

References

  1. Wilhite, D.A.; Glantz, M.H. Understanding: The drought phenomenon: The role of definitions. Water Int. 1985, 10, 111–120. [Google Scholar] [CrossRef] [Green Version]
  2. Panyasing, S.; Yongvanit, S.; Purnomo, E.P.; Tham, I.; Aim, S. The government policy on the organic rice farming groups embracing sustainable agricultural production: Evidence in Thailand. AgBioForum 2022, 24, 83–94. [Google Scholar]
  3. Jia, L.; He, Y.; Liu, W.; Zhang, Y.; Li, Y. Response of Photosynthetic Efficiency to Extreme Drought and Its Influencing Factors in Southwest China. Sustainability 2023, 15, 1095. [Google Scholar] [CrossRef]
  4. Maghrebi, M.; Noori, R.; Bhattarai, R.; Mundher Yaseen, Z.; Tang, Q.; Al-Ansari, N.; Madani, K. Iran’s Agriculture in the Anthropocene. Earth’s Future 2020, 8, e2020EF001547. [Google Scholar] [CrossRef]
  5. Şen, Z. Applied Drought Modeling, Prediction, and Mitigation; Elsevier: Amsterdam, The Netherlands, 2015. [Google Scholar]
  6. McKee, T.B.; Doesken, N.J.; Kleist, J. The relationship of drought frequency and duration to time scales. In Proceedings of the 8th Conference on Applied Climatology, Anaheim, CA, USA, 17–22 January 1993; pp. 179–183. [Google Scholar]
  7. Vicente-Serrano, S.M.; Beguería, S.; López-Moreno, J.I. A Multiscalar Drought Index Sensitive to Global Warming: The Standardized Precipitation Evapotranspiration Index. J. Climate 2010, 23, 1696–1718. [Google Scholar] [CrossRef] [Green Version]
  8. Palmer, W.C. Meteorological Drought; US Department of Commerce, Weather Bureau: Washington, DC, USA, 1965; Volume 30. [Google Scholar]
  9. Li, J.; Wang, Z.; Wu, X.; Xu, C.; Guo, S.; Chen, X. Toward Monitoring Short-Term Droughts Using a Novel Daily Scale, Standardized Antecedent Precipitation Evapotranspiration Index. J. Hydrometeorol. 2020, 21, 891–908. [Google Scholar] [CrossRef] [Green Version]
  10. Palmer, W.C. Keeping track of crop moisture conditions, nationwide: The new crop moisture index. Weatherwise 1968, 21, 156–161. [Google Scholar] [CrossRef]
  11. Peters, A.J.; Walter-Shea, E.A.; Ji, L.; Vina, A.; Hayes, M.; Svoboda, M.D. Drought monitoring with NDVI-based standardized vegetation index. PE&RS 2002, 68, 71–75. [Google Scholar]
  12. Huete, A.; Didan, K.; Miura, T.; Rodriguez, E.P.; Gao, X.; Ferreira, L.G. Overview of the radiometric and biophysical performance of the MODIS vegetation indices. Remote Sens. Environ. 2002, 83, 195–213. [Google Scholar] [CrossRef]
  13. Tarpley, J.D.; Schneider, S.R.; Money, R.L. Global vegetation indices from the NOAA-7 meteorological satellite. J. Clim. Appl. Meteorol. 1984, 23, 491–494. [Google Scholar] [CrossRef]
  14. Yihdego, Y.; Vaheddoost, B.; Al-Weshah, R.A. Drought indices and indicators revisited. Arab. J. Geosci. 2019, 12, 1–12. [Google Scholar] [CrossRef]
  15. Yu, W.; Li, Y.; Cao, Y.; Schillerberg, T. Drought assessment using GRACE terrestrial water storage deficit in Mongolia from 2002 to 2017. Water 2019, 11, 1301. [Google Scholar] [CrossRef] [Green Version]
  16. Danandeh Mehr, A.; Sorman, A.U.; Kahya, E.; Hesami Afshar, M. Climate change impacts on meteorological drought using SPI and SPEI: Case study of Ankara, Turkey. Hydrol. Sci. J. 2020, 65, 254–268. [Google Scholar] [CrossRef]
  17. Fadhil, A.M. Drought mapping using geoinformation technology for some sites in the Iraqi Kurdistan region. Int. J. Digit. Earth 2011, 4, 239–257. [Google Scholar] [CrossRef]
  18. Gaznayee, H.A.A.; Al-Quraishi, A.M.F. Analysis of agricultural drought’s severity and impacts in Erbil Province, the Iraqi Kurdistan region based on time series NDVI and TCI indices for 1998 through 2017. J. Adv. Res. Dyn. Control. Syst. 2019, 11, 287–297. [Google Scholar] [CrossRef]
  19. Hashim, B.M.; Abd Alraheem, E.; Jaber, N.A.; Jamei, M.; Tangang, F. Assessment of Future Meteorological Drought Under Representative Concentration Pathways (RCP8.5) Scenario: Case Study of Iraq. Knowl.-Based Eng. Sci. 2022, 3, 64–82. [Google Scholar]
  20. Almoussawi, Z.A.; Wafqan, H.M.; Mahdi, S.R.; Dhahim, A.; Ahmed, O.N.; Abdulhasan, M.M.; Freeh, K.B. The Effect of Adoption of Technology, Technology Diffusion, Human Capital, Formation of Capital and Labor Force in the Production of Agriculture Products in Iraq. AgBioForum 2022, 24, 144–152. [Google Scholar]
  21. Topcu, E.; Seckin, N. Drought Analysis of the Seyhan Basin by Using Standardized Precipitation Index SPI and L-moments. J. Agri. Sci. 2016, 22, 196–215. [Google Scholar]
  22. Sayari, N.; Bannayan, M.; Alizadeh, A.; Farid, A. Using drought indices to assess climate change impacts on drought conditions in the northeast of Iran (case study: Kashafrood basin). Meteorol. Appl. 2013, 20, 115–127. [Google Scholar] [CrossRef]
  23. Mahmoud, M.A. Impact of climate change on the agricultural sector in Egypt. Conv. Water Resour. Agric. Egypt 2017, 74, 213–227. [Google Scholar]
  24. Femia, F.; Werrell, C. Syria: Climate change, drought and social unrest. Cent. Clim. Secur. 2012, 29, 2–5. [Google Scholar]
  25. Dinç, N.; Aydinșakir, K.; Ișık, M.; Büyüktaș, D. Drought analysis of Antalya province by standardized precipitation index (SPI). Derim 2016, 33, 279–298. [Google Scholar]
  26. Yıldız, O. Spatiotemporal analysis of historical droughts in the Central Anatolia, Turkey. Gazi Univ. J. Sci. 2014, 27, 1177–1184. [Google Scholar]
  27. Gümüş, V.; Algin, H.M. Meteorological and hydrological drought analysis of the Seyhan−Ceyhan River Basins, Turkey. Meteorol. Appl. 2017, 24, 62–73. [Google Scholar] [CrossRef]
  28. Al-Quraishi, A.M.F.; Gaznayee, H.A.; Crespi, M. Drought trend analysis in a semi-arid area of Iraq based on Normalized Difference Vegetation Index, Normalized Difference Water Index and Standardized Precipitation Index. J. Arid Land 2021, 13, 413–430. [Google Scholar] [CrossRef]
  29. Hazaymeh, K.; Hassan, Q.K. A remote sensing-based agricultural drought indicator and its implementation over a semi-arid region, Jordan. J. Arid Land 2017, 9, 319–330. [Google Scholar] [CrossRef] [Green Version]
  30. Venkatesh, N.; Suresh, P.; Gopinath, M.; Naik, M.R. Design of Environmental Monitoring System in Farm House Based on Zigbee. Int. J. Commun. Comput. Technol. 2021, 10, 1–4. [Google Scholar] [CrossRef]
  31. Nguyen, H.C.; Thi, B.T.V.; Ngo, Q.H. Automatic Monitoring System for Hydroponic Farming: IoT-Based Design and Development. Asian J. Agric. Rural Dev. 2022, 12, 210–219. [Google Scholar] [CrossRef]
  32. Al-Quraishi, A.M.F.; Negm, A.M. Environmental Remote Sensing and GIS in Iraq; Springer: Cham, Switzerland, 2019. [Google Scholar]
  33. Almamalachy, Y.S.; Al-Quraishi, A.M.F.; Moradkhani, H. Agricultural drought monitoring over Iraq utilizing MODIS products. In Environmental Remote Sensing and GIS in Iraq; Springer: Cham, Switzerland, 2020; pp. 253–278. [Google Scholar]
  34. AL-Timimi, Y.K.; George, L.E.; AL-Jiboori, M.H. Drought risk assessment in Iraq using remote sensing and GIS techniques. Iraqi J. Sci. 2012, 53, 1078–1082. [Google Scholar]
  35. Suliman, A.H.A.; Awchi, T.A.; Al-Mola, M.; Shahid, S. Evaluation of remotely sensed precipitation sources for drought assessment in Semi-Arid Iraq. Atmos. Res. 2020, 242, 105007. [Google Scholar] [CrossRef]
  36. Hussein, S.O.; Kovács, F.; Tobak, Z. Spatiotemporal assessment of vegetation indices and land cover for Erbil city and its surrounding using MODIS imageries. J. Environ. Geogr. 2017, 10, 31–39. [Google Scholar] [CrossRef] [Green Version]
  37. Rasul, A.; Balzter, H.; Smith, C. Spatial variation of the daytime Surface Urban Cool Island during the dry season in Erbil, Iraqi Kurdistan, from Landsat 8. Urban Clim. 2015, 14, 176–186. [Google Scholar] [CrossRef] [Green Version]
  38. Forti, L.; Pezzotta, A.; Zebari, M.; Zerboni, A. Geomorphology of the Central Kurdistan Region of Iraq: Landscapes of the Erbil Plain between the Great Zab and Little Zab Rivers. J. Maps 2023, 1–12. [Google Scholar] [CrossRef]
  39. AppEEARS Team. Application for Extracting and Exploring Analysis Ready Samples (AppEEARS). Ver. 3.14; NASA EOSDIS Land Processes Distributed Active Archive Center (LP DAAC), USGS/Earth Resources Observation and Science (EROS) Center: Sioux Falls, SD, USA., 2022. Available online: https://appeears.earthdatacloud.nasa.gov (accessed on 27 October 2022).
  40. Didan, K. MODIS/Terra Vegetation Indices Monthly L3 Global 1km SIN Grid V061. NASA EOSDIS Land Processes DAAC. 2021. Available online: https://doi.org/10.5067/MODIS/MOD13A3.061 (accessed on 27 October 2022).
  41. Pettorelli, N. The Normalized Difference Vegetation Index; Oxford University Press: Oxford, UK, 2013. [Google Scholar]
  42. Maldonado-Enríquez, D.; Ortega-Rubio, A.; Breceda-Solís Cámara, A.M.; Díaz-Castro, S.C.; Sosa-Ramírez, J.; Martínez-Rincón, R.O. Trend and variability of NDVI of the main vegetation types in the Cape Region of Baja California Sur. Rev. Mex. De Biodivers. 2020, 91, e913213. [Google Scholar] [CrossRef]
  43. Jiang, W.; Yuan, L.; Wang, W.; Cao, R.; Zhang, Y.; Shen, W. Spatio-temporal analysis of vegetation variation in the Yellow River Basin. Ecol. Indic. 2015, 51, 117–126. [Google Scholar] [CrossRef]
  44. Peng, J.; Dadson, S.; Hirpa, F.; Dyer, E.; Lees, T.; Miralles, D.G.; Funk, C. A pan-African high-resolution drought index dataset. Earth Syst. Sci. Data 2020, 12, 753–769. [Google Scholar] [CrossRef] [Green Version]
  45. Pyarali, K.; Peng, J.; Disse, M.; Tuo, Y. Development and application of high resolution SPEI drought dataset for Central Asia. Sci. Data 2022, 9, 172. [Google Scholar] [CrossRef]
  46. Danandeh Mehr, A.; Tur, R.; Çalışkan, C.; Tas, E. A novel fuzzy random forest model for meteorological drought classification and prediction in ungauged catchments. Pure Appl. Geophys. 2020, 177, 5993–6006. [Google Scholar] [CrossRef]
  47. Tsakiris, G.; Pangalou, D.; Vangelis, H. Regional drought assessment based on the reconnaissance drought index (RDI). Water Resour. Manag. 2007, 21, 821e833. [Google Scholar] [CrossRef]
Figure 1. (a) Location of the study area in Iraq. (b) Relief image of the study area and the distribution of global SPEI points (green circles) within and around Erbil Province. The map also shows associated MODIS-NDVI grid cells over the province. (c) Districts of Erbil governorate.
Sustainability 15 06687 g001
Figure 2. The methodology flowchart adopted in the present study.
Sustainability 15 06687 g002
Figure 3. SPEI variation across Erbil in the period January 2000 to August 2022 at the representative grid points (a) SPEI-1; (b) SPEI-3. A hash sign (#) denotes a grid point.
Sustainability 15 06687 g003
Figure 4. Correlation matrix (5% critical value (two-tailed) = 0.1190 for n = 272): (a) SPEI-1; (b) SPEI-3.
Sustainability 15 06687 g004
Figure 5. Box plots of SPEI time series across Erbil during the period January 2000 to August 2022 at the representative grid points (#) (a) SPEI-1; (b) SPEI-3. A plus sign denotes mean SPEI value at each point.
Sustainability 15 06687 g005
Figure 6. Spatial variation in the most extreme wet and dry events across Erbil during the period January 2000 to August 2022: (a) the most extreme drought events based on SPEI-1; (b) the biggest extreme wet events based on SPEI-1; (c) the most extreme drought events based on SPEI-3; and (d) the biggest extreme wet events regarding SPEI-3.3.2. Spatiotemporal variation in the NDVI.
Sustainability 15 06687 g006aSustainability 15 06687 g006b
Figure 7. NDVI variation across Erbil in the period February 2000 to August 2022 at the representative grid points. A hash sign (#) denotes a grid point.
Sustainability 15 06687 g007
Figure 8. (a) Correlation matrix and (b) box plots of the NDVI time series across Erbil during the period February 2000 to August 2022 at the representative grid points.
Sustainability 15 06687 g008
Figure 9. (a) NDVI and (b) CV of the NDVI time series across Erbil during the period February 2000 to August 2022.
Sustainability 15 06687 g009
Figure 10. Spatial distribution of the Pearson coefficient between the NDVI and (a) SPEI-1 and (b) SPEI-3 time series across Erbil during the period February 2000 to August 2022.
Sustainability 15 06687 g010
Table 1. Statistical features of the SPEI and NDVI series of the grid points located in Erbil Province.
IndexGrid PointLongitudeLatitudeMinimumMaximumMean
SPEI-1743.7535.75−2.55322.11980.3278
12 36.25−2.56422.51000.0284
1344.25 −2.68832.23420.0394
18 36.75−2.68832.23420.0394
1944.75 −2.584763.0652−0.3841
2344.2537.25−2.59872.3334−0.1192
SPEI-3743.7535.75−2.13152.100080.367463
12 36.25−3.034642.191090.006825
1344.25 −2.361872.449190.002513
18 36.75−2.361872.449190.002513
1944.75 −2.75033.20759−0.38800
2344.2537.25−2.984582.48341−0.14909
NDVI743.7535.750.08580.47310.169493
12 36.250.09950.68200.208935
1344.25 0.14190.59770.252704
18 36.750.19630.64230.361581
1944.75 −0.05370.59670.295135
2344.2537.25−0.06170.70760.363180
Table 2. Classifications of wet and dry conditions using SPEI.
ClassificationThreshold Values 1
Extremely wet (EW)SPEI ≥ 1.83
Severely wet (SW)1.42 < SPEI < 1.83
Moderately wet (MW)1.00 < SPEI ≤ 1.42
Near-normal−1.0 < SPEI ≤ 1.0
Moderate drought (MD)−1.42 < SPEI ≤ −1.0
Severe drought (SD)−1.82 < SPEI ≤ −1.42
Extreme drought (ED)SPEI ≤ −1.82
1 Details on calculation of the given values are available in [16].
Table 3. NDVI value variations according to surface coverage [41].
Surface CoverageNDVI Range
Very healthy vegetation0.66–1.0
Moderate healthy vegetation0.33–0.66
Sparse vegetation (Unhealthy)0.0–0.33
No vegetation (dead vegetation)−1.0–0.0
Table 4. Numbers and total duration of drought events observed at representative points in the period 2000–2022.
PointSPEI-1SPEI-3
MDSDEDMDSDED
710 (12) 16 (7)2 (1)9 (12)3 (3)2 (5)
1221 (25)7 (7)5 (7)17 (29)6 (7)4 (8)
1323 (26)8 (8)6 (6)15 (21)10 (12)4 (11)
1823 (26)8 (8)6 (6)15 (21)10 (12)4 (11)
1941 (44)21 (21)20 (25)16 (25)21 (41)12 (21)
2330 (34)10 (11)9 (13)23 (27)12 (14)6 (13)
1 The values given in parenthesis denote total duration of each specific drought in month. For example, 10 (12) means that 10 events occurred with total duration of 12 months.
Disclaimer/Publisher’s Note: The statements, opinions and data contained in all publications are solely those of the individual author(s) and contributor(s) and not of MDPI and/or the editor(s). MDPI and/or the editor(s) disclaim responsibility for any injury to people or property resulting from any ideas, methods, instructions or products referred to in the content.

