Abstract
In recent years, China has been at the forefront of the world in the development of new energy vehicles (NEVs). However, national financial subsidies for NEVs will be withdrawn at an accelerated pace with the marketization process. Regional policies have become key to compensating for this withdrawal; these policies can renew the development of NEVs. Therefore, this paper explores the endogenous power of NEVs in blooming from the urban level in China. We used the multiple linear regression method to examine the influence of market and policy and found that the most effective way to promote sales growth of NEVs is to combine both factors. In terms of the market, higher diversity and coverage will make regional competition fair and reasonable. In terms of policy, road priority policy is the main factor to promote sales growth, especially in the cities with license restrictions. Although the regional financial subsidy has declined, its role in increasing sales still exists. Fee relief has the weakest impact on sales and there is still much room for improvement. The findings of this paper provide a foundation for regional governments to develop better decision making strategies for promoting NEVs.
1. Introduction
Climate warming and environmental pollution are challenges facing the world; the use of fossil fuels is one of the major causes of this environmental degradation [1]. As a vehicle that uses fossil fuels, the environmental impact of automobiles has raised concerns [2]. To reduce the impact of vehicle exhaust emissions, various economies have developed corresponding vehicle emission targets. For example, the European Union, the United States, China, and Japan have, respectively, formulated fuel consumption standard and carbon dioxide emission target for automobiles [3]. As a substitute for traditional fuel vehicles, NEVs can effectively reduce the scale of chemical waste gas in vehicle exhaust emissions [4]. Therefore, this market has developed rapidly in recent years. EU countries promote the development of NEVs through financial incentives; the USA encourages people to choose NEVs for daily transportation; China adopted national support policies to promote the purchase of NEVs; and Japan regards NEVs as the strategic goal of future vehicle development.
According to the “top ten electric vehicle revolution countries” selected by the “Inside EVs Website”, which is based in the United States, China usually tops the list of NEV purchases [5]. The reason why China’s NEVs industry can achieve such success is that the Chinese government has provided numerous effective national and regional policies for NEV promotion [6]. Therefore, the research on the progress of NEVs in China is of great significance to promoting the adoption of NEVs all over the world.
The early stage of conception, the middle stage of prosperity, the stable stage of pressure, and the later stage of outbreak have all occurred in China’s NEV market. According to the timeline analysis, as shown in Figure 1, the conception stage was 2012–2014, the development stage was 2014–2018, the bottleneck stage was 2018–2020, and the explosion stage was 2020–2022. In the conception stage, the government promoted green public transport through urban pilot and implemented national financial subsidies. These measures laid the starting point for the scale industrialization of NEVs and motivated the progress of industrial technology and initial formation of industrial clusters. In the development stage, the government used regions as the means of promoting NEVs; in this stage, China experienced explosive growth of NEVs, though national financial subsidies decreased slightly. At the bottleneck stage, the government began to stimulate NEVs nationwide; however, the national financial subsidies began to decline substantially and the sales volume of NEVs fell for the first time in 2019. Finally, NEVs experienced explosive growth in 2021 due to the support of regional policies and the maturity of the relevant technological revolution.
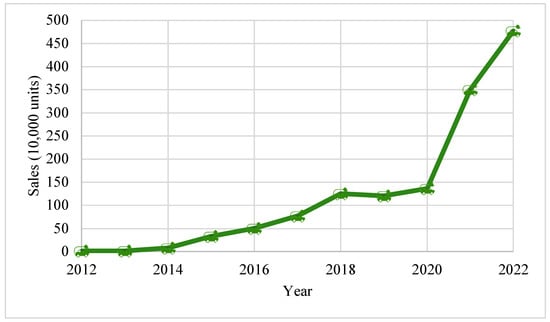
Figure 1.
Development stage of NEVs in China.
The national subsidy policy plays a vital role in promoting the popularity of NEVs [7]. For both Battery Electric vehicles (BEV) and a Plug-in Hybrid Electric vehicles (PHEV), the amount of subsidy is descending year-by-year, though national financial subsidies are favorable for NEVs with high mileage. Furthermore, the Chinese government has announced the complete elimination of national financial subsidies for NEVs in 2022. To cope with the impact of the reduction in financial subsidies on the market, the government introduced the double credit policy in 2017 [8]. However, the double credit policy only allows traditional car companies to gradually transform into NEVs companies; it does not use consumer-side measures to boost NEVs sales [9]. In other words, it is doubtful that consumers will buy into the efforts of the production-end measures. Therefore, discovering how to boost consumers’ confidence in NEVs is fundamental to accelerating the popularity of NEVs.
Once national financial subsidies are removed, it is questionable whether NEVs can maintain their current growth momentum [10]. Therefore, the development of non-subsidized policies and strategies is particularly important at this time. Most of these non-subsidized policies have been enacted regionally, while the diversity of these policies has led to significant differences in the penetration of NEVs in different cities.
As the smallest unit of the NEV market, the city has a natural advantage in policy innovation and market innovation of NEVs [11]. Because of local brand protection, the sales volume of NEVs in various cities is different to less urbanized areas [12]. For example, the subsidy for the same model with a range of 300 is 10,000 yuan in a first-tier city, while the subsidy in a second-tier city is 15,000 yuan. Therefore, this paper focuses on following the decrease in the national subsidy. In this paper, we used an unsupervised textual clustering method to divide the city-level policies into three categories: financial subsidy policy, fee relief policy, and road priority policy. The market forms were segmented into market diversity and market coverage. Additionally, the mathematical statistics approach was used to assess the financial advantages of regional policies. Finally, we recommended some valuable strategies for the sustainable development of NEVs. All in all, the contributions of this article are as follows:
- This article is the first to discuss the impact of regional policies and markets on the sales of NEVs. The research provides readers with a new perspective on understanding how regional factors affect the sales of NEVs;
- By studying the policies and markets in typical Chinese cities, this article further refines the regional policies and market factors that affect the sales of NEVs, summarizing them into three policy factors and two market factors;
- Using multiple regression analysis, this article explores specific strategies for increasing regional sales of NEVs from both policy and market perspectives, providing means for sustainable growth in regional sales of NEVs.
This paper proceeds as follows: Section 2 gives the background of adopting regional policy and urban market analysis; Section 3 describes the experimental data that we collected from authoritative automobile organizations and explains the methodology we employed; Section 4 presents the findings and discusses the results; ans Section 5 summarizes the conclusion and policy implications.
2. Literature Review
Since 2009, the quantity of NEVs sold in China has increased rapidly year-by-year [13]. As the world’s largest market for NEVs, the Chinese government has implemented a slew of stimulus measures to boost consumption. These measures include incentives for NEV manufacturers, subsidies for NEV charging equipment, and controls for traditional vehicles [7]. It has been proven that these measures play a vital role in promoting NEV sales, though most of them are maintained by financial investment institutions [14]. It is not a sign of a healthy industry, especially after some enterprises illegally accessed national subsidies in 2016. The government implemented the double credit policy in 2017 to replace previous financial assistance policies and plans to eliminate national fiscal subsidies in 2023 [15]. However, the double credit policy transforms the government’s financial pressure into technical pressure on enterprises [16]. While it can be effective in encouraging businesses to switch to cleaner production, production does not imply sales. If consumers do not purchase NEVs that companies over-produce, this will eventually result in a lose–lose situation. As a result, promoting NEVs from the consumer side is more beneficial than from the production side. Although the ideal situation would be for NEVs to continue to thrive solely on market dynamics, changing human habits toward traditional fuel vehicles will take time. National and local governments must play an active role as facilitators during this time to change the population’s consumption habits and achieve a complete green revolution. Figure 2 summarized the national incentives policies in the NEV development period in China.
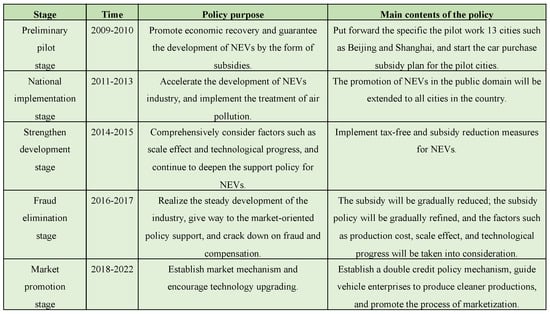
Figure 2.
China’s NEV phased policy.
Though national financial subsidies have been reduced, sales in some cities continue to maintain the momentum of growth [11]. In the Chinese market, high sales volume is concentrated in first-tier cities with prosperous economies because these cities can draft policies to provide consumers with ample privilege and convenience [17]. Annual sales volumes in Beijing, Shanghai, Guangzhou, and Shenzhen have already surpassed 100,000. However, NEVs are scarce in other Chinese cities [18]. This finding suggests that policies in different regions have a significant impact on NEV promotion under the same national subsidies [19]. Some cities with local NEV brands even resist the entry of foreign brands through differentiated local incentive policies, which protect local NEVs enterprises [20]. For example, the Xi’an government has introduced unfair local non-subsidized policies that give preferential treatment to local companies and restrict or disguise the purchase of foreign and certain types of NEVs by consumers. Therefore, there are vast differences in the proportion of BEV and PHEV in various cities [21].
As shown in Figure 3, the proportion of PHEV in Shanghai was significantly higher than that of BEV, while the proportion of BEV in Beijing, Shenzhen, and Guangzhou were higher than that of PHEV. This is because the headquarters of Shanghai Automobile Group (SAIC) is located in Shanghai and PHEVs are the main NEV product of SAIC. To protect local enterprises, the Shanghai municipal government has introduced various PHEV-supporting measures. In general, the urban-level incentive policies manifest considerable potential as the fiscal subsidy declines and play a vital role in boosting the consumption of NEVs in cities [22]. When NEVs do not receive fiscal subsidies, some regions have non-fiscal strategies to supplement them. These include CO2 trading, special rights-of-way, some parking, car use incentives, etc.
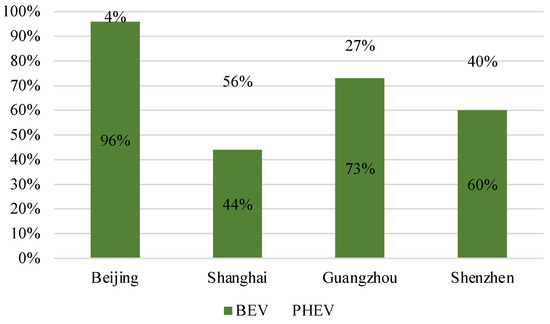
Figure 3.
Proportion of BEV and PHEV sales of major cities in China.
Since the reform and opening-up policy was introduced. China’s market system has developed significantly; however, the government-led administrative system still plays a vital role [23]. On the one hand, domestic NEVs are still in the initial stage. Without the support of national fiscal policies, it would be easy to lose competitive advantage in market competition [24]. On the other hand, the excessive input of national financial subsidies reduced the stability of the NEV market [25]. Therefore, some scholars hold that the government should not cancel the financial subsidy policy for NEVs too early, instead adjusting the subsidy dynamically according to changes in the market [26]. From the perspective of the development process of NEVs, the driving force was gradually changing from government-led to market-led [24]. These two factors affect the regional sales volume from the macro and micro levels, respectively. In the early stage of NEV research, the government should play an active supporting role. After the steady growth of NEVs, the market should determine its share [27]. The orderly development of the NEV is inseparable from the joint effort of the government and the market.
With the reduction in national financial support, non-financial policy support is becoming increasingly important in promoting the development of NEVs. However, the combined effect of regional policy and market on sales volume, in particular, has not been adequately evaluated. As a result of these factors, this paper investigates the novel power derived from market and policy factors at the city level and makes valuable recommendations for the promotion of NEVs.
3. Data and Methods
In this section, we propose a system of indicators to assess regional policies and markets and establish a correspondence between this system and regional NEV sales by constructing a hypothesis-testing framework.
3.1. Data Description
To explore the influencing factors of NEVs sales volume at the regional level and understand the impact of the market and policies of different cities, our team collected data for all the representative cities published in the China Passenger Car Association (CPCA) from 2020 to 2022. CPCA, the most authoritative vehicle information platform in China, publishes a list of the top 10 cities in terms of NEV sales every month. These cities provide successful models for promoting NEVs. Studying their regional policies and local markets is enlightening for all cities; therefore, this data is what we collected as case studies in this paper. The top ten cities for each month of the three years were summed to create the list of cities. A total of 23 cities were selected from the list of cities. For example, Beijing has been on the list every month for 3 years and, although the ranking of the list may vary, the combined count of Beijing’s listings over the 3 years was 36. Wuhan, on the other hand, was only on the list 6 times in 3 years. After the de-duplication of city names, we obtained 23 samples. We hoped that the success of these cities could be replicated and, if other cities could learn from their local policies and market experience, they may be able to achieve corresponding success. The distribution of cities and the times of listing are shown in Figure 4.
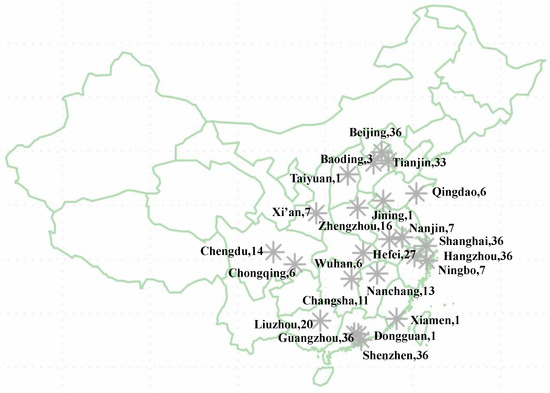
Figure 4.
Top cities for NEV sales from 2020 to 2022.
Following the acquisition of the city list, we obtained sales and brand data for NEVs in various cities from the DaaS-Auto database. Furthermore, all regional NEV policies were obtained from the China Automobile Industry Association (CAAM). The specific subsidy amounts for different policies in various regions were obtained from the Estate database to assess how much benefit could be brought to consumers. Table 1 depicts data visualization.

Table 1.
Data visualization.
3.2. Research Methodology
3.2.1. Evaluating Indicator
We used the market diversity and market coverage indexes to assess the acceptance of NEVs in urban markets. The market diversity index was used to assess the brand diversity of NEVs in a region [28]. The higher the value, the more diverse the range of brands of NEVs in the region and the more equitable the market participation of foreign brands. The following equation was used to calculate market diversity. In Equation (1), n is the total number of NEVs of brand in region , is the region, and is the proportion of sales volume of brand in j region to the total sales volume of the region. For example, may stand for Tesla Model Y, for Shanghai, and for the sales of Model Y in Shanghai.
The market coverage index was applied to evaluate NEVs’ regional market share [29]. The larger the value, the wider the acceptance of NEVs in the region and the higher the chance of breakthrough success in the region for the NEV industry. The market coverage equation is listed below. For Equation (2), is the total number of NEVs in region , while is the total number of vehicles in region .
We used the financial subsidy rate, fee relief rate, and road priority rate to evaluate the effect of city-level policies on the sales volume of NEVs. These three indicators were obtained by clustering regional policies using a K-mean text clustering algorithm. The clustering was based on 136 local policies issued by 23 sample cities over three years. For example, Beijing’s “Beijing NEVs Charging and Switching Development Plan for the 14th Five-Year Plan”, released in August 2022, mentions the construction of 570,000 public charging piles and the provision of a 1000 RMB public charging subsidy to no one. It is the public charging subsidy, which is a financial subsidy after clustering, that was found after condensing this information. The simplicity and intuitiveness of k-mean clustering, which is the most commonly used method for text clustering in unsupervised machine learning, was the reason for its selection [30]. Observing the inflection point of the slope in the elbow graph yielded the best number of clusters [31]. Figure 5 depicts the elbow graph result of clustering.
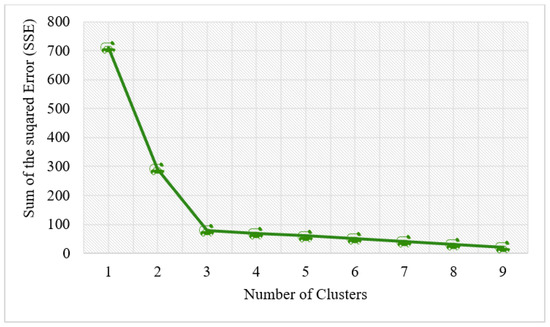
Figure 5.
Elbow graph of regional policy text clustering.
The term “financial subsidy rate” was developed to express how much money the local government uses to provide certain financial subsidies, easing the financial strain on customers. For instance, financial subsidies included all legislation involving monetary benefits (such as buying and charging incentives). Figure 6 depicts the specific financial subsidy rules, while the formula for the financial incentive rate is provided in Equation (3) where is the sum of types of fiscal subsidy policies adopted by city and is the sum of the types of national fiscal subsidy policies.
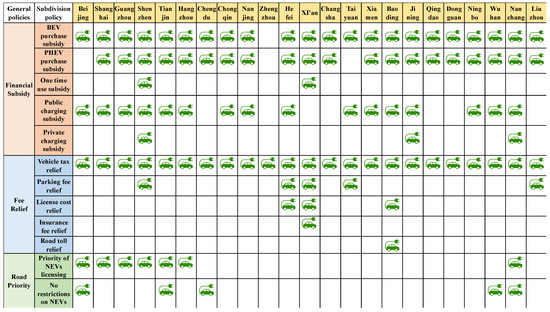
Figure 6.
Urban assistant policies.
In some public charging projects, the expense-free policy for NEVs consumers is referred to as the fee relief rate. For instance, the elimination of parking fees and the decrease in highway charges in Figure 6 depicts the specifics of the fee relief program, together with the formula for the fee stimulus rate. In Equation (4), is the sum of the types of fee relief policies adopted by region and is the sum of the types of national fee relief policies.
To explain the local unrestricted policy for NEVs in terms of road traffic, the road priority rate was introduced. This rate covers road traffic policies, such as prioritizing NEVs when limiting access to fuel-powered vehicles. Figure 6 depicts the actual road priority policies and the formula for calculating the road policies. In Equation (5), is the sum of type of road priority policies adopted by region and is the sum of the types of national road priority policies.
Policies are issued to bring practical benefits to consumers and promote NEV use by consumers. However, different policies in different cities can bring various economic benefits to local consumers. If we desire to evaluate the monetary value of regional policies, we need to make a quantitative analysis. For the above three policies, we obtained the specific amount of financial subsidies and fee relief policies in different regions through the estate. The precise economic benefits brought to consumers by priority policies in different regions were obtained through the area’s license plate auction price. Given that the economic benefits of different NEVs models will differ, we chose the BEV and PHEV models with the highest sales volume in 2022 as our experimental models for analysis. Finally, based on DaaS-Auto’s NEVs sales ranking, we selected the Tesla Model Y for BEV and the BYD Plus DM-I for PHEV.
3.2.2. Conditional Hypothesis
The market openness included diversity and coverage, while the regional incentive policy included the financial subsidy policy, fee relief policy, and road priority policy. Based on the study of regional differences in NEVs in different cities, this paper proposed three hypotheses, as shown in Figure 7:
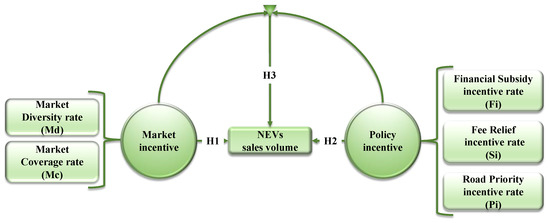
Figure 7.
Conditional hypothesis framework.
H1.
The combination of market openness will affect the sales volume of NEVs.
H2.
The combination of policy incentives will affect the sales volume of NEVs.
H3.
The combination of market openness and policy incentives will jointly affect the sales volume of NEVs.
According to the hypotheses, it was necessary to analyze the influence of the combination of market opening factors and government incentive policies on the sales volume of NEVs. This was a single-factor problem influenced by multiple factors. Therefore, we used the method of multiple linear regression to resolve it. In SPSS, we built model 1 for H1, model 2 for H2, and model 3 for H3. However, the linear regression analysis of SPSS required the use of numerical methods to input the corresponding independent variables and dependent variables. Therefore, we quantified the market and policy factors through the incentive rate in evaluating indicators. It is worth highlighting that the sample size investigated by the three models was 828 articles. It was composed of the performance of 23 cities over 36 months. Table 2 shows that the number of independent variables is 5, and the sample size required for regression analysis is ten times the number of independent variables. Our sample data is sufficient to illustrate the main issues claimed to be discussed in this article.
Table 2.
Factor analysis results.
There were three steps to the operation described in this article. Firstly, we evaluated our models using statistical principles and selected the best model for index analysis. The best model then determined the weight of each evaluation index. Finally, we analyzed and explained the factors that influenced NEV sales volume.
4. Results and Discussion
4.1. Model Evaluation
SPSS statistical software was used to analyze the model’s influencing factors to improve its quality and efficiency. Given that all of our models were based on the effect of combining multiple independent variables on a dependent variable, we used multiple linear regression analysis to evaluate our model and choose the best regression model. Table 3 displays the results of the model evaluation.
Table 3.
Model evaluation results.
In the principle of statistics, multiple R, R square, adjusted R square, standard error, and Significance F are the five most authoritative evaluation standards. Multiple R is used to illustrate the correlation between the independent variable and the dependent variable; its value range was −1 to 1. −1 represented a completely negative correlation, 1 represented a completely positive correlation and 0 represented a completely irrelevant one. R Square was the square of multiple R, which could express the degree of explanation of the independent variable to the dependent variable. The larger the value, the stronger the explanatory ability of the independent variable to the dependent variable and the better the fitting effect. However, when only using R Square to judge the model fitting effect, continuously adding variables could improve the model’s effectiveness. This improvement was false. Therefore, adjusted R square was introduced to judge the model fitting effect. Adjusted R square could punish the added non-significant independent variables. In other words, adding a variable arbitrarily did not necessarily improve the fit of the model. The value range of adjusted R square was 0–1. The closer to 1, the better the fit. The standard error was also used to measure the effect of the degree of the fitting. The smaller the value, the better the degree of the fitting. Significance F referred to the p value, which was the probability of discarding truth. It was used to reflect the size of the possibility of an event. The so-called “abandoned true probability” was the probability that the model was false. In short, the smaller the p value, the better the model.
The validity of the hypothetical model proposed in this paper was confirmed based on the above indicators. Firstly, the significance F of the three models was less than 0.05, indicating that the three models were statistically significant. Secondly, from the perspective of multiple R, all three models showed that the independent variable had a positive correlation with the dependent variable; model 3 had the highest correlation among them. Finally, according to the judgment of Adjusted R Square, we knew that model 3 had the best fitting degree. Therefore, model 3 was selected in the subsequent index analysis.
4.2. Factor Analysis
Model 3 comprehensively considered the influence of market factors and policy factors on the sales volume. The regression coefficient results of Model 3 were shown in Table 2.
In statistical terms, the Coefficient’s evaluation standard was determined by standard error, T-Stat, and p-value. The standard error represented the regression coefficient’s standard deviation, which was a measure of the degree of dispersion of the average value of a set of data. A large standard deviation indicated a significant difference between the majority of values and their average. T-Stat was used to see if the mean of the regression coefficients differed, while p-value was used to determine the significance of the difference. In general, a p-value of 0.05 was considered significant, while a p-value of 0.01 was considered extremely significant. In short, the smaller the p-value, the greater the influence of the coefficient on the outcome.
The was used to determine whether there was multicollinearity among factors because, under such multi-factor conditions, it was easy to have a linear relationship between multiple factors. This multi-collinearity may have caused the sign of the regression coefficient of each factor to be opposite to the actual situation, which should be avoided. In statistics, was severe collinearity, while was moderate collinearity. indicated that the model did not have multicollinearity and the model was well constructed. Judging from the value of , the of all factors was less than 5, which meant that there was no linear relationship between these factors. Our model accurately and effectively explained the impact of various factors on sales volume. In addition, beta is usually regarded as a standardized coefficient. Through the analysis of the beta value, we knew that the market diversity and market coverage had a significant impact on the sales of NEVs.
According to the Theory of Market Diversity, a region’s NEV market will be more equitable if its brands are diverse. As a result of the enthusiasm and faith that all producers and sellers have in the market’s atmosphere of fair competition, they will devote a vast amount of labor and material resources to growing the NEVs market, helping it develop healthily. In terms of market penetration, customers are more likely to encounter NEV cars in their daily lives when the proportion of NEVs is larger. This value promotion is performed inadvertently. In other words, if customers are exposed to more NEVs, they will better understand them and be more likely to buy them.
In terms of policy, the most important factor affecting the sales volume of NEVs was Pi rather than Fi. This means that the licensing priority policy was the main driving force for the growth of NEVs with the reduction in financial subsidies. High sales are concentrated in first-tier cities, such as Beijing, Shanghai, Guangzhou, and Shenzhen. These cities have imposed strict license restrictions to alleviate the traffic congestion and environmental pollution problems caused by the explosive growth of fuel-powered cars. As a representative of cleaner production, NEVs enjoy privilege policies for licensing and unlimited travel in these regions. In other words, the license restriction policy has boosted sales in key regions, thereby increasing the overall sales of China’s NEVs market. Secondly, the effect of Fi on sales was ranked second, indicating that the impact of fiscal subsidies on sales volume still exists and plays a positive role. However, the support that the government provides will eventually disappear as the size of subsidies decreases. It also shows the decrease in sales volume caused by the reduction in subsidies can indeed be compensated by other non-financial means. Although financial subsidies can stimulate consumers’ willingness to buy NEVs, monetary subsidies are not the only solution. Finally, Si has the weakest effect on sales, illustrating that the effect of the fee relief policy on boosting NEVs consumption has not yet appeared. All cities have implemented purchase tax reduction policies. However, parking fee reductions, insurance fee reductions, and other measures have only been adopted by a few cities. It showed that the scale of the fee relief policy was not comprehensive enough and its actual effect has not been fully exerted.
4.3. Benefit Analysis
Consumer purchase decisions are extremely important and are directly influenced by economic efficiency as it relates to the evaluation of NEV policies. The primary factor influencing a consumer’s decision making is the customer-perceived profit, which is the amount of revenue that the customer experiences during the transaction or consumption [32]. Figure 8 and Figure 9 display the outcomes of the benefit analysis.
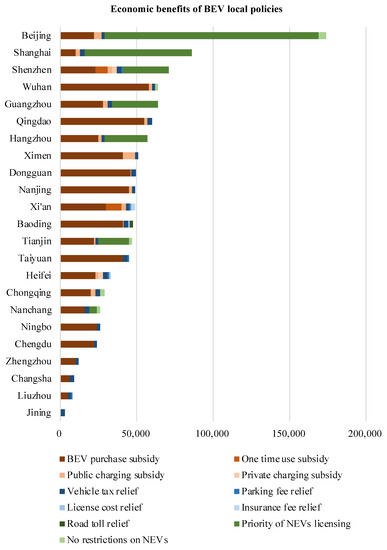
Figure 8.
Economic benefit evaluation of BEV regional policies.
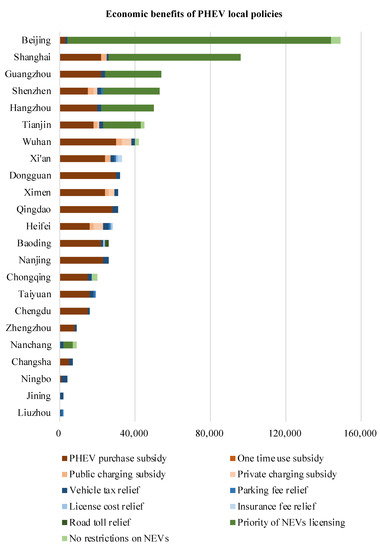
Figure 9.
Economic benefit evaluation of PHEV regional policies.
Whether it is a BEV or a PHEV, the licensing priority policy can bring significant economic benefits, particularly in cities where fuel vehicles are restricted but NEVs are not, such as Beijing, Shanghai, Shenzhen, Guangzhou, Hangzhou, and Tianjin, and the licensing priority policy was the primary policy to accelerate the consumption of NEVs. For example, in 2022, the auction price of a Beijing license plate could reach 160,000 yuan, nearly matching the price of the representative vehicle. Because various cities’ fee relief policies were not fully promoted, their economic benefits were the lowest of the three policies. Furthermore, financial subsidies can provide actual economic benefits to consumers, with the scale being much larger than fee reduction and road priority. Although national subsidies are gradually declining, regional finance subsidies can still provide significant benefits to consumers.
From the comparison of BEVs and PHEVs, the benefits for BEVs were higher than for PHEVs. Although PHEVs are more practical due to the problems of battery technology and supporting facilities of BEVs, BEVs are more popular with consumers. This was because the fuel of BEV is completely electric energy, which is cleaner than the gasoline mixed engine of PHEV. BEV also consumes less than a dime per kilometer and keeps zero emissions during operation. Therefore, regional governments prefer BEVs to be a higher proportion of NEVs.
5. Conclusions and Policy Implications
5.1. Research Conclusion
This paper discussed the driving force behind NEV purchases at the city level, especially once national subsidies are suspended. Through the study of 23 cities in China, we found that the markets and policies of different cities have a significant impact on NEV sales. Therefore, we proposed a logical analysis framework that combined both factors. The framework placed regional policies into three main categories by adopting text clustering. Subsequently, the advantages and disadvantages of the three hypothesis models were evaluated by using the multiple regression analysis methods of hypothesis testing; the best model was selected for index analysis to determine the NEVs sales impact of factors. Finally, the economic benefits of regional policies for consumers were determined based on the evaluation of the benefit analysis. The results of text clustering indicated that all regional policies can be divided into financial subsidy policies, fee relief policies, and road priority policies. The regression analysis results demonstrated that the market and policy play an important role in promoting the growth of NEVs, while both increases have had a significant impact on sales volume.
In sum, as the first attempt to discuss the impact of regional policies and markets on the sales of new energy vehicles, this article fills a gap in previous research in this specific field. Based on the conclusions drawn from this article, local governments can effectively boost sales of new energy vehicles in their respective regions. Policy support, as the main body of macro control, must play a leading role in understanding what kinds of policies can be implemented to increase the sale volume of NEVs. At the same time, the market, as the primary source of micro regulation, must ensure fair and orderly market competition. Certain subsidies and policy direction are needed to hasten the development of NEVs in areas where the market for NEVs is still in its infancy. In markets that are rapidly developing, local protection should be avoided to promote market opening and competition awareness. Therefore, NEVs’ quality and service levels will increase and the shift from a policy to market-driven NEV industry will be accomplished.
5.2. Policy Implication and Research Limitation
The outcomes of the regression analysis and the policy economic benefits analysis were cross-checked. This process revealed that, despite the reduction in national financial subsidies, it is still possible to promote the development of regional NEVs through the collaboration of road priority policies and fee relief policies. We should implement the road priority policy in first-tier cities where fossil-fuel vehicles are prohibited and broaden the scope of fee relief and exemption policies in non-first-tier cities. These measures will help to mitigate the impact of the ongoing reduction in national financial subsidies on NEVs’ sales volume.
In conclusion, this article reveals the impact of regional markets and policies on sales via discussion of three hypotheses. However, the research presented in this article has some limitations. For example, we did not discuss the impact of using NEVs on the development of the power grid system, even though the electricity demand from individuals choosing NEVs is significant for the sustainable development of the power grid system [33,34]. In the future, we can investigate into how individuals choose between NEVs and conventionally powered vehicles and how this choice affects the sustainability of the grid system. In addition, it would be advantageous to derive additional implications for vehicle designers, such as what distinguishes NEVs and whether design can provide an added value to customers in the context of reduced subsidies.
Author Contributions
Conceptualization, L.S. and Z.F.; methodology, Z.F.; validation, L.S. and Z.F.; formal analysis, L.S. and J.Z.; investigation, J.Z.; resources, W.G.; data curation, Z.F.; writing—original draft preparation, Z.F.; writing—review and editing, L.S., Z.F., W.G. and J.S.; visualization, L.S.; funding acquisition, L.S. All authors have read and agreed to the published version of the manuscript.
Funding
This research was funded by Tianjin Research Innovation Project for Postgraduate Students, grant number 2022KJ042.
Institutional Review Board Statement
Not applicable.
Informed Consent Statement
Not applicable.
Data Availability Statement
The data is unavailable due to privacy.
Acknowledgments
The authors would like to convey their appreciation and gratitude to the anonymous reviewers. Their remarks and suggestions were extremely insightful and enabled us to improve the quality of the manuscript.
Conflicts of Interest
The authors declare no conflict of interest.
References
- Zandalinas, S.I.; Fritschi, F.B.; Mittler, R. Global Warming, Climate Change, and Environmental Pollution: Recipe for a Multifactorial Stress Combination Disaster. Trends Plant Sci. 2021, 26, 588–599. [Google Scholar] [CrossRef] [PubMed]
- Shancita, I.; Masjuki, H.H.; Kalam, M.A.; Fattah, I.R.; Rashed, M.M.; Rashedul, H.K. A Review on Idling Reduction Strategies to Improve Fuel Economy and Reduce Exhaust Emissions of Transport Vehicles. Energy Convers. Manag. 2014, 88, 794–807. [Google Scholar] [CrossRef]
- Anderson, J.; Rode, D.; Zhai, H.; Fischbeck, P. On the Road to Paris: The Shifting Landscape of CO2 Reduction; ACS Publications: Washington, DC, USA, 2019; ISBN 0013-936X. [Google Scholar]
- Sun, S.; Wang, W. Analysis on the Market Evolution of New Energy Vehicle Based on Population Competition Model. Transp. Res. Part D Transp. Environ. 2018, 65, 36–50. [Google Scholar] [CrossRef]
- Inside EVs Website Top 10 Countries In The Global EV Revolution: 2019 Edition. 2019. Available online: https://insideevs.com/news/402528/top-10-global-ev-countries-2019/ (accessed on 23 January 2023).
- Wang, L.; Fu, Z.-L.; Guo, W.; Liang, R.-Y.; Shao, H.-Y. What Influences Sales Market of New Energy Vehicles in China? Empirical Study Based on Survey of Consumers’ Purchase Reasons. Energy Policy 2020, 142, 111484. [Google Scholar] [CrossRef]
- Zhang, L.; Wang, L.; Chai, J. Influence of New Energy Vehicle Subsidy Policy on Emission Reduction of Atmospheric Pollutants: A Case Study of Beijing, China. J. Clean. Prod. 2020, 275, 124069. [Google Scholar] [CrossRef]
- Li, J.; Zhan, J. Policy Changes and Policy Instruments Selection of China’s New Energy Vehicle Industry. China Pop. Res. Environ. 2017, 27, 10. [Google Scholar]
- Li, J.; Ku, Y.; Li, L.; Liu, C.; Deng, X. Optimal Channel Strategy for Obtaining New Energy Vehicle Credits under Dual Credit Policy: Purchase, Self-Produce, or Both? J. Clean. Prod. 2022, 342, 130852. [Google Scholar] [CrossRef]
- Zhao, J.; Zeng, D.; Che, L.; Zhou, T.; Hu, J. Research on the Profit Change of New Energy Vehicle Closed-Loop Supply Chain Members Based on Government Subsidies. Environ. Technol. Innov. 2020, 19, 100937. [Google Scholar] [CrossRef]
- Liu, W.; Yi, H. What Affects the Diffusion of New Energy Vehicles Financial Subsidy Policy? Evidence from Chinese Cities. Int. J. Environ. Res. Public Health 2020, 17, 726. [Google Scholar] [CrossRef]
- Ma, S.-C.; Fan, Y.; Feng, L. An Evaluation of Government Incentives for New Energy Vehicles in China Focusing on Vehicle Purchasing Restrictions. Energy Policy 2017, 110, 609–618. [Google Scholar] [CrossRef]
- Gong, H.; Wang, M.Q.; Wang, H. New Energy Vehicles in China: Policies, Demonstration, and Progress. Mitig. Adapt. Strateg. Glob. Chang. 2013, 18, 207–228. [Google Scholar] [CrossRef]
- Xiong, Y.; Fan, S.; Liu, X. The Difference of Fiscal Subsidy for New Energy Vehicles and R&D Investment Intensity of the Manufacturers: An Analysis Based on the Heterogeneity of the Manufacturer’s Strategic Decision. SCI SCI MANGE S 2018, 39, 72–83. [Google Scholar]
- Website of Ministry of Finance Notice on the Financial Subsidy Policy for the Promotion and Application of New Energy Vehicles in 2022. 2022. Available online: http://www.gov.cn/zhengce/zhengceku/2021-12/31/content_5665857.htm (accessed on 23 January 2023).
- Li, J.; Ku, Y.; Liu, C.; Zhou, Y. Dual Credit Policy: Promoting New Energy Vehicles with Battery Recycling in a Competitive Environment? J. Clean. Prod. 2020, 243, 118456. [Google Scholar] [CrossRef]
- Ou, S.; Hao, X.; Lin, Z.; Wang, H.; Bouchard, J.; He, X.; Przesmitzki, S.; Wu, Z.; Zheng, J.; Lv, R. Light-Duty Plug-in Electric Vehicles in China: An Overview on the Market and Its Comparisons to the United States. Renew. Sustain. Energy Rev. 2019, 112, 747–761. [Google Scholar] [CrossRef]
- Huang, Y.; Qian, L. Consumer Preferences for Electric Vehicles in Lower Tier Cities of China: Evidences from South Jiangsu Region. Transp. Res. Part D Transp. Environ. 2018, 63, 482–497. [Google Scholar] [CrossRef]
- Li, F.; Ou, R.; Xiao, X.; Zhou, K.; Xie, W.; Ma, D.; Liu, K.; Song, Z. Regional Comparison of Electric Vehicle Adoption and Emission Reduction Effects in China. Resour. Conserv. Recycl. 2019, 149, 714–726. [Google Scholar] [CrossRef]
- Jin, T.; Jiang, Y.; Liu, X. Evolutionary Game Analysis of the Impact of Dynamic Dual Credit Policy on New Energy Vehicles after Subsidy Cancellation. Appl. Math. Comput. 2023, 440, 127677. [Google Scholar] [CrossRef]
- Zeng, D.; Dong, Y.; Cao, H.; Li, Y.; Wang, J.; Li, Z.; Hauschild, M.Z. Are the Electric Vehicles More Sustainable than the Conventional Ones? Influences of the Assumptions and Modeling Approaches in the Case of Typical Cars in China. Resour. Conserv. Recycl. 2021, 167, 105210. [Google Scholar] [CrossRef]
- Lauer, J.; Liefner, I. State-led Innovation at the City Level: Policy Measures to Promote New Energy Vehicles in Shenzhen, China. Geogr. Rev. 2019, 109, 436–456. [Google Scholar] [CrossRef]
- Zhu, X. Mandate versus Championship: Vertical Government Intervention and Diffusion of Innovation in Public Services in Authoritarian China. Public Manag. Rev. 2014, 16, 117–139. [Google Scholar] [CrossRef]
- Yang, D.; Qiu, L.; Yan, J.; Chen, Z.; Jiang, M. The Government Regulation and Market Behavior of the New Energy Automotive Industry. J. Clean. Prod. 2019, 210, 1281–1288. [Google Scholar] [CrossRef]
- Chen, X.; Wu, T.; Zheng, R.; Guo, X. How Vehicle Market Is Segmented and Influenced by Subsidy Policy: A Theoretical Study. Transp. Res. Part A Policy Pract. 2018, 118, 776–782. [Google Scholar] [CrossRef]
- Nie, Q.; Zhang, L.; Tong, Z.; Hubacek, K. Strategies for Applying Carbon Trading to the New Energy Vehicle Market in China: An Improved Evolutionary Game Analysis for the Bus Industry. Energy 2022, 259, 124904. [Google Scholar] [CrossRef]
- Zhang, H.; Cai, G. Subsidy Strategy on New-Energy Vehicle Based on Incomplete Information: A Case in China. Phys. A Stat. Mech. Its Appl. 2020, 541, 123370. [Google Scholar] [CrossRef]
- Kim, Y.J.; Wilson, C. Analysing Future Change in the EU’s Energy Innovation System. Energy Strategy Rev. 2019, 24, 279–299. [Google Scholar] [CrossRef]
- Anand, A.; Agarwal, M.; Bansal, G.; Garmabaki, A.H.S. Studying Product Diffusion Based on Market Coverage. J. Mark. Anal. 2016, 4, 135–146. [Google Scholar] [CrossRef]
- Kim, H.; Kim, H.K.; Cho, S. Improving Spherical K-Means for Document Clustering: Fast Initialization, Sparse Centroid Projection, and Efficient Cluster Labeling. Expert Syst. Appl. 2020, 150, 113288. [Google Scholar] [CrossRef]
- AbuBaker, M. Data Mining Applications in Understanding Electricity Consumers’ Behavior: A Case Study of Tulkarm District, Palestine. Energies 2019, 12, 4287. [Google Scholar] [CrossRef]
- Frederiks, E.R.; Stenner, K.; Hobman, E.V. Household Energy Use: Applying Behavioural Economics to Understand Consumer Decision-Making and Behaviour. Renew. Sustain. Energy Rev. 2015, 41, 1385–1394. [Google Scholar] [CrossRef]
- Jahangir, H.; Gougheri, S.S.; Vatandoust, B.; Golkar, M.A.; Golkar, M.A.; Ahmadian, A.; Hajizadeh, A. A Novel Cross-Case Electric Vehicle Demand Modeling Based on 3D Convolutional Generative Adversarial Networks. IEEE Trans. Power Syst. 2021, 37, 1173–1183. [Google Scholar] [CrossRef]
- Jahangir, H.; Gougheri, S.S.; Vatandoust, B.; Golkar, M.A.; Ahmadian, A.; Hajizadeh, A. Plug-in Electric Vehicle Behavior Modeling in Energy Market: A Novel Deep Learning-Based Approach with Clustering Technique. IEEE Trans. Smart Grid 2020, 11, 4738–4748. [Google Scholar] [CrossRef]


Disclaimer/Publisher’s Note: The statements, opinions and data contained in all publications are solely those of the individual author(s) and contributor(s) and not of MDPI and/or the editor(s). MDPI and/or the editor(s) disclaim responsibility for any injury to people or property resulting from any ideas, methods, instructions or products referred to in the content. |
© 2023 by the authors. Licensee MDPI, Basel, Switzerland. This article is an open access article distributed under the terms and conditions of the Creative Commons Attribution (CC BY) license (https://creativecommons.org/licenses/by/4.0/).