Abstract
This study looks at the impact of contingency theory on sustainable innovation in Malaysian manufacturing firms. A quantitative approach was used, with convenience sampling to select participants from a target population of Malaysian manufacturing employees. An online survey distributed via email was used to collect 101 sets of data for the study. PLS-SEM (Partial Least Squares Structural Equation Modeling) was used to analyze the collected data. According to the findings, corporate sustainable support policies and sustainable incentives have a significant positive impact on sustainable innovation in Malaysian manufacturing firms, whereas top management commitment was found to be insignificant. Companies that prioritize sustainable practices through policies and incentives are more likely to promote sustainable innovation, according to the findings. As a result, businesses should prioritize developing these two attributes in order to foster sustainable innovation, thereby improving sustainability practices and contributing to the country’s long-term development goals. Future research should, however, investigate why top management commitment may not be a significant driver of sustainable innovation in Malaysian manufacturing firms.
1. Introduction
For decades, Malaysia’s manufacturing sector has been a significant contributor to the country’s economy. According to [1], the manufacturing sector accounts for roughly one-third of Malaysia’s GDP and employs over 2.5 million people. According to the Department of Statistics Malaysia Official Portal (DOSM), the manufacturing sector’s sales value increased by 16.6% to RM1644.4 billion from January to November 2022, primarily due to electrical, electronics, optical, petroleum, chemical, rubber, plastic products, and transport equipment. Despite fierce competition from neighboring countries, such as Vietnam, the Philippines, Thailand, China, and India, Malaysia continues to attract significant manufacturing investments due to its diverse economy, strong manufacturing foundation, developed infrastructure and connectivity, proactive government policies, and hardworking workforce [2,3].
The consumption pattern of the manufacturing sector has shifted significantly over the last few decades, and the ability of manufacturing firms to adapt to external environments now determines their survival and competitiveness. The rise of Industry 4.0 in Malaysia’s manufacturing industries has resulted in the integration of production machinery with robots and artificial intelligence, modernizing and advancing manufacturing to meet dynamic customer demands and high-quality mass production [1,4]. However, challenges to the adoption of Industry 4.0-related technologies in Malaysia include the need for more technological infrastructure and facilities, a highly skilled workforce, and resources [4].
Because of environmental, economic, and societal concerns, sustainability has become a critical issue in the manufacturing industry. The increase in the amount of waste and emissions discharged into the environment, such as solid waste, effluents, greenhouse gases, and carbon emissions, as well as the depletion of natural resources, are major environmental and economic issues that must be addressed [5]. As a result, the incorporation of sustainability into the manufacturing industry’s innovation management is becoming increasingly linked to competitiveness [6].
The development of new products, processes, services, and technologies that promote the economic prosperity and well-being of stakeholders and institutions while preserving the world’s natural resources and regenerative capacity is what sustainable innovation in the manufacturing entails [7]. It goes beyond eco-innovation by incorporating social goals and improving the systemic and long-term sustainable development cycle [8]. While the terms sustainable innovation and eco-innovation are frequently used interchangeably, they have distinct meanings. Sustainable innovation is concerned with environmental, social, and ethical issues, whereas eco-innovation is concerned primarily with environmental and economic issues [6].
With the world facing many long-term problems, such as climate change, population aging, desertification, water shortages, pollution, and a lack of vital raw materials, the interest in sustainable innovation has significant economic implications [9]. Furthermore, the international economic environment has shifted to a modern multi-polar era with rapidly changing global game rules, and economies such as Brazil, Russia, India, China, and South Korea have mastered cost-driven pricing know-how [10].
Contingency theories dominate seminal studies of organizational behavior, development, efficiency, planning, and management strategy [11]. While the subjects vary greatly, the general proposition is that an organizational outcome is an outcome or a match between two or more variables. Organizational performance, for example, is the result of proper coordination between endogenous organizational variables and exogenous market environment background variables, according to contingency theory. This accepts that any action required at the time is dependent on the situation. Contingency theory is used in this study to link top management commitment, sustainable corporate support policies, and sustainable incentives as exogenous variables to endogenous sustainable innovation.
According to [12], there is literature claiming that top management commitment and corporate sustainable support policies can facilitate sustainable strategies with mixed results [13,14]. However, top management commitment to sustainable development is critical to sustainable innovation. A formal environmental management system (EMS) can have an indirect impact on the path to sustainable development, and senior management’s commitment to developing new products ensures that top executives are involved in and fully embrace innovation activities [15].
There is still a scarcity of research on sustainable incentives for sustainable innovation. However, there is an argument that establishing a system in which employees are rewarded based on their contribution to the management execution process can foster creativity within a business, particularly in terms of product growth. This claim is supported by evidence, and it is believed that sustainable incentives can have a positive impact on sustainable innovation in Malaysia’s manufacturing industry [16].
This study will provide empirical evidence that supports or contradicts previous findings on the effect of contingency theory on long-term innovation in Malaysian manufacturing firms and industries. It seeks to bridge the gap between top management commitment, corporate sustainable support policies, and sustainable incentives for the implementation of sustainable innovation. This research will help manufacturing companies understand the connection between contingency behavior theory, sustainable innovation, and implementation in Malaysian manufacturing.
2. Research Framework
Contingency theory is an organizational theory that proposes that there is no one-size-fits-all approach to company structure, business leadership, or decision-making [17]. Instead, the most effective course of action is determined by the internal and external circumstances. Ref. [12] added that organizational performance is a function of proper coordination between endogenous organizational factors and exogenous business environment contextual variables. As a result, any action that must be taken is dependent on the situation. They also claimed that the value-enhancing effects of sustainable policies are dependent on management’s understanding of current conditions in the company’s overall business environment. This theory contributes to the continuum view by analyzing the impact of various perceived characteristics such as rivals’ sustainable policies, shifts in social attitudes toward sustainable protection, and the diversity of stakeholder perspectives on preserving the natural environment [18]. Furthermore, in order to achieve high performance, organizations adapt their structures to changing contextual factors [19]. Managers must understand the importance of contingency theory and its positive implications at work in order to improve productivity and employee morale. Using contingency theory as a framework, this study explores the interaction of those elements in encouraging entrepreneurial enterprises to implement environmental management [11]. However, only a few studies on environmental management have focused on enterprises with a decentralized structure, in which decision-making is divided into various groups and divisions, each making its own decisions [20]. Because implementing a new business approach, such as environmental management, necessitates a coordinated effort from the entire organization across multiple functional areas, organizations with decentralized structures will be better able to handle external demand and manage the implementation [21].
Top management commitment, corporate sustainable support policies, and sustainable incentives were chosen as antecedents to sustainable innovation in this study. According to [22], top management commitment is a determinant of innovation success and plays an important role in the company’s innovation processes and activities. Corporate sustainable support policies, on the other hand, are associated with the involvement of agencies, employees, processes, and steps to facilitate the organization’s environmental problems [23]. Finally, the effects of the interactive implementation of input tools needed to create an organizational climate centered on management support are long-term incentives [12].
In the manufacturing industry, on the other hand, sustainable innovation is a concept that supports sustainable development. Sustainable innovation is defined as the creation of something new that improves efficiency in the three dimensions of sustainable development, which include social, environmental, and economic aspects [6]. Ref. [24] defined sustainable innovation as a company’s implementation of a new product, process, or practice or a change to an existing product, process, or practice that significantly reduces the impact of the company’s activities on the natural environment. In the manufacturing of goods, sustainable innovation supports environmental preservation trends. In contrast to the widely used concept of sustainable development, several findings established the concept of sustainable innovation. However, there is some acknowledgment of sustainable innovation as it relates to entrepreneurship and new concepts, technologies, products, and services, as well as the adoption of new processes and social systems [6]. Other terms related to the sustainable innovation dimension include sustainability-driven innovation and sustainability-oriented innovation. Nonetheless, the terms sustainable innovation and eco-innovation are used interchangeably, with eco-innovation covering only the environmental and economic aspects and sustainable innovation including ethical and social aspects. Furthermore, sustainability-oriented innovation considers not only environmental and economic factors, but also social dimensions such as social equity and justice. Ref. [6] stated that sustainability-oriented innovation is a step-by-step phenomenon that necessitates three essential characteristics to advance it at the full-scale level: government strategy and activity to address the significant risks associated with radical development, improving new plans of action at the corporate level, and changes in individuals’ components, perspectives, and practices at the individual level. It emphasizes the significance of stakeholder participation, social responsibility, and ethical values in the innovation process. This all-encompassing approach to innovation is consistent with the principles of sustainable development and can result in more sustainable outcomes for organizations and society as a whole.
Last, the contingency theory provides a useful framework for understanding how top management commitment, corporate sustainable support policies, and sustainable incentives can influence the implementation of sustainable innovation in organizations. Firms can create more value for all stakeholders by adopting a sustainability-oriented innovation approach that considers the social, environmental, and economic dimensions of their products and processes. Finally, the successful implementation of sustainable innovation can improve an organization’s competitiveness and long-term viability while also contributing to a more sustainable future for the planet.
Figure 1 shows a conceptual framework and three hypotheses that were proposed. The framework introduces the forces that drive sustainable innovation, and hypotheses (H1–H3) are proposed to address the relationship between independent and dependent variables.
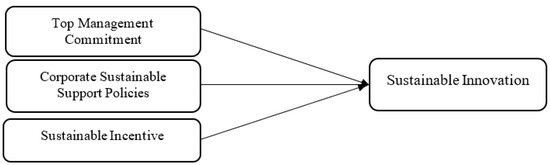
Figure 1.
Research Framework.
Hypothesis 1.
Top management commitment has a positive effect on sustainable innovation.
Hypothesis 2.
Corporate sustainable support policies have a positive effect on sustainable innovation.
Hypothesis 3.
Sustainable incentives have a positive effect on sustainable innovation.
3. Methodology
The current study used a quantitative cross-sectional research design, with employees from Malaysian manufacturing firms serving as the target population. As a sampling frame, the Federal Malaysian Manufacturers (FMM), which represents over 3000 manufacturing and industrial service companies, was used. The FMM database was chosen because it is the largest non-government organization that gathers all sizes of manufacturing companies and it is relevant to the study’s objectives [25]. The sample for this study was chosen using convenience sampling. The sample size was calculated using the G*Power application, as recommended by [26]. The minimum sample size was determined to be 77 with a power of 0.8, an effect size of f2 = 0.15, and the variable with the highest value of 3.
The self-administered questionnaire method was used to collect data via an online survey. The survey was sent out via email, and respondents were required to complete the Google form attached to the email. The survey was sent to 624 targeted samples, and weekly follow-up emails were sent to increase the response rate; however, by week 4, the response rate was 16%.
This study’s measurements were adapted from previously validated scales and items. Ref. [12] was used to adapt the items for top management commitment (5 items), corporate sustainable support policies (5 items), and sustainable incentives (4 items). Ten items from [7] were used to assess sustainable innovation. Appendix A contains a list of measurement items for each construct, while Table 1 contains information about the variables, such as the source adaptation and the number of items.

Table 1.
List of measurements.
To determine the frequency of demographic information, descriptive statistics were computed using SPSS version 22. SmartPLS 3.0 software was used to analyze the data using the PLS-SEM approach [27]. When compared with CB-SEM, the PLS-SEM approach was chosen because it can handle non-normal data adequately, perform exploratory research in developing theory, and estimate models with a high degree of statistical power [26,28,29]. Thus, given the goal of investigating the impact of contingency theory on sustainable innovation among Malaysian manufacturing firms, the PLS-SEM approach was deemed appropriate.
4. Results
Before analyzing the framework’s path and structural model, the research instrument and raw data were examined in SPSS version 22. This procedure, known as data screening and cleaning, results in data exclusion. Data are excluded due to straight lining, missing values, and duplicate responses from the same respondents.
The first step in data cleaning is to test the response pattern to see if there is a straight-line pattern. According to [30], straight lining occurs when respondents provide identical or similar answers to questions using the same response scale. This study addressed straight-lining by utilizing the standard deviation function in Microsoft Excel 2016, =STDEV (items 1–24). The results show that straight lining with zero values detected 15 of 124 responses.
Then, among the collected responses, we looked for the blank responses. Before transferring the data to SPSS, this study treated the blank responses in Microsoft Excel with the formula =COUNTBLANK (item 1 to item 24). Unfortunately, the data contained fifteen blank and eight incomplete responses. The 15 responses with issues of blank responses and straight lining were removed from further analysis, leaving 109 responses to be analyzed. Meanwhile, eight incomplete responses were discovered due to missing value data issues, and missing value treatment was implemented in SPSS using a series mean imputation.
This study used Mardia’s multivariate kurtosis to determine data normality. According to [31], this study used the online software http://webpower.psychstat.org/models/kurtosis/ to determine data normality by examining univariate/multivariate skewness and kurtosis (accessed on the 22 January 2022). According to [32]’s multivariate normality, the cut-off value for skewness is three, and the cut-off value for kurtosis is twenty. The skewness (=4.826, p < 0.01) and kurtosis (=38.11, p < 0.01) values indicate that the data are not normally distributed. Because the data are non-normal, bootstrapping must be performed with a nonparametric analysis tool, Smart PLS.
Descriptive analysis entails looking for patterns in the variables of interest in the data set, such as companies and respondent backgrounds. The company’s background includes the company’s area, ownership, years of company establishment, number of employees, annual revenues, and green certification implemented by the manufacturing company (Table 2).
Table 2.
Company’s Demographic information.
Table 3 shows the results of the respondents’ backgrounds, which include job positions and years of employment at the companies. There are responses from the company’s founder/top management (22.77%), lower management/executive (36.63%), middle management/manager (25.74%), and non-executive (14.85%). The table also shows the years of employment from the responses where there are employment years of up to three years (38.61%), four to six years (12.87%), seven to nine years (7.92%), and more than ten years (40.59%) (Table 3).
Table 3.
Respondents’ Background.
This study used a self-report instrument to collect data, and common method bias (CMB) could be an issue. When all constructs are measured using the same method, common method variance (CMV) is a concern. In this study, a statistical remedy was used to manage common method bias, which is common in behavioral research [42,43]. A full collinearity test was used to assess common method bias when SmartPLS 3 [27] was performed. A variance inflation value (VIF) for any latent variable less than 3.3 was considered free of common method bias, according to [44]. As a result, there is no serious problem with the dataset, as none of the VIF values for all constructs exceeded the 3.3 threshold, as shown in Table 4.
Table 4.
Full Collinearity.
Before moving on to structural model evaluation in PLS-SEM, a researcher must ensure that the required relationships between the latent variable (construct) and its indicator (manifest variable) are met [45]. A model assessment is the first stage of using PLS-SEM. This stage is critical because it focuses on the dependability and validity of indicators representing the constructs of the current study. The model assessment procedure is to evaluate (1) indicator reliability, (2) internal consistency and reliability, (3) convergent validity, and (4) discriminant validity. As a result, the model is evaluated using the PLS-SEM technique via SmartPLS 3.0 software to assess construct reliability and validity to ensure that the measurement model is reliable and valid.
Construct reliability and validity are evaluated by testing the convergent validity, which checks the factor loadings and average variance extracted (AVE). The value of all item loadings in Table 4 exceeded the required value of 0.6 for an exploratory study [46]. Furthermore, as shown in Table 4, the AVE values were greater than 0.5 [47].
Furthermore, the constructs’ reliability was evaluated using Cronbach’s alpha and composite reliability for internal consistency reliability [48,49]. Cronbach’s alpha ranged from 0.892 to 0.938 in Table 3, while composite reliability ranged from 0.925 to 0.947. Cronbach’s alpha and composite reliability for all constructs were higher than the benchmark value of 0.7 [46]. As a result, the measurement model demonstrated adequate construct reliability and validity. Table 5 shows the construct validity of the measurement model for the reliability and validity analysis.
Table 5.
Result of reliability and validity analysis.
The extent to which a construct is empirically distinct from other constructs is referred to as discriminant validity. This study used heterotrait–monotrait (HTMT) ratio correlations to assess discriminant validity, which performs better in partial least squares (PLS) analysis than cross-loadings and the Fornell–Larcker criterion [50]. Table 6 shows that all the values are less than 0.85, indicating that the discriminant validity distinguishes between those pairs of latent variables reliably. According to Franke and Sarstedt [51], a cut-off value of HTMT for conceptually distinct constructs is less than 0.85; conversely, a cut-off value of HTMT for conceptually similar constructs is less than 0.9, indicating that the variables have satisfactory discriminant validity. As a result, Table 6 displays all of the correlation values.
Table 6.
Heterotrait–Monotrait (HTMT) Ratio of Correlations.
This study bootstraps the hypotheses using SmartPLS 3.2.8, a nonparametric analysis tool. Because the data did not have a multivariate normal distribution, the bootstrapping technique was employed. Following the advice of [26], a 5000 bootstrapping re-sampling technique was used to evaluate the structural model based on the path coefficient and statistical significance. This study examined the -values and t-values of the path coefficient of exogenous to endogenous variables, as well as the squared multiple correlations (R2) values of explained variance on the endogenous variable. As a result, Table 7 displays the results of the structural analysis and hypotheses decision, and Table 8 displays the value of R2 and the effect size, f2. Meanwhile, Figure 2 depicts the measurement model and the model’s structural path.
Table 7.
Summary of Hypotheses Testing.
Table 8.
The coefficient determination result (R2) and Effect Size (f2).
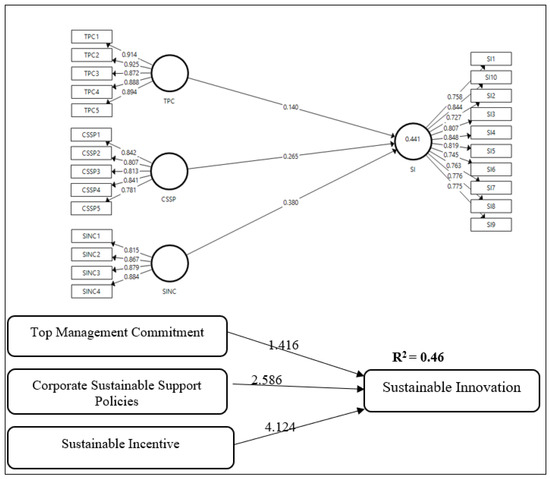
Figure 2.
Structural equation modeling.
This study proposed three hypotheses, and two of them were accepted. As predicted, H1 was found to be insignificant (β = 0.169, t = 1.416), which was rejected because top management commitment has no effect on sustainable innovation. However, H2 was accepted (β = 0.217, t = 2.586), indicating that corporate sustainable support policies positively affect sustainable innovation. Finally, H3 was accepted (β = 0.397, t = 4.124), demonstrating that sustainable incentives positively affect sustainable innovation in a Malaysian manufacturing company.
The predictive accuracy of the model was assessed using the coefficient of determination score (R2), as R2 values explain the amount of variance formed by the independent variables in the dependent variables. According to [52], the value of R2 ranges from 0 to 1, with a higher value indicating a better prediction ability in the structural model. According to Table 8, the R2 value of sustainable innovation implementation is 0.46, which means that top management commitment, corporate sustainable support policies, and sustainable incentives explain 46% of the variance in the level of sustainable innovation among Malaysian manufacturing companies.
5. Discussion and Conclusions
The purpose of this study was to investigate the relationship between top management commitment, corporate sustainable support policies, sustainable incentives, and the adoption of sustainable innovation in Malaysian manufacturing companies. The results of the PLS-SEM analysis of the surveyed data show that two of the three hypotheses are significant. The findings have interesting implications for both practitioners and policymakers in the context of environmental awareness.
Contrary to expectations, this study did not uncover significant decisions in top management commitment to sustainable innovation, as discovered by [53]. The data suggest that top management commitment does not imply a significant high-performance level of sustainable innovation. Ref. [54] discovered that there is a lack of commitment from top management in the Malaysian manufacturing industry, resulting in an insignificant result. This issue has discouraged employees from participating in creative and innovative activities. Ref. [55] added that firm management in Malaysia is weak and will only act if they face significant external pressure and perceive valuable benefits from the practices. More research is needed to investigate the roles of top management involvement in influencing sustainable production practices. Achieving a high-performance effect of sustainable innovation necessitates the participation of all positions in the business, rather than relying solely on top management. As a result, the organizational cultural attributes are critical for building and influencing organizations to have a high impact on implementing sustainable innovation [53].
Second, the findings on corporate sustainable support policies indicate that they have a critical relationship with the adoption of sustainable innovation in Malaysian manufacturing companies. This backs up the findings of [14], which show a positive relationship between organizational support and long-term performance. This positive outcome demonstrates the importance of corporate organizations providing opportunities for employees to try to innovate and improve [54]. Sustainable corporate support policies are critical in ensuring that employees understand their responsibilities and how to carry out essential procedures and routines effectively [23]. This type of policy also promotes an understanding of organizational norms, priorities, and objectives, which are critical for managing individual and collective efficiency [56]. Companies that foster productive activities must have established organizational processes and routines that facilitate the exchange of information among individuals [57].
This result supports [58], which indicates an incentivizing relationship with innovation performance; although, the effect varies according to workers’ level. Incentives and rewards are necessary to motivate workers to carry out critical organizational activities. Such incentive programs are part of the processes of an organization and help employees participate in routines of knowledge sharing, increase the absorption of information, and assess and transmit skills within the company. Companies also use various rewards, including wage raises, promotions, appreciation awards, and position performance evaluations, to reward workers for good environmental practices [58]
In short, this study investigated the relationship between top management commitment, corporate sustainable support policies, sustainable incentives, and sustainable innovation in Malaysian manufacturing companies. The findings suggest that corporate sustainable support policies and sustainable incentives positively influence sustainable innovation, whereas top management commitment has no significant effect. This study provides valuable insights into the factors that can contribute to the successful adoption of sustainable innovation in Malaysian manufacturing firms. It also emphasizes the significance of policymakers and managers in promoting and implementing sustainable practices. This comprehensive approach to innovation aligns with the principles of sustainable development and can result in more sustainable outcomes for organizations and society as a whole. The academic implication of this study is that sustainable corporate support policies and incentives should be prioritized in promoting sustainable innovation within Malaysian manufacturing firms. As a result, more research should be conducted to determine how companies can develop and implement long-term corporate support policies and incentives that encourage long-term innovation. Furthermore, future research should look into why top management commitment may not be a significant driver of long-term innovation in Malaysian manufacturing firms.
This study’s findings suggest that companies in the manufacturing industry should prioritize developing sustainable corporate support policies and sustainable incentives to foster sustainable innovation. Companies will be able to improve their sustainability practices and promote innovative solutions to environmental and social challenges by doing so. This can help Malaysian manufacturing firms improve their reputation and competitiveness while also contributing to the country’s long-term development goals. The current study used a cross-sectional survey, which made it difficult to establish causal relationships between the factors under consideration. Time constraints hampered the analysis of sustainable innovation even further, and the survey design limited opportunities for comprehensive research due to data and time constraints. Furthermore, this study’s focus was limited to Malaysia’s manufacturing industry, and certain sectors may have been underrepresented or not represented at all. Future research may look into other countries such as Japan and Indonesia, as well as specific sectors within Malaysia’s manufacturing industry.
Future research should prioritize increasing the number of respondents in order to achieve more robust results in sustainable innovation. Investigating top management commitment as a potential barrier to implementing sustainable innovation may also shed light on negative outcomes. Furthermore, the current literature lacks standardized measurement scales for assessing sustainable innovation [7], which offers an opportunity for future research to develop standardized measuring instruments in the research area.
Author Contributions
Conceptualization, M.F.Y.; Methodology, M.F.Y. and N.A.I.M.N.; Software, N.A.I.M.N.; Validation, N.A.I.M.N.; Formal analysis, M.F.Y. and N.A.I.M.N.; Investigation, N.A.I.M.N.; Data curation, N.A.I.M.N. and M.A.F.; Writing—original draft, M.F.Y., N.A.I.M.N. and N.M.K.; Writing—review & editing, S.S. and M.A.F.; Supervision, M.F.Y. All authors have read and agreed to the published version of the manuscript.
Funding
This research was funded by the Fundamental Research Grant Scheme (FRGS) No. FRGS/1/2019/SS03/UMP/02/2 administered by the Ministry of Higher Education, Malaysia and the authors acknowledge the UMP Fundamental Research Grant RDU182202-1, from Universiti Malaysia Pahang.
Institutional Review Board Statement
Not applicable.
Informed Consent Statement
Not applicable.
Data Availability Statement
Not applicable.
Acknowledgments
The authors are appreciative of the funding they received from the Fundamental Research Grant Scheme (FRGS) No. FRGS/1/2019/SS03/UMP/02/2 administered by the Ministry of Higher Education, Malaysia and the authors acknowledge the UMP Fundamental Research Grant RDU182202-1, from Universiti Malaysia Pahang.
Conflicts of Interest
The authors declare no conflict of interest.
Appendix A
| Construct. | Item Code | Item |
| Top Management Commitment | TPC1 | Our organization’s top management team is dedicated to long-term preservation. |
| TPC2 | Our top management team fully supports our organization’s long-term initiatives. | |
| TPC3 | Our organization’s top management team drives the organization’s long-term initiatives through its dedication. | |
| TPC4 | Our organization’s top management team is very interested in meeting the needs of environmentally sensitive customers. | |
| TPC5 | Our organization’s senior management team is committed to producing environmentally friendly products. | |
| Corporate sustainable support policies | CSSP1 | We have a specialist person or department in charge of coordinating matters linked to sustainability. |
| CSSP2 | When communicating with people inside and outside the business, we give special attention to sustainable issues. We offer specific sustainable training and education programs to staff. We have a codified sustainable caretaking system. | |
| CSSP3 | We recognize the significance of sustainability challenges in managerial decision-making. | |
| CSSP4 | Formal benefits (such as pay raises and promotions) are available to anyone who continually develops ideas to improve our organization’s long-term performance. | |
| CSSP5 | In our organization, an individual’s long-term success has a direct impact on his or her performance appraisal. | |
| Sustainable incentives | SINC1 | The long-term safety record of our organization influences manager and frontline supervisor performance assessments. |
| SINC2 | People in our organization are acknowledged for being environmentally conscious, regardless of department. | |
| SINC3 | Our company has steadily boosted spending on process improvements that deliver environmental and social benefits over the last five years. | |
| SINC4 | Our company has continually created and commercialized new products that deliver environmental and social benefits throughout the last few years. | |
| Sustainable innovation | SI1 | Our organization has effectively developed manufacturing methods in recent years to reduce the consumption of raw resources. |
| SI2 | Our innovative items use less energy than our competitors’ products while in use. | |
| SI3 | Our production procedures reduce the emission of dangerous substances or waste more effectively than our competitors’. | |
| SI4 | Our organization has actively enhanced its manufacturing process capabilities to reuse and remanufacture components in recent years. | |
| SI5 | Our organization has updated and upgraded its goods in recent years to fulfill new environmental requirements or directives (such as the WEEE Directive, RoHS Directive, and so on). | |
| SI6 | In recent years, our organization has aggressively planned and enhanced our manufacturing process in order to lower rates of accident, occupational diseases, and work-related fatalities. | |
| SI7 | Our product return and recall rates have constantly reduced over the last few years. | |
| SI8 | Consumers perceive our new items to be more ergonomic than those of our competitors. | |
| SI9 | Our organization’s top management team is dedicated to long-term preservation. | |
| SI10 | Our top management team fully supports our organization’s long-term initiatives. |
References
- Tay, S.; Alipal, J.; Lee, T. Industry 4.0: Current practice and challenges in Malaysian manufacturing firms. Technol. Soc. 2021, 67, 101749. [Google Scholar] [CrossRef]
- Tavares-Lehmann, A.; Toledano, P.; Johnson, L.; Sachs, L. Rethinking Investment Incentives; Columbia University Press: New York, NY, USA, 2016. [Google Scholar] [CrossRef]
- MIDA. “Manufacturing Industries”, Malaysian Investment Development Authority (MIDA). Available online: https://www.mida.gov.my/publications/malaysia-investment-in-the-manufacturing-sector/ (accessed on 28 September 2021).
- Ling, Y.M.; Hamid, N.A.A.; Chuan, L.T. Is Malaysia ready for Industry 4.0? Issues and Challenges in Manufacturing Industry. Int. J. Integr. Eng. 2020, 12, 134–150. [Google Scholar] [CrossRef]
- Malaysian Green Technology and Climate Change Corporation (MGTC). Green Practices Guideline for Manufacturing Sector; MGTC: Bangi, Malaysia, 2022. Available online: https://www.myhijau.my/ebook/pdf/mgtc.pdf (accessed on 28 September 2021).
- Kneipp, J.M.; Gomes, C.M.; Bichueti, R.S.; Frizzo, K.; Perlin, A.P. Sustainable innovation practices and their relationship with the performance of industrial companies. Rev. Gestão 2019, 26, 94–111. [Google Scholar] [CrossRef]
- Calik, E.; Bardudeen, F. A Measurement Scale to Evaluate Sustainable Innovation Performance in Manufacturing Organizations. Procedia CIRP 2016, 40, 449–454. [Google Scholar] [CrossRef]
- Cillo, V.; Petruzzelli, A.M.; Ardito, L.; Del Giudice, M. Understanding sustainable innovation: A systematic literature review. Corp. Soc. Responsib. Environ. Manag. 2019, 26, 1012–1025. [Google Scholar] [CrossRef]
- Yusuf, M.F.; Ashari, H.; Razalli, M.R. Environmental Technological Innovation and Its Contribution to Sustainable Development. Int. J. Technol. 2018, 9, 1569. [Google Scholar] [CrossRef]
- Boons, F.; Montalvo, C.; Quist, J.; Wagner, M. Sustainable innovation, business models and economic performance: An overview. J. Clean. Prod. 2013, 45, 1–8. [Google Scholar] [CrossRef]
- Gresov, C.; Drazin, R.; Van De, A.H. Testing the Organizational Assessment Model of Work Unit Design: A Systems Approach. Acad. Manag. Proc. 1985, 1985, 166–170. [Google Scholar] [CrossRef]
- Katsikeas, C.S.; Leonidou, C.N.; Zeriti, A. Eco-friendly product development strategy: Antecedents, outcomes, and contingent effects. J. Acad. Mark. Sci. 2016, 44, 660–684. [Google Scholar] [CrossRef]
- Basana, S.R.; Siagian, H.; Ubud, S.; Tarigan, Z.J.H. The effect of top management commitment on improving operational performance through green purchasing and green production. Uncertain Supply Chain Manag. 2022, 10, 1479–1492. [Google Scholar] [CrossRef]
- Xie, Q.; Islam, M.U.; Su, Y.-Y.; Khan, A.; Hishan, S.S.; Lone, S.A. The investigation of sustainable environmental performance of manufacturing companies: Mediating role of organizational support and moderating role of CSR. Econ. Res.-Ekon. Istraz. 2022, 35, 4128–4148. [Google Scholar] [CrossRef]
- Rashid, N.; Jabar, J.; Yahya, S.; Samer, S. State of the Art of Sustainable Development: An Empirical Evidence from Firm’s Resource and Capabilities of Malaysian Automotive Industry. Procedia-Soc. Behav. Sci. 2015, 195, 463–472. [Google Scholar] [CrossRef]
- Amoruso, F.M.; Sonn, M.-H.; Chu, S.; Schuetze, T. Sustainable Building Legislation and Incentives in Korea: A Case-Study-Based Comparison of Building New and Renovation. Sustainability 2021, 13, 4889. [Google Scholar] [CrossRef]
- Moniz, R.J. History of managerial thought: A brief overview. In Practical and Effective Management of Libraries; Elsevier: Amsterdam, The Netherlands, 2010; pp. 1–18. [Google Scholar] [CrossRef]
- Aragón-Correa, J.A.; Sharma, S. A Contingent Resource-Based View of Proactive Corporate Environmental Strategy. Acad. Manag. Rev. 2003, 28, 71–88. [Google Scholar] [CrossRef]
- Formentini, M.; Taticchi, P. Corporate sustainability approaches and governance mechanisms in sustainable supply chain management. J. Clean. Prod. 2016, 112, 1920–1933. [Google Scholar] [CrossRef]
- Siggelkow, N.; Levinthal, D.A. Temporarily Divide to Conquer: Centralized, Decentralized, and Reintegrated Organizational Approaches to Exploration and Adaptation. Organ. Sci. 2003, 14, 650–669. [Google Scholar] [CrossRef]
- Frondel, M.; Horbach, J.; Rennings, K. What triggers environmental management and innovation? Empirical evidence for Germany. Ecol. Econ. 2008, 66, 153–160. [Google Scholar] [CrossRef]
- Sanzo, M.J.; Álvarez, L.I.; Rey, M.; García, N. Perceptions of top management commitment to innovation and r&d-marketing relationship effectiveness: Do they affect csr? Ann. Public Coop. Econ. 2012, 83, 383–405. [Google Scholar] [CrossRef]
- Barrena-Martínez, J.; López-Fernández, M.; Romero-Fernández, P.M. Towards a configuration of socially responsible human resource management policies and practices: Findings from an academic consensus. Int. J. Hum. Resour. Manag. 2019, 30, 2544–2580. [Google Scholar] [CrossRef]
- Varadarajan, R. Innovating for sustainability: A framework for sustainable innovations and a model of sustainable innovations orientation. J. Acad. Mark. Sci. 2017, 45, 14–36. [Google Scholar] [CrossRef]
- Federation of Malaysian Manufacturers (FMM). About FMM; FMM: Kuala Lumpur, Malaysia, 2023; Available online: https://www.fmm.org.my/About_FMM-@-About_FMM.aspx (accessed on 28 September 2021).
- Hair, J.F.; Risher, J.J.; Sarstedt, M.; Ringle, C.M. When to use and how to report the results of PLS-SEM. Eur. Bus. Rev. 2019, 31, 2–24. [Google Scholar] [CrossRef]
- Ringle, C.M.; Wende, S.; Becker, J.M. SmartPLS 3. Bönningstedt: SmartPLS. 2015. Available online: http://www.smartpls.com (accessed on 22 January 2022).
- Hair, J.F.; Ringle, C.M.; Sarstedt, M. PLS-SEM: Indeed a Silver Bullet. J. Mark. Theory Pract. 2011, 19, 139–152. [Google Scholar] [CrossRef]
- Sarstedt, M.; Ringle, C.M.; Smith, D.; Reams, R.; Hair, J.F. Partial least squares structural equation modeling (PLS-SEM): A useful tool for family business researchers. J. Fam. Bus. Strat. 2014, 5, 105–115. [Google Scholar] [CrossRef]
- Vandenplas, C.; Loosveldt, G.; Beullens, K.; Denies, K. Are Interviewer Effects on Interview Speed Related to Interviewer Effects on Straight-Lining Tendency in the European Social Survey? An Interviewer-Related Analysis. J. Surv. Stat. Methodol. 2018, 6, 516–538. [Google Scholar] [CrossRef]
- Cain, M.K.; Zhang, Z.; Yuan, K.-H. Univariate and multivariate skewness and kurtosis for measuring nonnormality: Prevalence, influence and estimation. Behav. Res. Methods 2017, 49, 1716–1735. [Google Scholar] [CrossRef]
- Kline, B. The Bayesian and frequentist approaches to testing a one-sided hypothesis about a multivariate mean. J. Stat. Plan. Inference 2011, 141, 3131–3141. [Google Scholar] [CrossRef]
- AS9100D; Quality Management Systems—Requirements for Aviation, Space and Defense Organizations. International Aerospace Quality Group: Chantilly, VA, USA, 2016.
- ISO 14001:2015; Environmental Management Systems—Requirements with Guidance for Use. International Organization for Standardization: Geneva, Switzerland, 2015.
- ISO 22000:2018; Food Safety Management Systems—Requirements for Any Organization in the Food Chain. International Organization for Standardization: Geneva, Switzerland, 2018.
- ISO 9001:2015; Quality Management Systems—Requirements. International Organization for Standardization: Geneva, Switzerland, 2015.
- ISO/TS 16949:2009; Quality Management Systems—Particular Requirements for the Application of ISO 9001:2008 for Automotive Production and Relevant Service Part Organizations. International Organization for Standardization: Geneva, Switzerland, 2009.
- IATF 16949:2016; Quality Management Systems—Particular Requirements for the Application of ISO 9001:2015 for Automotive Production and Relevant Service Part Organizations. International Automotive Task Force: Southfield, MI, USA, 2016.
- MyCrest; Reduction and Environmental Sustainability Tool. Construction Industry Development Board Malaysia: Kuala Lumpur, Malaysia, 2020.
- MyHijau; Mark and Directory of Certified Green Products and Services. Malaysian Green Technology and Climate Change Corporation: Bangi, Selangor, Malaysia, 2012.
- OHSAS 18001:2007; Occupational Health and Safety Management Systems—Requirements. British Standards Institution: London, UK, 2007.
- Podsakoff, P.M.; MacKenzie, S.B.; Lee, J.-Y.; Podsakoff, N.P. Common method biases in behavioral research: A critical review of the literature and recommended remedies. J. Appl. Psychol. 2003, 88, 879–903. [Google Scholar] [CrossRef]
- Podsakoff, P.M.; MacKenzie, S.B.; Podsakoff, N.P. Sources of method bias in social science research and recommendations on how to control it. Annu. Rev. Psychol. 2012, 63, 539–569. [Google Scholar] [CrossRef]
- Kock, N. Common Method Bias in PLS-SEM: A full collinearity assessment approach. Int. J. e-Collab. 2015, 11, 1–10. [Google Scholar] [CrossRef]
- Sorooshian, S. Structural equation modeling algorithm and its application in business analytics. In Organizational Productivity and Performance Measurements Using Predictive Modeling and Analytics; IGI Global: Hershey, PA, USA, 2017; pp. 17–39. [Google Scholar] [CrossRef]
- Hair, J.J.F.; Sarstedt, M.; Matthews, L.M.; Ringle, C.M. Identifying and treating unobserved heterogeneity with FIMIX-PLS: Part I—Method. Eur. Bus. Rev. 2016, 28, 63–76. [Google Scholar] [CrossRef]
- Fornell, C.; Larcker, D.F. Evaluating Structural Equation Models with Unobservable Variables and Measurement Error. J. Mark. Res. 1981, 18, 39–50. [Google Scholar] [CrossRef]
- Vinzi, V.E.; Chin, W.W.; Henseler, J.; Wang, H. (Eds.) Handbook of Partial Least Squares; Springer: Berlin/Heidelberg, Germany, 2010. [Google Scholar]
- Fauzi, M.A. Research vs. non-research universities: Knowledge sharing and research engagement among academicians. Asia Pac. Educ. Rev. 2023, 24, 25–39. [Google Scholar] [CrossRef]
- Henseler, J.; Ringle, C.M.; Sarstedt, M. A new criterion for assessing discriminant validity in variance-based structural equation modeling. J. Acad. Mark. Sci. 2015, 43, 115–135. [Google Scholar] [CrossRef]
- Franke, G.; Sarstedt, M. Heuristics versus statistics in discriminant validity testing: A comparison of four procedures. Internet Res. 2019, 29, 430–447. [Google Scholar] [CrossRef]
- Hair, J.J.F., Jr.; Hult, G.T.M.; Ringle, C.M.; Sarstedt, M. A Primer on Partial Least Squares Structural Equation Modeling (PLS-SEM), 2nd ed.; Sage: Thousand Oaks, CA, USA, 2017. [Google Scholar]
- Islam, S.; Tseng, M.-L.; Karia, N. Assessment of corporate culture in sustainability performance using a hierarchical framework and interdependence relations. J. Clean. Prod. 2019, 217, 676–690. [Google Scholar] [CrossRef]
- Abdullah, M.; Zailani, S.; Iranmanesh, M.; Jayaraman, K. Barriers to green innovation initiatives among manufacturers: The Malaysian case. Rev. Manag. Sci. 2016, 10, 683–709. [Google Scholar] [CrossRef]
- Ramakrishnan, P.; Haron, H.; Goh, Y.-N. Factors influencing green purchasing adoption for small and medium enterprises (SMEs) in Malaysia. Int. J. Bus. Soc. 2017, 16, 39–56. [Google Scholar] [CrossRef]
- Pujari, D. Eco-innovation and new product development: Understanding the influences on market performance. Technovation 2006, 26, 76–85. [Google Scholar] [CrossRef]
- Satoh, K.; Nagel, M.; Schneider, V. Organizational roles and network effects on ideational influence in science-policy interface: Climate policy networks in Germany and Japan. Soc. Netw. 2022; in press. [Google Scholar] [CrossRef]
- Gao, X.; Zhang, W. Can Innovation Incentive Policies Improve the Innovation Performance of Knowledge Workers? Evidence from Chinese State-Owned Enterprises. Sustainability 2023, 15, 2424. [Google Scholar] [CrossRef]
Disclaimer/Publisher’s Note: The statements, opinions and data contained in all publications are solely those of the individual author(s) and contributor(s) and not of MDPI and/or the editor(s). MDPI and/or the editor(s) disclaim responsibility for any injury to people or property resulting from any ideas, methods, instructions or products referred to in the content. |
© 2023 by the authors. Licensee MDPI, Basel, Switzerland. This article is an open access article distributed under the terms and conditions of the Creative Commons Attribution (CC BY) license (https://creativecommons.org/licenses/by/4.0/).