
Investigation and Implementation of New Technology Wearable Mobile Laser Scanning (WMLS) in Transition to an Intelligent Geospatial Cadastral Information System


Abstract
:1. Introduction
1.1. Motivation
1.2. Contribution
1.3. Organization
2. Materials and Methods
2.1. Related Work
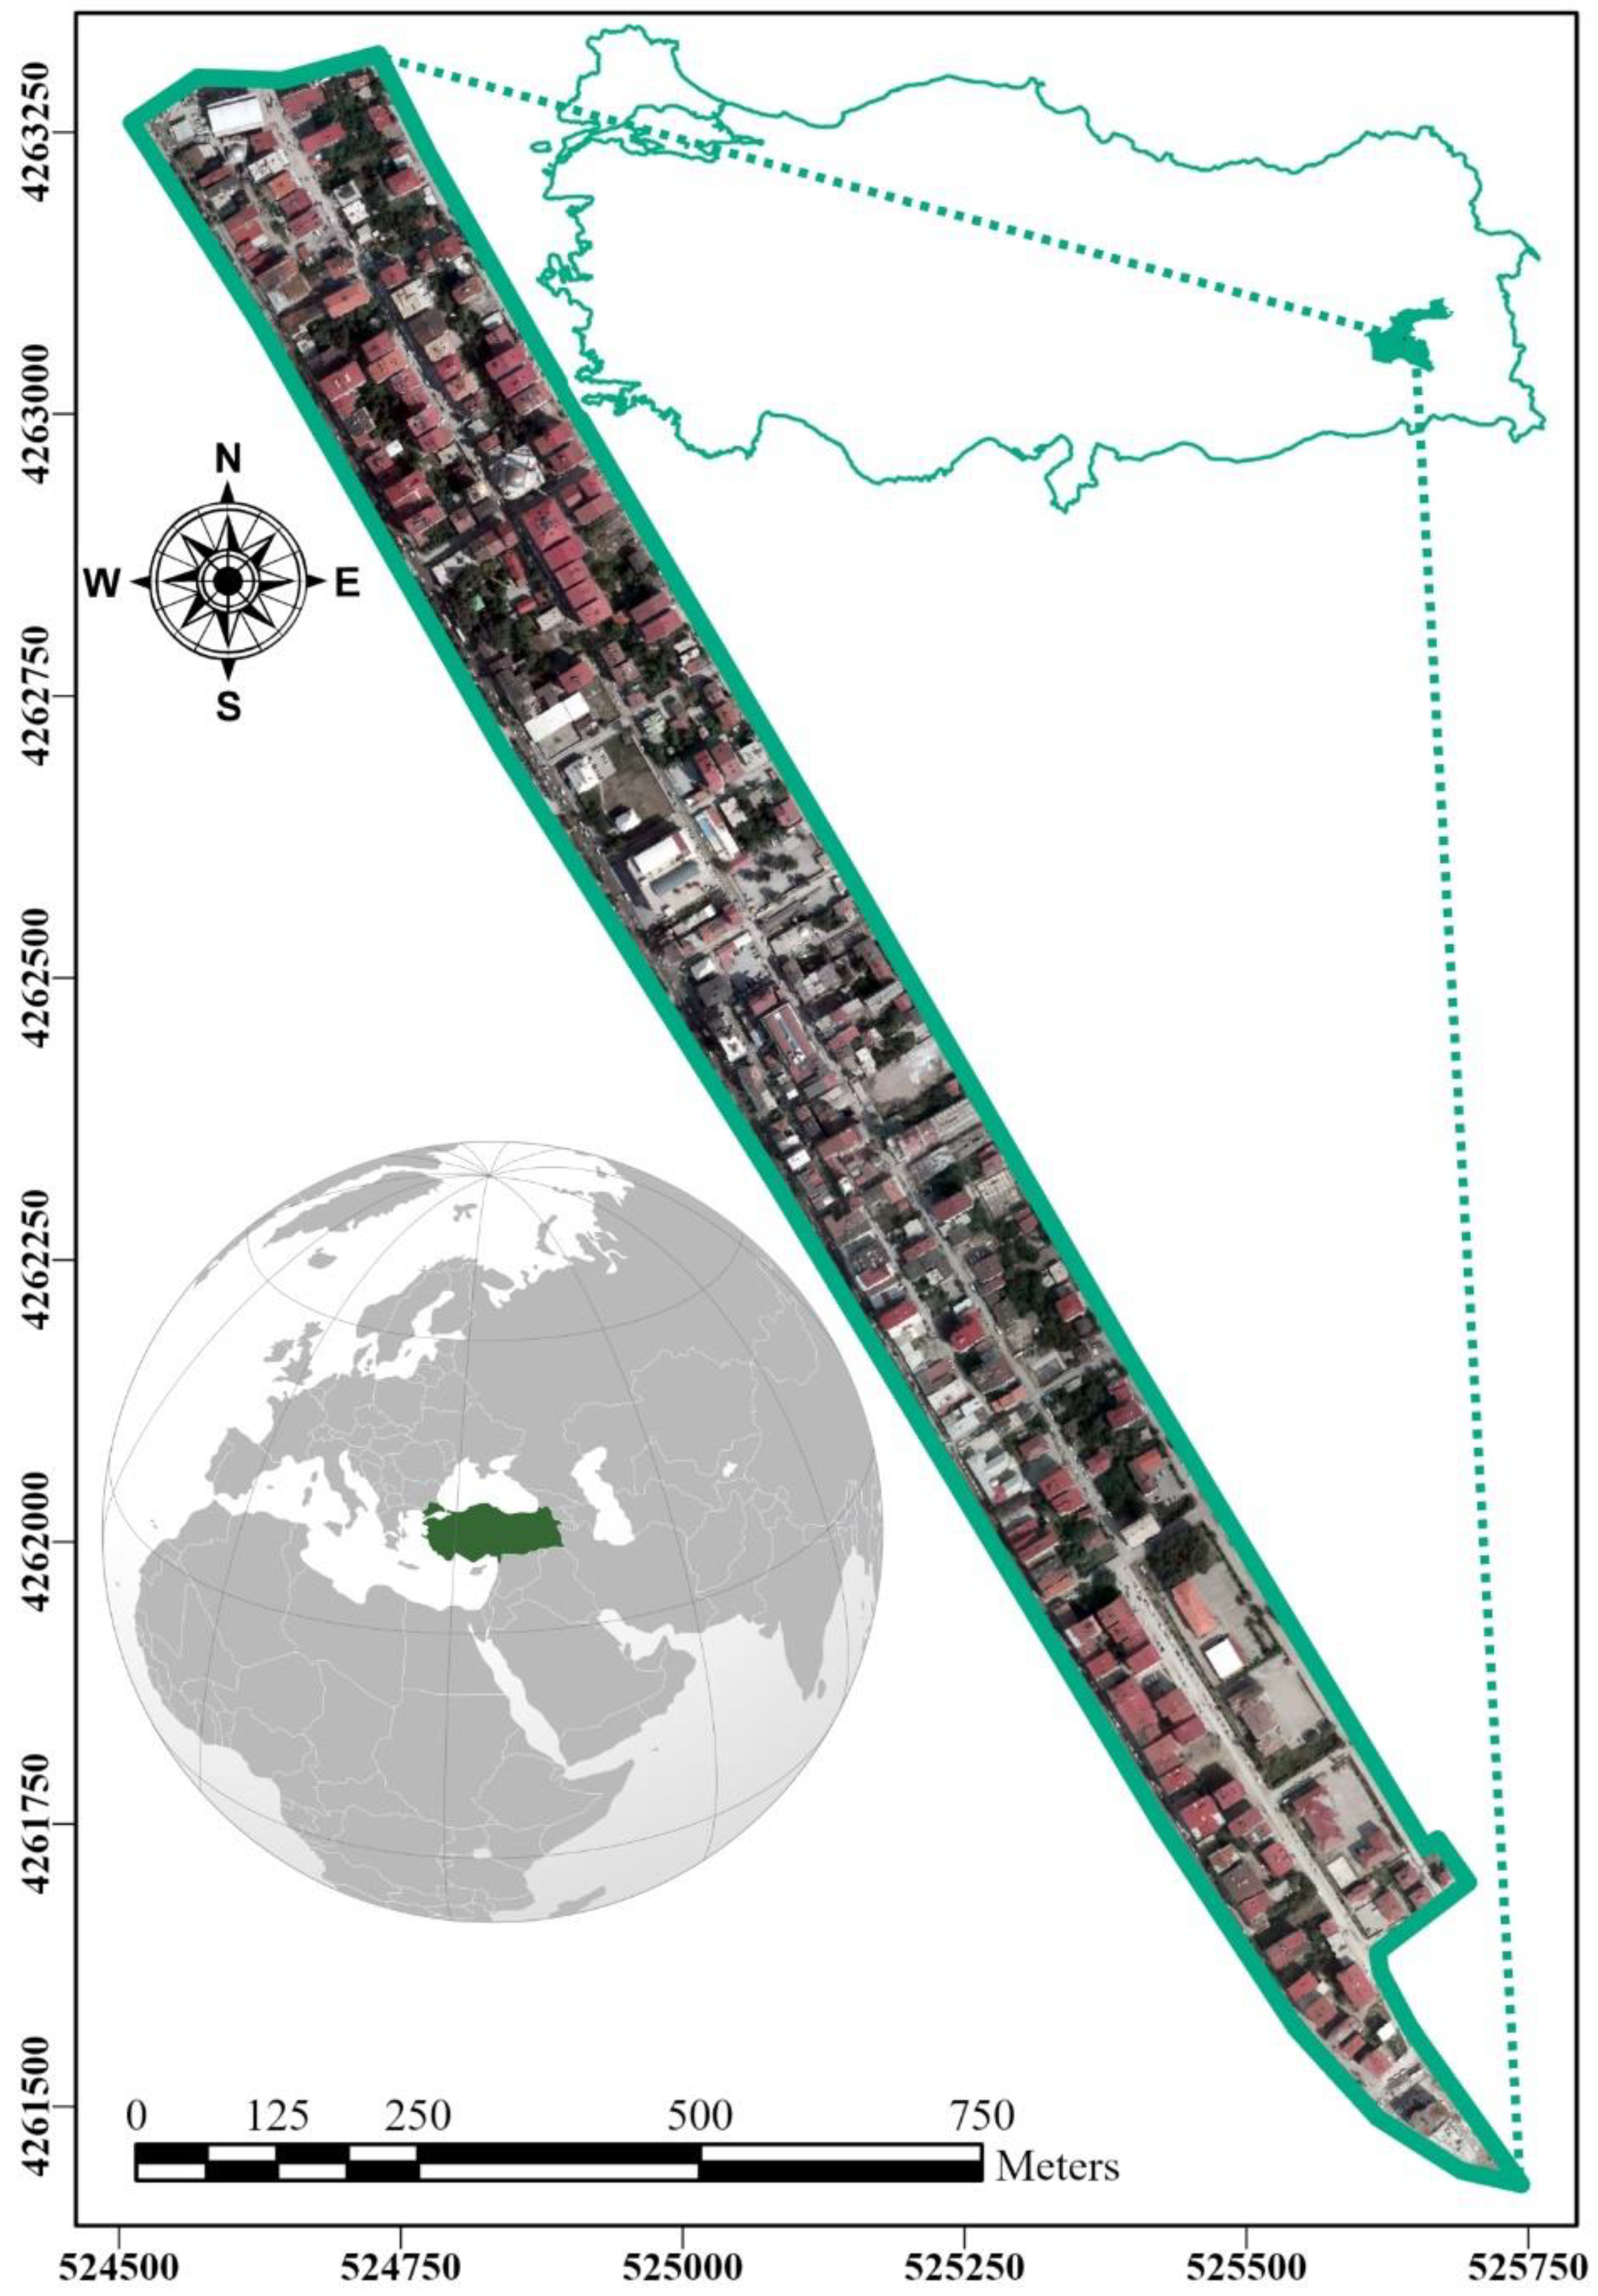
2.2. Study Area
2.3. Simultaneous Localization and Mapping (SLAM) Based WMLS
2.3.1. SLAM Algorithm
2.3.2. WMLS Equipment
2.3.3. WMLS Process Parameters
2.3.4. Referencing
2.4. Data Collection
2.5. Accuracy Analysis
3. Results
3.1. WMLS Data Registration
3.2. Accuracy Analysis WMLS Data
4. Conclusions
Author Contributions
Funding
Data Availability Statement
Conflicts of Interest
References
- Ağca, M. PALS, ICESat/GLAS ve ICESat-2 Lazer Sistemleri ve Kullanım Alanları. Geomatik 2020, 5, 27–35. [Google Scholar] [CrossRef]
- Petronijević Petronijević, M.; Višnjevac, N.; Praščević, N.; Bajat, B. The Extension of IFC For Supporting 3D Cadastre LADM Geometry. ISPRS Int. J. Geo-Inf. 2021, 10, 297. [Google Scholar] [CrossRef]
- Hajji, R.; Yaagoubi, R.; Meliana, I.; Laafou, I.; Gholabzouri, A.E. Development of an Integrated BIM-3D GIS Approach for 3D Cadastre in Morocco. ISPRS Int. J. Geo-Inf. 2021, 10, 351. [Google Scholar] [CrossRef]
- Buuveibaatar, M.; Lee, K.; Lee, W. Implementation of the LADM-Based Cadastral Model for Mongolia towards Transition to a 3D Cadastre. Land 2022, 11, 2014. [Google Scholar] [CrossRef]
- Cabo, C.; Del Pozo, S.; Rodríguez-Gonzálvez, P.; Ordóñez, C.; González-Aguilera, D. Comparing terrestrial laser scanning (TLS) and wearable laser scanning (WLS) for individual tree modeling at plot level. Remote Sens. 2018, 10, 540. [Google Scholar] [CrossRef]
- Canaz Sevgen, S. Airborne lidar data classification in complex urban area using random forest: A case study of Bergama, Turkey. Int. J. Eng. Geosci. 2019, 4, 45–51. [Google Scholar] [CrossRef]
- Çay, T.; Toklu, N.; Esen, Ö. Evaluation of land reform policies in Turkey. Int. J. Eng. Geosci. 2017, 2, 61–67. [Google Scholar] [CrossRef]
- Chang, L.; Xiaoji, N.; Tianyi, L. GNSS/IMU/ODO/LiDAR-SLAM integrated navigation system using IMU/ODO pre-integration. Sensors 2020, 20, 4702. [Google Scholar] [CrossRef]
- Chen, C.; Tang, L.; Hancock, C.M.; Zhang, P. Development of low-cost mobile laser scanning for 3D construction indoor mapping by using inertial measurement unit, ultra-wide band and 2D laser scanner. Eng. Constr. Archit. Manag. 2019, 26, 1367–1386. [Google Scholar] [CrossRef]
- Chen, Y.; Tang, J.; Jiang, C.; Zhu, L.; Lehtomäki, M.; Kaartinen, H.; Kaijaluoto, R.; Wang, Y.; Hyyppä, J.; Hyyppä, H.; et al. The Accuracy Comparison of Three Simultaneous Localization and Mapping (SLAM)-Based Indoor Mapping Technologies. Sensors 2018, 18, 3228. [Google Scholar] [CrossRef] [PubMed]
- Cui, Y.; Li, Q.; Dong, Z. Structural 3D Reconstruction of Indoor Space for 5G Signal Simulation with Mobile Laser Scanning Point Clouds. Remote Sens. 2019, 11, 2262. [Google Scholar] [CrossRef]
- Dawidowicz, A.; Źróbek, R. A methodological evaluation of the Polish cadastral system based on the global cadastral model. Land Use Policy 2018, 73, 59–72. [Google Scholar] [CrossRef]
- Di Filippo, A.; Sánchez-Aparicio, L.J.; Barba, S.; Martín-Jiménez, J.A.; Mora, R.; González Aguilera, D. Use of a Wearable Mobile Laser System in Seamless Indoor 3D Mapping of a Complex Historical Site. Remote Sens. 2018, 10, 1897. [Google Scholar] [CrossRef]
- Di Stefano, F.; Chiappini, S.; Gorreja, A.; Balestra, M.; Pierdicca, R. Mobile 3D scan LiDAR: A literature review. Geomat. Nat. Hazards Risk 2021, 12, 2387–2429. [Google Scholar] [CrossRef]
- Döner, F. Analysis of literature on 3D cadastre. Int. J. Eng. Geosci. 2021, 6, 90–97. [Google Scholar] [CrossRef]
- Wierzbicki, D.; Matuk, O.; Bielecka, E. Polish cadastre modernization with remotely extracted buildings from high-resolution aerial orthoimagery and airborne LiDAR. Remote Sens. 2021, 13, 611. [Google Scholar] [CrossRef]
- Ercan, O.; Toker, K. Assessment of the completion of the forest cadastre considering the legal grounds, collaboration, and the use of technology: The case of Turkey. Int. J. Eng. Geosci. 2022, 7, 49–58. [Google Scholar] [CrossRef]
- ISO 19152. ISO 19152:2012. Available online: https://www.iso.org/standard/51206.html (accessed on 9 March 2023).
- Gollob, C.; Ritter, T.; Nothdurft, A. Forest Inventory with Long Range and High-Speed Personal Laser Scanning (PLS) and Simultaneous Localization and Mapping (SLAM) Technology. Remote Sens. 2020, 12, 1509. [Google Scholar] [CrossRef]
- Groves, P.D. Principles of GNSS, Inertial, and Multisensor Integrated Navigation Systems; Book review; IEEE Aerospace and Electronic Systems Magazine: New York, NY, USA, 2015; Volume 30, pp. 26–27. [Google Scholar]
- Zevenbergen, J. Systems of Land Registration, Aspects and Effects; NCC: Amersfoort, The Netherlands, 2002. [Google Scholar]
- Abdulai, R.T.; Obeng-Odoom, F.; Ochieng, E.; Maliene, V. (Eds.) Real Estate, Construction and Economic Development in Emerging Market Economies; Routledge: Oxfordshire, UK, 2015. [Google Scholar]
- Bruce, J.W. Review of tenure terminology. Tenure Br. 1998, 1, 1–8. [Google Scholar]
- Robillard, W.; Brown, C.; Wilson, D. Brown’s Boundary Control and Legal Principles; Wiley: Hoboken, NJ, USA, 2003. [Google Scholar]
- Luo, X.; Bennett, R.M.; Koeva, M.; Lemmen, C. Investigating Semi-Automated Cadastral Boundaries Extraction from Airborne Laser Scanned Data. Land 2017, 6, 60. [Google Scholar] [CrossRef]
- Zhong, L.; Liu, P.; Wang, L.; Wei, Z.; Guan, H.; Yu, Y. A Combination of Stop-and-Go and Electro-Tricycle Laser Scanning Systems for Rural Cadastral Surveys. ISPRS Int. J. Geo-Inf. 2016, 5, 160. [Google Scholar] [CrossRef]
- He, G.B.; Li, L.L. Research and Application of Lidar Technology in Cadastral Surveying and Mapping. Int. Arch. Photogramm. Remote Sens. Spat. Inf. Sci. XXIV ISPRS Congr. 2020, XLIII-B1-2020, 33–37. [Google Scholar] [CrossRef]
- Šafář, V.; Potůčková, M.; Karas, J.; Tlustý, J.; Štefanová, E.; Jančovič, M.; Cígler Žofková, D. The Use of UAV in Cadastral Mapping of the Czech Republic. ISPRS Int. J. Geo-Inf. 2021, 10, 380. [Google Scholar] [CrossRef]
- Chio, S.-H.; Hou, K.-W. Application of a Hand-Held LiDAR Scanner for the Urban Cadastral Detail Survey in Digitized Cadastral Area of Taiwan Urban City. Remote Sens. 2021, 13, 4981. [Google Scholar] [CrossRef]
- Teicu, N.; Șmuleac, A.; Șmuleac, L. Modern Data Acquisition Techniques and Technologies in the General Cadastre. Res. J. Agric. Sci. 2022, 54, 3. [Google Scholar]
- Guerra, J.; Schmidt, L.; Lourenço, L.B. From Local Agenda 21 to a localized Agenda 2030–the Portuguese and Brazilian cases in perspective. Community Dev. 2019, 50, 352–367. [Google Scholar] [CrossRef]
- Gülçin, D. Kentsel Yeşil Alan Kalitesinin LiDAR Nokta Bulutu Verileri Kullanılarak Haritalanması. Türkiye Lidar Derg. 2020, 2, 23–33. [Google Scholar]
- Gürsoy Sürmeneli, H.; Alkan, M. Towards standardisation of Turkish cadastral system using LADM with 3D cadastre. Surv. Rev. 2021, 53, 543–558. [Google Scholar] [CrossRef]
- Holzbaur, U. Agenda 21 und Agenda 2030. In Nachhaltige Entwicklung; Springer: Wiesbaden, Germany, 2020; pp. 75–110. [Google Scholar]
- Karataş, K.; Gençer, E. Kadastro Haritalarının Sayısallaştırılması Kapsamında Yapılan Çalışmaların Analizi. Geomatik 2021, 6, 124–134. [Google Scholar] [CrossRef]
- Keleş, M.D.; Aydın, C.C. Mobil Lidar Verisi İle Kent Ölçeğinde Cadde Bazlı Envanter Çalışması ve Coğrafi Sistemleri Entegrasyonu-Ankara Örneği. Geomatik 2020, 5, 193–200. [Google Scholar] [CrossRef]
- Kuçak, R.A.; Erol, S.; Alkan, R.M. iPad Pro LiDAR sensörünün profesyonel bir yersel lazer tarayıcı ile karşılaştırmalı performans analizi. Geomatik 2023, 8, 35–41. [Google Scholar] [CrossRef]
- Liu, W.; Li, Z.; Sun, S.; Malekian, R.; Ma, Z.; Li, W. Improving positioning accuracy of the mobile laser scanning in GPS-denied environments: An experimental case study. IEEE Sens. J. 2019, 19, 10753–10763. [Google Scholar] [CrossRef]
- Ma, Y.; Zheng, Y.; Cheng, J.; Zhang, Y.; Han, W. A convolutional neural network method to improve efficiency and visualization in modeling driver’s visual field on roads using MLS data. Transp. Res. Part C Emerg. Technol. 2019, 106, 317–344. [Google Scholar] [CrossRef]
- Mao, Q.; Zhang, L.; Li, Q.; Hu, Q.; Yu, J.; Feng, S.; Ochieng, W.; Gong, H. A Least Squares Collocation Method for Accuracy Improvement of Mobile LiDAR Systems. Remote Sens. 2015, 7, 7402–7424. [Google Scholar] [CrossRef]
- Mbarga, T.C.M.; Ndukwu, R.; Ibochi, A.; Okeke, F. Integration of Geospatial data of UAVs in Cadastral Management System and Regularization of Illegal Occupations in Informal Settlements. Afr. J. Land Policy Geospat. Sci. 2021, 4, 76–94. [Google Scholar]
- Niu, X.; Yu, T.; Tang, J.; Chang, L. An online solution of LiDAR scan matching aided inertial navigation system for indoor mobile mapping. Mob. Inf. Syst. 2017, 2017, 4802159. [Google Scholar] [CrossRef]
- Noszczyk, T.; Hernik, J. Understanding the cadastre in rural areas in Poland after the socio-political transformation. J. Spat. Sci. 2019, 64, 73–95. [Google Scholar] [CrossRef]
- Oruç, M.E.; Baş, G. Kompleks Yapı ve Alanlarda Yersel Lazer Tarama Teknolojisinin Kullanımı. Türkiye Lidar Derg. 2021, 3, 39–47. [Google Scholar] [CrossRef]
- Oruç, M.E.; Öztürk, İ.L. Usability of Terrestrial Laser Technique in Forest Management Planning. Türkiye Lidar Derg. 2021, 3, 17–24. [Google Scholar] [CrossRef]
- Özdemir, S.; Akbulut, Z.; Karslı, F.; Acar, H. Automatic extraction of trees by using multiple return properties of the lidar point cloud. Int. J. Eng. Geosci. 2021, 6, 20–26. [Google Scholar] [CrossRef]
- Popovic, D.; Govedarica, M.; Jovanovic, D.; Radulovic, A.; Simeunovic, V. 3D Visualization of Urban Area Using Lidar Technology and CityGML. IOP Conf. Ser. Earth Environ. Sci. 2017, 95, 042006. [Google Scholar] [CrossRef]
- Sağlam, A.; Akhan Baykan, N. A new color distance measure formulated from the cooperation of the Euclidean and the vector angular differences for lidar point cloud segmentation. Int. J. Eng. Geosci. 2021, 6, 117–124. [Google Scholar] [CrossRef]
- Sanchez Diaz, B.; Mata-zayas, E.E.; Gama-campillo, L.M.; Rincon-ramirez, J.A.; Vidal-Garcia, F.; Rullan-Silva, C.D.; Sanchez-Gutierrez, F. LiDAR modeling to determine the height of shade canopy tree in cocoa agrosystems as available habitat for wildlife. Int. J. Eng. Geosci. 2022, 7, 283–293. [Google Scholar] [CrossRef]
- Şenol, H.I.; Erdogan, S.; Onal, M.; Ulukavak, M.; Memduhoglu, A.; Mutlu, S.; Ernst, F.B.; Yilmaz, M. 3D Modeling of A Bazaar In Ancient Harran City Using Laser Scanning Technique. International Archives of the Photogrammetry. Remote Sens. Spat. Inf. Sci. 2017, 42, 99–101. [Google Scholar]
- Şenol, H.İ.; Memduhoğlu, A.; Ulukavak, M.; Çetin, B.; Polat, N. Lazer Tarayıcı ve İnsansız Hava Aracı Kullanılarak Kızılkoyun Kral Kaya Mezarlarının 3 Boyutlu Belgelenmesi. TMMOB Harita ve Kadastro Mühendisleri Odası. In Proceedings of the 17 Türkiye Harita Bilimsel ve Teknik Kurultayı, Ankara, Turkey, 25–27 April 2019. [Google Scholar]
- Stereva, K. Terrestrial laser scanning–a still neglected reality in the process of creating and maintenance of cadastral maps. In Proceedings of the 20th International Scientific Multidisciplinary Conference on Earth and Planetary Sciences (SGEM2020), Albena, Bulgaria, 16–25 August 2020. [Google Scholar]
- Tang, J.; Wen, J.; Qian, C. A Distributed Indoor Mapping Method Based on Control-Network-Aided SLAM: The urban me and Analysis. Appl. Sci. 2020, 10, 2420. [Google Scholar] [CrossRef]
- Tepeköylü, S. Mobil Lidar Uygulamaları, Veri İşleme Yazılımları ve Modelleri. Geomatik 2016, 1, 1–7. [Google Scholar] [CrossRef]
- Velastegui-Cáceres, J.; Rodríguez-Espinosa, V.M.; Padilla-Almeida, O. Urban cadastral situation in Ecuador: Analysis to determine the degree of proximity of the cadastral systems to the 3D cadastral model. Land 2020, 9, 357. [Google Scholar] [CrossRef]
- Wang, C.; Dai, Y.; Elsheimy, N.; Wen, C.; Retscher, G.; Kang, Z.; Lingua, A. ISPRS Benchmark on Multisensory Indoor Mapping and Positioning. ISPRS Ann. Photogramm. Remote Sens. Spat. Inf. Sci. 2020, 5, 5. [Google Scholar] [CrossRef]
- Williams, R.D.; Lamy, M.L.; Maniatis, G.; Stott, E. Three-dimensional reconstruction of fluvial surface sedimentology and topography using personal mobile laser scanning. Earth Surf. Process. Landf. 2020, 45, 251–261. [Google Scholar] [CrossRef]
- Yaman, A.; Yılmaz, H.M. The effect of object surface colors on terrestrial laser scanners. Int. J. Eng. Geosci. 2017, 2, 68–74. [Google Scholar] [CrossRef]
- Yiğit, A.Y.; Kaya, Y.; Şenol, H.İ. Monitoring the change of Turkey’s tourism city Antalya’s Konyaaltı shoreline with multi-source satellite and meteorological data. Appl. Geomat. 2022, 14, 223–236. [Google Scholar] [CrossRef]
- Yildiz, O.; Erden, Ç. Cadastral updating: The case of Turkey. Surv. Rev. 2021, 53, 335–348. [Google Scholar] [CrossRef]
- Yurdakul, Ö.; Kalaycı, İ. The effect of GLONASS on position accuracy in CORS-TR measurements at different baseline distances. Int. J. Eng. Geosci. 2022, 7, 229–246. [Google Scholar] [CrossRef]
- Zeybek, M. Mobil LiDAR Nokta Bulutlarından Enerji Nakil Hatlarının Doğrusal Olmayan Modellerle Kestirimi. Türkiye Lidar Derg. 2020, 2, 55–63. Available online: https://dergipark.org.tr/tr/pub/melid/issue/58409/825271 (accessed on 18 April 2023).
- Zeybek, M. Indoor Mapping and Positioning Applications of Hand-Held LiDAR Simultaneous Localization and Mapping (SLAM) Systems. Türkiye Lidar Derg. 2021, 3, 7–16. [Google Scholar] [CrossRef]
- Chang, L.; Niu, X.; Liu, T.; Tang, J.; Qian, C. GNSS/INS/LiDAR-SLAM integrated navigation system based on graph optimization. Remote Sens. 2019, 11, 1009. [Google Scholar] [CrossRef]
- Gexcel. Gexcel Heron Lite Color. 2022. Available online: https://gexcel.it/en/ (accessed on 18 April 2023).
- Liu, W.; Zang, Y.; Xiong, Z.; Bian, X.; Wen, C.; Lu, X.; Li, J. 3D building model generation from MLS point cloud and 3D mesh using multi-source data fusion. Int. J. Appl. Earth Obs. Geoinf. 2023, 116, 103171. [Google Scholar] [CrossRef]
- Mohamed, M.; Morsy, S.; El-Shazly, A. Improvement of 3D LiDAR point cloud classification of urban road environment based on random forest classifier. Geocarto Int. 2022, 37, 15604–15626. [Google Scholar] [CrossRef]
- Zováthi, Ö.; Nagy, B.; Benedek, C. Point cloud registration and change detection in urban environment using an onboard Lidar sensor and MLS reference data. Int. J. Appl. Earth Obs. Geoinf. 2022, 110, 102767. [Google Scholar] [CrossRef]
- Kaya, Y.; Yiğit, A.Y.; Ulvi, A.; Yakar, M. Arkeolojik alanların dokümantasyonununda fotogrametrik tekniklerinin doğruluklarının karşılaştırmalı analizi: Konya Yunuslar Örneği. Harit. Derg. 2021, 165, 57–72. [Google Scholar]


| Research Article for Related Work | LiDAR | UAV-Airborne Photogrammetry | Traditional Method GNSS Total Station | ||||
|---|---|---|---|---|---|---|---|
| Car etc. | UAV Airborne | Terrestrial | Wearable Hand-Held Backpack | ||||
| Luo et al., 2017 | [25] | ✓ | |||||
| Zhong et al., 2016 | [26] | ✓ | ✓ | ||||
| He and Li, 2020 | [27] | ✓ | ✓ | ✓ | |||
| Šafář et al., 2021 | [28] | ✓ | ✓ | ✓ | |||
| Chio et al., 2021 | [29] | ✓ | ✓ | ✓ | |||
| Teicu et al., 2022 | [30] | ✓ | ✓ | ✓ | |||
| Technical Characteristic of Gexcel Heron Lite Color | Value |
|---|---|
| Brand and type | Velodyne VLP 16 |
| Measurement range | 0.4–100 m indoor or outdoor |
| Measurement speed | Up to 300,000 points/per second |
| Ranging Accuracy (for measurements of 10–100 m) | ±3 cm |
| Absolute accuracy [1 sigma in cm] | ±3 cm |
| Max survey resolution | ~2 cm |
| Field of view (vertical/horizontal) | 360° V/360° H |
| Laser class | Laser class 1 |
| No | Vx | Vy | Vz | No | Vx | Vy | Vz | No | Vx | Vy | Vz |
|---|---|---|---|---|---|---|---|---|---|---|---|
| 1 | −3.41 | 3.61 | 8.31 | 15 | −4.95 | 5.21 | 7.09 | 29 | −2.84 | 4.66 | −2.20 |
| 2 | 3.88 | −4.62 | −0.88 | 16 | 4.37 | 4.67 | 12.46 | 30 | 3.60 | −7.12 | 2.77 |
| 3 | −5.91 | 2.54 | 7.49 | 17 | −5.53 | −2.37 | 9.08 | 31 | −3.78 | −4.20 | 8.27 |
| 4 | 0.14 | 3.96 | −13.24 | 18 | −0.29 | 8.02 | −7.37 | 32 | 2.94 | 9.96 | 9.82 |
| 5 | 0.32 | 4.64 | 10.23 | 19 | 2.14 | 5.19 | −2.62 | 33 | −0.71 | 0.52 | −6.84 |
| 6 | −3.80 | 2.32 | 12.64 | 20 | 6.82 | −5.35 | 7.24 | 34 | 1.98 | −8.74 | 2.51 |
| 7 | 4.55 | −3.71 | −4.92 | 21 | −8.07 | 3.08 | −0.80 | 35 | 5.48 | 5.47 | −4.45 |
| 8 | 3.01 | 5.33 | 8.40 | 22 | 2.29 | 3.43 | 12.64 | 36 | −2.87 | −2.48 | 4.40 |
| 9 | 1.57 | 4.10 | 2.07 | 23 | 5.37 | −3.67 | −11.70 | 37 | −5.32 | −3.77 | 5.72 |
| 10 | 3.81 | 5.02 | −11.42 | 24 | 4.21 | 4.85 | −10.11 | 38 | 0.98 | 4.27 | 6.03 |
| 11 | −4.55 | −2.84 | 11.48 | 25 | 3.02 | 5.13 | 2.88 | 39 | 7.76 | 7.07 | −6.85 |
| 12 | 0.54 | −2.36 | 1.98 | 26 | 3.40 | −4.62 | 9.45 | 40 | 3.43 | 4.87 | −4.65 |
| 13 | −7.30 | 5.14 | 0.41 | 27 | 0.58 | −3.34 | 1.82 | = 4.1324, 4.9095, 7.7660 | |||
| 14 | 0.03 | 3.42 | −4.67 | 28 | 4.20 | 4.59 | 9.49 | ||||
| No | (cm) | No | (cm) | No | (cm) |
|---|---|---|---|---|---|
| 1 | 1.616 | 11 | 2.988 | 21 | 3.044 |
| 2 | 6.608 | 12 | 4.775 | 22 | 7.498 |
| 3 | 4.376 | 13 | 2.444 | 23 | 4.573 |
| 4 | 1.004 | 14 | 8.209 | 24 | 6.548 |
| 5 | 7.408 | 15 | 3.872 | 25 | 4.611 |
| 6 | 1.349 | 16 | 4.361 | 26 | 7.348 |
| 7 | 0.002 | 17 | 1.047 | 27 | 5.165 |
| 8 | 3.185 | 18 | 4.604 | 28 | 1.450 |
| 9 | 4.292 | 19 | 4.151 | 29 | 7.676 |
| 10 | 6.395 | 20 | 0.754 | 30 | 3.927 |
| 4.7589 cm | |||||
Disclaimer/Publisher’s Note: The statements, opinions and data contained in all publications are solely those of the individual author(s) and contributor(s) and not of MDPI and/or the editor(s). MDPI and/or the editor(s) disclaim responsibility for any injury to people or property resulting from any ideas, methods, instructions or products referred to in the content. |
© 2023 by the authors. Licensee MDPI, Basel, Switzerland. This article is an open access article distributed under the terms and conditions of the Creative Commons Attribution (CC BY) license (https://creativecommons.org/licenses/by/4.0/).
Share and Cite
Yiğit, A.Y.; Hamal, S.N.G.; Yakar, M.; Ulvi, A. Investigation and Implementation of New Technology Wearable Mobile Laser Scanning (WMLS) in Transition to an Intelligent Geospatial Cadastral Information System. Sustainability 2023, 15, 7159. https://doi.org/10.3390/su15097159
Yiğit AY, Hamal SNG, Yakar M, Ulvi A. Investigation and Implementation of New Technology Wearable Mobile Laser Scanning (WMLS) in Transition to an Intelligent Geospatial Cadastral Information System. Sustainability. 2023; 15(9):7159. https://doi.org/10.3390/su15097159
Chicago/Turabian StyleYiğit, Abdurahman Yasin, Seda Nur Gamze Hamal, Murat Yakar, and Ali Ulvi. 2023. "Investigation and Implementation of New Technology Wearable Mobile Laser Scanning (WMLS) in Transition to an Intelligent Geospatial Cadastral Information System" Sustainability 15, no. 9: 7159. https://doi.org/10.3390/su15097159