Abstract
Cyanobacterial blooms threaten the quality and safety of the Chinese mitten crab Eriocheir sinensis. A combination of microalgae and probiotics seems a promising way to prevent and control cyanobacterial blooms in aquaculture ponds. In E. sinensis cultivation, however, a related strategy is still lacking. To assess the potential combined effects of effective microorganisms (EM) and Chlorella vulgaris on regulating cyanobacterial blooms, in this study, we detected the alterations in the physiology of E. sinensis, as well as water quality and microbial compositions of E. sinensis culture ponds with cyanobacterial blooms. As a result, supplementary EM and C. vulgaris had no adverse effects on the growth or digestive or antioxidant ability of E. sinensis but improved the water quality of the pond by reducing total ammonia nitrogen and total nitrogen levels. We found an increase in bacterial diversity and evenness, while a decrease in the diversity of fungal and phytoplankton communities was related to supplementary EM and C. vulgaris. Interestingly, EM coupling C. vulgaris promoted the restoration of the bacterial and fungal community composition in cyanobacterial blooms ponds, particularly the increase of Mychonastes abundance and the decrease of Cyclotella. This study laid the foundation for the prevention and control of potential risks in aquaculture.
1. Introduction
The Chinese mitten crab, Eriocheir sinensis (H. Milne Edwards, 1853), is an endemic economic aquaculture species in China [1]. Owing to the great demand among a growing number of Chinese consumers, it is widely cultured in China except for a few regions such as Tibet autonomous region and Hainan province. In 2021, the annual output of E. sinensis reached 808,274 tons [2]. Nowadays, the quality and safety of E. sinensis are the bottlenecks to hinder the green development of the E. sinensis industry. In the culture of E. sinensis, cyanobacterial blooms are one of the important factors threatening the quality and safety of E. sinensis [3,4].
In E. sinensis culture ponds, cyanobacterial blooms are commonly formed by the following genera, e.g., Microcystis, Cyanobium, Calothrix, Sphaerospermopsis and Cylindrospermopsis [1]. It is well documented that cyanobacterial blooms and their secondary metabolites, cyanobacterial toxins (such as microcystins, anatoxin-a, retinoic acid, microviridins, anabaenopeptins, aeruginosins, microginins, piricyclamides, and cyanopeptolins) can cause a series of problems in aquaculture, such as compromising water quality, altering microbial community assembly, toxic to aquatic animals, and even threatening to human health by bioaccumulation through food chains [5,6,7,8,9,10,11,12].
Cyanobacterial blooms often alter the bacterial community assembly in aquatic ecosystems [12,13]. This is mainly due to the cyanobacterial-heterotrophic bacterial associations [14,15,16]. Specifically, cyanobacterial-heterotrophic bacterial associations play key roles in providing key nutrients (carbon, nitrogen, phosphorous) and limiting micronutrients (iron and vitamin B12) to cyanobacteria [14,16], facilitating cyanobacterial species succession in response to nutrient limitation [15].
In nature, algae live together with bacterial communities, and the interactions of algae-bacteria balance the planktonic microbiome [17,18]. In general, algae-bacteria interactions are facilitated by secreted compounds. Algae exude dissolved organic carbon that is available to bacteria, and in return, the metabolites of bacteria support the growth of algae, such as vitamins and/or recycled nutrients [19,20]. In addition to positive interactions, negative interaction exists between algae and bacteria. e.g., the quorum-sensing of bacteria impacted the cell division and mortality of algae [21].
To meet the needs of quality and safety of aquatic products under the premise of environmental protection, in aquaculture, microalgae-bacteria balance provides a promising way to prevent and control potential risks. Thus, probiotics and beneficial microalgae are favored by farmers for their efficient and harmless [22,23]. However, the microalgae-bacteria strategy for combating and preventing cyanobacterial blooms is still lacking.
In our previous studies, we found the beneficial effects of effective microorganisms (EM) and Chlorella on E. sinensis culture, e.g., improving the water quality, as well as the nutritional composition and flavor quality of E. sinensis [4]. Thus, in the present study, we aimed to lay the foundation for the prevention and control strategies of cyanobacterial blooms in E. sinensis cultivation. We analyzed the water quality and microbial compositions of E. sinensis culture ponds with and without cyanobacterial blooms. Furtherly, we investigated the regulation effect of EM and Chlorella vulgaris on the change of water quality and microbial communities in cyanobacterial blooms ponds.
2. Materials and Methods
2.1. Experimental Design and Management
This experiment was conducted from 19 July to 26 July 2021 in the Yangzhong scientific research base of the Freshwater Fisheries Research Center, Chinese Academy of Fishery Sciences. A total of nine E. sinensis cultural ponds (23 m in length and 73 m in width) were selected in this study. Three normal ponds without supplements were selected as the control group (hereinafter NG), and 6 ponds with cyanobacterial blooms were evenly divided into 2 groups, the supplements group of EM and Chlorella vulgaris (hereinafter CS) and the non-supplement group (hereinafter CN). Hydrophytes, i.e., Elodea nuttallii and Hydrilla varticillata, were planted in each pond, as reported in our previous study [4].
In the CS group, C. vulgaris was used every 2 days with a dose of 22.5 mL/m2 on the 1st, 3rd, and 5th days, respectively. Meanwhile, EM was used every 2 days with a dose of 3.0 mL/m2 on the 2nd, 4th, and 6th days, respectively. EM with a viable bacteria number of 5.0 × 10⁶ CFU/mL was purchased from Jiangsu Hengtai Environmental Protection Technology Development Co., Ltd., Wuxi, China. C. vulgaris was prepared in our laboratory with fresh sterile BG-11 medium, which was cultured in 4500 Lux light, 12-12 h light-dark cycles, and 26 °C constant temperature. High-density algal liquid with a logarithmic growth stage was used for the experiment. The final used C. vulgaris was at a cell density of 5.0 × 10⁷ cells/mL.
During the experiment, crabs were in the intermolt period between the 3rd molting to the 4th molting of the adult crab culture stage and fed with a formula diet at 17:00 once a day. Hydrophytes were managed to ensure reasonable density and space. Dissolved oxygen was controlled above 5.0 mg/L by a micropore oxygenation system. The depth of water in the ponds was about 1.0 m. In the CS group, the cyanobacterial blooms were significantly reduced, with an obvious decrease in emerald green film downwind of the ponds on the 7th day of the experiment. Therefore, we set 7 days as the experimental period.
2.2. Sampling and Water Quality Detection
Sampling was conducted at the beginning (day 0) and end of the experiment (day 7). Microbial samples were collected at 9:00 am, as described in the previous study [1]. Briefly, a total of 20 L of surface water were obtained by water collecting from four corners and mixing with an equivalent volume. Then, 0.5 L of water was filtered with 0.22-µm polycarbonate membranes. Finally, the filter membranes were frozen in liquid nitrogen and stored at −80 °C until DNA extraction.
Simultaneously, the water temperature, pH, and dissolved oxygen (DO) of each pond were measured using HACH HQ30D (Hach Company, Loveland, CO, USA). Water quality parameters, i.e., total nitrogen (TN), total ammonia nitrogen (TAN), nitrate nitrogen (NO3-N), nitrite nitrogen (NO2-N), and total phosphorus (TP), were detected as described in the previous study [1]. The N/P ratio was calculated using total nitrogen divided by total phosphorus.
After 24-h fasting, a total of 18 crabs (6 female crabs from each pond) were sampled from each group every sampling time. After anesthetized on ice, crabs were first measured the wet weights, carapace length and width; then, their hepatopancreas were collected carefully. Those tissues were frozen in liquid nitrogen immediately and stored at −70 °C for further analysis.
2.3. Enzyme Activity and Antioxidant Parameters Assays
To reveal the potential physiological differences of E. sinensis among groups, we detected digestive enzyme activity and antioxidant parameters in the hepatopancreas of E. sinensis. Lipase (A054-2-1) and α-amylase (C016-1-1) in hepatopancreas were detected as described by Dai et al. (2020). Superoxide dismutase (SOD; A001-3), catalase (CAT; A007-1), glutathione peroxidase (GPX; A005) activity and malondialdehyde (MDA; A003-1) were determined as described elsewhere [24]. All used kits were purchased from Nanjing Jiancheng Bioengineering Institute (Nanjing, China). Enzyme activity or antioxidant parameters was calibrated with total protein (TP) concentration.
2.4. DNA Extraction, PCR Amplification, and Sequencing
Total microbial DNA was extracted using the HiPure Soil DNA Kits (Magen, Guangzhou, China) according to the manufacturer’s protocols. The V3-V4 region of the 16S rDNA and the V4 region of the 18S rDNA were amplified by PCR as described in the previous study [1]. Primers of 341F (5′-CCTACGGGNGGCWGCAG-3′) and 806R (5′-GGACTACHVGGGTWTCTAAT-3′) were used for 16S rDNA amplification, while 528F (5′-GCGGTAATTCCAGCTCCAA-3′) and 706R (5′-AATCCRAGAATTTCACCTCT-3′) were used for 18S rDNA amplification. In the present study, 18 procaryotic sequencing libraries and 18 eukaryotic sequencing libraries were constructed. Briefly, amplicons were extracted from 2% agarose gels, purified using the AxyPrep DNA Gel Extraction Kit (Axygen Biosciences, Union City, CA, USA), and quantified using ABI StepOnePlus Real-Time PCR System (Life Technologies, Foster City, CA, USA) as described in our previous study [1]. Purified amplicons were pooled in equimolar and paired-end sequenced (PE250) on an Illumina NovaSeq 6000 system (Illumina Inc., San Diego, CA, USA). The raw reads were deposited into the NCBI Sequence Read Archive (SRA) database (BioSample accessions range from SAMN28097324 to SAMN28097341 under the BioProject PRJNA835239).
2.5. Tags Assembly, Filtering, and Taxonomy Annotation
Bioinformatics analyses were described in our previous study [1]. Briefly, clean reads were obtained by raw reads filtering [25]. The filtering criteria were no adapter sequence, less than 10% of unknown nucleotides, or more than 50% of bases with quality (Q-value) > 20. Then paired-end clean reads were assembled into raw tags [26]. Clean tags were obtained after raw tag filtering under specific filtering conditions [27]. The filtering conditions are as follows: (1) break raw tags from the first low-quality base site where the number of bases in the continuous low-quality value (the default quality threshold is ≤3) reaches the set length (the default length is 3 bp), (2) filter tags whose continuous high-quality base length is less than 75% of the tag length. Then, clean tags of ≥97.0% similarity were clustered into operational taxonomic units (OTUs) using UPARSE [28]. After chimera and singleton tags removal using the UCHIME algorithm [29], the highest abundance effective tag was regarded as the representative sequence for each OTU cluster. The representative OTU sequences were used for taxonomy annotation using the RDP classifier [30] based on SILVA database version 132 [31].
2.6. Community Composition and Differentially Abundant Taxons
The relative abundance of species at each taxonomic level was calculated using the number of annotated effective tags divided by the total number of effective tags in the sample. In the bacterial community, we specifically analyzed the composition of cyanobacterial genera in each group. To show the changes in community composition in each group on the initial and final days, the stacked bar plots were used to visualize the relative abundance of microbes at a given taxonomical level.
The differentially abundant taxon (from phylum to species) between groups was evaluated by linear discriminant analysis effect size (LefSe) [32]. The differentially abundant taxon was considered significant with the absolute value of the linear discriminant analysis (LDA) score >4.0. To clarify the microflora alteration associated with supplementary EM and C. vulgaris, we analyzed the significance of differentially abundant taxon between the CS0 and CS7 groups using Welch’s t-tests. To further explore the changes in ecological function among groups based on microbial community profiles, we analyzed variations in ecological functions and metabolic phenotypes of prokaryotes using FAPROTAX [33] and Bugbase [34], respectively.
2.7. Alpha and Beta Diversity Analysis
The alpha diversity was assessed as described in our previous study [1]. OTU rarefaction curve and rank abundance curves were plotted in the R project ggplot2 package (version 2.2.1). In beta diversity analysis, we conducted principal coordinates analysis (PCoA) and ANOSIM test based on weighted unifrac distances.
2.8. Statistical Analysis
Normality and variance homogeneity of data were tested with Shapiro-Wilk and Levene tests (α = 0.05), respectively. Statistical differences in water quality parameters and alpha diversity indices were assessed using 1-way ANOVA and Duncan’s multi-comparison (or Tamhane multi-comparison in case of the heterogeneity of variances) for normally distributed data, while Kruskal–Wallis tests were used for non-normally distributed data. For those significantly altered microbial taxa in CS groups, we furtherly analyzed the correlation between microbial taxa using Spearman correlation analysis based on the relative abundance in all samples. PcoA and ANOSIM tests of weighted unifrac distances were conducted in the R project Vegan package (version 2.5.3). Spearman correlation analysis was conducted in the R project psych package (version 2.3.3). Data are expressed as means ± standard deviations (SDs) of the respective pond replications, and p values < 0.05 were considered statistically significant.
3. Results
3.1. Water Quality Parameters
During the culture period, the water temperature ranged from 31.6 to 31.9 °C. In all detected E. sinensis rearing ponds, dissolved oxygen reached over 100% air saturation due to photosynthesis activity. Different from other water quality parameters, NO3-N and pH had no significant differences among the groups.
In the NG and CN groups, levels of TAN and TN were consistent or increased during the experiment period. In contrast, levels of TAN and TN in the CS7 group significantly decreased than that in the CS0 group (Table 1). During the experiment period, NO2-N had a low level in all groups that ranged from 0.001 to 0.003 mg⋅L−1 (Table 1). Compared to the initial levels, the 7-day NO2-N level had a decreased trend in the NG and CS groups, while that was increased in the CN groups (Table 1). Unlike the higher level of TP in the NG7 and CN7 groups than their initial levels, the level of TP had no significant difference between the CS0 and CS7 groups (Table 1). The NPR of the NG7 group was slightly lower, albeit non-significant, than that of the NG0 group. Similarly, the NPR of the CS7 group was significantly lower than that of the CS0 group. However, the NPR of the CN7 group was significantly higher than that of the CN0 group (Table 1). Taken together, a supplement of EM and C. vulgaris had an improved effect on the water quality of cyanobacterial bloom ponds.

Table 1.
Descriptive statistics of water quality parameters and their variations across different groups. Values are presented as means ± SD. Statistically significant differences are indicated by different letters (p < 0.05).
3.2. Growth Parameters and Enzyme Activity
Group difference was found neither at day 0 nor at day 7 for all detected growth parameters in E. sinensis (Table S1).
For the digestive enzymes, the CS7 group had slightly higher α-amylase activity (albeit not significant) and significantly higher lipase activity than the CS0 group (Figure 1A,B). At the same time, they had no significant difference between the NG0 and NG7 groups or between the CN0 and CN7 groups. Interestingly, compared to the NG7 group, the CN7 group had significantly lower digestive enzyme activities, but not the CS7 group (Figure 1A,B).
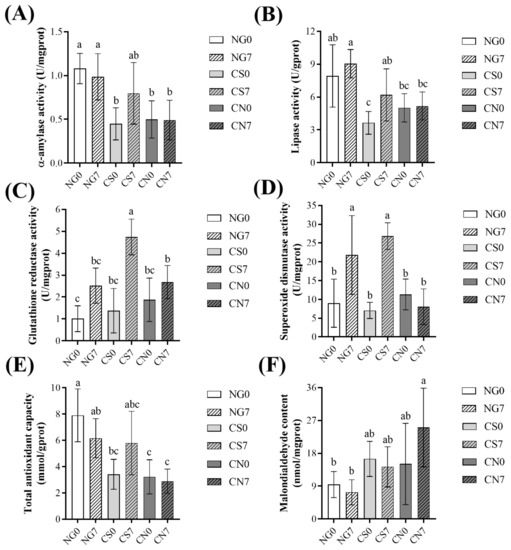
Figure 1.
Variations in digestive enzymes activity and antioxidant parameters in the hepatopancreas of Eriocheir sinensis across groups. (A) α-amylase activity; (B) lipase activity; (C) glutathione reductase activity; (D) superoxide dismutase activity; (E) total antioxidant capacity; (F) malondialdehyde content. Results are shown as mean ± SD (n = 6). Different letters indicate significant differences among groups (p < 0.05).
For the antioxidant parameters, the NG7 group had slightly higher GR activity and significantly higher SOD activity than the NG0 group (Figure 1C,D). Similarly, the CS7 group had significantly higher GR activity and SOD activity than the CS0 group (Figure 1C,D). At the same time, the CN7 group had slightly higher GR activity and similar SOD activity than the CN0 group (Figure 1C,D). The NG7 group had slightly lower T-AOC activity than the NG0 group, and the CS7 group had slightly higher T-AOC activity than the CS0 group, while the CN7 group had similar T-AOC activity to the CS0 group (Figure 1E). Compared to the respective initial groups, the NG7 and CS7 groups had similar MDA content, while the CN7 group had slightly higher MDA content (Figure 1F). Interestingly, the level of T-AOC and MDA in the CS7 group was more similar to the NG7 group than the CN7 group (Figure 1E,F).
3.3. General Analyses of High-Throughput Sequencing
In the 18 procaryotic libraries, raw reads ranged from 105,452 to 136,679, of which 99.80–99.88% were clean reads (Table S2A). While in the 18 eukaryotic libraries, raw reads ranged from 120,136 to 136,857, of which 99.91–99.95% were clean reads (Table S2B).
In the 18 procaryotic libraries, the effective tags ranged from 94,675 to 124,686, the effective ratio ranged from 86.70% to 92.90% (Table S2A), and the obtained OTUs ranged from 619 to 1174 (Table S3A). While in the 18 eukaryotic libraries, the effective tags ranged from 115,825 to 131,743, the effective ratio ranged from 96.15% to 97.54% (Table S2B), and the obtained OTUs ranged from 259 to 561 (Table S3B).
For one given taxonomic classification level, the number of annotated effective tags in procaryotic libraries varied a lot among samples, e.g., ranging from 77,861 to 113,368 at the domain level and 4442–36,559 at the species level, respectively (Table 2A). Similarly, the number of annotated effective tags in eukaryotic libraries varied a lot among samples, e.g., ranging from 64,686 to 123,149 at the domain level and 3748–37,173 at the species level, respectively (Table 2B).
Table 2.
The distribution of annotated tags in different taxonomic classifications.
To illustrate the characteristics of microbial and algal communities in different groups, we classified all annotated taxa into three categories, i.e., bacteria, fungi, and eukaryotic phytoplankton. The rarefaction curve of all samples supported the adequacy of the sampling efforts (Figure S1). The rank abundance curves indicated the optimal richness and evenness of bacteria and fungi in the NG groups, followed by the CN groups, and finally the CS groups (Figure S2A,B). In addition, the NG7 group had an increased richness and evenness of eukaryotic phytoplankton compared to the NG0 group, while the CS7/CN7 group had a decreased richness and evenness of eukaryotic phytoplankton compared to the CS0/CN0 group (Figure S2C).
3.4. Alpha and Beta Diversity
The Simpson diversity and Pielou’s evenness of bacteria had a significant difference among groups, indicating the improved effect of supplementary EM and C. vulgaris on the bacterial diversity and evenness of cyanobacterial bloom ponds (Table 3A). However, the PD-whole tree index of fungi was significantly decreased in the CS7 group, indicating the inhibiting effect of supplementary EM and C. vulgaris on the fungal diversity of cyanobacterial bloom ponds (Table 3B).
Table 3.
Descriptive analysis and difference significance test of alpha diversity for each group.
Interestingly, the Simpson diversity of eukaryotic phytoplankton was decreased in the NG7 and CS7 groups than their initial levels, while it had no significant difference between the CN0 and CN7 groups (Table 3C). Chao1, Ace, and PD-whole tree were decreased significantly in the CS7 group compared to the CS0 group. In contrast, these three indices had different alterations in the NG7 and CN7 groups compared to their initial levels (Table 3C). In eukaryotic phytoplankton, the number of species, OTU, and community diversity were inhibited by a supplement of EM and C. vulgaris in cyanobacterial bloom ponds.
PCoA plots revealed a separation of bacterial communities among groups regardless of sampling time. Meanwhile, a high similarity existed between two sampling times within a certain group (Figure 2A). As for the fungal communities, we can barely find a difference among groups, but a separation existed between 0-day and 7-day of the CS group (Figure 2B). A similar situation existed in the communities of phytoplankton, with high similarity among groups regardless of the sampling time and separation between samples of day 0 and day 7 in the CS or NG groups (Figure 2C). These results suggest the microbiological compositions, especially the fungal and phytoplankton communities, could be influenced by the supplement of EM and C. vulgaris.
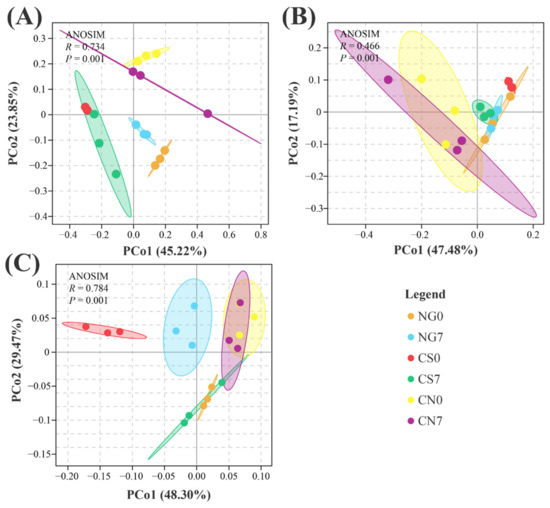
Figure 2.
PCoA plot base of the relative abundance of OTUs (97% similarity level) showing (A) bacterial, (B) fungal and (C) phytoplankton structural clustering. Distance between samples was calculated using the weighted unifrac method. ANOSIM was used to test the differences among groups.
3.5. Community Composition
In the NG groups, Proteobacteria, Firmicutes and Actinobacteria were the top 3 dominant bacterial phyla (Figure 3A). Compared to the NG0 group, the relative abundance of Firmicutes (NG0 = 17.11 ± 2.11, NG7 = 24.70 ± 2.98; Welch’s t-test p = 0.027) was increased, while the relative abundance of Bacteroidetes (NG0 = 18.76 ± 1.17, NG7 = 9.31 ± 1.17; Welch’s t-test p < 0.001) were decreased in the NG7 group. In contrast, the CS7 group had lower relative abundance of Proteobacteria (CS0 = 54.93 ± 0.64, CS7 = 52.03 ± 1.28; Welch’s t-test p = 0.040), and higher relative abundance of Bacteroidetes (CS0 = 1.41 ± 0.05, CS7 = 11.49 ± 3.68; Welch’s t-test p = 0.042) than the CS0 group (Figure 3A). In addition, compared to the CS0 group, the relative abundance of Cyanobacteria was decreased in the CS7 group (CS0 = 1.26 ± 0.11, CS7 = 0.27 ± 0.10; Welch’s t-test p < 0.001). Interestingly, compared to the similarity of community composition between the NG0 and CS0 groups, higher similarity existed between the NG7 and CS7 groups (Figure 3A). There is no significant difference in the relative abundance of bacterial phylum between the CN0 group and the CN7 group.
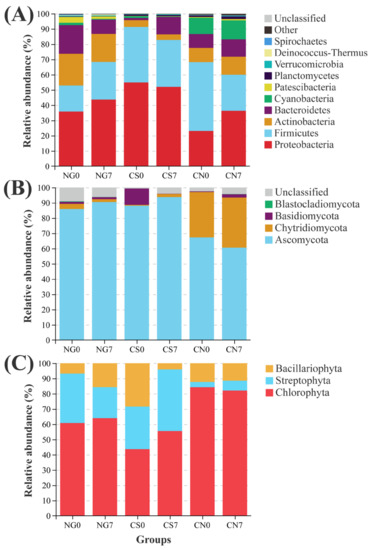
Figure 3.
Relative abundance of dominant (A) bacterial, (B) fungal and (C) phytoplankton phyla in each group.
In the present study, the most abundant cyanobacterial genus was Microcystis PCC-7914, accounting for 83.54% and 99.12% in the CS0 group and CN0 group, respectively (Figure S3). In addition, genera of Cyanobium PCC-6307, Pseudanabaena PCC-7429, and Leptolyngbya PCC-6306 were also detected in the cyanobacterial ponds (Figure S3).
The Ascomycota dominated the fungal community in all groups. Compared to the CS0 group, the relative abundance of Chytridiomycota increased slightly in the CS7 group (CS0 = 0.51 ± 0.09, CS7 = 2.02 ± 0.85; Welch’s t-test p = 0.098; Figure 3B). Interestingly, the fungal community composition of the CS7 group converged with that of the NG7 group and contrasted with that of the CN7 group (Figure 3B).
The phytoplankton community consisted of Chlorophyta, Streptophyta and Bacillariophyta phyla in all groups (Figure 3C). In the absence of exogenous influence, the NG group had increased Bacillariophyta abundance at the 7-day sampling point (NG0 = 6.85 ± 1.81, NG7 = 15.65 ± 5.09; Welch’s t-test p = 0.020). At the same time, the CN group had no significantly altered phylum at the 7-day sampling point. In contrast, after the supplement of EM and C. vulgaris, the relative abundance of Bacillariophyta was decreased significantly in the CS group (CS0 = 28.51 ± 5.31, CS7 = 4.01 ± 1.10; Welch’s t-test p = 0.002; Figure 3C).
3.6. Microflora Alteration Associated with the Supplement of EM and C. vulgaris
Based on the relative abundance of OTUs, we used LEfSe to generate cladograms to identify the specific microbial taxa associated with the supplement of EM and C. vulgaris (Figure 4, Figure 5 and Figure 6). We screened significantly enriched microbial abundances (LDA scores (log 10) > 4.0) from the taxonomic phylum to species levels in the CS and CN groups. In the CS group, we identified several significantly enriched taxa as key discriminants of bacteria (Figure 4), fungi (Figure 5) and phytoplankton (Figure 6). However, only two significantly enriched bacterial classes, Bacilli and Alphaproteobacteria, were screened as key discriminants in the CN group (Figure S5).
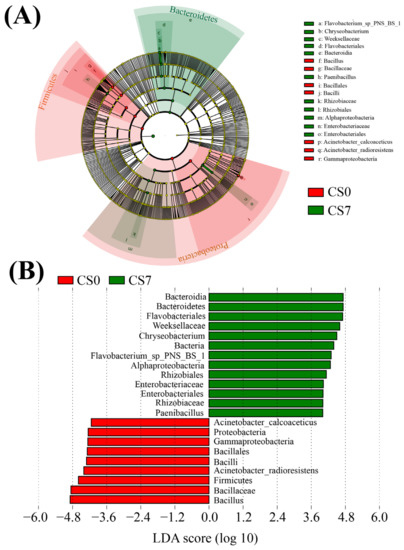
Figure 4.
Linear discriminant analysis (LDA) integrated with effect size (LEfSe). (A) Cladogram indicating the phylogenetic distribution of bacterial taxa correlated with the CS0 or CS7 groups. (B) The differences in abundance between the CS0 and CS7 groups.
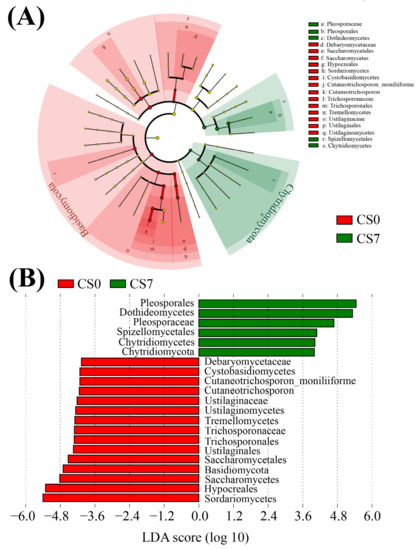
Figure 5.
Linear discriminant analysis (LDA) integrated with effect size (LEfSe). (A) Cladogram indicating the phylogenetic distribution of fungal taxa correlated with the CS0 or CS7 groups. (B) The differences in abundance between the CS0 and CS7 groups.
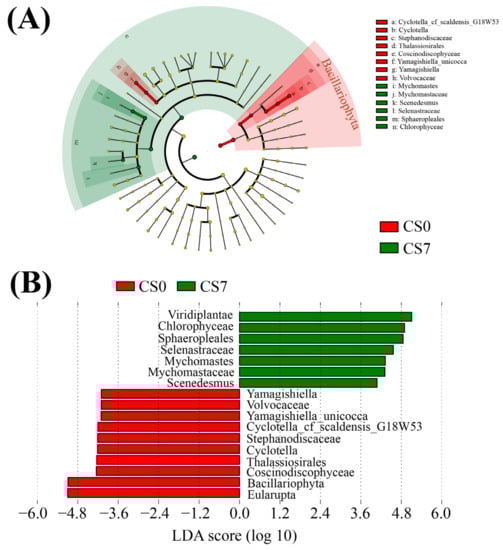
Figure 6.
Linear discriminant analysis (LDA) integrated with effect size (LEfSe). (A) Cladogram indicating the phylogenetic distribution of phytoplankton taxa correlated with the CS0 or CS7 groups. (B) The differences in abundance between the CS0 and CS7 groups.
In the CS7 group, Chryseobacterium (Bacteroidetes, Bacteroidia, Flavobacteriales, and Weeksellaceae) was the most abundant bacterial genus (Figure 4B), while Weeksellaceae was the most abundant bacterial family, followed by Rhizobiaceae (Proteobacteria, Alphaproteobacteria, Rhizobiales) and Enterobacteriaceae (Proteobacteria, Gammaproteobacteria, Enterobacteriales; Figure 4B). In the CS7 group, a 71.16-fold increase in genus Chryseobacterium (Figure 4 and Figure S5A), as well as a 5.03-fold increase in family Rhizobiaceae and an 11.78-fold increase in family Enterobacteriaceae were observed compared to the CS0 group (Figure 4 and Figure S6A).
In the fungal taxa, the family Pleosporaceae (Ascomycota, Dothideomycetes, Pleosporales) and the order Pleosporales were the most abundant fungal family and order in the CS7 group, respectively (Figure 5B). In comparison, Hypocreales (Sordariomycetes) was the most abundant fungal order in the CS0 group (Figure 5B). Compared to the CS0 group, the CS7 group had a 33.41-fold increase in family Pleosporaceae, as well as a 3.36-fold decrease in order Hypocreales (Figure 5, Figures S5B and S6B).
In the phytoplankton taxa, Mychonastes (Chlorophyta, Chlorophyceae, Sphaeropleales, and Mychonastaceae) was the most abundant genus in the CS7 group, while Cyclotella (Bacillariophyta, Coscinodiscophyceae, Thalassiosirales, Stephanodiscaceae) was the most abundant genus in the CS0 group (Figure 6B). Compared to the CS0 group, the CS7 group had a 3.33-fold increase in the genus Mychonastes and a decrease from 3.20 to 0 in the genus Cyclotella (Figure 6, Figures S5C and S6C).
For those significantly altered microbial taxa in CS groups, we furtherly analyzed the correlation between microbial taxa based on the relative abundance in all samples. The fungal family Pleosporaceae was significantly negatively correlated with the phytoplankton family Stephanodiscaceae (rho = −0.609, p = 0.007; Table 4). Meanwhile, the fungal order Hypocreales was significantly negatively correlated with the bacterial family Burkholderiaceae (rho = −0.639, p = 0.004) and Chitinophagaceae (rho = −0.564, p = 0.015; Table 4).
Table 4.
Spearman correlation analysis based on the relative abundance of microbial taxa in each sample (n = 18). Upper diagonal data represent Spearman correlation coefficients (rho). Lower diagonal data denote concomitant probabilities (p) of the two-tailed test.
To better understand the impacts of cyanobacterial blooms, we furtherly analyzed the correlation between the most abundant genera of cyanobacteria and water quality parameters, as well as physiological enzyme activities. Interestingly, Microcystis PCC-7914 was significantly negatively correlated with T-AOC (rho = −0.943, p = 0.005) and significantly positively correlated with MDA (rho = 0.943, p = 0.005), TAN (rho = 0.841, p = 0.036), TN, TP, and NPR (rho = 0.943, p = 0.005; Table 5). In addition, Cyanobium PCC-6307 was significantly negatively correlated with AMS (rho = −0.943, p = 0.005; Table 5).
Table 5.
Spearman correlation analysis based on the relative abundance of cyanobacterial genera in each group.
3.7. Functional Alteration Associated with the Supplement of EM and C. vulgaris
We applied two different approaches, FAPROTAX and Bugbase, to predict the ecological functions of bacterial communities. Compared to the CS0 group, the CS7 group had enhanced function of chemoheterotrophy, accompanied by inhibited functions of human_pathogens_all and human_pathogens_nosocomia (Figure 7A and Table S4A). Besides the abovementioned functions, several metabolic phenotypes were associated with the supplement of EM and C. vulgaris. Compared to the CS0 group, the CS7 group had increased phenotypes of Gram_Negative and Facultatively_Anaerobic, accompanied by decreased phenotypes of Aerobic and Gram_Positive (Figure 7B and Table S4B).
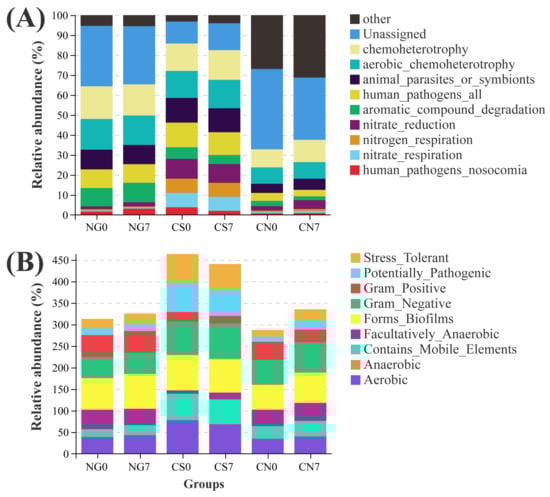
Figure 7.
Variations in metabolic phenotypes and ecological functions of prokaryotes in E. sinensis pond. (A) top 10 functions annotated using FAPROTAX and (B) phenotypic abundance analyzed with Bugbase.
4. Discussion
4.1. Impact of Cyanobacterial Bloom on E. sinensis Culture Pond
Cyanobacterial blooms can cause problems with water quality, alter the bacterial community assembly, disturb the physiological function and impair the health of aquatic animals [6,9,35]. Thus, cyanobacterial blooms are often disasters for aquatic ecosystems and their living organisms. In the present study, the most abundant cyanobacterial genus was Microcystis PCC-7914 in cyanobacterial bloom ponds, and the NPR was low (<11.43). These results were compatible with the viewpoint that non-N2-fixing Microcystis tended to dominate cyanobacterial blooms when N became limited (low NPR) [15]. Congruent with the close relationship between N, P nutrients and cyanobacterial bloom [36], in the present study, we found Microcystis PCC-7914 was significantly correlated with TAN, TN, TP and NPR. Thus, we suggested cyanobacterial blooms degraded the water quality of the E. sinensis culture pond by increasing the content of TAN, TN and TP.
Exposure to Microcystis spp. altered antioxidant enzymes activities in fish [37,38,39] and crustaceans (e.g., Pacific white shrimp Litopenaeus vannamei) [35], as well as the digestive enzymes activity in rotifer (Brachionus calyciflorus) [40]. Similarly, in the present study, E. sinensis from the cyanobacterial bloom ponds had decreased digestive enzyme activity and total antioxidant capacity than that from the normal ponds. Antioxidant systems were efficient defenders of organisms against the negative impacts of toxicants. In E. sinensis, short-term acute toxicity of MC-LR (within 48 h) often caused enhanced antioxidant ability [5,24]. Contrast to that, we found prolonged exposure (7 d) to Microcystis spp. decreased digestive enzymes activity and total antioxidant capacity of E. sinensis. The dysfunction of digestive and antioxidant system in E. sinensis confirmed the Microcystis spp. disturbed the physiological function of aquatic animals once again.
According to the study in eutrophic lake sediments, Firmicutes is a major phylum with high global centrality in the microbial network; its relative abundance is close connections with the cyanobacterial blooms phase [41]. In the present study, cyanobacterial blooms decreased the relative abundance of Firmicutes and increased the relative abundance of Cyanobacteria. A similar result was found in the previous study that MC-LR exposure decreased the relative abundance of Firmicutes in the intestinal microbiota of L. vannamei [36]. In addition, cyanobacterial blooms altered the community assembly of fungal and phytoplankton in the E. sinensis culture pond, representing the decreased relative abundance of Ascomytcota and Streptophyta and the increased relative abundance of Chytridiomycota and Chlorophyta.
4.2. The Supplement of EM and C. vulgaris Improved Water Quality of E. sinensis Culture Pond
An aquaculture pond is a complex ecosystem consisting of different types of organisms interacting with each other as well as with the surrounding environmental conditions. The organisms in the culture pond of E. sinensis are diverse, including aquatic plants, algae, zooplankton, crabs, mud snails, and microorganisms. The stability of the pond ecosystem is the key to the success of aquaculture, which is strongly associated with biotic components and abiotic factors. In aquaculture, water quality parameters (e.g., dissolved oxygen, pH, nitrogen and phosphorus nutrients) are commonly used abiotic indicators for monitoring the health of the pond ecosystem [42,43]. In the present study, a supplement of EM and C. vulgaris decreased TAN and TN levels, confirming their improved effect on the water quality of cyanobacterial bloom ponds.
Since many species of cyanobacteria had outstanding abilities in nitrogen fixation [44,45], even low NPR favored blooms of nitrogen-fixing cyanobacteria [46]. In the present study, NPR was significantly decreased after the supplement of EM and C. vulgaris in cyanobacterial bloom ponds, while it had a similar slight decrease in normal ponds. In contrast, NPR was slightly increased, accompanied by the increase of cyanobacteria in cyanobacterial bloom ponds without supplements. Rather than cyanobacteria [47], our results indicated that the blooms of other algae are more relevant to the decrease of NPR. Interestingly, in line with the previous study [48], our results favored a positive correlation between NPR and cyanobacteria abundance.
In the present study, these water quality parameters were all in good condition except for the total nitrogen and total phosphorus in several cyanobacterial blooms ponds, suggesting a certain but limited role of water quality parameters on risk warning for the pond ecosystem.
4.3. Effect of the Supplement of EM and C. vulgaris on the Growth and Physiology of E. sinensis
Similar to the previous study [4], in the present study, we found no significant effect of the supplement of EM and C. vulgaris on the growth of female E. sinensis. Other than the limited effect of splashing EM into the water, in this study, the lack of change in the growth parameters of E. sinensis should be mainly attributed to the short experiment period.
In the present study, the digestive enzyme activity of E. sinensis, especially the LPS, was increased by the supplement of EM and C. vulgaris. Similarly, antioxidant enzymes (GR and SOD), as well as the total antioxidant capacity, were increased by the supplement of EM and C. vulgaris. Meanwhile, the constant level of MDA in the CS group but not in the CN group indicates the inhibition of lipid peroxidation in the hepatopancreas of crab by the supplement of EM and C. vulgaris [49,50,51]. Thus, we suggested the supplement of EM and C. vulgaris into the water improved the digestive and antioxidant ability of female E. sinensis.
4.4. Bacterial Compositions Were Restored by the Supplement of EM and C. vulgaris
The genus Chryseobacterium is classified within the family Weeksellaceae, order Flavobacteriales, class Bacteroidia, and in the phylum Bacteroidetes. Chryseobacterium species were previously classified in the genus Flavobacterium. Chryseobacterium species are rare opportunistic pathogens of low virulence, and their presence in clinical specimens usually represents colonization and not infection [52,53]. Thus, the dominant abundance of the Chryseobacterium species in the CS7 group suggested they captured more space and nutrients than other species. The family Rhizobiaceae is classified within the order Rhizobiales, class Alphaproteobacteria, and in the phylum Proteobacteria. Rhizobiaceae can fix atmospheric nitrogen, which is a process that requires a lot of energy and electrons [54]. Thus, Rhizobiaceae seems a competitive inhibitor for nitrogen-fixing cyanobacteria. Given the decrease of the phylum Cyanobacteria along with the increase of the family Rhizobiaceae in the present study, as with the previous study [55], we suggest the prospect of employing Rhizobiaceae in bioremediation is promising. Enterobacteriaceae is a family of the order Enterobacteriales, class Gammaproteobacteria, and in the phylum Proteobacteria. Enterobacteriaceae is present in various niches worldwide [56], while most members of Enterobacteriaceae are opportunistic pathogens for aquatic animals [57]. At the same time, some Enterobacter species provide significant protection against Flavobacterium psychrophilum infection in Oncorhynchus mykiss [58,59,60].
In the present study, we found a 1.06-fold decrease in the abundance of phylum Proteobacteria and a 4.67-fold decrease in Cyanobacteria associated with the supplement of EM and C. vulgaris, along with the increase of the genus Chryseobacterium (71.16-fold), the family Rhizobiaceae (5.03-fold) and the family Enterobacteriaceae (11.78-fold), representing a more space and nutrients colonized by neutral or beneficial bacteria than harmful species [23,61]. Interestingly, the supplement of EM and C. vulgaris were predicted to enhance the function of chemoheterotrophy and inhibit functions of human_pathogens_all and human_pathogens_nosocomia. Together with the higher similarity in the community composition of the NG7 and CS7 groups in the present study, we verified the bacterial compositions of cyanobacterial blooms ponds could be restored by the supplement of EM and C. vulgaris.
4.5. Fungal Roles in the Ecosystem of E. sinensis Culture Pond
In the present study, the fungal community composition of the CS7 group converged with that of the NG7 group and contrasted with that of the CN7 group, suggesting the supplement of EM and C. vulgaris promoted the restoration of the fungal community composition in cyanobacterial blooms ponds.
In the present study, we found a 33.41-fold increase in the family Pleosporaceae, a 3.96-fold increase in the phylum Chytridiomycota, as well as a 3.36-fold decrease in the order Hypocreales, which were significantly associated with the supplement of EM and C. vulgaris. Chytridiomycota, commonly called chytrids, are a phylum of fungi in which most species live in aquatic environments, and some species are also abundant in soil. In aquatic environments, Chytridiomycota mostly forms scanty filaments with sporangia [62]. As saprophytes, they can degrade chitin and cellulose [63], thus playing a very important role as decomposers in ecosystems. Pleosporaceae is a family in the order Pleosporales, the class Dothideomycetes, and the phylum Ascomycota. While the order Hypocreales is within the class Sordariomycetes, the phylum Ascomycota. Most of the members in the family Pleosporaceae and the order Hypocreales are opportunistically pathogenic species for vertebrates [64]. A large portion of Hypocreales fungi is mycoparasitic or mycosaprotrophic [65], and several Hypocreales fungi have been used for controlling spider mites [66].
Interestingly, in the present study, we found a significantly negative correlation between the fungal family Pleosporaceae and the phytoplankton family Stephanodiscaceae, and so does the fungal order Hypocreales with the bacterial family Burkholderiaceae and Chitinophagaceae. Our findings suggested Pleosporaceae may be pathogenic fungi for Stephanodiscaceae (Bacillariophyta) or the metabolites of Pleosporaceae inhibited the growth and reproduction of Stephanodiscaceae. Meanwhile, Hypocreales fungi may be competitive inhabitors for Burkholderiaceae and Chitinophagaceae bacteria.
4.6. The Supplement of EM and C. vulgaris Altered Phytoplankton Compositions of E. sinensis Culture Pond
The genus Mychonastes belongs to the family Mychonastaceae, the order Sphaeropleales, the class Chlorophyta, and the phylum Chlorophyceae. It is difficult to distinguish Mychonastes algae from morphology alone for their lack of distinctive morphological features [67]. Based on the phylogenetic marker, Krienitz et al. (2011) [68] confirmed the synonymy of Mychonastes homosphaera and Chlorella minutissima and furtherly proposed a taxonomic revision of the genus Mychonastes. The genus Mychonastes widely exists in inland waters, which comprise spherical, ovoid or ellipsoidal algae living solitarily or in small groups [68]. Interestingly, M. homosphaera seems to be a high-quality food source for zooplankton and heterotrophic flagellates and also a promising feedstock for high-quality animal feed [69]. In the present study, the abundance of the genus Mychonastes was increased after the supplement of EM and C. vulgaris, providing us with a safe and efficient method for potentially fertilizing aquaculture ponds.
Similar to the Mychonastes dominating the photosynthetic picoeukaryotes in Lake Poyang [70], we found Mychonastes was representative of the prominent phytoplankton in the E. sinensis culture pond ecosystem. Since the ponds were connected with the Yangtze River, in the present study, we confirmed the representativeness of the Mychonastes species in river-connected aquatic environments [70].
The genus Cyclotella belongs to the family Stephanodiscaceae, the order Thalassiosirales, the class Coscinodiscophyceae, and the phylum Bacillariophyta. Most Cyclotella algae live in freshwater environments, and very rare species live in saline water [71,72,73]. Amongst these, Cyclotella meneghiniana is an ideal feed for the larvae of E. sinensis [74]. Particularly, the ability to accumulate lipids for energy storage makes Cyclotella diatoms industrially attractive for the production of biofuels and high-value compounds [75,76]. In diatoms, Cyclotella is a better competitor for silicate, while Asterionella is a better competitor for phosphorus [77]. In the present study, the decrease of the genus Cyclotella (Bacillariophyta) and the increase of the genus Mychonastes (Chlorophyta) in the CS7 group suggested that Mychonastes rather than Cyclotella is a better competitor for nitrogen.
4.7. The Application Prospect of Probiotics and Microalgae in Aquaculture
It is well known that the presence of cyanotoxins and water pollution could cause undesirable chemicals to become residual, especially in the hepatopancreas (the main edible part), thereby reducing the quality of E. sinensis. Therefore, developing more sustainable models of E. sinensis breeding is critical. Given the interactions between microalgae and bacteria [78], it is an applicable way to regulate the pond ecosystem with a combination of probiotics and microalgae in aquaculture [22,79]. In the present study, we found no adverse effects of EM and C. vulgaris supplementation in the water on the growth, digestive or antioxidant ability of E. sinensis. Specifically, EM and C. vulgaris supplementation counteracted potential problems caused by cyanobacterial blooms. To prevent and control the occurrence of cyanobacterial blooms in aquaculture, we suggested using a combination of EM and C. vulgaris to maintain a stable pond ecosystem as early as possible.
5. Conclusions
In the present study, we found no adverse effects of EM and C. vulgaris supplementation in the water on the growth, digestive or antioxidant ability of E. sinensis. We assessed the potential combined effects of EM and C. vulgaris on the prevention and control of cyanobacteria in E. sinensis culture ponds. As a result, the supplement of EM and C. vulgaris improved the water quality of the E. sinensis culture pond by reducing TAN and TN levels. We found an improved effect on the bacterial diversity and evenness while inhibiting effects on the diversity of fungal and phytoplankton communities were related to the supplement of EM and C. vulgaris. Meanwhile, supplementary EM and C. vulgaris had complex effects on the microbial compositions in the E. sinensis pond. In bacterial compositions, the supplement of EM and C. vulgaris increased the abundance of Gram-negative bacteria and facultatively anaerobic species, whereas it decreased the abundance of aerobic and Gram-positive bacteria. Based on FAPROTAX, we predicted the enhanced function of chemoheterotrophy, accompanied by inhibited functions of human_pathogens_all and human_pathogens_nosocomia, were associated with the supplement of EM and C. vulgaris. Interestingly, the supplement of EM and C. vulgaris promoted the restoration of the bacterial and fungal community composition in cyanobacterial blooms ponds. In phytoplankton, the supplement of EM and C. vulgaris increased the abundance of the genus Mychonastes (Chlorophyta) while decreasing that of the genus Cyclotella (Bacillariophyta). In addition, we found a significantly negative correlation between the fungal family Pleosporaceae and the phytoplankton family Stephanodiscaceae, and so does the fungal order Hypocreales with the bacterial family Burkholderiaceae and Chitinophagaceae. The present study is a practice of regulating the pond ecosystem with a combination of probiotics and microalgae. Our findings laid the foundation for the prevention and control of potential risks in the culture of E. sinensis.
Supplementary Materials
The following supporting information can be downloaded at: https://www.mdpi.com/article/10.3390/su15097362/s1, Figure S1: Rarefaction curve evaluating the relative richness of (A) bacteria, (B) fungi and (C) phytoplankton; Figure S2: OTU rank abundance curve to visualize evenness and richness of (A) bacterial, (B) fungal and (C) phytoplankton species; Figure S3: Relative abundance of the most abundant cyanobacterial genus in each group; Figure S4: Linear discriminant analysis (LDA) integrated with effect size (LEfSe). (A) Cladogram indicating the phylogenetic distribution of phytoplankton taxa correlated with the CN0 or CN7 groups. (B) The differences in abundance between the CN0 and CN7 group; Figure S5: Microbial taxa with significant abundance differences between the CS0 and CS7 groups. (A) different bacterial genera, (B) different fungal families, (C) different genera of phytoplankton. Statistical differences were assessed using Welch’s t-tests; Figure S6: Microbial taxa with significant abundance differences between the CS0 and CS7 groups. (A) different bacterial families, (B) different fungal order, (C) different families of phytoplankton. Statistical differences were assessed using Welch’s t-tests; Table S1: Description statistic of the growth parameters for female crabs. Values are presented as means (±SD) of three pond replicates; Table S2: Basic information of 18 procaryotic and 18 eukaryotic sequencing libraries; Table S3: The number of tags and OUTs of 18 procaryotic and 18 eukaryotic sequencing libraries; Table S4: Descriptive statistics for the relative abundance of (A) ecological functions and (B) metabolic phenotypes of prokaryotes in E. sinensis pond. (A) top 10 functions annotated using FAPROTAX and (B) phenotypic abundance analyzed with Bugbase. Significant differences between 0-day and 7-day sampling time within a group were indicated by an asterisk.
Author Contributions
Conceptualization, Writing-Original draft preparation & Funding acquisition, J.G. and G.X.; Visualization & Investigation, J.G., N.S. and Y.S.; Data curation, Z.N. and X.Y.; Resources, X.Y. and F.D.; Funding acquisition, Supervision &Writing-review & editing, G.X. and P.X. All authors have read and agreed to the published version of the manuscript.
Funding
This research was funded by the “JBGS” Project of Seed Industry Revitalization in Jiangsu Province (grant number JBGS [2021]125) and the earmarked fund for CARS48.
Institutional Review Board Statement
The animal study protocol was approved by the Ethics Committee of Nanjing Agricultural University (protocol code SYXK (Xu) 20210701 and 1 July 2021).
Informed Consent Statement
Not applicable.
Data Availability Statement
The data presented in this study are openly available at https://www.ncbi.nlm.nih.gov/sra/?term=PRJNA835239(accessed on 1 June 2022).
Acknowledgments
We are indebted to all reviewers and editors for their contributions to this paper.
Conflicts of Interest
The authors declare no conflict of interest.
References
- Gao, J.; Shen, L.; Nie, Z.; Zhu, H.; Cao, L.; Du, J.; Dai, F.; Xu, G. Microbial and Planktonic Community Characteristics of Eriocheir sinensis Culture Ponds Experiencing Harmful Algal Blooms. Fishes 2022, 7, 180. [Google Scholar] [CrossRef]
- Fishery Administration Bureau of the Ministry of Agriculture and Villages; National Aquatic Products Technology Extension Station; China Society of Fisheries. 2022 China Fishery Statistical Yearbook; Chinese Agricultural Press: Beijing, China, 2022; Volume 43. [Google Scholar]
- Dai, H.; Sun, Y.; Ren, N.; Lu, X. Investigation of Chinese hairy crab industry and analysis of development strategies. Jiangsu Agric. Sci. 2021, 49, 248–252. [Google Scholar] [CrossRef]
- Gao, J.; Tai, X.; Shao, N.; Sun, Y.; Nie, Z.; Wang, Y.; Li, Q.; Xu, P.; Xu, G. Effects of effective microorganisms on the growth performance, nutritional composition and flavour quality of the pond-cultured Eriocheir sinensis. Aquac. Res. 2021, 52, 871–880. [Google Scholar] [CrossRef]
- Chi, C.; Yu, X.-W.; Zhang, C.-Y.; Liu, J.-D.; Ye, M.-W.; Zhang, D.-D.; Liu, W.-B. Acute exposure to microcystin-LR induces hepatopancreas toxicity in the Chinese mitten crab (Eriocheir sinensis). Arch. Toxicol. 2021, 95, 2551–2570. [Google Scholar] [CrossRef] [PubMed]
- Huisman, J.; Codd, G.A.; Paerl, H.W.; Ibelings, B.W.; Verspagen, J.M.H.; Visser, P.M. Cyanobacterial blooms. Nat. Rev. Microbiol. 2018, 16, 471–483. [Google Scholar] [CrossRef]
- Pham, T.-L.; Shimizu, K.; Dao, T.-S.; Hong-Do, L.-C.; Utsumi, M. Microcystin uptake and biochemical responses in the freshwater clam Corbicula leana P. exposed to toxic and non-toxic Microcystis aeruginosa: Evidence of tolerance to cyanotoxins. Toxicol. Rep. 2015, 2, 88–98. [Google Scholar] [CrossRef] [PubMed]
- Wu, J.X.; Huang, H.; Yang, L.; Zhang, X.F.; Zhang, S.S.; Liu, H.H.; Wang, Y.Q.; Yuan, L.; Cheng, X.M.; Zhuang, D.G.; et al. Gastrointestinal toxicity induced by microcystins. World J. Clin. Cases 2018, 6, 344–354. [Google Scholar] [CrossRef]
- Chen, L.; Giesy, J.P.; Adamovsky, O.; Svirčev, Z.; Meriluoto, J.; Codd, G.A.; Mijovic, B.; Shi, T.; Tuo, X.; Li, S.-C.; et al. Challenges of using blooms of Microcystis spp. in animal feeds: A comprehensive review of nutritional, toxicological and microbial health evaluation. Sci. Total Environ. 2021, 764, 142319. [Google Scholar] [CrossRef]
- Colas, S.; Marie, B.; Lance, E.; Quiblier, C.; Tricoire-Leignel, H.; Mattei, C. Anatoxin-a: Overview on a harmful cyanobacterial neurotoxin from the environmental scale to the molecular target. Environ. Res. 2021, 193, 110590. [Google Scholar] [CrossRef]
- Yeung, K.W.Y.; Zhou, G.-J.; Hilscherová, K.; Giesy, J.P.; Leung, K.M.Y. Current understanding of potential ecological risks of retinoic acids and their metabolites in aquatic environments. Environ. Int. 2020, 136, 105464. [Google Scholar] [CrossRef]
- Zhang, Q.; Zhang, Z.; Lu, T.; Peijnenburg, W.J.G.M.; Gillings, M.; Yang, X.; Chen, J.; Penuelas, J.; Zhu, Y.G.; Zhou, N.Y.; et al. Cyanobacterial blooms contribute to the diversity of antibiotic-resistance genes in aquatic ecosystems. Commun. Biol. 2020, 3, 737. [Google Scholar] [CrossRef] [PubMed]
- Wang, K.; Razzano, M.; Mou, X. Cyanobacterial blooms alter the relative importance of neutral and selective processes in assembling freshwater bacterioplankton community. Sci. Total Environ. 2020, 706, 135724. [Google Scholar] [CrossRef] [PubMed]
- Woodhouse, J.N.; Ziegler, J.; Grossart, H.-P.; Neilan, B.A. Cyanobacterial Community Composition and Bacteria-Bacteria Interactions Promote the Stable Occurrence of Particle-Associated Bacteria. Front. Microbiol. 2018, 9, 777. [Google Scholar] [CrossRef] [PubMed]
- Wang, K.; Mou, X.; Cao, H.; Struewing, I.; Allen, J.; Lu, J. Co-occurring microorganisms regulate the succession of cyanobacterial harmful algal blooms. Environ. Pollut. 2021, 288, 117682. [Google Scholar] [CrossRef] [PubMed]
- Wang, K.; Mou, X. Coordinated Diel Gene Expression of Cyanobacteria and Their Microbiome. Microorganisms 2021, 9, 1670. [Google Scholar] [CrossRef] [PubMed]
- Cirri, E.; Pohnert, G. Algae-bacteria interactions that balance the planktonic microbiome. New Phytol. 2019, 223, 100–106. [Google Scholar] [CrossRef]
- Deng, Y.; Vallet, M.; Pohnert, G. Temporal and Spatial Signaling Mediating the Balance of the Plankton Microbiome. Annu. Rev. Mar. Sci. 2022, 14, 239–260. [Google Scholar] [CrossRef]
- Ugalde, S.C.; Martin, A.J.; Meiners, K.M.; McMinn, A.; Ryan, K.G. Extracellular organic carbon dynamics during a bottom-ice algal bloom (Antarctica). Aquat. Microb. Ecol. 2014, 73, 195–210. [Google Scholar] [CrossRef]
- Yao, S.; Lyu, S.; An, Y.; Lu, J.; Gjermansen, C.; Schramm, A. Microalgae–bacteria symbiosis in microalgal growth and biofuel production: A review. J. Appl. Microbiol. 2019, 126, 359–368. [Google Scholar] [CrossRef] [PubMed]
- Pollara, S.B.; Becker, J.W.; Nunn, B.L.; Boiteau, R.; Repeta, D.; Mudge, M.C.; Downing, G.; Chase, D.; Harvey, E.L.; Whalen, K.E. Bacterial Quorum-Sensing Signal Arrests Phytoplankton Cell Division and Impacts Virus-Induced Mortality. mSphere 2021, 6, e00009-21. [Google Scholar] [CrossRef]
- Ahmad, M.T.; Shariff, M.; Yusoff, F.; Goh, Y.M.; Banerjee, S. Applications of microalga Chlorella vulgaris in aquaculture. Rev. Aquac. 2020, 12, 328–346. [Google Scholar] [CrossRef]
- Wang, C.; Chuprom, J.; Wang, Y.; Fu, L. Beneficial bacteria for aquaculture: Nutrition, bacteriostasis and immunoregulation. J. Appl. Microbiol. 2020, 128, 28–40. [Google Scholar] [CrossRef] [PubMed]
- Zhang, Y.; Gao, J.; Nie, Z.; Zhu, H.; Du, J.; Cao, L.; Shao, N.; Sun, Y.; Su, S.; Xu, G.; et al. Microcystin-LR induces apoptosis in Juvenile Eriocheir sinensis via the mitochondrial pathway. Ecotoxicol. Environ. Saf. 2022, 238, 113528. [Google Scholar] [CrossRef]
- Chen, S.; Zhou, Y.; Chen, Y.; Gu, J. fastp: An ultra-fast all-in-one FASTQ preprocessor. Bioinformatics 2018, 34, i884–i890. [Google Scholar] [CrossRef] [PubMed]
- Magoč, T.; Salzberg, S.L. FLASH: Fast length adjustment of short reads to improve genome assemblies. Bioinformatics 2011, 27, 2957–2963. [Google Scholar] [CrossRef]
- Bokulich, N.A.; Subramanian, S.; Faith, J.J.; Gevers, D.; Gordon, J.I.; Knight, R.; Mills, D.A.; Caporaso, J.G. Quality-filtering vastly improves diversity estimates from Illumina amplicon sequencing. Nat. Methods 2013, 10, 57–59. [Google Scholar] [CrossRef]
- Edgar, R.C. UPARSE: Highly accurate OTU sequences from microbial amplicon reads. Nat. Methods 2013, 10, 996–998. [Google Scholar] [CrossRef] [PubMed]
- Edgar, R.C.; Haas, B.J.; Clemente, J.C.; Quince, C.; Knight, R. UCHIME improves sensitivity and speed of chimera detection. Bioinformatics 2011, 27, 2194–2200. [Google Scholar] [CrossRef] [PubMed]
- Wang, Q.; Garrity, G.M.; Tiedje, J.M.; Cole, J.R. Naive Bayesian classifier for rapid assignment of rRNA sequences into the new bacterial taxonomy. Appl. Environ. Microbiol. 2007, 73, 5261–5267. [Google Scholar] [CrossRef]
- Pruesse, E.; Quast, C.; Knittel, K.; Fuchs, B.M.; Ludwig, W.; Peplies, J.; Glöckner, F.O. SILVA: A comprehensive online resource for quality checked and aligned ribosomal RNA sequence data compatible with ARB. Nucleic Acids Res. 2007, 35, 7188–7196. [Google Scholar] [CrossRef]
- Segata, N.; Izard, J.; Waldron, L.; Gevers, D.; Miropolsky, L.; Garrett, W.S.; Huttenhower, C. Metagenomic biomarker discovery and explanation. Genome Biol. 2011, 12, R60. [Google Scholar] [CrossRef] [PubMed]
- Louca, S.; Parfrey, L.W.; Doebeli, M. Decoupling function and taxonomy in the global ocean microbiome. Science 2016, 353, 1272–1277. [Google Scholar] [CrossRef] [PubMed]
- Ward, T.L.; Larson, J.; Meulemans, J.; Hillmann, B.M.; Lynch, J.; Sidiropoulos, D.N.; Spear, J.R.; Caporaso, G.; Blekhman, R.; Knight, R.; et al. BugBase predicts organism-level microbiome phenotypes. bioRxiv 2017, 5, 2. [Google Scholar] [CrossRef]
- Duan, Y.; Xiong, D.; Wang, Y.; Dong, H.; Huang, J.; Zhang, J. Effects of Microcystis aeruginosa and microcystin-LR on intestinal histology, immune response, and microbial community in Litopenaeus vannamei. Environ. Pollut. 2020, 265, 114774. [Google Scholar] [CrossRef]
- Li, S.; Liu, C.; Sun, P.; Ni, T. Response of cyanobacterial bloom risk to nitrogen and phosphorus concentrations in large shallow lakes determined through geographical detector: A case study of Taihu Lake, China. Sci. Total Environ. 2022, 816, 151617. [Google Scholar] [CrossRef] [PubMed]
- Puerto, M.; Gutiérrez-Praena, D.; Prieto, A.I.; Pichardo, S.; Jos, A.; Miguel-Carrasco, J.L.; Vazquez, C.M.; Cameán, A.M. Subchronic effects of cyanobacterial cells on the transcription of antioxidant enzyme genes in tilapia (Oreochromis niloticus). Ecotoxicology 2011, 20, 479–490. [Google Scholar] [CrossRef]
- Abdel-Latif, H.M.R.; Khashaba, A.M.A. Subchronic toxicity of Nile tilapia with different exposure routes to Microcystis aeruginosa: Histopathology, liver functions, and oxidative stress biomarkers. Vet. World 2017, 10, 955–963. [Google Scholar] [CrossRef] [PubMed]
- Li, X.Y.; Chung, I.K.; Kim, J.I.; Lee, J.A. Oral exposure to Microcystis increases activity-augmented antioxidant enzymes in the liver of loach (Misgurnus mizolepis) and has no effect on lipid peroxidation. Comp. Biochem. Phys. C 2005, 141, 292–296. [Google Scholar] [CrossRef] [PubMed]
- Liang, Y.; Su, Y.; Ouyang, K.; Chen, X.; Yang, J. Effects of microcystin-producing and microcystin-free Microcystis aeruginosa on enzyme activity and nutrient content in the rotifer Brachionus calyciflorus. Environ. Sci. Pollut. Res. 2017, 24, 10430–10442. [Google Scholar] [CrossRef] [PubMed]
- Yang, Y.; Chen, J.; Chen, X.; Jiang, Q.; Liu, Y.; Xie, S. Cyanobacterial bloom induces structural and functional succession of microbial communities in eutrophic lake sediments. Environ. Pollut. 2021, 284, 117157. [Google Scholar] [CrossRef]
- Hu, Z.; Li, R.; Xia, X.; Yu, C.; Fan, X.; Zhao, Y. A method overview in smart aquaculture. Environ. Monit. Assess. 2020, 192, 493. [Google Scholar] [CrossRef]
- Li, D.; Liu, S. Chapter 12—Water Quality Monitoring in Aquaculture. In Water Quality Monitoring and Management; Li, D., Liu, S., Eds.; Academic Press: Cambridge, MA, USA, 2019; pp. 303–328. [Google Scholar]
- Bergström, A.-K. The use of TN:TP and DIN:TP ratios as indicators for phytoplankton nutrient limitation in oligotrophic lakes affected by N deposition. Aquat. Sci. 2010, 72, 277–281. [Google Scholar] [CrossRef]
- Paerl, H.W.; Xu, H.; Hall, N.S.; Zhu, G.; Qin, B.; Wu, Y.; Rossignol, K.L.; Dong, L.; McCarthy, M.J.; Joyner, A.R. Controlling cyanobacterial blooms in hypertrophic Lake Taihu, China: Will nitrogen reductions cause replacement of non-N2 fixing by N2 fixing taxa? PLoS ONE 2014, 9, e113123. [Google Scholar] [CrossRef] [PubMed]
- Kim, H.-S.; Hwang, S.-J.; Shin, J.-K.; An, K.-G.; Yoon, C.G. Effects of limiting nutrients and N:P ratios on the phytoplankton growth in a shallow hypertrophic reservoir. Hydrobiologia 2007, 581, 255–267. [Google Scholar] [CrossRef]
- Xie, L.; Xie, P.; Li, S.; Tang, H.; Liu, H. The low TN:TP ratio, a cause or a result of Microcystis blooms? Water Res. 2003, 37, 2073–2080. [Google Scholar] [CrossRef]
- Ahn, C.-Y.; Chung, A.-S.; Oh, H.-M. Rainfall, phycocyanin, and N:P ratios related to cyanobacterial blooms in a Korean large reservoir. Hydrobiologia 2002, 474, 117–124. [Google Scholar] [CrossRef]
- Ayala, A.; Muñoz, M.F.; Argüelles, S. Lipid peroxidation: Production, metabolism, and signaling mechanisms of malondialdehyde and 4-hydroxy-2-nonenal. Oxidative Med. Cell. Longev. 2014, 2014, 360438. [Google Scholar] [CrossRef]
- Gaweł, S.; Wardas, M.; Niedworok, E.; Wardas, P. Malondialdehyde (MDA) as a lipid peroxidation marker. Wiad. Lek. 2004, 57, 453–455. [Google Scholar] [PubMed]
- Long, X.; Pan, J.; Wade, N.M.; Sun, Y.; Liu, Y.; Cheng, Y.; Wu, X. Effects of three feeding modes on the metabolism, antioxidant capacity, and metabolome of the adult male Chinese mitten crab Eriocheir sinensis. Aquac. Int. 2022, 30, 1101–1119. [Google Scholar] [CrossRef]
- Booth, S.J. Chryseobacterium Related Genera Infections. In Reference Module in Biomedical Sciences; Elsevier: Amsterdam, The Netherlands, 2014. [Google Scholar]
- Steinberg, J.P.; Burd, E.M. 238—Other Gram-Negative and Gram-Variable Bacilli. In Mandell, Douglas, and Bennett’s Principles and Practice of Infectious Diseases, 8th ed.; Bennett, J.E., Dolin, R., Blaser, M.J., Eds.; W.B. Saunders: Philadelphia, PA, USA, 2015; pp. 2667–2683.e2664. [Google Scholar]
- Lindström, K.; Mousavi, S.A. Effectiveness of nitrogen fixation in rhizobia. Microb. Biotechnol. 2020, 13, 1314–1335. [Google Scholar] [CrossRef]
- Carareto Alves, L.M.; de Souza, J.A.M.; Varani, A.d.M.; Lemos, E.G.d.M. The Family Rhizobiaceae. In The Prokaryotes: Alphaproteobacteria and Betaproteobacteria; Rosenberg, E., DeLong, E.F., Lory, S., Stackebrandt, E., Thompson, F., Eds.; Springer: Berlin/Heidelberg, Germany, 2014; pp. 419–437. [Google Scholar]
- Gorrasi, S.; Pasqualetti, M.; Franzetti, A.; Gonzalez-Martinez, A.; Gonzalez-Lopez, J.; Muñoz-Palazon, B.; Fenice, M. Persistence of Enterobacteriaceae Drawn into a Marine Saltern (Saline di Tarquinia, Italy) from the Adjacent Coastal Zone. Water 2021, 13, 1443. [Google Scholar] [CrossRef]
- Elsherief, M.F.; Mousa, M.M.; El-Galil, H.A.; Elbahy, E.F. Enterobacteriaceae associated with farm fish and retailed ones. Alex. J. Vet. Sci. 2014, 42, 99–104. [Google Scholar] [CrossRef]
- Burbank, D.R.; Shah, D.H.; LaPatra, S.E.; Fornshell, G.; Cain, K.D. Enhanced resistance to coldwater disease following feeding of probiotic bacterial strains to rainbow trout (Oncorhynchus mykiss). Aquaculture 2011, 321, 185–190. [Google Scholar] [CrossRef]
- LaPatra, S.E.; Kenneth, D.C.; Tyson, R.F. A probiotic Enterobacter sp. provides significant protection against Flavobacterium psychrophilum in rainbow trout (Oncorhynchus mykiss) after injection by two different routes. Aquaculture 2014, 433, 361–366. [Google Scholar] [CrossRef]
- Safari, R.; Adel, M.; Lazado, C.C.; Caipang, C.M.A.; Dadar, M. Host-derived probiotics Enterococcus casseliflavus improves resistance against Streptococcus iniae infection in rainbow trout (Oncorhynchus mykiss) via immunomodulation. Fish Shellfish Immunol. 2016, 52, 198–205. [Google Scholar] [CrossRef]
- Simón, R.; Docando, F.; Nuñez-Ortiz, N.; Tafalla, C.; Díaz-Rosales, P. Mechanisms Used by Probiotics to Confer Pathogen Resistance to Teleost Fish. Front. Immunol. 2021, 12, 653025. [Google Scholar] [CrossRef] [PubMed]
- Volk, T.J. Fungi. In Encyclopedia of Biodiversity, 2nd ed.; Levin, S.A., Ed.; Academic Press: Cambridge, MA, USA, 2013; pp. 624–640. [Google Scholar]
- Longcore, J.E.; Simmons, D.R. Chytridiomycota. In Handbook of the Protists; Springer: Berlin/Heidelberg, Germany, 2020; pp. 1–9. [Google Scholar]
- Summerbell, R.C. 20—Fungi Associated with Vertebrates. In Biodiversity of Fungi; Mueller, G.M., Bills, G.F., Foster, M.S., Eds.; Academic Press: Cambridge, MA, USA, 2004; pp. 451–465. [Google Scholar]
- Gams, W.; Diederich, P.; PÕ Ldmaa, K. 17—Fungicolous Fungi. In Biodiversity of Fungi; Mueller, G.M., Bills, G.F., Foster, M.S., Eds.; Academic Press: Cambridge, MA, USA, 2004; pp. 343–392. [Google Scholar]
- Arthurs, S.P.; Bruck, D.J. Chapter 24—Microbial Control of Nursery Ornamental and Landscape Plant Pests. In Microbial Control of Insect and Mite Pests; Lacey, L.A., Ed.; Academic Press: Cambridge, MA, USA, 2017; pp. 355–366. [Google Scholar]
- Hepperle, D.; Schlegel, I. Molecular Diversity of Eucaryotic Picoalgae from Three Lakes in Switzerland. Int. Rev. Hydrobiol. 2002, 87, 1–10. [Google Scholar] [CrossRef]
- Krienitz, L.; Bock, C.; Dadheech, P.K.; Pröschold, T. Taxonomic reassessment of the genus Mychonastes (Chlorophyceae, Chlorophyta) including the description of eight new species. Phycologia 2011, 50, 89–106. [Google Scholar] [CrossRef]
- Saadaoui, I.; Cherif, M.; Rasheed, R.; Bounnit, T.; Al Jabri, H.; Sayadi, S.; Hamadou, R.B.; Manning, S.R. Mychonastes homosphaera (Chlorophyceae): A promising feedstock for high quality feed production in the arid environment. Algal Res. 2020, 51, 102021. [Google Scholar] [CrossRef]
- Shi, X.; Li, S.; Fan, F.; Zhang, M.; Yang, Z.; Yang, Y. Mychonastes dominates the photosynthetic picoeukaryotes in Lake Poyang, a river-connected lake. FEMS Microbiol. Ecol. 2019, 95, fiy211. [Google Scholar] [CrossRef] [PubMed]
- Carvalho, L.R.; Cox, E.J.; Fritz, S.C.; Juggins, S.; Sims, P.A.; Gasse, F.; Battarbee, R.W. Standardizing the taxonomy of saline lake Cyclotella spp. Diatom Res. 1995, 10, 229–240. [Google Scholar] [CrossRef]
- Stoermer, E.F.; Julius, M.L. 15—Centric Diatoms. In Freshwater Algae of North America; Wehr, J.D., Sheath, R.G., Eds.; Academic Press: Cambridge, MA, USA, 2003; pp. 559–594. [Google Scholar]
- Oliva, M.G.; Lugo, A.; Alcocer, J.; Cantoral-Uriza, E.A. Cyclotella alchichicana sp. nov. from a saline Mexican lake. Diatom Res. 2006, 21, 81–89. [Google Scholar] [CrossRef]
- Yin, S.; Wang, D. The effects of different diet on metamorphosis and development of Eriocheir si nensis zoeae larvae. Acta Ecol. Sin. 2003, 23, 725–730. [Google Scholar]
- Traller, J.C.; Cokus, S.J.; Lopez, D.A.; Gaidarenko, O.; Smith, S.R.; McCrow, J.P.; Gallaher, S.D.; Podell, S.; Thompson, M.; Cook, O.; et al. Genome and methylome of the oleaginous diatom Cyclotella cryptica reveal genetic flexibility toward a high lipid phenotype. Biotechnol. Biofuels 2016, 9, 258. [Google Scholar] [CrossRef]
- Villanova, V.; Spetea, C. Mixotrophy in diatoms: Molecular mechanism and industrial potential. Physiol. Plant. 2021, 173, 603–611. [Google Scholar] [CrossRef] [PubMed]
- Passarge, J.; Huisman, J. Microbial Communities. In Encyclopedia of Ecology; Jørgensen, S.E., Fath, B.D., Eds.; Academic Press: Cambridge, MA, USA, 2008; pp. 2328–2334. [Google Scholar]
- Fuentes, J.L.; Garbayo, I.; Cuaresma, M.; Montero, Z.; González-Del-Valle, M.; Vílchez, C. Impact of Microalgae-Bacteria Interactions on the Production of Algal Biomass and Associated Compounds. Mar. Drugs 2016, 14, 100. [Google Scholar] [CrossRef] [PubMed]
- Hasan, K.N.; Banerjee, G. Recent studies on probiotics as beneficial mediator in aquaculture: A review. J. Basic Appl. Zool. 2020, 81, 53. [Google Scholar] [CrossRef]


Disclaimer/Publisher’s Note: The statements, opinions and data contained in all publications are solely those of the individual author(s) and contributor(s) and not of MDPI and/or the editor(s). MDPI and/or the editor(s) disclaim responsibility for any injury to people or property resulting from any ideas, methods, instructions or products referred to in the content. |
© 2023 by the authors. Licensee MDPI, Basel, Switzerland. This article is an open access article distributed under the terms and conditions of the Creative Commons Attribution (CC BY) license (https://creativecommons.org/licenses/by/4.0/).