Abstract
Utilizing renewable energy sources (RESs) to their full potential provides an opportunity for lowering carbon emissions and reaching a state of carbon neutrality. DC transmission lines have considerable potential for the integration of RESs. However, faults in DC transmission lines are challenging due to the lack of zero-crossing, large fault current magnitudes and a short rise time. This research proposes using a superconducting fault current limiter (SFCL) for effective current limitation in PV-based DC systems. To properly design an SFCL, the present work investigates the effect of copper stabilizer thickness on SFCL performance by using an accurate multilayer thermoelectric model. In the MATLAB/Simulink platform, the SFCL has been modeled and tested using different copper stabilizer thicknesses to demonstrate the effectiveness of the SFCL model in limiting the fault current and the impact of the copper stabilizer thickness on the SFCL’s performance. In total, four different thicknesses of the copper stabilizer were considered, ranging from 10 μm to 80 μm. The current limitation and voltage profile for each thickness were evaluated and compared with that without an SFCL. The developed resistance and temperature profiles were obtained for various thicknesses to clarify the mechanisms behind the stabilizer-thickness impact. An SFCL with an 80 µm copper stabilizer can reduce the fault current to 5.48 kA, representing 71.16% of the prospective current. In contrast, the fault current was reduced to 27.4% of the prospective current (2.11 kA) when using a 10 µm copper stabilizer.
1. Introduction
1.1. Background and Motivation
Several nations consider achieving a state of net-zero carbon dioxide (CO2) emissions by balancing CO2 emissions with their removal to be an environmental goal [1]. By 2050, the European Union intends to dramatically decrease greenhouse gas emissions towards net zero. This goal is essential to the European Green Deal [2] and the EU’s global climate action under the Paris Agreement [3]. In October 2020, Japan also established a long-term objective of net-zero emissions by 2050 [4]. Intending to combat climate change and reach net-zero emissions, the Kingdom of Saudi Arabia has created several projects and initiatives. The Saudi government has set a goal of producing 58.7 GW of renewable energy by 2030, focusing on photovoltaic (PV), wind, and concentrated solar power (CSP). This target was announced in January 2019 as part of the “Saudi Vision 2030” [5,6]. Moreover, from 2030, the “Saudi Green Initiative” will generate 50% of the Kingdom’s power from renewable energy sources to attain net-zero emissions by 2060 [7,8].
Despite the extensive use of renewable energy sources reducing greenhouse gas emissions, cleaning the air, and contributing to carbon neutrality, there are certain obstacles. The infrastructure for renewable energy productions on a massive scale, such as solar farms, is often positioned far from the demand regions because it requires a great deal of space [9]. Therefore, large power losses occur in AC transmission lines. Recent interest in DC transmission lines has increased because they may be technically and economically more viable for a variety of reasons [9,10]. For example, DC transmission cables are protected from the skin effect and have substantially lower corona losses, with the losses suffered by DC transmission lines over long distances far lower than those of AC transmission lines [9,10]. From the renewable energy integration viewpoint, DC transmission lines are both technically and economically feasible [11,12,13].
Nevertheless, there are several challenges regarding DC transmission lines, including the absence of zero-crossing points, large fault magnitudes, and rapid rising times [14,15]. When DC transmission lines are fed from PV-based DC systems, the fault response is much faster than that of wind-energy-based DC systems [16] due to the low inertia of PV-based DC systems fed by DC–DC converters [17]. This has driven a significant field of study to improve the effectiveness of DC transmission protection and shorten the working duration of current DC circuit breakers [18]. The fundamental issue with DC protection systems is the delay between the fault occurrence and its clearance, which may be overcome by using SFCLs [19,20]. The SFCL can provide a solution to the DC fault problem by allowing fast and effective current limitation [21,22,23]. Such benefits are considerable for the operation of DC transmission lines, where system reliability is essential.
1.2. Literature Review
Here, we present an overview of PV systems, followed by an introduction to DC power systems and transmission lines. Finally, superconductivity and the corresponding SFCL devices are discussed as an effective solution to limit the large fault currents encountered in DC systems.
The main factor responsible for climate change and global warming is greenhouse gas emissions [24,25]. The continuous increase in global temperature is regarded as one of the greatest threats to human health and future generations [26]. To tackle this issue, policy makers agreed to keep global warming below 2 °C at the COP 21st conference in Paris; this agreement is known as “The Paris Agreement” [27]. One solution to achieve this goal is reducing greenhouse gas emissions by deploying large-scale renewable power generation sources, including solar power generation [28]. There are two types of solar power generation: PV power generation and CSP generation. CSP generation use mirrors to collect the sun’s heat and send it to a receiver to generate steam. The steam is used by turbines connected to power generators to produce electricity. PV systems convert the sunlight to a DC current through PV cells [29]. PV systems have a simpler design and lower maintenance costs compared with CSP systems [30]. Several countries have long-term goals in generating their electricity from PV systems. The Kingdom of Saudi Arabia set a goal in 2019 to generate 40 GW from PV systems by 2030 [5,6]. By 2030, China’s long-term goal is to produce 25% of its needed energy from non-fossil energy sources, accumulating up to 1200 GW from wind and PV systems [31]. The United States’ renewable electricity generation represents 21%, and it intends to increase this percentage to 44% in 2050 [32]. In total, 51% of the targeted 44% will be produced by solar energy [32].
PV projects can be one of the primary methods to assist countries to achieve sustainability in general, as well as the sustainable development goals (SDGs) of the United Nations (UN). In 2015, all the UN members adopted the 2030 agenda for sustainable development, which included 17 SDGs [33]. PV renewable power generators can be associated with several of the 17 SDGs, including Affordable and Clean Energy (the 7th), Sustainable Cities and Communities (the 11th), and Climate Action (the 13th) [34]. SFCLs can support PV systems operations in achieving the three SDGs above. This research investigates the SFCL performance with PV-based DC systems. The SFCL can be used as a protection device with PV projects to give a solution to the DC faults problem in the PV systems by providing fast and effective current limitations. Such benefits are significant for the safe operation of PV systems and DC transmission lines, where system reliability is essential.
During the last few decades, DC power systems have gained a considerable amount of attention and investigation from academic and industrial institutes. The primary motivation behind this shift can be attributed to the spread of decentralized renewable energy sources, the rapid advancements in power electronics (including the increased accessibility of DC–DC converters), and the growing need for DC loads [35]. In comparison to AC power systems, DC ones are superior in terms of efficiency, reliability, and ease of control [14,36]. In addition, DC transmission lines could lessen the power losses that occur along transmission lines because they are immune to the skin effect, making them a potential candidate for reducing power loss. In the case of DC, there is also a discernible reduction in corona losses. Compared with AC transmission lines, DC transmission line losses are considerably smaller [9,10], especially over long distances. Despite the numerous advantages of DC power systems compared with AC ones, their faults represent the main challenge for grid operators due to the low inertia [22], large current magnitudes [16], and lack of zero-crossings [14,37], requiring fast protection schemes and specific means for fault current limitation. In this regard, an SFCL can provide an effective solution for such a challenge.
The term “superconductivity” was first developed using liquid helium cooling to obtain a temperature of 4.2 K [38] Currently, there are several applications for superconductivity in power systems. Superconductor tapes can be used to construct superconducting electric machines for future electric aircraft [39,40], and they can also be used to build superconducting magnetic energy storage (SMES) with numerous applications [41], including an SFCL. In normal operation, an SFCL has a negligible impedance due to the current flow into its superconducting layer. This layer is mostly yttrium barium copper oxide (YBCO). Under fault conditions, there is a sudden increase in the SFCL’s impedance due to the impedance increase in the superconducting layer, forcing a considerable portion of the current to be redirected to the stabilizer layer. This reduces fault damage and aids the protection system so DC circuit breakers can be securely operated [19]. SFCLs support the DC circuit breakers to operate at lower fault current levels, thus improving their operational durability [42,43]. The stabilizer layer strongly impacts the SFCL’s performance during fault scenarios [44]. An SFCL device is designed with yttrium barium copper oxide (YBCO) tapes [45]. YBCO tapes mainly consist of four layers: YBCO, Hastelloy substrate, silver, and copper stabilizers (Figure 1). During the superconducting state, the current passes through the YBCO layer. However, whenever a fault occurs, the current surges dramatically, increasing the temperature and resulting in a subsequent increase in the YBCO layer’s resistance, redirecting a portion of the current toward the copper stabilizers. Accordingly, the tape’s developed resistance during faults is highly dependent on how thick the stabilizer layer is, which is very important if the tape is used as a current-limiting device [46,47]. The impacts of different stainless steel stabilizer thicknesses on the SFCL’s performance were investigated in [46]. Different superconductor tapes have been tested to understand the impact of the stabilizer layer on the quench and recovery characteristics [44]. However, few studies that investigate the impact of the stabilizer layer thicknesses on the SFCL’s performance have been published, which is the main contribution of this paper.
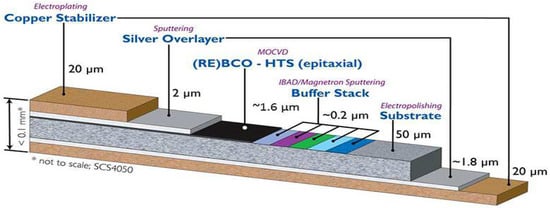
Figure 1.
SCS12050 superconducting tape materials [45].
1.3. Contribution
This paper investigates line-to-line faults in DC transmission lines fed from a solar farm (Figure 2). It proposes a multilayer thermoelectric SFCL model to understand the behavior of SFCL devices. The system performance is assessed when using SFCL with different copper stabilizer thicknesses and is compared with the base case without SFCL. The impact of the different copper stabilizer thicknesses on the current-limiting behavior of an SFCL is discussed.
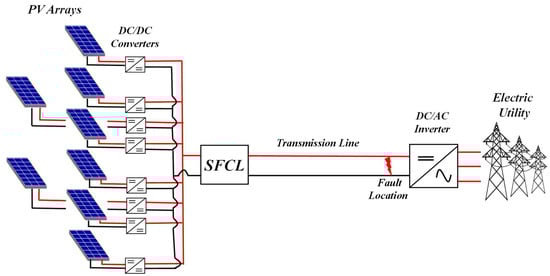
Figure 2.
Structure diagram of the DC-system-based solar farm.
1.4. Organization
The remaining study sections are as follows: a system description is provided in Section 2. DC system fault analysis is explained in Section 3. A detailed explanation of the superconducting fault current-limiter model is given in Section 4. Section 5 extensively analyzes the SFCL’s performance when using different copper stabilizer thicknesses based on several simulated case studies. Finally, Section 6 presents our concluding remarks from this study.
2. System Description
The considered system in the present study comprises three main elements: a community solar farm, DC transmission lines, and an SFCL device. The community solar farm has a capacity of 2 MW, and it consists of eight 250 kWp PV arrays, as shown in Figure 2. Each PV array’s output voltage is linked to the main DC bus via a DC/DC converter to boost the voltage from 600 V to 3 kVDC. An inverter is then used to connect the DC bus to the AC utility grid. The resistance and reactance of DC transmission lines represent the most important features in fault response. These parameters can be determined depending on the size, length, and material of the cable using Equations (1) and (2):
where the resistivity of copper is and equal to 1.7241 × 10⁻⁸ Ω.m at 20 °C, the length of the cable is L, and the cable’s cross-sectional area is A. The cable inductance is calculated as two parallel conductors, where one of the conductors is the return path for the other wire. is the length of the cable, which equals 2 km. The spacing distance of the wires is which equals 16 mm. is the wire diameter, which equals 13.82 mm. The permeability is represented by and The cable size was chosen to be 600 mm2 based on Equations (1) and (2) to ensure low voltage drop and low power losses. In this paper, the line-to-line fault occurs 2 km from the DC–DC converters. Based on Equations (1) and (2), the cable resistance from the DC–DC converters to the fault location is 114.8 mΩ, while its inductance is 0.44 mH. This system was modeled in a MATLAB/Simulink environment to analyze the fault response and investigate the impact of different copper stabilizer thicknesses on the SFCL’s performance. The SFCL device will be discussed in detail in Section 4.
3. DC System Fault Analysis
This section briefly introduces the DC fault analysis. The main variables that affect fault current characteristics in DC transmission lines are the voltage magnitude, the capacitance of the DC link, cable impedance, and grounding impedance [48,49]. DC faults in bipolar systems often fall into one of two categories: line-to-ground or line-to-line faults.
The most dangerous category is the line-to-line fault because of the low line resistance between the two lines and the high voltage between them. The line-to-ground fault is less dangerous, although it commonly occurs in DC systems [50,51]. The line-to-line fault, which has a greater fault current and presents a significant challenge for the used switchgear, is the subject of this study. The schematic in Figure 3 depicts a line-to-line fault for a single PV array [52]. More details and explanations pertaining to the DC fault analysis can be found in [14,15].
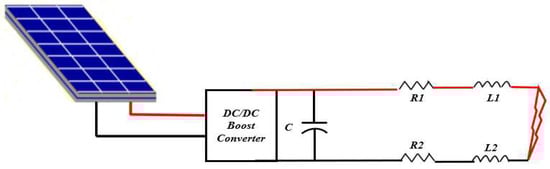
Figure 3.
Equivalent circuit of a line-to-line fault on the terminals of a DC–DC boost converter connecting a single PV array [52].
4. Numerical Model
In the event of an electrical fault, an SFCL can reduce the fault current within milliseconds using an internal mechanism, allowing the circuit breakers and switchgear to continue functioning safely [43]. Resistive SFCLs (r-SFCLs) and inductive SFCLs (i-SFCLs) are the two main types of SFCLs. Because the i-SFCL is heavier, more complicated, and more expensive than the r-SFCL [53,54], this paper will focus on the r-SFCL.
R-SFCLs can be designed in different configurations, such as bifilar or multifilar pancake coil types, to attain non-inductive structures where magnetic field cancelation is achieved [55,56]. When magnetic field cancelation is achieved, the inductance element is reduced to a negligible value, and the resistive element becomes the r-SFCL’s dominant element [47,57].
The r-SFCL’s behavior is governed by the superconductor tapes used in its construction. The r-SFCL device considered in this study is made of YBCO wires (SCS12050, made by SuperPower Inc.) [45] that are cooled to 77 K by LN2. Figure 1 shows the structure of the superconductor tape layers, including their material and size. The r-SFCL’s behavior is mainly controlled by the superconductor tape’s critical current density and critical temperature. For the r-SFCL to operate in a superconducting state, the current (I) and temperature (T) must be less than the superconductor tape’s critical current (Ic) and temperature , respectively. In the superconducting state, the current flows through the YBCO layer, exhibiting nearly zero resistivity.
Once the current exceeds the critical current, the YBCO layer’s resistivity sharply increases, forcing the current to be diverted to the tape’s other layers (primarily the copper stabilizer). Figure 4 shows an r-SFCL device’s electrical representation using SCS12050 superconducting tapes. Equations (3)–(9) are used to compute the electrical resistance of the superconductor tape’s layers. The YBCO layer’s resistivity can be calculated using Equation (3), where is the standard electrical field and equal to 1 V/cm for superconductors, and the N values for the YBCO tapes vary from 21 to 30 [58]. Equation (3) is applicable when the current density increases beyond the critical current density of the tape (Ic), while the temperature is still below the critical temperature (Tc), which equals 93 K. The critical current density varies with temperature and may be computed using (4), where is the critical current density at 77 K, the boiling temperature of LN2, and coolant. The exponent is the density exponent and is equal to 1.5 [59]. Equation (4) is only applicable for . When the temperature rises above its critical threshold, the YBCO layer’s resistance increases, forcing most of the current to be redirected to other layers, mostly the copper layers. Equations (5)–(7) can be used to determine the copper, silver, and Hastelloy layers’ resistivities with respect to the temperature, respectively, where is equal to 0.0038 per Kelvin degree, which is the temperature coefficient. The r-SFCL resistance can be determined using Equations (8) and (9), where is the tape length and stands for the cross-sectional areas of each layer.
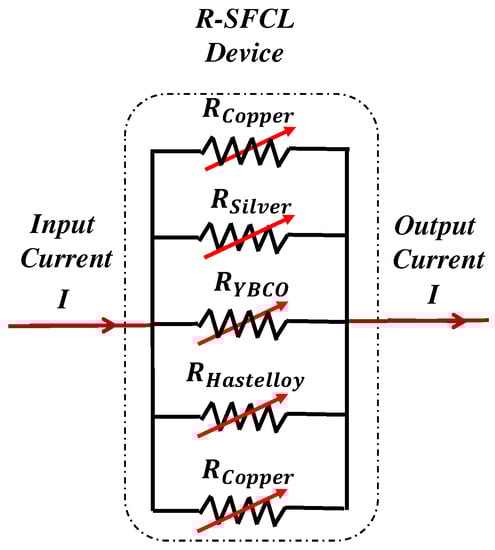
Figure 4.
R-SFCL device’s electrical representation using SCS12050 superconducting tapes.
Because each layer has its own change in electrical resistivity with temperature, obtaining an accurate resistance value for the complete r-SFCL necessitates the precise calculation of the r-SFCL temperature. The superconductor tape’s temperature is computed using Equation (10), where the tape’s net power is represented by 𝑄𝑠𝑐 and can be computed using Equation (11). Cp represents the heat capacity of the materials’ layers presented by Cp. is the LN2 boiling point temperature, which equals 77 K. and , respectively, denote the power consumed in the superconducting tape and the energy absorbed by the cooler.
When a fault is cleared, reduces the temperature increases produced by the fault and retrieves the tape’s superconductive state. and are calculated in Equations (12) and (13), respectively, where A is the surface area of the SFCL in contact with LN2 coolant. Different methods exist for creating a completely exposed SFCL area, which are explored in papers [56,60]. The heat transfer coefficient h depends on the temperature difference between the tape’s outside surface and the LN2 coolant, in addition to the pressure and heat capacity of LN2. Figure 5 is a flowchart illustrating the behavior of the r-SFCL device with respect to current and temperature.
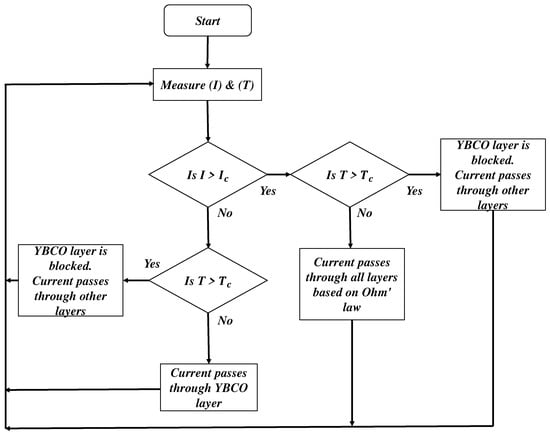
Figure 5.
Flowchart demonstrating the behavior of the r-SFCL device concerning current and temperature.
This article uses a 12 mm wide and 0.1 mm thick YBCO tape (SCS12050) [45]. In total, four types of r-SFCLs are investigated in this work: the first contains an 80 µm copper stabilizer, and the second has a 40 µm copper stabilizer to increase r-SFCL resistivity, as shown in Figure 1. The third and fourth have copper stabilizers of 20 and 10 µm, respectively. The tape’s critical current is 300 A. Thus, to construct an r-SFCL with a critical current rating of 900 A, three parallel tapes are used. Table 1 shows the r-SFCL parameters.
where

Table 1.
The design parameters of the r-SFCLs.
5. Simulation Results and Discussion
The main three elements of this study, including the community solar farm, DC transmission lines, and r-SFCL device, as illustrated in Figure 2, have been simulated to explore the fault behavior of a solar farm’s transmission lines and test the performance of the SFCLs with different copper stabilizer thicknesses. The line-to-line fault occurs 2 km from the DC–DC converters. Based on Equations (1) and (2), the cable resistance from the DC–DC converters to the fault location is 114.8 mΩ, while its inductance is 0.44 mH. Each DC–DC converter’s capacitor is set to be 0.5 mF.
Four case studies were conducted and compared in this section to show the impact of the copper stabilizer thickness on the SFCL’s performance. The first case study was conducted with an 80 µm copper stabilizer. Case study 2, a 40 µm copper stabilizer, was chosen because it is the same as the original tape, available commercially from SuperPower Inc. (NewYork, NY, USA). Then, the SFCL was tested with 20 and 10 µm copper stabilizers in case studies 3 and 4, respectively. A line-to-line fault was applied at the specified fault location at the instant of 1.0 sec for a duration of 10 msec.
5.1. Case Studies
5.1.1. Case Study 1 (80 µm Copper Stabilizer)
The fault current of the DC transmission lines is depicted in Figure 6a, with that of an r-SFCL with an 80 µm copper stabilizer compared with that obtained without an r-SFCL. The blue line represents the fault current without an r-SFCL, which exhibited a peak value up to 7.7 kA due to the discharge of the converters’ capacitors. However, the r-SFCL with the 80 µm copper stabilizer could limit this value to 5.48 kA, representing a percentage reduction of 28.8%, as illustrated by the red dashed line in the same figure. Figure 6b shows the voltage drop for the DC transmission lines with the 80 µm copper stabilizer r-SFCL and without an r-SFCL.
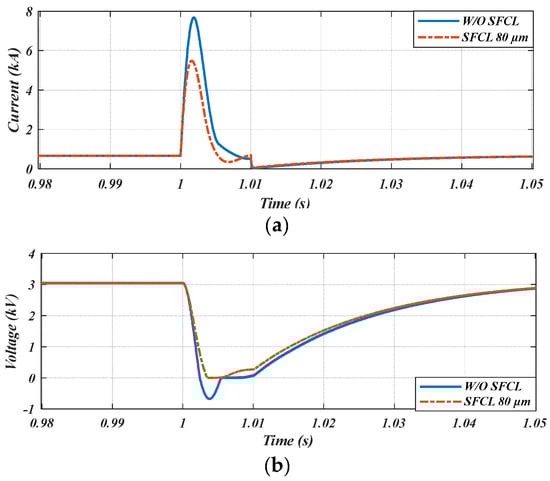
Figure 6.
Fault response without and with r-SFCL with 80 µm copper stabilizer: (a) the fault current; (b) the voltage drop.
5.1.2. Case Study 2 (40 µm Copper Stabilizer)
The fault current of the DC transmission lines is depicted in Figure 7a, with that of an r-SFCL with a 40 µm copper stabilizer compared with that obtained without an r-SFCL. This copper stabilizer thickness enabled the r-SFCL to limit the fault current to 4.29 kA, representing a percentage reduction of 44.28%. The increase in the current-limiting capacity was positively reflected in the voltage drop, as shown in Figure 7b. The voltage dropped to almost 500 V with the r-SFC, whereas it dropped to 0 without an r-SFCL.
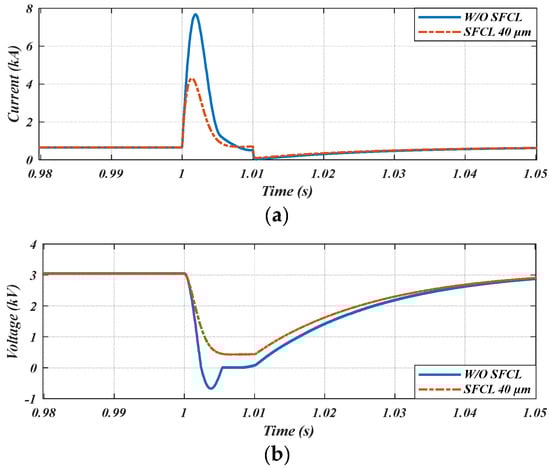
Figure 7.
Fault response without and with r-SFCL with 40 µm copper stabilizer: (a) the fault current; (b) the voltage drop.
5.1.3. Case Study 3 (20 µm Copper Stabilizer)
The fault current of the DC transmission lines is depicted in Figure 8a, with that of an r-SFCL with a 20 µm copper stabilizer compared with that obtained without an r-SFCL. The reduction in the copper stabilizer thickness to 20 µm resulted in further improvements in the current-limiting capacity of the r-SFCL, where the maximum fault current was limited to only 3.07 kA, representing a percentage reduction of 60.12% compared with the prospective fault case. Figure 8b shows the voltage drop for the DC transmission lines with the 20 µm copper stabilizer r-SFCL and without an r-SFCL. The maximum voltage drop with the r-SFCL in this case study was lower than that obtained in previous case studies, where the minimum voltage attained was 1 kV.
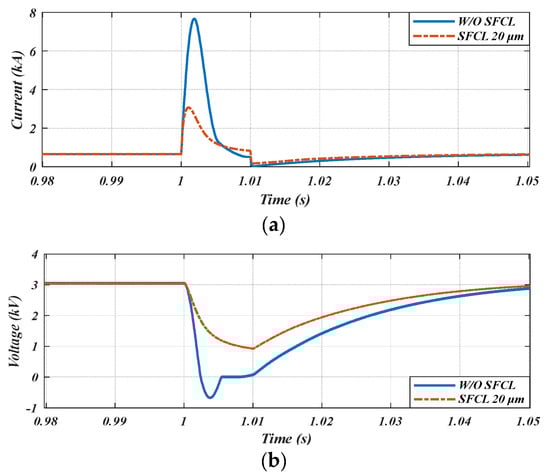
Figure 8.
Fault response without and with r-SFCL with 20 µm copper stabilizer: (a) the fault current; (b) the voltage drop.
5.1.4. Case Study 4 (10 µm Copper Stabilizer)
The fault current of the DC transmission lines is depicted in Figure 9a, with the r-SFCL with a 10 µm copper stabilizer compared with that obtained without an r-SFCL. The r-SFCL with the 10 µm copper stabilizer could limit the fault current to 2.11 kA, representing a percentage reduction of 72.59%. Figure 9b shows the corresponding voltage drop for the DC transmission lines. The maximum voltage drop with the r-SFCL was about 1.2 kV, where the voltage attained a value of 1.8 kV during the fault.
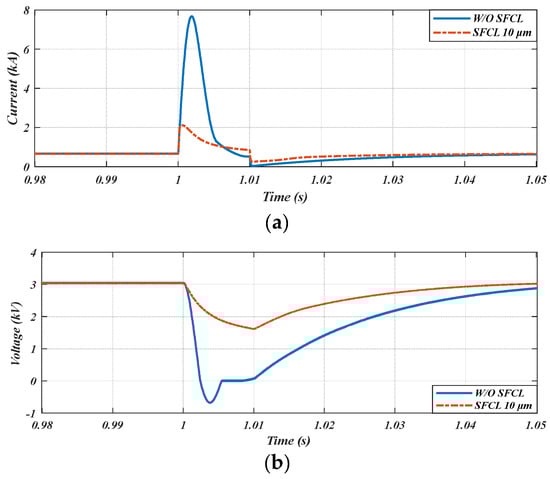
Figure 9.
Fault response without and with r-SFCL with 10 µm copper stabilizer: (a) the fault current; (b) the voltage drop.
5.2. Discussion and Comparison
The fault currents and the voltage drops in the four different case studies with and without the r-SFCL are compared in Figure 10a and Figure 10b, respectively. The highest fault-current-limiting capacity and the lowest voltage drop were observed when using an r-SFCL with the 10 µm stabilizer, while the one with the 80 µm stabilizer showed the worst performance. Of all the case studies, the highest fault current occurred with the 80 µm copper stabilizer and reached 5.48 kA (71.16% of the prospective current), as shown by the red line in Figure 10a, and the voltage dropped to 0 within 3 msec. However, with the r-SFCL with the 10 µm copper stabilizer (the green line) in Figure 10a, the peak fault current and the minimum attained voltage were 2.11 kA and 1.8 kV, respectively. The minimum voltage was reached after the complete fault duration of 10 msec compared with 3 msec in the case of the 80 µm stabilizer thickness. To understand the behavior of the different copper stabilizers and the impact of the thicknesses on the fault-current-limiting capacity and r-SFCLs temperatures, Figure 11a shows the amount of current which passed through one of the two copper stabilizer layers in the r-SFCL during the fault. The highest amount of current passed through the 40 µm copper stabilizer, about 2.6 kA, representing 47.4% of the overall fault current (5.48 kA). In contrast, with the 5 µm copper stabilizer, only 0.78 kA passed through the stabilizer. The 0.78 kA represents 36.9% of the overall fault current (2.11 kA). The lower the current passing through the stabilizer layer, the higher the current passing through the other r-SFCL layers, including silver and Hastelloy. This causes a higher temperature and greater resistance for the whole r-SFCL, thereby enhancing the current percentage limitation. Figure 11b shows the resistance of one copper stabilizer with respect to the temperature. The highest resistance for the 5 µm copper stabilizer was 3.1 Ω before the fault, and peaked at 5.12 Ω during the fault. On the other hand, the lowest resistance value was 0.3 Ω before the fault and peaked at 0.35 Ω during the fault for the 40 µm copper stabilizer. Figure 11c shows the temperature of the four different r-SFCLs. The highest peak temperature occurred with the 10 µm copper stabilizer at 92 K. The increased temperature in the case of 10 µm copper stabilizer results in the greater developed resistance of the whole SFCL. In contrast, the lowest peak temperature occurred with the 80 µm copper stabilizer at 83 K. Based on Figure 11a–c, there is a clear trade-off between the thickness of the copper stabilizer, the ability to limit fault currents, and the r-SFCL’s temperature.
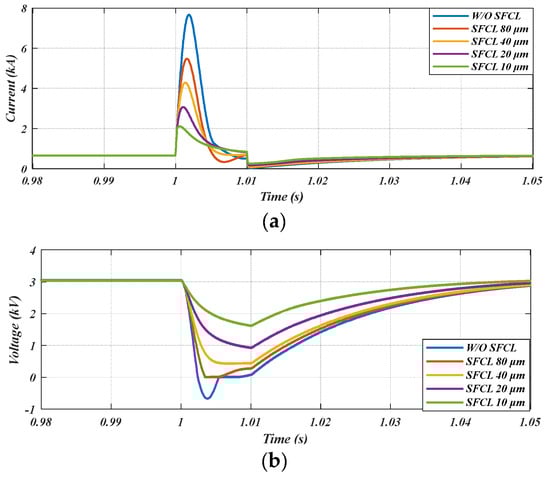
Figure 10.
(a) The fault currents for the five cases; (b) the DC-link voltage drops for the five cases.
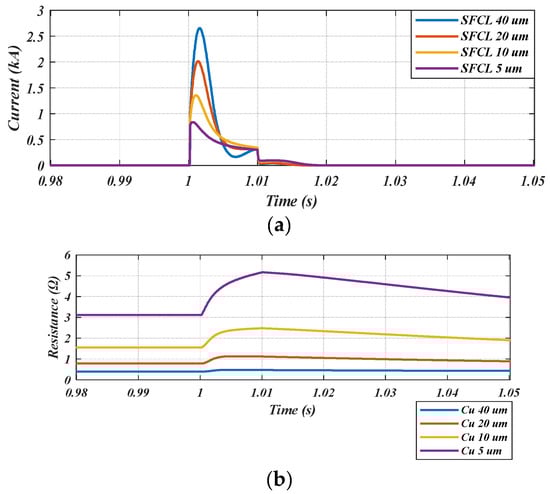
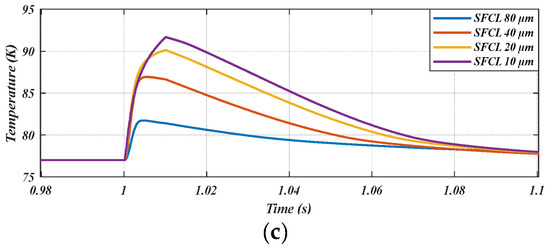
Figure 11.
(a) The magnitude of currents passing through the copper stabilizers; (b) the resistance of the copper stabilizers with respect to temperature; (c) the temperature of the r-SFCLs.
6. Conclusions
This paper investigated the impact of different copper stabilizer thicknesses on r-SFCL performance during a line-to-line fault in DC transmission lines connected to a community solar farm. Without the r-SFCL, the discharge of the DC–DC converters’ capacitors resulted in a high fault current magnitude of 7.7 kA, which exceeds the rated current by 11 times. The r-SFCL with the 80 µm copper stabilizer was able to reduce the fault current to 5.48 kA, which is 71.16% of the prospective current. In contrast, the fault current was reduced to 27.4% of the prospective current (only 2.11 kA) with the 10 µm copper stabilizer r-SFCL. There is a clear trade-off between the thickness of the copper stabilizer, the capacity to limit fault currents, and the r-SFCL’s temperature. When the copper stabilizer layer was the smallest, the fault-current-limiting capacity was the maximum, but the temperature was the highest. Based on the results, the copper stabilizer thickness strongly impacts the r-SFCL’s performance. The copper stabilizer’s sizing should be determined based on the initial fault analysis for the system to ensure a high fault-current-limiting capacity without burning the r-SFCL. SFCLs proved their viability for use in solar farm DC transmission lines to mitigate the fault current during fault situations, allowing circuit breakers and other equipment to work safely. This article investigated the impact of copper stabilizer thicknesses on r-SFCL performance. Another factor that can affect the performance of the r-SFCL is the shunt resistor size. In future work, the impact of the shunt resistors on the r-SFCL’s performance will be investigated.
Author Contributions
Conceptualization, H.A., X.P. and D.-E.A.M.; methodology, H.A. and I.A.; software, H.A, M.K. and W.S.; validation, X.P., W.S., D.-E.A.M. and X.Z.; formal analysis, H.A., A.A., M.A. and X.Z.; resources, H.A. and W.S.; writing—original draft preparation, H.A.; writing—review and editing, X.P., M.K., W.S, I.A., A.A., M.A. and D.-E.A.M.; supervision, X.P. and D.-E.A.M. All authors have read and agreed to the published version of the manuscript.
Funding
This research has been funded by the Scientific Research Deanship at the University of Ha’il-Saudi Arabia, through project number RG-21 087.
Institutional Review Board Statement
Not applicable.
Informed Consent Statement
Not applicable.
Data Availability Statement
Not applicable.
Conflicts of Interest
The authors declare no conflict of interest.
References
- Iqbal, N.; Abbasi, K.R.; Shinwari, R.; Guangcai, W.; Ahmad, M.; Tang, K. Does exports diversification and environmental innovation achieve carbon neutrality target of OECD economies? J. Environ. Manag. 2021, 291, 112648. [Google Scholar] [CrossRef] [PubMed]
- European Commission. A European Green Deal. Available online: https://ec.europa.eu/info/strategy/priorities-2019-2024/european-green-deal_en (accessed on 24 February 2023).
- European Commission. 2050 Long-Term Strategy. Available online: https://ec.europa.eu/clima/eu-action/climate-strategies-targets/2050-long-term-strategy_en (accessed on 24 February 2023).
- Kato, E.; Kurosawa, A. Role of negative emissions technologies (NETs) and innovative technologies in transition of Japan’s energy systems toward net-zero CO2 emissions. Sustain. Sci. 2021, 16, 463–475. [Google Scholar] [CrossRef]
- Government of Saudi Arabia. Vision 2030 Kingdom of Saudi Arabia. 2020; pp. 1–85. Available online: https://vision2030.gov.sa/download/file/fid/417 (accessed on 24 February 2023).
- Kingdom of Saudi Arabia Renewable Energy Project Development Office. Saudi Arabia National Renewable Energy Program. 2019. Available online: https://www.ief.org/_resources/files/events/third-ief-eu-energy-day/turki-al-shehri-24.02-repdo---ief_riyadh_v2-2.pdf (accessed on 24 February 2023).
- Saudi Green Initiative. 2021. Available online: https://saudigreeninitiative.org/ (accessed on 24 February 2023).
- Saudi Arabia Commits to Net Zero Emissions by 2060. 2021. Available online: https://www.bbc.com/news/world-middle-east-58955584#:~:text=The world’s biggest oil exporter,130bn) to Reach the Goal (accessed on 24 February 2023).
- Andersen, A.D. No transition without transmission: HVDC electricity infrastructure as an enabler for renewable energy? Environ. Innov. Soc. Transit. 2014, 13, 75–95. [Google Scholar] [CrossRef]
- Ryndzionek, R.; Sienkiewicz, Ł. Evolution of the HVDC link connecting offshore wind farms to onshore power systems. Energies 2020, 13, 1914. [Google Scholar] [CrossRef]
- Zhuo, Z.; Zhang, N.; Yang, J.; Kang, C.; Smith, C.; O’Malley, M.J.; Kroposki, B. Transmission Expansion Planning Test System for AC/DC Hybrid Grid with High Variable Renewable Energy Penetration. IEEE Trans. Power Syst. 2020, 35, 2597–2608. [Google Scholar] [CrossRef]
- Ludin, G.A.; Nakadomari, A.; Yona, A.; Mikkili, S.; Rangarajan, S.S.; Collins, E.R.; Senjyu, T. Technical and Economic Analysis of an HVDC Transmission System for Renewable Energy Connection in Afghanistan. Sustainability 2022, 14, 1468. [Google Scholar] [CrossRef]
- Liang, X.; Abbasipour, M. HVDC Transmission and its Potential Application in Remote Communities: Current Practice and Future Trend. IEEE Trans. Ind. Appl. 2022, 58, 1706–1719. [Google Scholar] [CrossRef]
- Beheshtaein, S.; Cuzner, R.M.; Forouzesh, M.; Savaghebi, M.; Guerrero, J.M. DC Microgrid Protection: A Comprehensive Review. IEEE J. Emerg. Sel. Top. Power Electron. 2019; early access. [Google Scholar] [CrossRef]
- Alafnan, H. Turboelectric Aircraft DC Network Fault Analysis and Protection Solution Using Superconducting Fault Current Limiters. Ph.D. Thesis, University of Bath, Bath, UK, 2021. [Google Scholar]
- Nahas, E.W.; Abd el-Ghany, H.A.; Mansour, D.E.A.; Eissa, M.M. Extensive analysis of fault response and extracting fault features for DC microgrids. Alexandria Eng. J. 2021, 60, 2405–2420. [Google Scholar] [CrossRef]
- Tan, C.; Teng, X.; Ding, Q.; Xiao, X.; Lan, Q.; Cao, R.; Chang, L. Synergistic balancing control for low-inertia power systems with high PV penetration: Tibet as a case study. Energy Rep. 2022, 8, 2924–2935. [Google Scholar] [CrossRef]
- Pei, X.; Smith, A.C.; Cwikowski, O.; Barnes, M. Hybrid DC circuit breaker with coupled inductor for automatic current commutation. Int. J. Electr. Power Energy Syst. 2020, 120, 106004. [Google Scholar] [CrossRef]
- Alafnan, H.; Elshiekh, M.; Pei, X.; Altouq, S.; Fazeli, S.M.; Sun, Q.; Zhang, M.; Yuan, W. Application of SMES-FCL in Electric Aircraft for Stability Improvement. IEEE Trans. Appl. Supercond. 2019, 29, 5000906. [Google Scholar] [CrossRef]
- Alafnan, H.; Zeng, X.; Pei, X.; Khedr, M.; Zhang, M.; Yuan, W. Analysing Faults and SFCL Response in Electric Aircraft. J. Phys. Conf. Ser. 2020, 1559, 012103. [Google Scholar] [CrossRef]
- Mansour, D.E.A.; Yehia, D.M. Analysis of 3-phase superconducting fault current limiters in power systems with inhomogeneous quenching. IEEE Trans. Appl. Supercond. 2013, 23, 5602605. [Google Scholar] [CrossRef]
- Yehia, D.M.; Taha, I.B.M. Application of Superconducting Fault Current Limiter as a Virtual Inertia for DC Distribution Systems. IEEE Access 2021, 9, 135384–135391. [Google Scholar] [CrossRef]
- Elshiekh, M.; Elwakeel, A.; Venuturumilli, S.; Alafnan, H.; Pei, X.; Zhang, M.; Yuan, W. Utilising SMES-FCL to improve the transient behaviour of a doubly fed induction generator DC wind system. Int. J. Electr. Power Energy Syst. 2021, 131, 107099. [Google Scholar] [CrossRef]
- NASA. The Causes of Climate Change. 2021. Available online: https://climate.nasa.gov/causes/ (accessed on 24 February 2023).
- Al-Ghussain, L. Global warming: Review on driving forces and mitigation. Environ. Prog. Sustain. Energy 2019, 38, 13–21. [Google Scholar] [CrossRef]
- Hoegh-Guldberg, O.; Jacob, D.; Bindi, M.; Brown, S.; Camilloni, I.; Diedhiou, A.; Djalante, R.; Ebi, K.; Engelbrecht, F.; Guiot, J.; et al. Chapter 3: Impacts of 1.5 °C global warming on natural and human systems. In Global Warming of 1.5 °C; IPCC Secretariat: Geneva, Switzerland, 2018; pp. 175–311. [Google Scholar]
- Delbeke, J.; Runge-Metzger, A.; Slingenberg, Y.; Werksman, J. The paris agreement. In Towards a Climate-Neutral Europe; Routledge: Abington, UK, 2019; pp. 24–45. [Google Scholar] [CrossRef]
- Hansen, K.; Breyer, C.; Lund, H. Status and perspectives on 100% renewable energy systems. Energy 2019, 175, 471–480. [Google Scholar] [CrossRef]
- Nwaigwe, K.N.; Mutabilwa, P.; Dintwa, E. An overview of solar power (PV systems) integration into electricity grids. Mater. Sci. Energy Technol. 2019, 2, 629–633. [Google Scholar] [CrossRef]
- Ramachandran, T.; Mourad, A.H.I.; Hamed, F. A Review on Solar Energy Utilization and Projects: Development in and around the UAE. Energies 2022, 15, 3754. [Google Scholar] [CrossRef]
- Song, D.; Pei, H.; Liu, Y.; Wei, H.; Yang, S.; Hu, S. Review on Legislative System of Photovoltaic Industry Development in China. Energies 2022, 15, 306. [Google Scholar] [CrossRef]
- AEO. U.S. Electricity Generation and Shares from Selected Fuels and Renewable Sources; AEO: Brussels, Belgium, 2021; Volume 2021. [Google Scholar]
- General, Assembly. United Nations Transforming our World: The 2030 Agenda for Sustainable Development; Division for Sustainable Development Goals: New York, NY, USA, 2015. [Google Scholar]
- Marques Lameirinhas, R.A.; Torres, J.P.N.; de Melo Cunha, J. A Photovoltaic Technology Review: History, Fundamentals and Applications. Energies 2022, 15, 1823. [Google Scholar] [CrossRef]
- Sakkas, S. Control of a DC Microgrid. Master’s Thesis, Delft University of Technology, Delft, The Netherlands, 2018. [Google Scholar]
- Rodriguez-Diaz, E.; Vasquez, J.C.; Guerrero, J.M. Intelligent DC Homes in Future Sustainable Energy Systems: When efficiency and intelligence work together. IEEE Consum. Electron. Mag. 2016, 5, 74–80. [Google Scholar] [CrossRef]
- Cuzner, R.M.; Venkataramanan, G. The status of DC micro-grid protection. In Proceedings of the 2008 IEEE Industry Applications Society Annual Meeting, Edmonton, AB, Canada, 5–9 October 2008; pp. 1–8. [Google Scholar] [CrossRef]
- Van Delft, D.; Kes, P. The discovery of superconductivity. Phys. Today 2010, 63, 38–43. [Google Scholar] [CrossRef]
- Weng, F.; Zhang, M.; Elwakeel, A.; Lan, T.; McNeill, N.; Yuan, W. Transient Test and AC Loss Study of a Cryogenic Propulsion Unit for All Electric Aircraft. IEEE Access 2021, 9, 59628–59636. [Google Scholar] [CrossRef]
- Yazdani-Asrami, M.; Zhang, M.; Yuan, W. Challenges for developing high temperature superconducting ring magnets for rotating electric machine applications in future electric aircrafts. J. Magn. Magn. Mater. 2021, 522, 167543. [Google Scholar] [CrossRef]
- Alafnan, H.; Pei, X.; Khedr, M.; Alsaleh, I.; Albaker, A.; Alturki, M.; Mansour, D.-E.A. The Possibility of Using Superconducting Magnetic Energy Storage/Battery Hybrid Energy Storage Systems Instead of Generators as Backup Power Sources for Electric Aircraft. Sustainability 2023, 15, 1806. [Google Scholar] [CrossRef]
- Elshiekh, M. Increasing Wind Energy Integration into Power Grids Using Multifunctional Superconducting Devices Design. Ph.D. Thesis, University of Bath, Bath, UK, 2020. [Google Scholar]
- Pei, X.; Smith, A.C.; Barnes, M. Superconducting Fault Current Limiters for HVDC Systems; Elsevier: Amsterdam, The Netherlands, 2015; Volume 80. [Google Scholar]
- Xiang, B.; Junaid, M.; Gao, L.; Liu, Z.; Geng, Y.; Wang, J.; Yanabu, S. Influencing Factors on Quench and Recovery of YBCO Tapes for DC Superconducting Fault Current Limiter. IEEE Trans. Appl. Supercond. 2019, 29, 5600806. [Google Scholar] [CrossRef]
- Superpower Inc. 2G HTS Wire Specification. Available online: https://www.superpower-inc.com/specification.aspx (accessed on 24 February 2023).
- Xiang, B.; Wang, W.; Li, H.; Gao, L.; Liu, Z.; Geng, Y.; Wang, J.; Tu, Y. Study on the influencing factors to reduce the recovery time of superconducting tapes and coils for the DC superconducting fault current limiter applications. High Volt. 2022, 7, 483–495. [Google Scholar] [CrossRef]
- Song, W.; Pei, X.; Alafnan, H.; Xi, J.; Zeng, X.; Yazdani-Asrami, M.; Xiang, B.; Liu, Z. Experimental and Simulation Study of Resistive Helical HTS Fault Current Limiters: Quench and Recovery Characteristics. IEEE Trans. Appl. Supercond. 2021, 31, 5–10. [Google Scholar] [CrossRef]
- Chang, B. DC Protection of Multi-Terminal VSC-HVDC Systems. Ph.D. Thesis, University of Manchester, Manchester, UK, 2016. [Google Scholar]
- Jones, C.E.; Norman, P.J.; Sztykiel, M.; Pena Alzola, R.; Burt, G.M.; Galloway, S.J.; Kawashita, L.F.; Hallett, S.R. Electrical and Thermal Effects of Fault Currents in Aircraft Electrical Power Systems with Composite Aerostructures. IEEE Trans. Transp. Electrif. 2018, 4, 660–670. [Google Scholar] [CrossRef]
- Li, X.; Song, Q.; Liu, W.; Rao, H.; Xu, S.; Li, L. Protection of nonpermanent faults on DC overhead lines in MMC-based HVDC systems. IEEE Trans. Power Deliv. 2013, 28, 483–490. [Google Scholar] [CrossRef]
- Monadi, M.; Zamani, M.A.; Candela, J.I.; Luna, A.; Rodriguez, P. Protection of AC and DC distribution systems Embedding distributed energy resources: A comparative review and analysis. Renew. Sustain. Energy Rev. 2015, 51, 1578–1593. [Google Scholar] [CrossRef]
- Alafnan, H. Fault Analysis and Protection Solution for DC Transmission Lines of Solar Farms Using Superconducting Fault Current Limiters. In Proceedings of the 2022 5th International Conference on Power Electronics and Their Applications (ICPEA), Hail, Saudi Arabia, 29–31 March 2022; p. 5. [Google Scholar]
- De Sousa, W.T.B.; Dias, R.; Da Silva, F.A.; Polasek, A.; De Andrade, R. Comparison between the fault current limiting performance of Bi-2212 bifilar components and 2G YBCO coils. IEEE Trans. Appl. Supercond. 2013, 23, 2–6. [Google Scholar] [CrossRef]
- Naderi, S.; Davari, P.; Zhou, D.; Negnevitsky, M.; Blaabjerg, F. A Review on Fault Current Limiting Devices to Enhance the Fault Ride-Through Capability of the Doubly-Fed Induction Generator Based Wind Turbine. Appl. Sci. 2018, 8, 2059. [Google Scholar] [CrossRef]
- Elshiekh, M.E.; Mansour, D.-E.A.; Azmy, A.M. Improving Fault Ride-Through Capability of DFIGBased Wind Turbine Using Superconducting Fault Current Limiter. IEEE Trans. Appl. Supercond. 2012, 23, 5601204. [Google Scholar] [CrossRef]
- Xiang, B.; Gao, L.; Liu, Z.; Geng, Y.; Wang, J. Short-circuit fault current-limiting characteristics of a resistive-type superconducting fault current limiter in DC grids. Supercond. Sci. Technol. 2020, 33, 024005. [Google Scholar] [CrossRef]
- Bock, J.; Hobl, A.; Schramm, J.; Kramer, S.; Janke, C. Resistive superconducting fault current limiters are becoming a mature technology. IEEE Trans. Appl. Supercond. 2015, 25, 5600604. [Google Scholar] [CrossRef]
- Nam, K.; Lee, C.; Park, D.K.; Ko, T.K.; Seok, B.Y. Thermal and electrical analysis of coated conductor under AC over-current. IEEE Trans. Appl. Supercond. 2007, 17, 1923–1926. [Google Scholar] [CrossRef]
- Elshiekh, M.; Zhang, M.; Ravindra, H.; Chen, X.; Venuturumilli, S.; Huang, X.; Schoder, K.; Steurer, M.; Yuan, W. Effectiveness of Superconducting Fault Current Limiting Transformers in Power Systems. IEEE Trans. Appl. Supercond. 2018, 28, 5601607. [Google Scholar] [CrossRef]
- Pérez-Chávez, J.J.; Trillaud, F.; Castro, L.M.; Quéval, L.; Polasek, A.; De Andrade Junior, R. Generic Model of Three-Phase (RE)BCO Resistive Superconducting Fault Current Limiters for Transient Analysis of Power Systems. IEEE Trans. Appl. Supercond. 2019, 29, 5601811. [Google Scholar] [CrossRef]


Disclaimer/Publisher’s Note: The statements, opinions and data contained in all publications are solely those of the individual author(s) and contributor(s) and not of MDPI and/or the editor(s). MDPI and/or the editor(s) disclaim responsibility for any injury to people or property resulting from any ideas, methods, instructions or products referred to in the content. |
© 2023 by the authors. Licensee MDPI, Basel, Switzerland. This article is an open access article distributed under the terms and conditions of the Creative Commons Attribution (CC BY) license (https://creativecommons.org/licenses/by/4.0/).