Article

Risk Management of Supply Chain Green Finance Based on Sustainable Ecological Environment

School of Business, Jiangnan University, Wuxi 214122, China
Sustainability 2023, 15(9), 7707; https://doi.org/10.3390/su15097707
Submission received: 8 March 2023 / Revised: 11 April 2023 / Accepted: 27 April 2023 / Published: 8 May 2023

Abstract

:
Green supply chain finance is a new financing method that focuses on corporate restructuring and promotes corporate capital flow and the development of environmental protection. This paper used BP neural network technology to study the green financing of the supply chain under the sustainable ecological environment. The method played an important role in the trial. Due to the more uncertain factors faced and the more complex environment, the risks of green supply chain finance are more hidden, diverse, and complex. The BP neural network is relatively mature in both network theory and performance. Its outstanding advantages are its strong nonlinear mapping ability and flexible network structure. The positive effect of BP neural network on green financial risk management is verified by experiments. Green supply chain finance is an innovative model of green finance. This experiment studies the risk management of green finance in supply chain and the evaluation index of green finance risk management through BP neural network method, and shows that the evaluation results are highly scientific. In addition, based on the green supply chain model, the historical data of different regions provide a scientific basis for the sustainable ecological development of the region. This paper provides guidance for the sustainable development of green finance in the supply chain and makes contributions to promoting the development of green economy. In order to control the risks of supply chain financing business, the risks of supply chain financing business are classified and analyzed, and specific project risk levels and points are determined to propose control measures to ensure effective control of the business risks.

1. Introduction

In the context of globalization, with the continuous development and progress of information technology and transportation networks, the production organization and flow costs of enterprises are also declining, which makes it possible for supply chain to be the mainstream model of international industrial organizations. In the whole supply chain system, enterprises can use their professional characteristics and advantages to become an important part of the supply chain, gradually become the main force of economic development, and play an important role in stabilizing the economy and technological innovation, attracting employment, and exporting foreign exchange. An important credit basis for financing funds through the supply chain is to evaluate the overall supply chain operation, the financial reputation and strength of key enterprises, and the management status of upstream and downstream enterprises.
The concept of “green supply chain” was formally put forward in the study of “environmentally responsible manufacturing”. In subsequent research, environmental factors were added to the supply chain model, and a supply chain model with wide adaptability was designed. So far, there is no authoritative and unified definition of a green supply chain. Generally speaking, a green supply chain is based on green manufacturing theory and supply chain management technology to minimize the impact of production on the social environment, improve resource utilization, and strive to achieve efficient production and sustainability. The green supply chain system is mainly composed of the production system, consumption system, logistics system, environmental system, etc. This paper would study the risk management of a supply chain in the context of the green supply chain. In the supply chain, the green economy is an important development trend, which involves reducing waste, energy consumption, carbon emissions, and other aspects. However, the green economy also brings some risks and challenges, such as environmental risks and social responsibility risks. In order to solve these risks, a green finance approach is needed to manage the green economic risks of the supply chain. This paper would introduce the concept and application of green finance and analyze the methods and strategies of risk management of green finance in the supply chain, including risk assessment, risk control, and risk management. Through research, this paper aims to provide theoretical and practical guidance for the risk management of green finance in supply chain and make contributions to the development of green economy.
Green supply chain finance can improve the bargaining power of small and medium-sized enterprises and alleviate the difficulty and high cost of financing in the supply chain. In the supply chain of various industries, the upstream and downstream suppliers and distributors of core enterprises are mostly private and small and micro enterprises, with insufficient funds and relatively weak bargaining power. At present, there are many studies on green finance risk management. Iwedi M. studied the impact of financial risk and risk management on corporate shareholder value and found that risk models determine the extent to which risk affects shareholder value [1]. Jadoon I.A. proposed to study whether the green economy can stabilize the world’s financial system, and this research can promote the stable development of green financial risks [2]. Veelen B.V. tested the green financial instruments issued by a financial company, calculated the relevant indicators of its financial risk management capability, and found that green finance has a certain impact on environmental protection and climate change [3]. Liu F.H. analyzed the latest development of green bonds in some representative countries in the world and evaluated the contradiction between such green bonds and green finance [4]. Afridi F. believed that there was an inevitable relationship between climate change and companies and their shareholders. In order to reduce carbon emissions, financial institutions should provide green financing for companies to alleviate the problem of gradually increasing carbon emissions [5]. The above analysis does not disclose the relevant research data, and the reference value of the literature is low.
Green supply chain finance uses a wealth of financial tools to build a convenient financing method, give play to the role of credit enhancement guarantee of core enterprises in the supply chain, reduce the financing threshold of upstream and downstream SMEs, improve the bargaining power, encourage the financing behavior of SMEs with strong risk control and profitability, and keep financial institutions open to the financing of these enterprises. At present, there are many studies on green financial risk management in the context of a sustainable ecological environment. Alieva IA believed that the concept of green finance and sustainable development had come to represent an ideology to guide economic transformation, and paid more attention to rational consumption, with rationality becoming determinant of sustainable green financial risk management [6]. Yao Y. found that the development of green finance can promote the development of a sustainable ecological environment by calculating the financial technology development index and green total factor productivity [7]. Colombo E. believe that environmental problems in many places around the world are related to financial development, calling on the society to develop green finance to ensure the sustainable development of the environment [8]. Li X. proposed that financial enterprises should give full play to their advantages, reform the financial development model, and use the advantages of the financial industry to promote the sustainable development of the green economy [9]. Ermakova EP analyzed the development of the global green economy and learned that there are still some regions that have not yet established a complete green financial supervision system. This brought certain challenges to the risk management of the financial industry, and was not conducive to the development of a sustainable ecological environment [10]. However, the shortcoming of these studies is that the related issues of green finance risk management are not properly dealt with.
The development of green finance is an important means to promote sustainable development, and it is also an important means to promote the long-term development of mankind. The innovations of this paper are: (1) This article adopts a relatively complete green supply chain financial risk comprehensive evaluation index system using the BP neural network and optimizes the indicators through effectiveness testing and sensitivity analysis. (2) Based on the green supply chain model, the comprehensive statistics and analysis of the historical data of different regions provide a scientific basis for the sustainable ecological development of the region.

2. Risk Management Methods of Supply Chain Green Finance under Sustainable Ecology

2.1. Green Finance

Green finance refers to economic activities developed based on behaviors such as improving the environment and saving resources [11]. It provides corresponding financial services in terms of investment and financing, project investment, environmental protection, and ecological development [12,13]. Figure 1 presents a publicity picture related to green financial services.
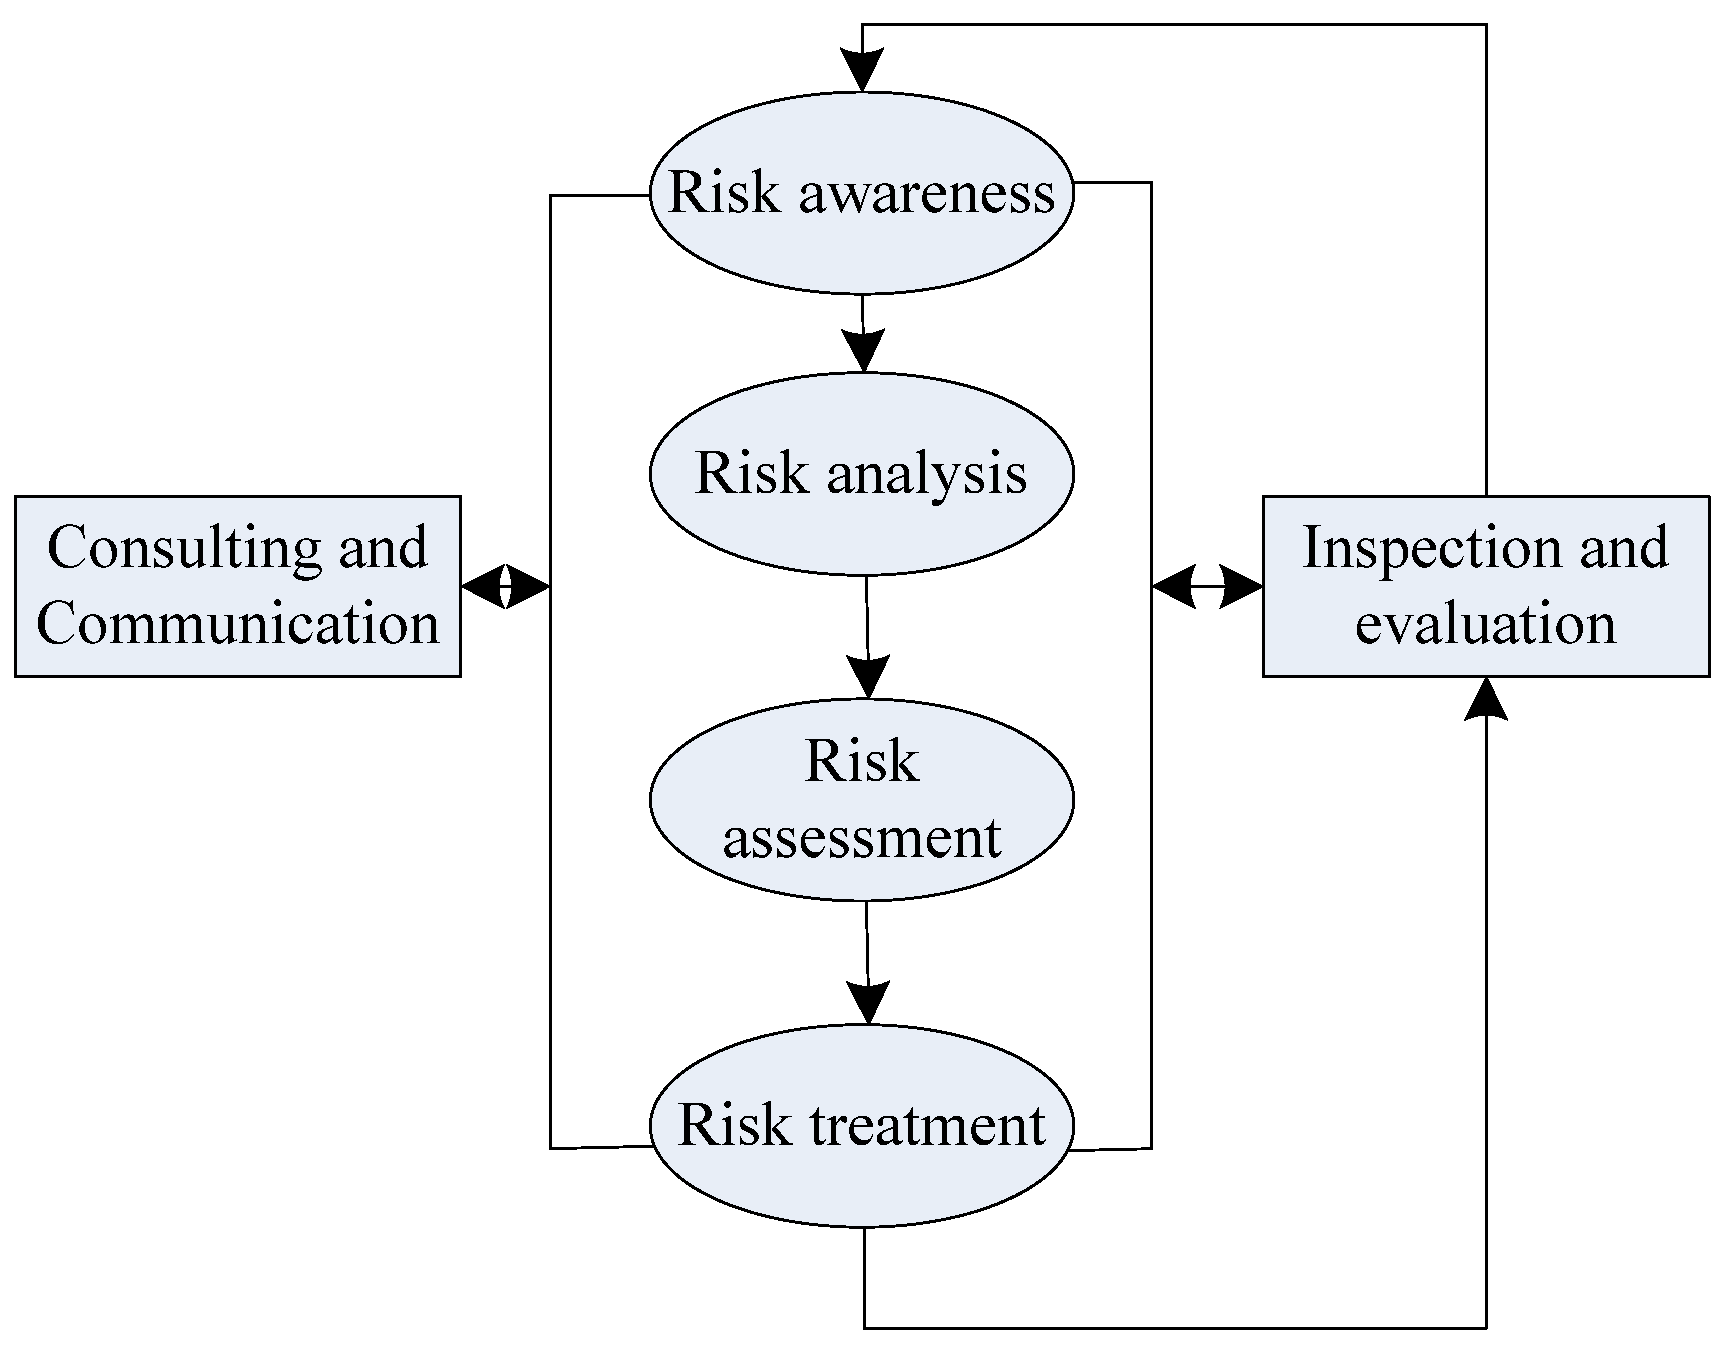
Risk management refers to a management process in which a risky project is operated in an enterprise. After the enterprise identifies and evaluates the risks of the project, the possible adverse effects of the risky project are minimized [14,15]. For the supply chain risk management of sustainable ecological environment, it has a set of risk management system, and this paper would use BP neural network algorithm to analyze the risk management of green finance. As shown in Figure 2, it is the risk management process.

2.2. Research on BP Neural Network under Supply Chain Green Financial Risk Management

Risk analysis, also known as risk control, includes typical processes such as risk identification, risk assessment, and risk control. Among them, risk identification is the first step, mining out hidden risks in things/systems, and risk assessment is the classification of the severity level of risks. In the history of the development of artificial neural networks, the multilayer perceptron (MLP) network has played a great role in the development of artificial neural networks and is also considered to be a truly usable artificial neural network model. It has set off an upsurge of people studying artificial neural networks. It is a highly parallel information processing system, which has a strong adaptive learning ability, does not rely on the mathematical model of the research object, has good robustness to the system parameter changes and external interference of the controlled object, and can handle complex multi-input and multi output nonlinear systems. The basic problem to be solved by neural networks is classification. As the original neural network, the single-layer perceptual network (M-P model) has the advantages of being a clear model, simple structure, and small amount of calculation. However, with the deepening of research work, people found that it still has shortcomings, such as being unable to deal with nonlinear problems. Even if the action function of the calculation unit uses other more complex nonlinear functions instead of valve functions, it can only solve linearly separable problems. Some basic functions cannot be realized, thus limiting its application. The only way to enhance the classification and identification capabilities of the network and solve nonlinear problems is to use a multi-layer feedforward network, i.e., add a hidden layer between the input layer and the output layer.
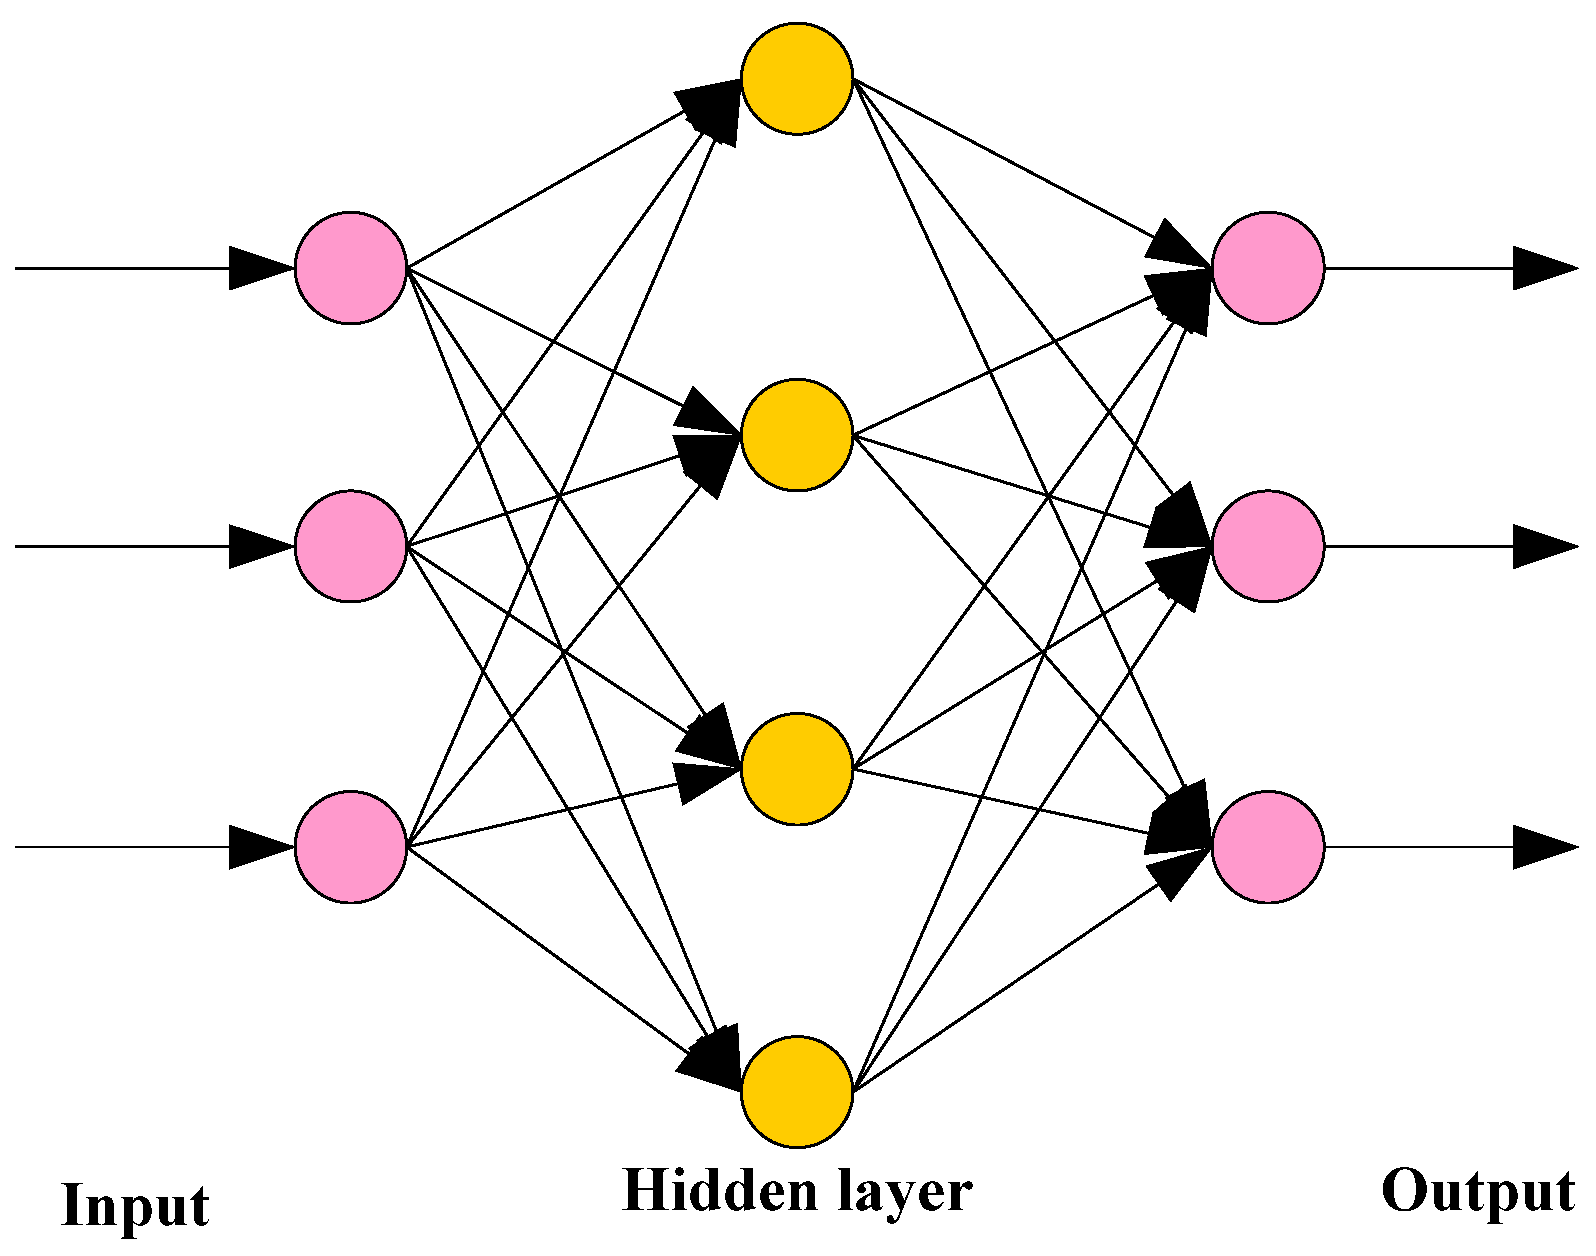
The BP neural network includes one or more intermediate layers. The more layers this network has, the more complex its network structure becomes, and the stronger its ability to handle some nonlinear problems [16]. After consulting the relevant information, this paper understands that the three-layer BP network can complete any mapping from x dimension to y dimension. Therefore, this paper adopts this network structure for experimental analysis. As shown in Figure 3, it is a three-layer BP neural network structure model.
The BP neural network has the capacity for arbitrary complex pattern classification and excellent multi-dimensional function mapping, which solves XOR and other problems that cannot be solved by simple perceptron. Since the emergence of mathematical methods that simulate actual human neural networks, people have gradually become accustomed to directly referring to this artificial neural network as a neural network. The neural network presents broad and attractive prospects in system identification, pattern recognition, intelligent control, and other fields.
(1)
Define variables
The BP algorithm is the most famous multi-layer feedforward network training algorithm. Despite its slow convergence speed and local extremum, various improvement measures can be taken to improve its convergence speed and overcome local extremum phenomena. Moreover, it has the characteristics of simplicity, ease of implementation, small computational complexity, and strong parallelism. Currently, it is still the preferred algorithm for multi-layer feedforward networks. The BP neural network is a multilayer feedforward neural network trained according to the error back propagation algorithm, and it is one of the most widely used neural network models. It is assumed that the first layer, the middle layer, and the last layer have X, I, and H neuron structures, respectively. m x is the x neuron in the first layer, x 1 , 2 , 3 , k i is the i neuron in the middle layer, i 1 , 2 , 3 , , n j is the j neuron in the last layer ( j 1 , 2 , 3 , , ), the connection weight from m x to k j is α , and the connection weight from k i to n j is β .
The actual output of the network is:
N ( y ) = [ w J 1 , w J 2 , , w J J ]
The expected output of the network is:
d ( y ) = [ d 1 , d 2 , , d J ]
Among them, y represents the number of iterations, and the error signal of the y iteration is defined as:
e j ( y ) = d j ( y ) N j ( y )
(2)
Forward propagation
The output value of the first layer is equal to the value of the input signal of the entire network:
w X x ( y ) = m ( y )
The input to the neurons of the i intermediate layer is equal to the weighted sum of w X x ( y ) :
u I i ( y ) = x = 1 X α ( y ) w X x ( y )
Assuming that g ( ) v represents the Sigmoid function, then the output value of the neuron in the i intermediate layer is:
w I i ( y ) = g ( u I i ( y ) )
The input of the j neuron in the last layer is the same as the value of the weighted sum of w I i ( y ) :
u I i ( y ) = i = 1 X I β ( y ) w I i ( y )
The output of j neurons in the last layer is:
w J j ( y ) = g ( u J j ( y ) )
The total network error is:
e ( y ) = 1 2 j = 1 J e j 2 ( y )
(3)
Back propagation of error signal
The weight β between the middle layer and the last layer of the BP network is fully adjusted. In the steepest descent method, the value of the gradient e ( y ) β ( y ) of the error pair β should be calculated and adjusted in the reverse direction of that direction:
Δ β ( y ) = μ e ( y ) β ( y )
Δ β ( y + 1 ) = Δ β ( y ) + β ( y )
The value of the gradient can be obtained by taking partial derivatives [17,18]. According to the relevant rules of differential equations, the following formulas are obtained:
e ( y ) β ( y ) = e ( y ) e j ( y ) e j ( y ) w J j ( y ) w J j ( y ) u J j ( y ) u J j ( y ) β ( y )
Since e ( y ) is a quadratic function of e j ( y ) , it is a linear function after differentiation:
e ( y ) e j ( y ) = e j ( y )
e j ( y ) w J j ( y ) = 1
The derivative of the output transfer function is:
w J j ( y ) u J j ( y ) = f u J j ( y )
u J j ( y ) β ( y ) = w J j ( y )
Therefore, the gradient value is:
e ( y ) β ( y ) = e j ( y ) f ( u J j ( y ) ) w I i ( y )
The introduction of the local gradient is defined as:
ξ J j = e ( y ) u J j ( y ) = e ( y ) e j ( y ) e j ( y ) w J j ( y ) w J j ( y ) u J j ( y ) = e j ( y ) f ( w J j ( y ) )
Therefore, the numerical representation of the weight correction amount can be:
Δ β ( y ) = μ ξ J j w I i ( y )
The local gradients indicate how the weights would change. The local gradient of the network neuron is the same as the product of the error signal value and transfer function derivative of the neuron [19,20]. The last layer represents a linear function whose derivative is equal to 1, and its expression is:
f ( u J j ( y ) ) = 1
After substituting into Formula (20), the result can be obtained:
Δ β ( y ) = μ e j ( y ) w I i ( y )
The error signal is propagated forward, and the weight Δ α between the first layer and the middle layer is adjusted:
Δ α ( y ) = μ ξ J j w X x ( y )
w X x ( y ) is the output of the input neuron:
w X x ( y ) = m x ( y )
ξ J j represents the local gradient, which is defined as:
ξ J j = e ( y ) u J j ( y ) = e ( y ) w I i ( y ) w I i ( y ) u J j ( y ) = e ( y ) w I i ( y ) g ( u J j ( y ) )
g ( f ) represents the transfer function of the Sigmoid. Since the middle layer of the BP network is hidden, the error of the output value of the middle layer cannot be directly derived. In this process, it is necessary to use the local gradient obtained in the previous calculation:
e ( y ) w I i ( y ) = j = 1 J ξ J j β
Therefore, there is:
ξ J j = g ( u J j ( y ) ) j = 1 J ξ J j β
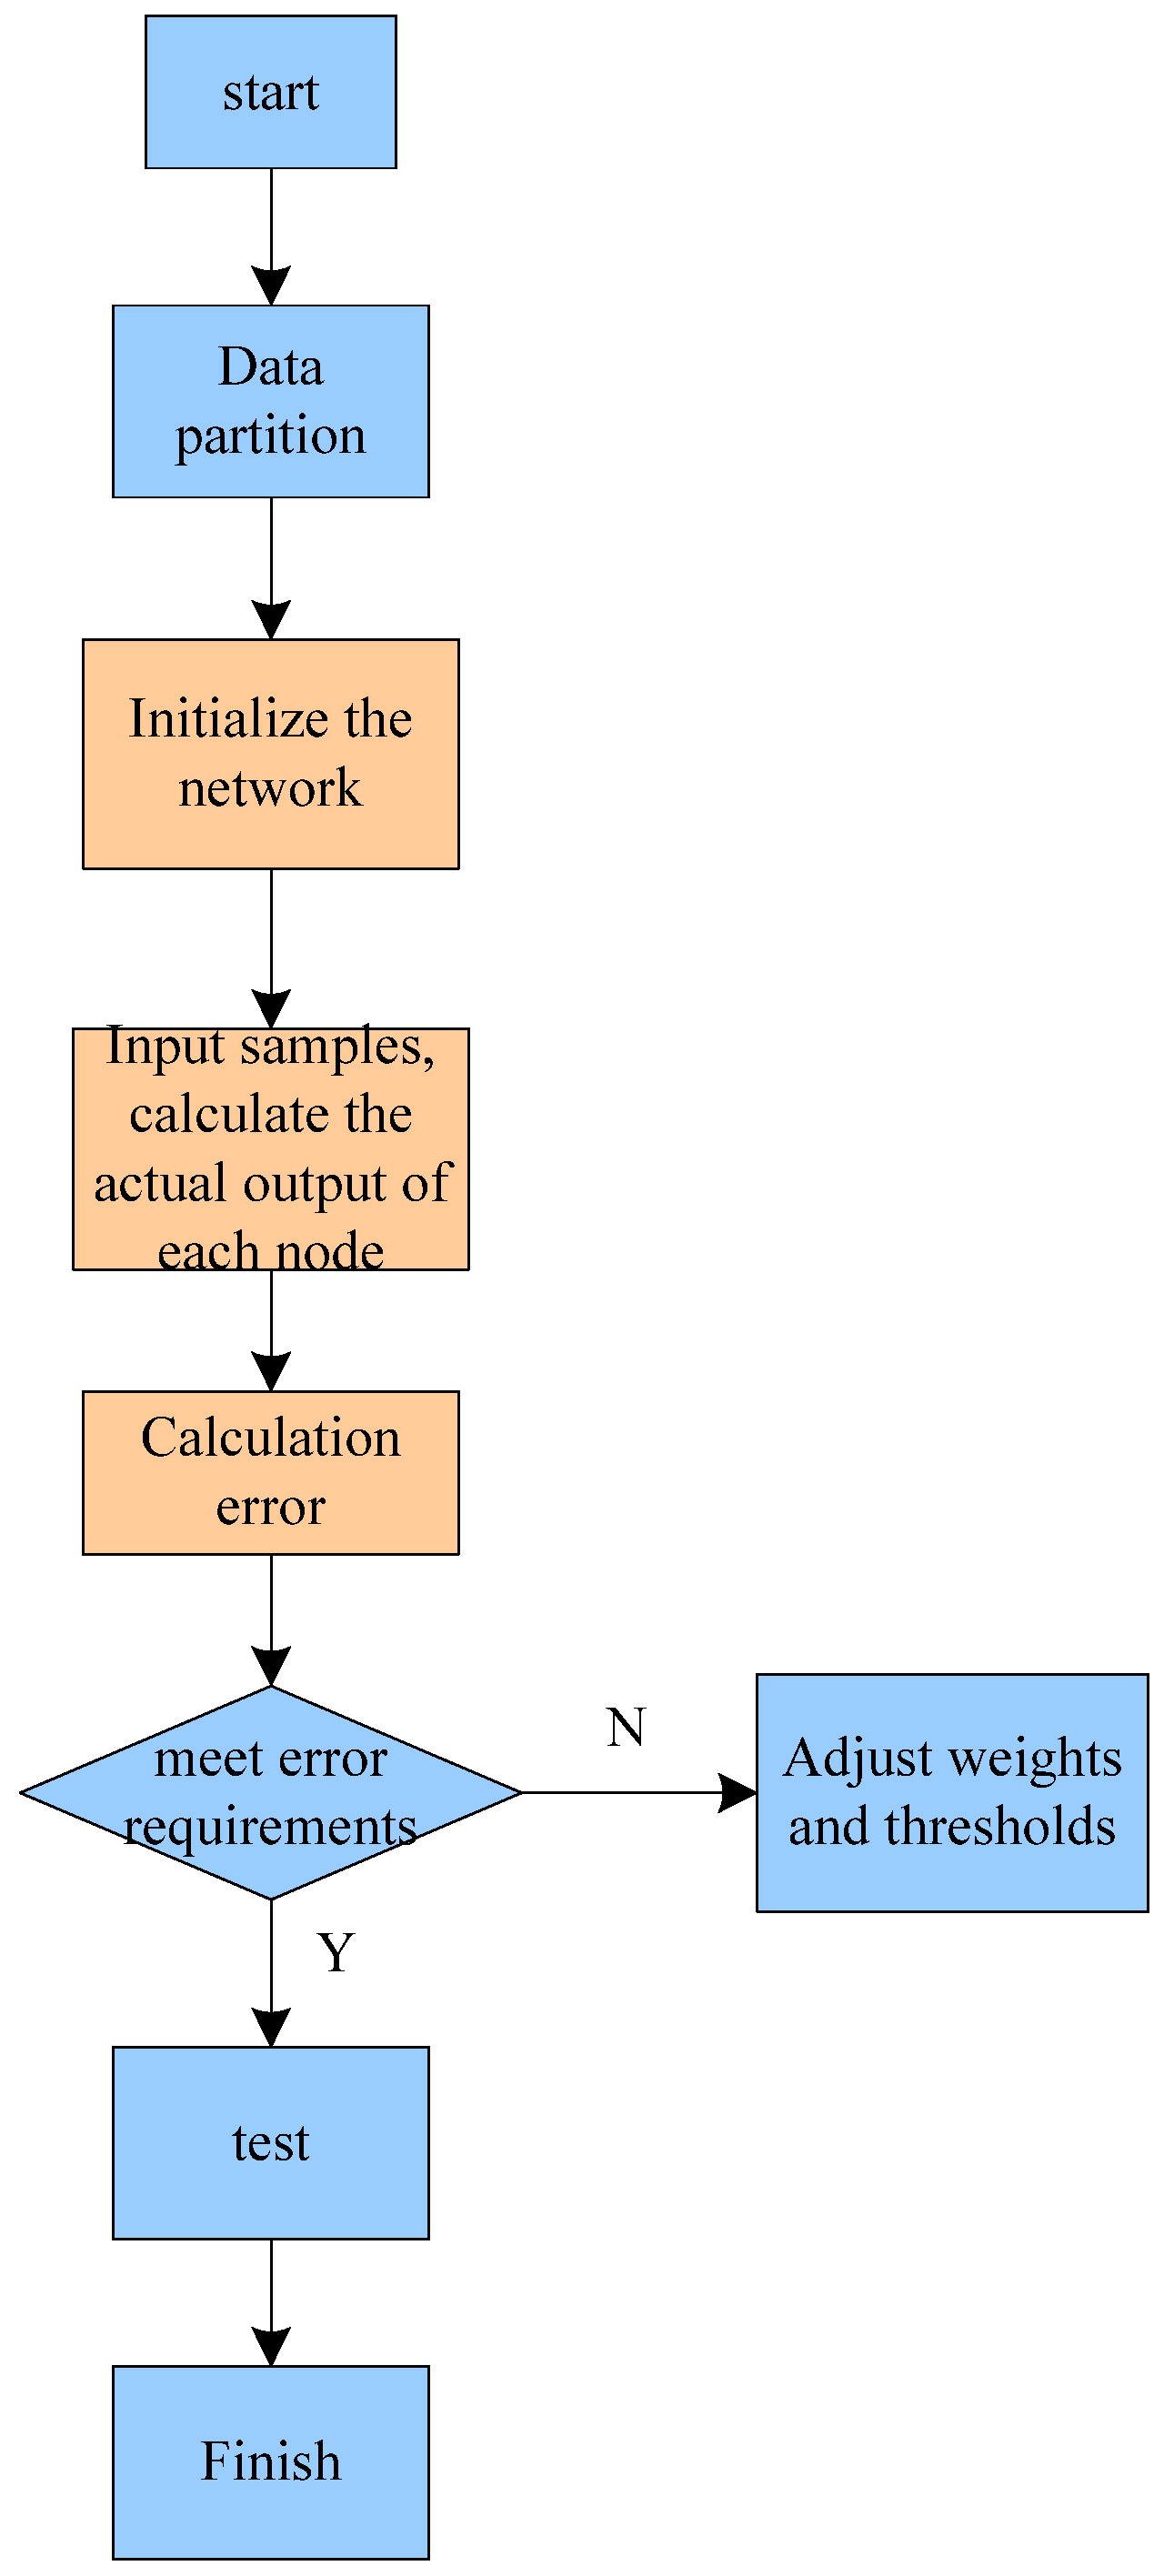
Up to this point, one round of weight change for the three-layer BP network is finished. During the learning period, the BP organization would constantly change based on the actual situation until ideal error accuracy occurs [21,22]. The main reason for the complexity of the BP network is that when adjusting the weight between layers, such as between the middle layer and the middle layer, and between the middle layer and the first layer, the calculation result of the previous step would be used at the current level. Since there are multiple intermediate layers, there are also multiple results, and the computational load is larger and the complexity is higher [23,24]. The flow chart of the BP network algorithm is shown in Figure 4.

3. Experimental Analysis on Green Financial Risk Management of Sustainable Ecological Supply Chain under BP Neural Network

3.1. Reasons for Risk Management of Green Finance

The supply chain green finance business is a part of the business of financial institutions, which promotes the capital operation of financial institutions and the development of the green ecological industry. However, the supply chain green finance business itself has some uncertain risk factors. The main task of this paper is to combine the BP neural network and select appropriate indicators for factor analysis according to the characteristics of green finance, so as to further promote relevant financial institutions to build a reasonable supply chain green finance evaluation system.
According to the industry and risk characteristics of supply chain green finance, the selection criteria of the analysis indicators in the experimental part of this paper are:
(1)
The indicators cover a wide range. Supply chain green finance business involves various trade financial institutions, agricultural institutions, and other organizations. Analyzing only one aspect can easily lead to biased risk assessments. Therefore, this paper combines the characteristics of each topic and discusses the impact of the financial business on supply chain green finance from different aspects.
(2)
The indicators are independent of each other. For the credit risk assessment activities of financial companies in the supply chain, if there is a correlation between the indicators, the accuracy of the financial risk assessment would decrease, and the significance of risk assessment would be lost.
(3)
Indicators have relative weights. In empirical research, the selection of indicators should be comprehensive and focused, and indicators and variables should be reasonably selected according to theoretical and actual conditions. Therefore, this paper focuses on the relevant links of the supply chain when selecting the risk assessment indicators for supply chain green finance.
(4)
The selection of indicators should be scientific. When conducting experimental analysis, the identification and measurement of indicators and variables is not only theoretical, but must also be scientifically conducted in consideration of the actual situation. This paper fully considers the guiding principles of theory and practical operation when selecting supply chain financial risk assessment indicators, which makes the construction of a supply chain financial rating system more complete.

3.2. Experimental Data

(1)
Extraction factor
Python pursues simplicity and is easy to read and write. It enables people to focus on solving problems rather than understanding the language itself. Python is open source software. This means that people can copy, read, and modify it without spending a penny, extracting feature value factors above 1. In this experiment, five public factors were selected, and these five public factors were used to represent the meaning of all indicator systems in green financial enterprises. The specific data analysis is shown in Table 1.
In Table 1, the indicator system in the supply chain green financial enterprise is selected through factor analysis, and five factor components are selected. Among them, the initial eigenvalue of factor 1 is the same as the data from which the sum of squares is extracted, the total number is 6.65, and the percentage of variance is 19.918%. The percentage of cumulative total variance is 19.918%, 4.396 is the total value of the rotation squared and loaded, the percentage of variance is 13.115%, and the cumulative total variance is 13.115%. In the same way, the initial characteristics of factors 2–5 and the extraction square and loading value are equal, and the rotation square and loading value would fluctuate, i.e., increase or decrease, but the overall value does not fluctuate much. According to the extraction and loading results and the initial eigenvalue results, the numerical results have not changed, but the variance contribution rates of different factors have changed compared with the rotating sum of squares, which is helpful for the analysis and understanding of the significance of the factors.
(2)
Factor naming and scoring
The fundamental purpose of combination forecasting is to integrate the individual prediction information obtained and obtain the overall prediction value after combination. The advantage and characteristic of combination forecasting methods is to weaken subjectivity, make the results more objective and effective, and screen out financial factors. In this paper, the factors are named according to the constructed index system, and the component matrix of the rotation factor is obtained by operation, as shown in Table 2.
In Table 2, the return on total assets of the first factor is very high, with a value of 0.726, which reflects the status of the loan subject of green financial enterprises. Among the five factors, the accounts receivable turnover ratio is negative except for the second factor, which is 0.858, reflecting the project assets of green financial enterprises. The management level module has the highest value in factor 3, which is 0.863. Both factor 1 and factor 2 are negative, which are −0.015 and −0.145, respectively. This reflects the status of core enterprises in the green finance industry. In the matrix analysis of bank credit rating, factor 4 has the highest value, reaching 0.784. The second is factor 3, whose value is 0.218, which can reflect the supply chain status of green finance enterprises. The maximum value of the financial rules module is in factor 5, and the value is 0.88, which can reflect the institutional rules of green financial enterprises. These five factors contain the core of all indicator systems in green financial risk management research, reflecting the process of factor analysis from complex to simple. These five-factor analyses are more specific and concise than the index analysis in Table 1, which reflects the ability of the BP neural network to operate from complex to simple data. When calculating the factor scores, the factor analysis coefficient matrix should be analyzed using the Python programming language, as shown in Table 3.
In Table 3, the values of the five factors did not change much. In the total asset return module, the highest score coefficient was 0.171. The largest score coefficient in the accounts receivable turnover module was factor 1, and the value was 0.214. The highest score coefficient of the management level module was factor 3, with a score of 0.28.
In summary, the factor variance contribution rate can reflect the influence of different factors on the total variance. The higher the contribution rate is, the more obvious the factor plays in the risk management of green financial enterprises. The most important factor affecting the risk management of supply chain green finance companies comes from the request for corporate loans. Assuming that the loan amount is large, it means that the level of risk management is high, and the loan amount is lower. It also means that the enterprise is unwilling to take risks, or the enterprise has sufficient funds. The overall status of relevant core enterprises and supply chains also has a certain impact on the risk management capabilities of enterprises. This means that green financial institutions should pay attention to the loan status of enterprises when building a sustainable ecological supply chain. As shown in Table 3, the higher the score of the factor is, the easier it is to have credit risk, which may cause economic losses to enterprises, and enterprises need to focus on this impact.
In order to study the supply chain green finance risk management in a sustainable ecological environment, this paper takes five regions around the world as the research objects, as shown in Figure 5. This paper analyzes and calculates their weights, uses the contribution rate of each main factor to the overall index interpretation as the weight, and obtains the comprehensive formula for the ecological environment evaluation of small loan companies:
R = 0.72541 Y 1 + 0.0102 Y 2 + 0.07341 Y 3
Among them, Y 1 represents the financing risk in each region, Y 2 represents the supply chain cooperation risk in each region, and Y 3 represents the output capacity risk of green financial enterprises.
Figure 5. Regional safety common factor scores and overall safety scores. (a) The public factor score of financing security of supply chain green finance enterprises. (b) Overall score of supply chain green finance risk management security in each region.
Sustainability 15 07707 g005aSustainability 15 07707 g005b
As shown in Figure 5a, it is the score of the common factor of financing security of green financial enterprises in each region. Formula (27) calculates the supply chain risk security of green finance enterprises in five regions and obtains the comprehensive indicators of these five regions. Figure 5b is the overall score for financial risk management security across regions. Among them, the safety index score of Y 1 in area A is −0.37386, the score of Y 2 is −0.25348, and the score of Y 3 is 0.24625. The score calculated by Formula (27) is approximately −0.25571. Similarly, the financing security score of region B is approximately −0.30197, the financing security score of region C is approximately −0.40456, the financing security score of region D is approximately 0.36046, and the financing security score of region E is approximately 0.72603. Therefore, it can be seen from the above that the supply chain green financial risk management based on BP neural network is very effective. Supply chain finance can effectively promote financial cooperation between node enterprises, and rapid and accurate risk assessment is related to the efficient development of the supply chain and the smooth progress of production.

3.3. Suggestions on the Sustainable Development of Supply Chain Green Finance Risk Management

This paper uses the BP neural network algorithm to analyze the index coefficients of the sustainable ecological environment supply chain green finance risk management in detail, revealing that there are many problems affecting supply chain green finance enterprises. Therefore, some corresponding countermeasures are proposed for these problems.
(1)
Establishing a sound enterprise risk prevention and protection mechanism
Finance is a new type of value-added service, which requires a reasonable allocation of employees of enterprises, strengthens personnel construction in various departments of financial institutions, improves the professional ability of employees, and makes employees thoroughly familiar with relevant business processes. Enterprises need to conduct regular training and education for employees, which can not only improve the personal quality of internal employees, improve their personal professional skills, but also improve their risk awareness. At the same time, in order to prevent reputation risks, financial enterprises should conduct detailed investigations on the serviced enterprises before providing financial services.
(2)
Improving market forecasting ability and risk early warning mechanism
In the business of supply chain green finance, the most important thing is the overall stability of the supply chain. If there is a credit risk in an individual enterprise in the supply chain, it would lead to a chain reaction of the entire supply chain through financial transactions, affecting the financial security of other enterprises. In order to avoid financial risks, it is necessary for each enterprise in the entire supply chain to establish a complete risk early warning mechanism to help enterprises avoid risks.
(3)
Improving supply chain management and strengthening cooperation between green financial enterprises in the supply chain.
The development of supply chain green finance requires a relatively stable market environment. Only strict enterprise access standards can ensure the stable development of projects of major enterprises in the supply chain.

4. Discussion

This paper mainly predicts the risk of green finance in the supply chain. Considering that all enterprises have accumulated massive data about credit business, this paper uses BP neural network to find classification models that can describe and distinguish data categories according to the training set data, so as to predict the categories of data, mine valuable information, and play a positive auxiliary role for the supply chain green finance risk management. Given the important role of green supply chain finance in reducing supply chain environmental risks, improving supply chain credit ratings and supporting small and medium-sized enterprises to obtain convenient financing, it is necessary to carry out exploratory research on this emerging green finance model. With the in-depth development of economic globalization, there is a relationship of competition and cooperation between related enterprises. There is no economic interest relationship between competing companies, and there is a certain economic interest relationship between cooperative companies, and their association may form a set of supply chains. This paper is to use the BP neural network algorithm to study the risk management of supply chain green finance in a sustainable ecological environment. After the experimental analysis, the various indicators of green finance under the BP neural network are analyzed, and it is understood that the higher the value of the factor variance contribution rate is, the more obvious the role of the factor plays in the risk management of green financial enterprises. At the same time, the higher the factor score is, the greater the possibility of credit risk, which would cause certain losses to the company and other companies in the supply chain. This is a chain reaction. Therefore, it is necessary to strengthen the risk management of supply chain green finance and promote the development of a sustainable ecological environment. The main contribution of this article is to propose a neural network prediction algorithm. Compared with traditional prediction methods, the prediction accuracy of neural network prediction methods is better. This is mainly due to the characteristics of neural networks themselves.
Real world companies and their complex associations form a corporate network, and as risks can be transmitted within the network, in severe cases, they can lead to systemic financial risks. Therefore, conducting risk transmission analysis on the company’s relationship network is of great significance for timely perception and prevention of company risks. This paper studies the supply chain green financial risk management based on the sustainable ecological environment and uses the BP neural network algorithm to analyze various indicators in the supply chain financial risk. This is not only a further expansion of the application scope of the BP neural network algorithm, but also an in-depth discussion of the supply chain green financial risk management. However, some problems still exist in this paper. Because the article only collects a single data in financial risk and does not adopt a more diverse range of data collection methods, the means are obviously inadequate. In addition, the article lacks detailed data model and model verification, which cannot better reflect the changing trend of financial risks, nor can it better predict the development of finance. Therefore, in future research, a perfect financial data analysis system should be established to study financial data from different perspectives, further explore the connotation of financial data, and deeply analyze the essential characteristics of financial data, so as to better improve the accuracy of research results. At the same time, a good financial data management system should be established to ensure the accuracy and integrity of the financial data, so as to provide more reliable support for the research work.

5. Conclusions

With the development of information technology and transportation network, the production organization and flow cost of enterprises are constantly reduced, making the supply chain become the mainstream mode of international industrial organization. Enterprises can take advantage of their own characteristics to participate in the supply chain, and play an important role in economic stability, technological innovation, employment absorption, and other aspects. Green supply chain finance can internalize the external benefits of enterprises’ green transformation and improve the competitive advantages of the core enterprises in the supply chain and their upstream and downstream enterprises. From the macro level, green supply chain finance should serve the green transformation of enterprises, industrial transformation and upgrading, and the realization of the national “double carbon goal”. Therefore, in the case of improving the efficiency of financing, green supply chain finance has greatly promoted the degree of social green transformation and increased public benefits by encouraging the greening of enterprises in the chain. However, from the micro level, the external benefits of green transformation and industrial transformation and upgrading of enterprises would be internalized into the actual competitiveness of enterprises. Under the background of green development, low-carbon, efficient, and green enterprises have greater profitability, environmental friendliness, and social influence than brown pollution enterprises, so they are more sustainable, which would be the biggest competitive advantage of enterprises under the background of “double carbon goals”.
This paper discusses the application of green finance in sustainable ecology with the BP neural network as the core. After researching and analyzing each index, the results show that the variation contribution ratio of each factor has a more obvious impact on the impact factor, and the higher the factor score, the higher the credit risk. To a certain extent, it affects the sustainable development of the ecological environment. From the perspective of the green financial indicators of the five regions, the economic development risk of the E region is higher than that of other regions, which shows that the green financial risk level of the E region is very high. Finally, an empirical analysis of the green financial risks in the supply chain based on BP neural network proves its effectiveness in financial risk management. In order to improve the accuracy of the research results, a perfect financial data analysis system should be established in the future to study the financial data from different perspectives, explore its connotations, and further analyze the essential characteristics of financial data. At the same time, a good financial data management system should be established to ensure the accuracy and integrity of financial data, so as to provide a more reliable research basis. The reason why neural networks have different results each time is because the initialized weights and thresholds are random, and because the results are different each time. It is necessary to search multiple times to find a more ideal result. In the future, neural networks should be combined with other prediction methods to improve the accuracy and speed of risk prediction.

Funding

This research received no external funding.

Data Availability Statement

The data that support the findings of this study are available from the corresponding author upon reasonable request.

Conflicts of Interest

The authors declare no conflict of interest.

References

  1. Iwedi, M.; Anderson, O.E.; Barisua, P.S.; Zaagha, S.A. Enterprise risk management practice and shareholders value: Evidence from selected quoted firms in Nigeria. Green Financ. 2020, 2, 197–211. [Google Scholar] [CrossRef]
  2. Jadoon, I.A.; Mumtaz, R.; Sheikh, J.; Ayub, U.; Tahir, M. The impact of green growth on financial stability. J. Financ. Regul. Compliance 2021, 29, 533–560. [Google Scholar] [CrossRef]
  3. Veelen, B.V. Cash cows? Assembling low-carbon agriculture through green finance. Geoforum 2021, 118, 130–139. [Google Scholar] [CrossRef]
  4. Liu, F.H.; Lai, K.P. Ecologies of green finance: Greensukukand development of green Islamic finance in Malaysia. Environ. Plan. A Econ. Space 2021, 53, 1896–1914. [Google Scholar] [CrossRef]
  5. Afridi, F.; Jan, S.; Ayaz, B.; Irfan, M. Green finance incentives: An empirical study of the Pakistan banking sector. Rev. Amazon. Investig. 2021, 10, 169–176. [Google Scholar] [CrossRef]
  6. Alieva, I.A.; Altunina, V.V. Current trends in the development of a green finance system: Methodology and practice. Baltic Reg. 2021, 13, 64–89. [Google Scholar] [CrossRef]
  7. Yao, Y.; Hu, D.; Yang, C.; Tan, Y. The impact and mechanism of fintech on green total factor productivity. Green Financ. 2021, 3, 198–221. [Google Scholar] [CrossRef]
  8. Colombo, E. From Bushfires to Misfires: Climate-related Financial Risk after McVeigh v. Retail Employees Superannuation Trust. Transnatl. Environ. Law 2022, 11, 173–199. [Google Scholar] [CrossRef]
  9. Li, X. Research on the Influencing Factors of Internet Financial Risk and Its Prevention Mechanism. Mod. Econ. Manag. Forum 2022, 3, 20–24. [Google Scholar] [CrossRef]
  10. Ermakova, E.P. The Development of The Legal Framework For “Green” Finance In Russia, The EU And China: A Comparative Legal Analysis. Rudn. J. Law 2020, 24, 335–352. [Google Scholar] [CrossRef]
  11. Liu, Z.; Song, J.; Wu, H.; Gu, X.; Shi, L. Impact of Financial Technology on Regional Green Finance. Comput. Syst. Sci. Eng. 2021, 39, 391–401. [Google Scholar] [CrossRef]
  12. Junior, W.G.; Kim, B.; Liu, L.; Lai, X. Green Economy Game: A Modular Approach for Sustainable Development Education. Int. J. Des. Learn. 2020, 11, 96–107. [Google Scholar]
  13. He, Z.; Liu, Z.; Wu, H.; Gu, X.; Yue, X. Research on the Impact of Green Finance and Fintech in Smart City. Complexity 2020, 2020, 6673386. [Google Scholar] [CrossRef]
  14. Yang, G.; Li, Y.; Jiang, X. Research on the Impacts of Green Finance towards the High-Quality Development of China’s Economy—Mechanisms and Empirical Analysis. Theor. Econ. Lett. 2020, 10, 1338–1357. [Google Scholar] [CrossRef]
  15. Claar, S. Green Finance and Transnational Capitalist Classes—Tracing Vested Capital Interests in Renewable Energy Investment in South Africa. J. Entwickl. JEP 2020, 36, 110–128. [Google Scholar] [CrossRef]
  16. Kawabata, T. Private governance schemes for green bond standard: Influence on public authorities’ policy making. Green Financ. 2020, 2, 35–54. [Google Scholar] [CrossRef]
  17. Jha, B.; Bakhshi, P. Green Finance: Fostering Sustainable Development in India. Int. J. Recent Technol. Eng. 2019, 8, 2277–3878. [Google Scholar] [CrossRef]
  18. Aslanishvili, D.; Omadze, K. Green Economy and Access to Finance in Georgia (Going Beyond the Commercial Banking Sector to Finance Businesses in Georgia). J. Econ. Bus. 2019, 2, 761–772. [Google Scholar] [CrossRef]
  19. Novkovska, B. Relationship between shadow and green economy: Less shadow more green. Green Financ. 2019, 1, 130–138. [Google Scholar] [CrossRef]
  20. Clark, G.L. The allocation of risk and uncertainty in green infrastructure investment with implications for climate change policy. J. Sustain. Financ. Invest. 2019, 9, 116–137. [Google Scholar] [CrossRef]
  21. Sakai, K.; Hassan, M.A.; Vairappan, C.S.; Shirai, Y. Promotion of a green economy with the palm oil industry for biodiversity conservation: A touchstone toward a sustainable bioindustry. J. Biosci. Bioeng. 2022, 133, 414–424. [Google Scholar] [CrossRef]
  22. Zanizdra, M.Y.; Harkushenko, O.M.; Vishnevsky, V.; Kniaziev, S.I. Digital and Green Economy: Common Grounds and Contradictions. Sci. Innov. 2021, 17, 14–27. [Google Scholar]
  23. Yu, C.; Chen, M. Regional Ecological Security Evolution and Green Economy: An Empirical Study. Math. Probl. Eng. 2021, 2021, 5549048. [Google Scholar] [CrossRef]
  24. Bobby, M.N.; Indira, M.; Peele, K.A.; Venkatesw, T.C.; Krupanidhi, S. Sustainable Nutritional Supplementation for Green Economy through Hydroponics System. Indian J. Ecol. 2021, 48, 85–90. [Google Scholar]

Figure 1. Related publicity map of green finance.
Sustainability 15 07707 g001
Figure 2. Risk management process.
Sustainability 15 07707 g002
Figure 3. Three-layer BP neural network structure model.
Sustainability 15 07707 g003
Figure 4. BP network algorithm flow.
Sustainability 15 07707 g004
Table 1. Total variance explained.
ElementInitial EigenvaluesDecimate Sum of Squares and LoadRotate Square and Load
TotalProportion of VarianceGrand Total %TotalProportion of VarianceGrand Total %TotalProportion of VarianceGrand Total %
16.6519.91819.9186.6519.91819.9184.39613.11513.115
24.2612.67632.4924.2612.67632.4924.22612.59925.62
32.8388.39440.7832.8388.39440.7833.83111.39836.908
42.5127.40748.0872.5127.40748.0872.9178.63345.439
52.216.43254.4172.216.43254.4172.3186.81652.153
Table 2. Rotated composition matrix.
12345
Roa0.726−0.1450.070.390.198
Accounts Receivable Turnover−0.0310.858−0.056−0.124−0.242
Management level−0.015−0.1450.8630.0060.098
Bank credit rating0.212−0.0140.2180.7840.095
Financial rules0.0470.071−0.0330.0190.88
Table 3. Factor Score Coefficient Matrix.
12345
Return on assets0.1710.012−0.0160.1240.109
Accounts Receivable Turnover0.2140.0160.0210.0230.011
management level0.0050.0450.28−0.0570.045
bank credit rating0.0050.0550.0250.2960.081
financial rules0.0270.006−0.0080.0430.414
Disclaimer/Publisher’s Note: The statements, opinions and data contained in all publications are solely those of the individual author(s) and contributor(s) and not of MDPI and/or the editor(s). MDPI and/or the editor(s) disclaim responsibility for any injury to people or property resulting from any ideas, methods, instructions or products referred to in the content.