Article

Spatiotemporal Variability in Rainfall Erosivity and Its Teleconnection with Atmospheric Circulation Indices in China

1
Beijing Key Laboratory of Traditional Chinese Medicine Protection and Utilization, Faculty of Geographical Science, Beijing Normal University, Beijing 100875, China
2
Engineering Research Center of Natural Medicine, Ministry of Education, Faculty of Geographical Science, Beijing Normal University, Beijing 100875, China
*
Author to whom correspondence should be addressed.
Sustainability 2024, 16(1), 111; https://doi.org/10.3390/su16010111
Submission received: 4 November 2023 / Revised: 19 December 2023 / Accepted: 20 December 2023 / Published: 21 December 2023
(This article belongs to the Section Air, Climate Change and Sustainability)

Abstract

:
Rainfall erosivity (RE) is a critical factor influencing soil erosion, and soil erosion is closely related to land ecosystem health and long-term sustainable utilization. To ensure regional stable food supply and ecological balance, it is crucial to study the spatiotemporal distribution and influencing factors of RE. This study focuses on China and its three natural regions using daily precipitation data from 611 stations from 1960 to 2020. The study analyses the spatiotemporal changes in RE. Rainfall events were classified as moderate, large, and heavy based on rainfall intensity. The RE contribution from different rainfall levels to the total RE was analyzed, and the key climatic drivers closely linked to RE were identified using random forest. The results demonstrate that (1) on a national scale, RE shows a significant increasing trend, marked by an 81.67 MJ·mm·ha−1·h−1/decade. In the subregions, the Eastern Monsoon Region (EMR) and Qinghai–Tibet Plateau Region (QTR) show a significant increasing trend, with a greater change rate in EMR of 108.54 MJ·mm·ha−1·h−1/decade, and the Northwest Arid Region (NAR) shows a nonsignificant upwards trend. (2) The average RE increases northwest–southeast nationwide, ranging from 60.15 MJ·mm·ha−1·h−1 to 31,418.52 MJ·mm·ha−1·h−1. The RE contribution generated by different rainfall levels to the total RE exhibits spatial variations. The dominant types show that EMR is influenced by heavy RE, NAR is dominated by large RE, and QTR is affected by moderate RE. (3) The REs are associated with teleconnection indices, but the impact of these indices varies in different regions. The Western Hemisphere Warm Pool has the greatest impact on the EMR, while the North Atlantic Oscillation and Atlantic Multidecadal Oscillation are the factors influencing RE in NAR and QTR, respectively. (4) On a national scale, for every 1 mm increase in annual total rainfall, the RE increased by 8.54 MJ·mm·ha−1·h−1, a sensitivity of 8.54 MJ·mm·ha−1·h−1/mm. For the three subregions, there are differences in the sensitivity of RE to changes in annual precipitation. The highest sensitivity is found in EMR, at 8.71 MJ·mm·ha−1·h−1/mm, which is greater than the sensitivity indices in NAR (6.19 MJ·mm·ha−1·h−1/mm) and QTR (3.60 MJ·mm·ha−1·h−1/mm). This study can provide theoretical references for future regional soil erosion prediction and sustainable agricultural development in China.

1. Introduction

In recent times, intensified by climate change and imprudent land utilization, soil degradation has posed a serious challenge to sustainable social and economic development. One of the most common types of land degradation is soil erosion. Soil erosion is detrimental to the health of society, economy, and the environment [1,2], as it disrupts the topsoil, leading to nutrient loss, reduced crop yields, and fragmentation of arable land, hindering sustainability in agriculture [3]. Therefore, accurate estimation of soil erosion is crucial for water resource management and increasing agricultural production efficiency [4]. The universal soil loss equation (USLE) and its revised version RUSLE are widely used globally to quantify and predict soil erosion [5,6,7,8,9,10]. In these models, soil loss is determined by various factors, but among these factors, rainfall erosivity (RE) is the pivotal determinant in water-induced soil erosion, signifying rainfall’s potential capacity to induce erosion. Intense rainfall and high erosivity can lead to the erosion of the loose surface materials of the soil, causing soil erosion. This impact is particularly significant on agricultural land, slopes with insufficient vegetation cover, and exposed soil [11,12]. In the context of climate change, the increase in extreme precipitation events leads to intensified erosion, causing a multitude of disasters [4,13,14,15,16,17,18,19,20,21]. Intense rainfall-induced erosion can penetrate the soil, leading to soil destabilization and an increased risk of landslides. Sujatha and Sridhar employed a logistic regression model to evaluate the impact of various factors on landslide susceptibility, demonstrating that annual average rainfall and rainfall patterns play pivotal roles in triggering landslides, particularly during extreme precipitation events [16]. Furthermore, previous research suggests that the primary factor triggering debris flows is rainfall, while influencing factors include land use and land cover. The erosive force generated by rainfall can result in the erosion of the soil’s surface layer, producing a significant amount of sediment. If these sediments rapidly flow downhill, it can lead to the formation of debris flows, directly endangering lives and obstructing regional economic growth and development [17]. Therefore, a global investigation of RE dynamics is essential for the exploration of effective approaches in developing water and soil management strategies. Klik et al. found high erosivity in the northern and western regions of South Island and the northern part of New Zealand but low erosivity in the eastern part of inland South Island and the southern part of New Zealand [19]. Similarly, Shin et al. identified a significant increasing trend in RE from 1961 to 2015 across five stations in South Korea, with a spatial pattern of higher erosivity in the western regions [15]. A study conducted by Musabbir et al. revealed that annual RE had a decreasing trend in Bangladesh from 1980 to 2017 [22]. Patriche et al. developed a nonparametric statistical model to forecast RE, concluding that RE is expected to rise in Romania, at least for the period spanning from 2041 to 2060 [23]. In China, many scholars have extensively discussed the spatiotemporal variations in RE. On a national level, numerous studies have indicated a gradual increase in RE, displaying a tendency of elevated values in the southeast and diminished values in the northwest, resembling the distribution of rainfall [24,25]. On a regional level, Feng et al. developed a detection framework for RE in the Three Gorges Reservoir using various statistical methods. They noted that significant changes in land use and evaporation might be the reasons for the spatiotemporal variations in RE [20]. He et al. discovered an upward trend in RE in the Luojiang River Basin from 1980 to 2019, showing a declining trend from the central part of the basin towards the periphery [12].
Analyzing the contribution of RE from various levels of rainfall to the total RE and identifying the dominant erosivity type in the study area are essential components for evaluating soil erosion risks and promoting sustainability in agriculture. However, existing research on RE has mainly concentrated on the spatiotemporal distribution and variation characteristics of RE on interannual, intraannual, and seasonal scales. There is limited coverage of relevant reports concerning the RE characteristics resulting from erosive rainfall of different levels. In China, Feng et al. utilized a combination of erosion theory and GIS technology to analyze the spatial variations in the growth rate of RE for different levels of rainfall in Shandong Province [26]. Zhao et al. categorized RE into three levels (moderate, large, heavy) based on the amount of rainfall and concluded that a large RE exerts a prevailing influence on the annual erosivity in Yunnan Province [27]. Li et al. determined that in the Taihang Mountain region, the generation and variations in RE are primarily associated with rainfall events characterized by a lower number of rainy days and higher rainfall intensities [28]. Jiang et al. investigated the effect of the Three Gorges Reservoir on RE of different levels by categorizing erosive precipitation into four levels [29]. Li et al. studied the interannual variation of RE at different levels in the Jiuqushui Watershed by using various statistical methods [30].
The spatial–temporal distribution of global rainfall will be modified with the progression of climate change [31]. Large-scale atmospheric circulations establish a foundation for the study of global climate variation and exert a significant effect on the evolving patterns of rainfall concentration and intensity [32]. Prominent large-scale atmospheric circulation patterns, including the El Niño–Southern Oscillation (ENSO), Pacific Decadal Oscillation (PDO), Atlantic Oscillation (AO), North Atlantic Oscillation (NAO), and Atlantic Multidecadal Oscillation (AMO), as well as regional-scale meteorological patterns, such as the Western Hemisphere Warm Pool (WHWP) and East Atlantic/Western Russia (EA/WR), have been extensively researched and verified to play a substantial role in influencing the spatiotemporal fluctuations in rainfall [31,33,34,35,36]. In addition, existing research has shown that solar activity can also have an impact on rainfall [37]. Rainfall is closely tied to soil erosion, so fluctuations in rainfall can lead to increased uncertainty in soil loss and potentially alter the distribution pattern of RE [13,38]. Numerous studies have examined how atmospheric indices affect RE in various regions. For instance, Angulo-Martínez and Beguería identified an inverse relationship between the RE and NAO in the Ebro Basin in northeast Spain [39]. The impact of climatic factors, including ENSO events and the Southern Oscillation Index (SOI), on the changing spatial patterns of RE in South Korea was investigated by Lee et al. through cross-correlation and lag regression analysis [40]. In China, Cao et al. identified a strong link between decadal variations in the rainy season and changes in sea surface temperature (SST), specific atmospheric circulation patterns, and the PDO. The PDO was determined to be a key driver behind the decadal shifts in the East Asian monsoon [41]. Liu et al. used cross-wavelet analysis to find the relationship between RE changes and ENSO events and PDO in the Loess Plateau during 1960–2010 [42]. Xu et al. concluded that the winter RE shows a long-term increase during the positive AO phase in the Huaihe River Basin [13]. However, due to the complex diversity of climate indicators, detailed research on the relationship between RE and climate indicators remains limited.
The trend in RE closely mirrors the rainfall distribution. Ponjiger et al. found that both RE and rainfall variability were very high in the Western Balkans region [43]. Musabbir et al. concluded that the spatial pattern of RE in Bangladesh aligns with the distribution of rainfall and erosive rainfall [22]. The rate of RE in China decreasing from southeast to northwest is significantly faster than rainfall, as was concluded by Zhang et al. [44]. Zhu et al. suggested a nonlinear association between average annual rainfall and RE. They indicated that a 1% change in mean annual rainfall would correspond to an expected difference of approximately 1.6% to 1.7% in the RE value in China [45]. Zhang et al. found that when rainfall conditions change, RE experiences more pronounced variations compared to changes in rainfall quantity, and the linear regression slope of the RE and rainfall increased from northwest to southeast on the Loess Plateau [46].
In summary, current research on China primarily focuses on the spatiotemporal distribution and variability in RE at different time scales [47,48,49,50]. There is limited investigation into the contributions of RE from different levels of rainfall to the total regional RE. Moreover, more research is concentrated in specific regions of China, with fewer studies addressing the overall regional characteristics. Additionally, the underlying relationship between rainfall and RE remains unclear, and the spatial variations in the response of RE to changes in rainfall have not been thoroughly studied. Research on large-scale atmospheric circulation indicators related to RE is also limited. Unlike previous studies, this paper takes a nationwide approach to research, considering the vast geographical diversity of China and the distinct regional characteristics of rainfall. In particular, there are pronounced differences in rainfall patterns between the monsoon and nonmonsoon regions [51,52,53]. Due to its special geographic position and topographical features, the Qinghai–Tibetan Plateau also exerts a distinctive influence on rainfall patterns in China [54,55]. Therefore, this paper divides China into three natural geographical regions: the East Monsoon Region (EMR), Northwest Arid Region (NAR), and Qinghai–Tibet Plateau Region (QTR). This division allows for a better comprehension of the changes and dominant types of RE in different regions, facilitating the implementation of region-specific management strategies. Furthermore, the key climatic factors closely linked to RE in China and its subregions were identified. Subsequently, we conducted an in-depth analysis of how RE responds to changes in rainfall. The research objective is not only to provide crucial insights into the rational sustainability and utilization of water and soil resources but also to offer theoretical references for soil erosion protection in China.
The primary goals of this study include (1) investigating the spatiotemporal patterns of RE in China; (2) determining the dominant types of RE within the nation and its three major subregions; (3) examining the teleconnections between RE and large-scale atmospheric circulation indices; and (4) analyzing the sensitivity of RE to changes in rainfall amount.

2. Materials and Methods

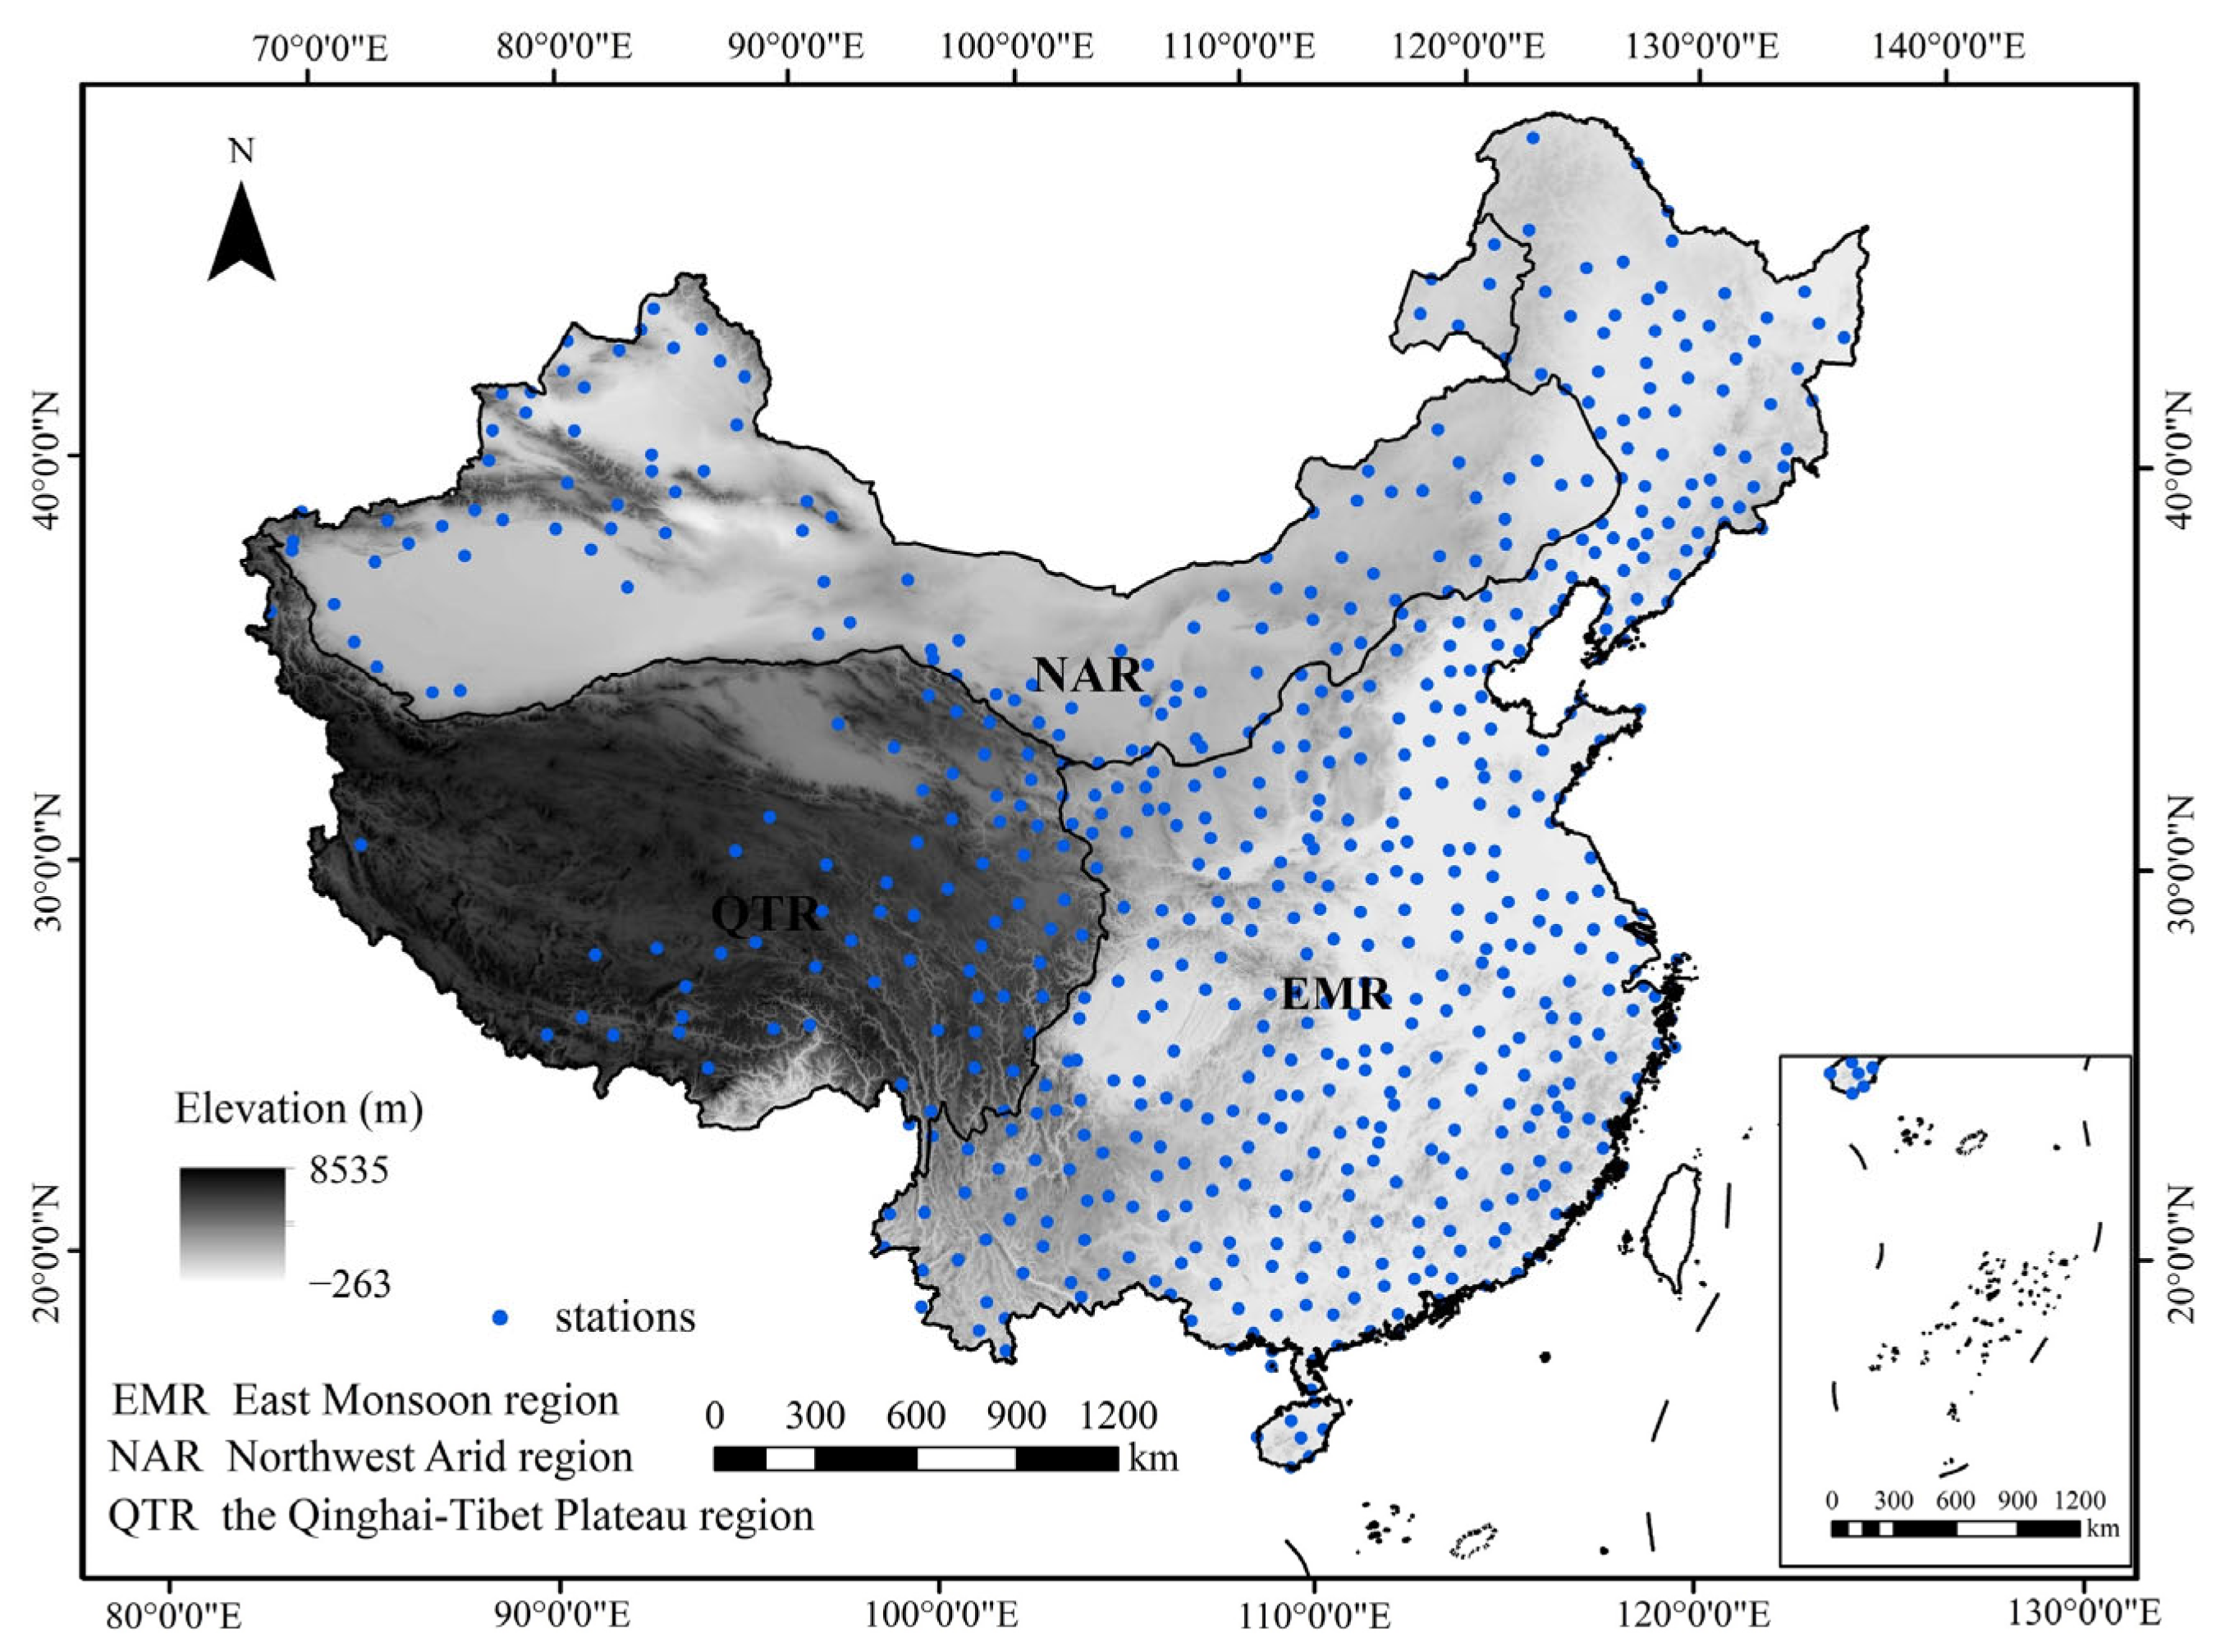
2.1. Study Area and Data

China is located between 3°31′00″ N–53°33′ N and 73°29′59.79″ E–135°2′30″ E. It has a total area of 9.6 million km2. The topography is complex and diverse across China, encompassing a wide range of landforms. China is in the monsoon-affected region, and every year in spring and summer, the East Asian summer monsoon brings in a significant amount of moisture, serving as the primary source of rainfall for the Eastern Monsoon Region of China [56]. Nonmonsoon regions in China, due to their inland location, as well as the influence of topographical features, experience a lesser impact from the East Asian summer monsoon. Additionally, within the nonmonsoon regions, there are climate variations. The Qinghai–Tibet Plateau, the world’s largest plateau, exhibits unique climatic conditions shaped by its complex topography [57,58]. The northwestern region is deeply inland and predominantly characterized by arid climates. Moisture related to intense rainfall events in this area is primarily transported by westerly winds [59]. Therefore, we adopted the physicogeographical regions of China (Figure 1) [60]. Regions EMR, NAR, and QTR refer to the Eastern Monsoon Region, Northwestern Arid Region, and Qinghai–Tibetan Plateau Region, respectively. These three major regions exhibit significant differences, including rainfall patterns, topographical features, and climatic conditions, which directly influence erosion processes. Dividing China into these three parts helps us better understand the spatiotemporal distribution of RE.
Daily rainfall data from 1960 to 2020 were obtained from the China Meteorological Administration (CMA). Figure 1 displays the distribution of the 611 chosen stations, and missing data for certain individual days were supplemented by averaging the rainfall data from the nearest two or more observations. In this study, referring to the above indices, it has been shown that atmospheric circulation and regional-scale meteorological patterns have a noticeable impact on Chinese rainfall [33,34,35]. Therefore, we used the Western Hemisphere Warm Pool (WHWP), Atlantic Multidecadal Oscillation (AMO), East Pacific/North Pacific Oscillation (EA/WR), Western Pacific Index (WP), East Central Tropical Pacific SST (Nino3.4), Southern Oscillation Index (SOI), Solar Flux, Atlantic Oscillation (AO), North Atlantic Oscillation (NAO), Pacific Decadal Oscillation (PDO), Sunspots (SS), and Solar Flux to detect the possible impacts of RE. We obtained monthly indices from the NOAA Physical Sciences Laboratory (https://psl.noaa.gov/data/ (accessed on 1 September 2023)) and assessed the significance of these indices on the changes in RE over China. The Royal Observatory of Belgium (ROB) (https://www.astro.oma.be/en/ (accessed on 1 September 2023)) provides long-term sunspot data series, which are available for download.

2.2. RE Calculation Procedure

The USLE assesses rainfall erosivity by considering the product of total precipitation kinetic energy and the intensity of rainfall (measured at 30 min intervals) during each specific rain event. However, acquiring continuous high-resolution precipitation data is difficult, and despite data availability, calculating RE from this type of data is challenging due to the intricate and laborious calculation process involved. To overcome these limitations, several uncomplicated RE algorithms have been developed that use readily available low-resolution rainfall data, such as annual precipitation data [61], monthly precipitation data [62], and daily precipitation data [54,63]. Zhang and Fu attempted to estimate RE by utilizing annual, monthly, and daily precipitation amounts [64]. The results showed that daily precipitation data had the smallest average relative error. Therefore, in studying the spatiotemporal variations in RE over interannual and seasonal time scales in large-scale regions, daily precipitation data are typically used. The data are readily available and provide sufficient resolution. Based on daily precipitation data, an RE assessment model was proposed [63], which has been widely used and proven to be accurate [13,22,54]. The formulas are shown as follows:
R i = α j = 1 k P j β
β = 0.8363 + 18.177 P d 12 + 24.455 P y 12
α = 21.586 β 7.1891
Here, R i is RE (MJ·mm·ha−1·h−1) in the ith half-month, and k denotes the total days in the respective ith half-month. P j represents the daily amount of erosive rainfall on the jth day within that half-month period. P j is taken as the actual rainfall when the amount of rainfall equals or exceeds the threshold value of 12 mm. If not, P j is treated as zero. The parameters α and β are unspecified. P d 12 represents the average daily rainfall exceeding 12 mm, and P y 12 is the yearly average rainfall for days with rainfall greater than 12 mm.
To further analyze the RE generated by different levels of rainfall, a daily amount of ≥12 mm is referred to as erosive rainfall. According to the classification standards for rainfall intensity levels issued by the CMA rainfall, erosive rainfall is classified into three levels, while moderate RE is defined as RE generated by daily precipitation ranging from 12 mm to 24.9 mm, large RE is defined as RE generated by daily precipitation ranging from 25 to 49.9 mm, and heavy RE is defined as RE generated by daily precipitation amounts greater than 50 mm. The corresponding REs are calculated based on the rainfall amounts for each level. The sum of RE for each level represents the total RE value for the respective period.

2.3. Linear Regression

Linear regression is widely utilized in the study of element variation trends due to its simplicity of operation, including the assessment of the RE trend [22,48]. The model is adopted to examine the RE temporal trend from 1960 to 2020. The equation for implementing the approach is shown as follows:
Y = α x + b
Here, Y represents the annual values of the variable from 1960 to 2020, and x represents the years from 1960 to 2020. b denotes the intercept, and α represents the slope of RE, which reflects the rate of change in the RE from 1960 to 2020.

2.4. Mann–Kendall Test

The Mann–Kendall (MK) test has been widely applied to detect trends in time series data and find the significance level of the long-term variation in RE [65,66]. The precise calculation procedure is outlined as follows:
Create an ordered column for the time series x , which consists of a sample size of n :
S k = i = 1 k r i   ( k = 2 , 3 , 4 , , n )
r i = + 1   w h e n   x i > x j 0   o t h e r w i s e   ( j = 1 , 2 , , i )
Then, both the average and the variance in S k are calculated as follows:
E S k = n n 1 4
Var S k = n n 1 2 n + 5 72
Finally, the sequential values U F k of the statistic are computed as follows:
U F k = S k E S k V a r S k
Here, U F k is a sequence of calculated statistical quantities based on the chronological order of the time series. Furthermore, the robustness and nonparametric nature of the MK test make it suitable for various types of time series data. Its calculations are relatively simple and easy to implement, and it finds extensive application in meteorological, hydrological, and environmental research. The sign of the Z value represents the trend of the factor in the time series. A positive Z-value indicates an increasing trend, while a negative Z-value signifies a decreasing trend. When the absolute value of Z exceeds 1.96 and 2.576, this trend change reaches significance levels of 0.05 and 0.01, respectively [67].

2.5. Random Forest Model

There are many factors influencing the changes in RE, but the magnitude of their impact varies. Identifying the key factors affecting RE changes is crucial. Random forest (RF) is employed to assess the impact potential of these factors. Random forest has become a crucial tool in the field of hydrometeorology due to its high performance and ease of use [35,36,68]. Generally, two methods are widely used for ranking the impact potential of multiple variables in the RF model. The first method is based on calculating the changes in out-of-bag error as a measure of index importance, while the second method is based on the reduction in the Gini coefficient as a measure of index importance. Given the greater stability of the second method over the first method [69], we chose to utilize the latter approach to assess the importance of each index, which could ensure a more robust evaluation. Subsequently, we measured the importance of each index to RE by using Formula (10).
P k = i = 1 n j = 1 t D G k i j k = 1 m i = 1 n D G k i j
where m, n, and t represent the collective count of indices, classification trees, and nodes. D G k i j signifies the Gini reduction value linked to the jth node in the ith tree associated with the kth index. P k reflects the degree of influence of the kth index relative to all the accessible indices. In this research, RF was utilized to assess the level of significance of em contributing variables affecting RE in China and its three subregions. Further insights into the principles of RF classification can be found in the research of Zheng et al. [70].

2.6. Contribution Rates

To quantitatively assess the variations in the contributions of diverse grades of RE to the overall RE, we conducted calculations to determine the proportions of RE from different grades relative to the total RE. The contribution rate of each level of RE can be determined using Equation (11) as follows:
C R a = R a / T × 100 %
where C R a represents the contribution of grade R RE to total RE in area a . a stands for the region (China, EMR, NAR, QTR), R a ( R = moderate; large; heavy) represents different levels of RE in a , and T indicates total RE.
For any study area, the contribution rates of different levels of RE to the total RE were compared, and the largest contribution rate was defined as the dominant RE type in the area.

3. Results

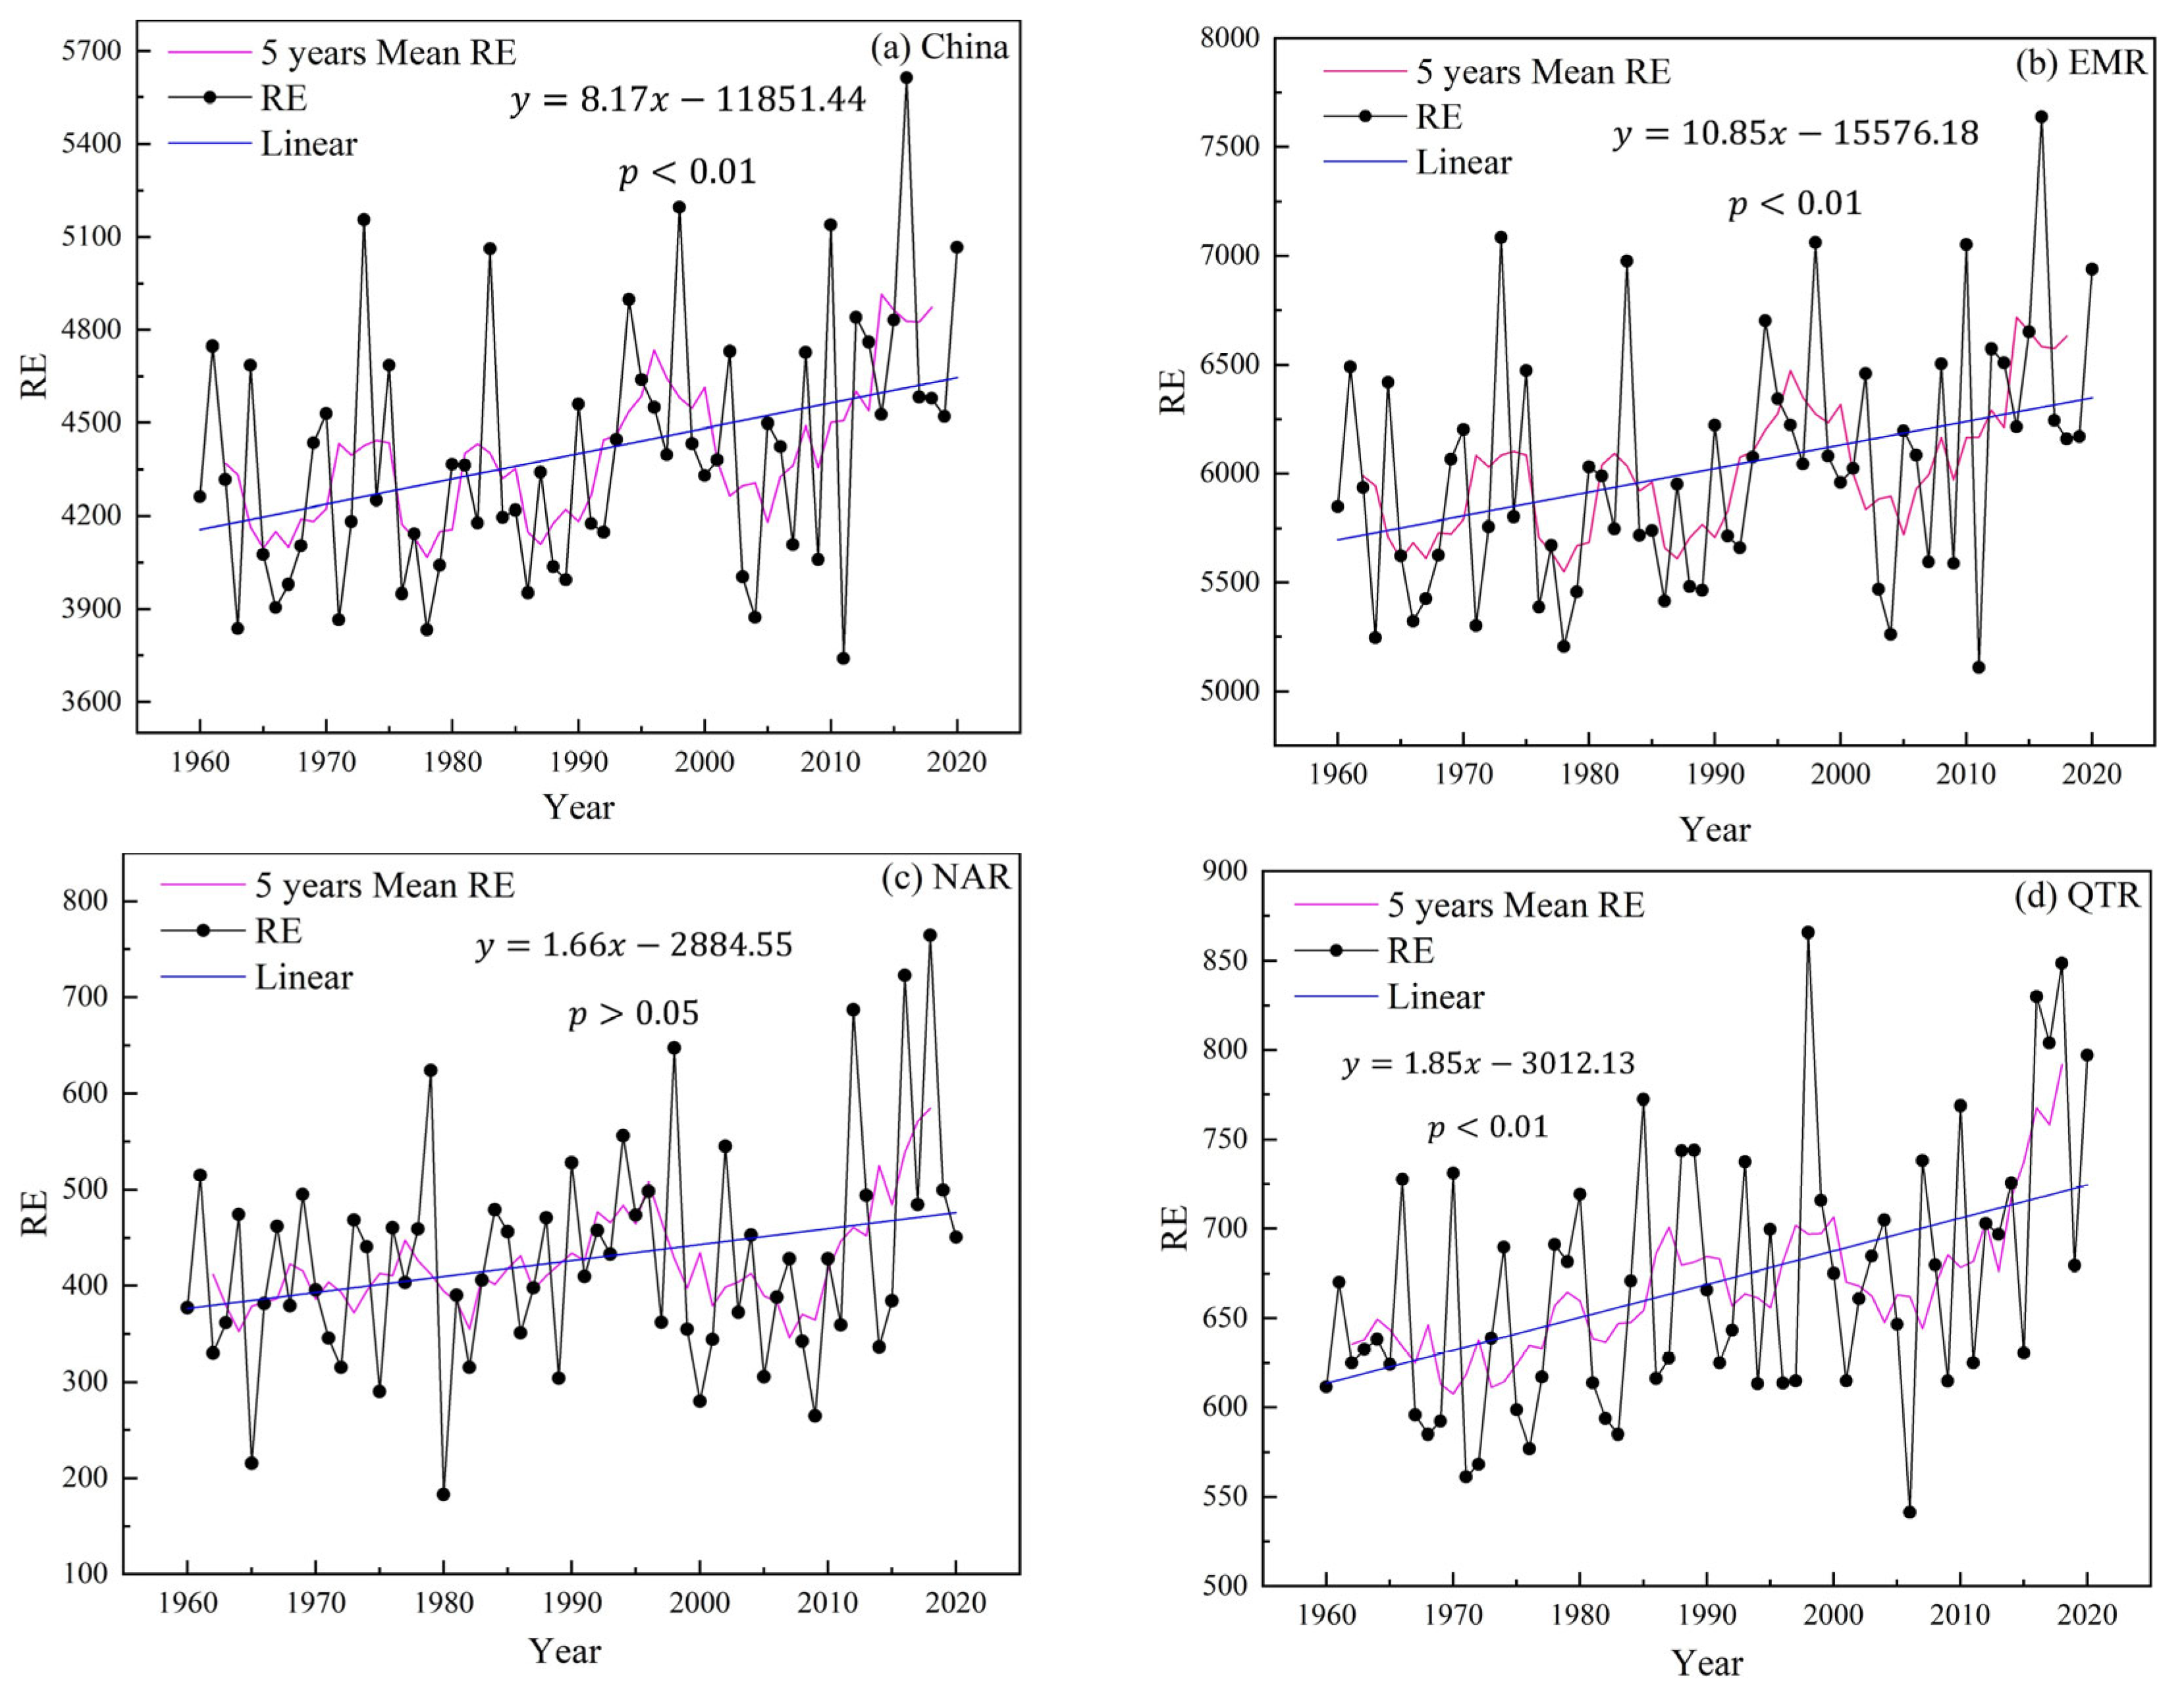
3.1. Temporal Variation Analysis of RE

The interannual variation in the annual RE in China and its three major natural zones from 1960 to 2020 is shown in Figure 2. The mean annual RE from 1960 to 2020 was 4401.53 MJ·mm·ha−1·h−1 for mainland China, with a minimum of 3740.04 MJ·mm·ha−1·h−1 occurring in 2011 and a maximum of 5613.46 MJ·mm·ha−1·h−1 in 2016, demonstrating that RE is variable. Furthermore, the regression analysis demonstrated a highly significant (p < 0.01) upwards trend in the mean annual RE, indicating an increase at a rate of 81.7 MJ·mm·ha−1·h−1/decade (Figure 2a). From the subregion perspective, the mean annual RE for the EMR, NAR, and QTR are 6023.40 MJ·mm·ha−1·h−1, 426.42 MJ·mm·ha−1·h−1, and 668.99 MJ·mm·ha−1·h−1, respectively. The EMR and QTR exhibited significant upwards trends (p < 0.01), with growth rates of 108.54 MJ·mm·ha−1·h−1/decade and 18.50 MJ·mm·ha−1·h−1/decade, respectively. The trend in NAR RE over the 60-year period also showed an increase at a rate of 16.64 MJ·mm·ha−1·h−1/decade but did not pass the significance test at the 0.05 level (Figure 2b–d).

3.2. Spatial Distribution of RE

The 60-year annual RE is depicted in Figure 3. The national average RE is 4401.53 MJ·mm·ha−1·h−1, which reveals a spatial pattern characterized by an increase in RE from the northwest to the southeast, with values ranging from 60.15 MJ·mm·ha−1·h−1 to 31418.52 MJ·mm·ha−1·h−1. For the three subregions, there are obvious differences, with EMR, NAR, and QTR having RE values of 6023.40 MJ·mm·ha−1·h−1, 426.42 MJ·mm·ha−1·h−1, and 668.99 MJ·mm·ha−1·h−1, respectively. Among them, EMR has the highest RE value, making the largest contribution to China. Spatial variations in trends for RE were also notable across the monitoring stations, and the spatial distribution of changing trends in annual RE, along with their statistical significance, was determined through linear regression and the MK test (Figure 4). In the spatial distribution of the changing trend of annual RE in China, it ranged from −372 MJ·mm·ha−1·h−1/decade to 1021 MJ·mm·ha−1·h−1/decade. A total of 71.03% of the meteorological stations showed increasing trends (Table 1), where a significant RE trend was primarily found in the southeastern region of the EMR, the northeastern part of the QTR, and the western part of the NAR. The stations showing a declining trend accounted for 28.97% of the total stations, and the significant decreasing trend was mainly concentrated in the southwestern part of China and the surrounding areas of the Bohai Sea. In three subregions, a corresponding observation was noted, with the majority of stations exhibiting an upwards trend.

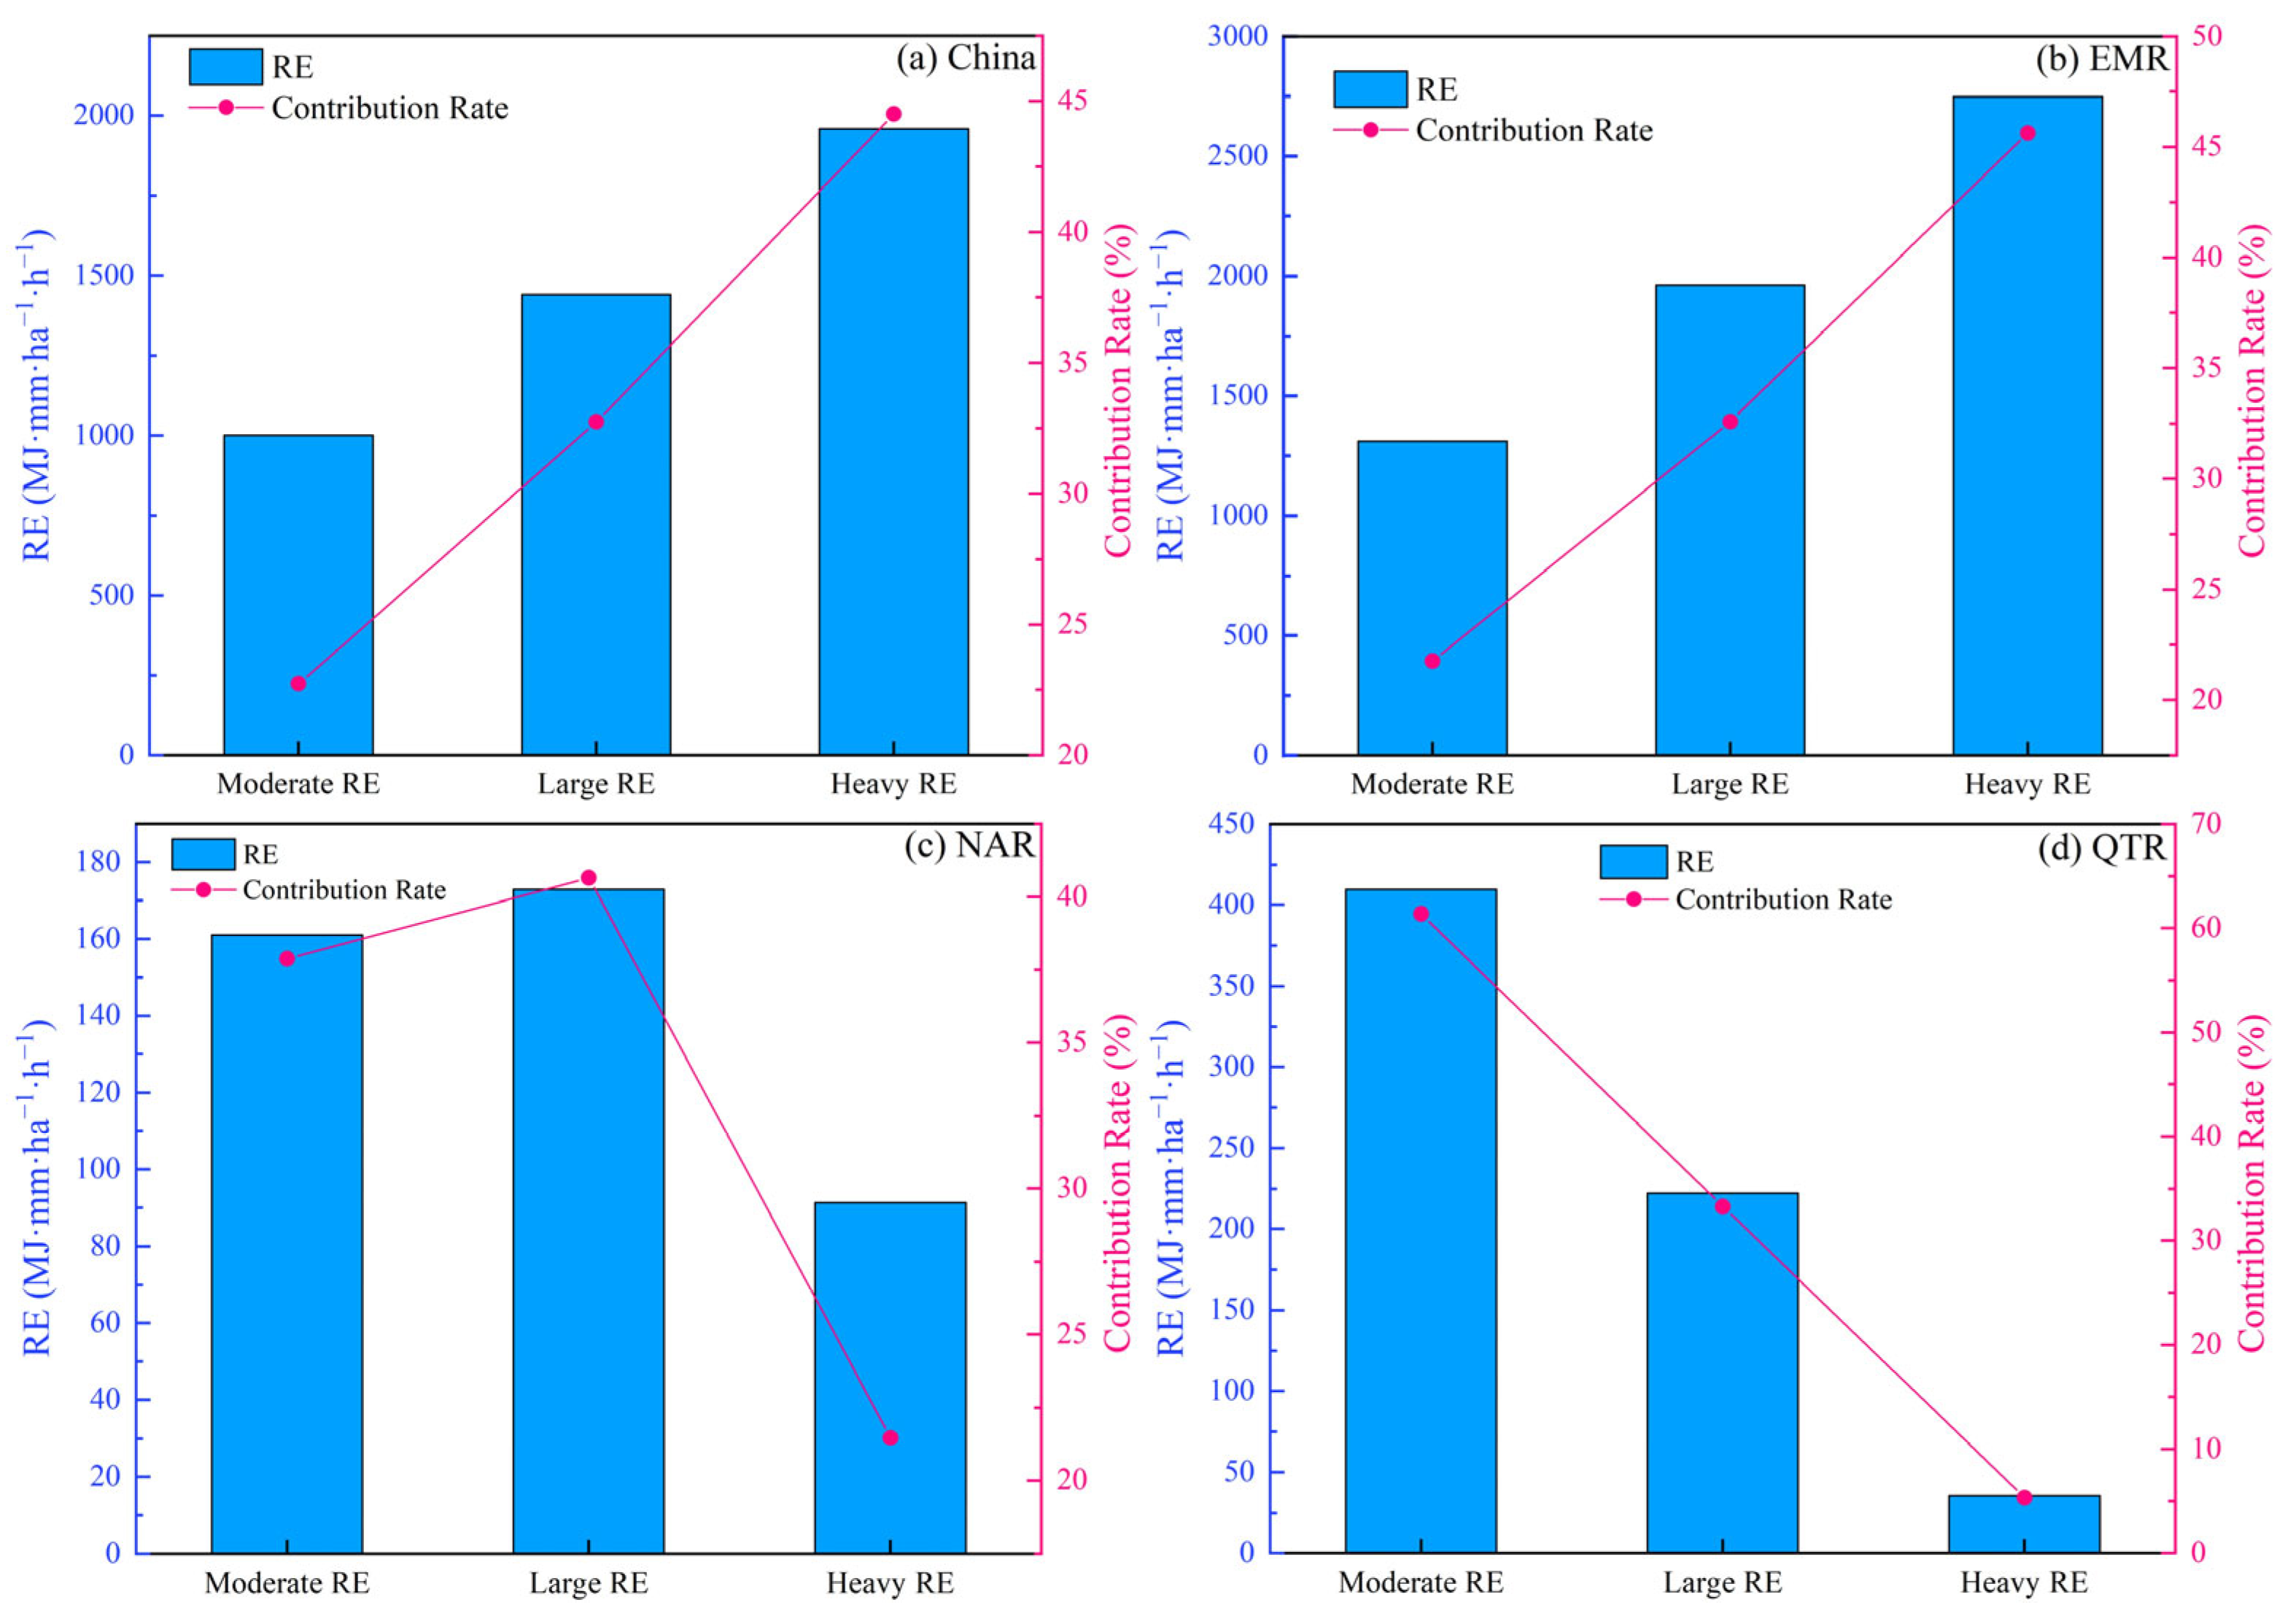
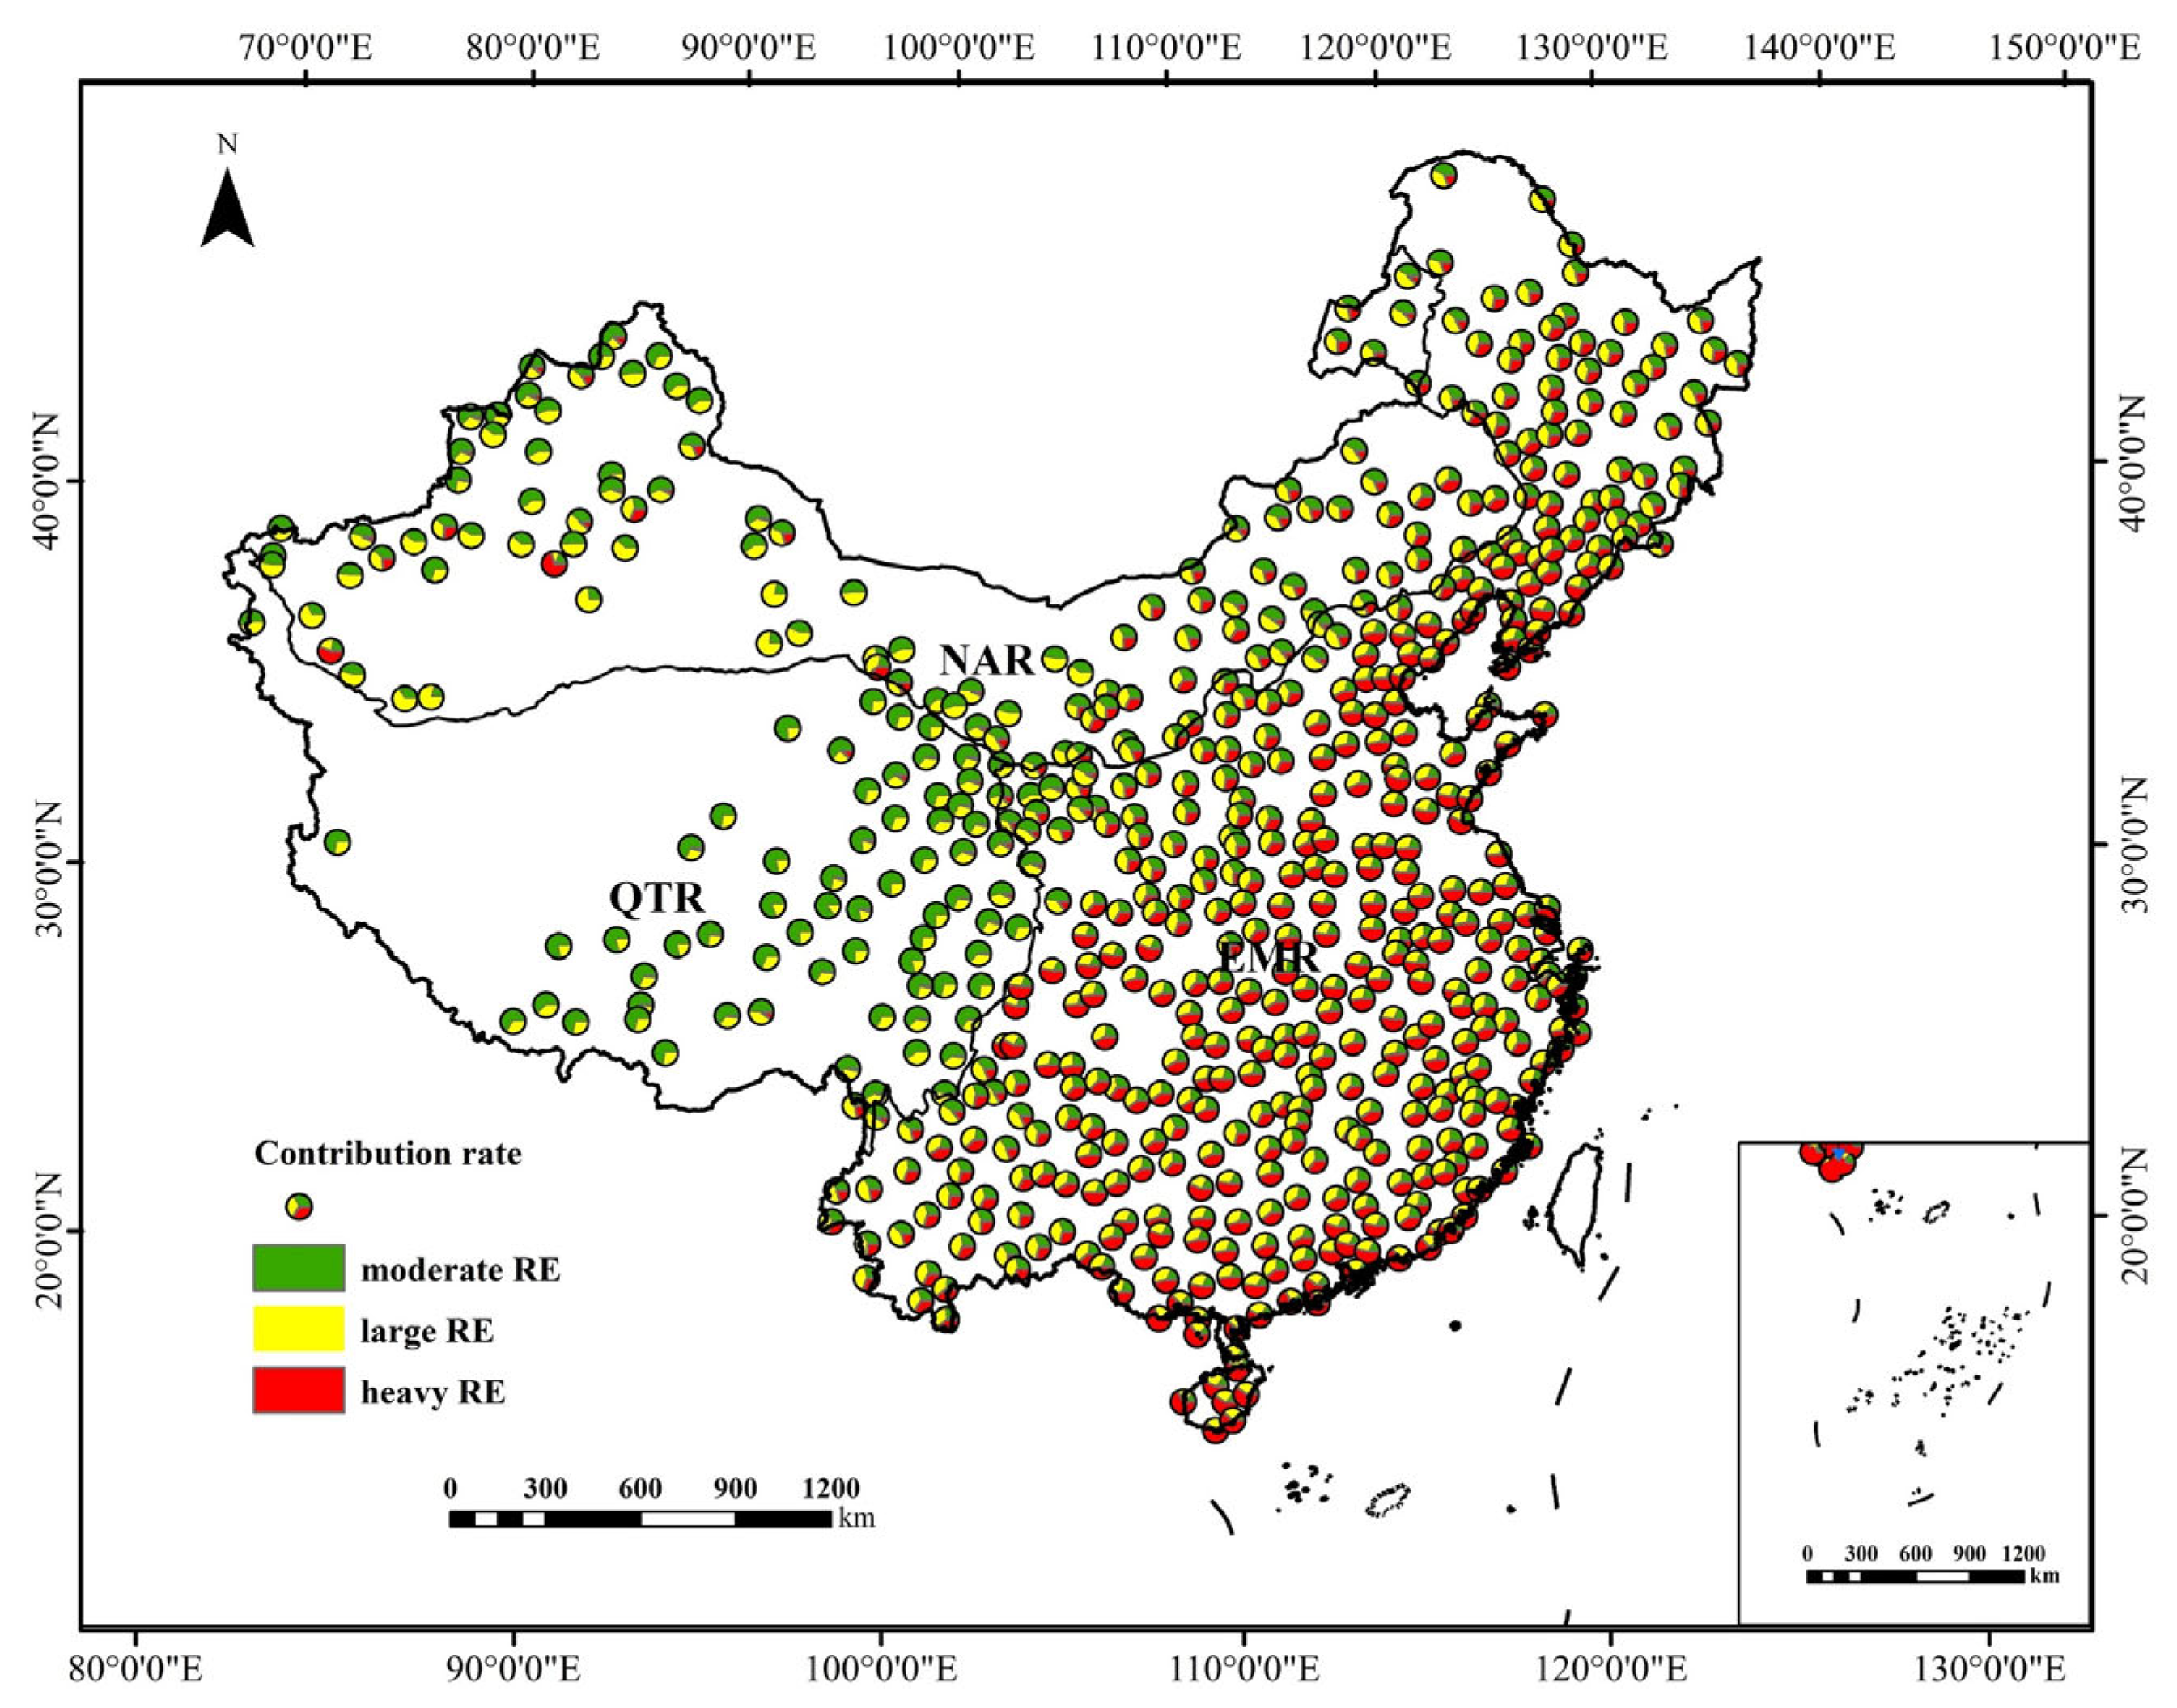
3.3. Contribution Rates for RE Generated by Different Levels of Rainfall

The contribution rate of RE generated by different levels of rainfall to the total RE can be evaluated by the proportion of RE generated by rainfall of different intensities. Figure 5 illustrates the annual average values and percentages of different intensities of RE from 1960 to 2020, indicating that the dominant type of RE varies across different regions in China.
At the national level, the contribution rates for RE of different intensities followed this order: heavy RE, large RE, and moderate RE. Consequently, heavy RE dominates the overall RE in China, with a long-term mean RE of 1959.22 MJ·mm·ha−1·h−1, accounting for 44.51% of the total annual RE. Moreover, heavy RE prevails in 266 out of the total stations, constituting 43.54% of all stations (Figure 5a and Figure 6). Similarly, in EMR, heavy RE is the dominant type, with a long-term mean RE value of 2748.10 MJ·mm·ha−1·h−1, contributing 45.63% of the total annual RE. Within this region, heavy RE dominates in 260 out of the total stations, representing 60.33% of all stations (Figure 5b and Figure 6). However, the situation in NAR is different. In NAR, large RE is the principal type, with the contribution rates of different RE intensities ranking as follows: large RE, moderate RE, and heavy RE. The contribution rate of large RE reaches 40.65%, and it constitutes the highest proportion among all RE intensities in 49.11% of the stations within the region (Figure 5c and Figure 6). In the QTR, moderate RE prevails, contributing to 61.37% of the total annual RE, and the majority of stations are dominated by moderate RE (Figure 5d and Figure 6).

3.4. Relationship between Rainfall and RE

The spatiotemporal variability of RE in China closely aligns with the geographic distribution of rainfall, suggesting that rainfall plays a predominant role in determining both the quantity and spatial pattern of RE [71,72]. Hence, to further elucidate the connection between RE and rainfall, we conducted a quantitative analysis of their relationship. Figure 7 illustrates the response of RE to the long-term increase in rainfall amounts. The findings reveal that for each 1 mm increase in annual rainfall, there was a significant RE increase by 8.54 MJ·mm·ha−1·h−1/mm in China, and the regression relationship exhibited statistical significance (p < 0.01) (Figure 7a). Likewise, in its three subregions, the linear regression slopes for RE and rainfall amount were statistically significant and displayed positive values exceeding 1 MJ·mm·ha−1·h−1/mm (Figure 7b–d). This finding suggests that annual changes in RE were more pronounced than those in annual rainfall.
Moreover, the slopes of the linear regression of the three subregions in China demonstrated a sequence of EMR > NAR > QTR. In other words, in EMR, RE has the strongest sensitivity to the change in rainfall, and the change in RE is 8.71 MJ·mm·ha−1·h−1 for every 1 mm change in annual rainfall. The sensitivity of RE to rainfall is gradually weakened in NAR and QTR, which are 6.19 MJ·mm·ha−1·h−1/mm and 3.60 MJ·mm·ha−1·h−1/mm, respectively. This finding indicates that there are variations in the sensitivity of RE to changes in rainfall across different regions.

3.5. Role of Impact Factors on RE through Random Forest

The Gini decrease index was employed to evaluate how WHWP, AMO, EA/WR, WP PDO, NAO, AO, Nino3.4, SOI, SF, and SS influenced the variations in RE across the three subregions in China (Figure 8). Histograms showing the importance levels of the factors for RE are exhibited in Figure 8. The study indicates that there are variations in the main influencing factors across different subregions. The WHWP is identified as the most important index affecting RE changes in the EMR, while the NAO is the most important index influencing erosivity changes in the NAR, and the AMO is the primary indicator affecting erosivity changes in the QTR. The impact of SOI, SS, and SF on RE changes in the three subregions is not significant, and they have relatively lower importance. Additionally, EA/WR also plays an important role in RE changes, ranking among the top three indices in all three subregions.

4. Discussion

4.1. Spatiotemporal Variability in RE in China

Based on the analysis of the annual variation trends of RE in China from 1960 to 2020, RE exhibits a significant upward trend at the national level. Within regional scales, significant increases in RE are observed in EMR and QTR; although the NAR region did not pass the significance test, it still exhibits an increasing trend. This result is consistent with Su et al., who showed that the annual rainfall trend significantly increased at a rate of 11.0 mm/decade in China [73]. A similar result was also reported by Wang et al., who found a significantly increasing trend of RE in the Yellow River basin [74]. However, these findings differ from the result obtained by Xin et al., who found a decreasing trend in the RE in the Chinese Loess Plateau [75]. Angulo-Martinez and Begueria also reported a decreasing trend of annual RE in NE Spain [76]. This finding may be ascribed to the different research periods. The time series of the above studies do not encompass recent years. However, annual average precipitation sharply increased after 2005, and extreme precipitation has increased substantially since 2000, which is substantial enough to impact the overall trend of RE in China from 1960 to 2020 [77].
The average RE in China is 4401.53 MJ·mm·ha−1·h−1, which is higher than the global average RE. The value falls within the top 50% percentile range in the world. It is also above the average level of Asia, but lower compared to the regions of South America and Central Africa [78]. The annual RE distribution in China exhibits notable spatial differences, showing an increasing pattern from northwest to southeast. This pattern aligns with previous research conducted in China [24,25,45]. Previous studies have indicated that the geographical variation in annual RE can be ascribed in part to the interplay between intricate terrain features and prevailing atmospheric conditions [41,79,80]. The northwestern region of China is far from the sea and characterized by numerous high mountains, which hinder the movement of atmospheric moisture, resulting in limited precipitation and lower RE. In contrast, the southeastern region is near the ocean and receives abundant water vapor, leading to higher annual rainfall and greater RE. In addition, there are differences among the dominant types of RE in the three subregions. The EMR, NAR, and QTR are dominated by heavy RE, large RE, and moderate RE, respectively. Previous research has shown that heavy rainfall is mostly dominant in the frequency of rainfall in EMR [81]. Xu et al. also showed that in western China, moderate and large rainfall exert a predominant influence on the increase in precipitation amounts, whereas in eastern China, heavy rainfall dominates the contribution to rainfall amounts [82]. Reportedly, east China experiences the highest levels of extreme precipitation in summer [83], and extreme precipitation events are the primary contributing factor to the annual and summer half-year precipitation in eastern China [84]. This finding can be attributed to the strong impact of the summer monsoon in this region, where monsoonal airflows blow from the ocean to the land, carrying a large amount of moisture. When these monsoonal airflows encounter topographic barriers or complex meteorological systems, they generate strong convective activities, leading to the occurrence of heavy rainfall [85]. In NAR, the location is an inland area, and the rainfall in this area is relatively low in quantity and occurs sporadically [86,87]. Moreover, influenced by the Central Asian Low Vortex, short-duration strong rainfall frequently occurs in the northwestern region of China [88]. Previous studies have indicated that the contribution rate of short-duration strong rainfall at 71.4% of the stations in Xinjiang, China, ranges from 10.0% to 25.0% [89]. Furthermore, influenced by the terrain features, high-intensity rainfall events may still occur in certain areas and seasons [90]. In the QTR, a moderate RE is predominant because the Qinghai–Tibetan Plateau is located in a high-altitude plateau area with a cold climate and relatively low precipitation and contains one of the world’s largest permafrost areas [91]; thus, precipitation mainly consists of moderate rain or snow, resulting in relatively weak erosivity. Therefore, moderate RE is the primary characteristic in this region.

4.2. RE Related to Atmospheric Circulation Indices

Tropical oceanic phenomena and atmospheric circulation systems are correlated with RE in China. As shown in Figure 8, the dominant circulation factors causing changes in RE differ in China. At the national scale, the West Pacific Warm Pool (WHWP) exerts an important influence on China’s RE, which agrees with the findings of Park et al. [92]. However, this contradicts the results of Angulo-Martinez and Begueria, who suggest that the Mediterranean Oscillation (MO) and Western Mediterranean Oscillation (WeMO) exhibit the strongest influence on daily RE in NE Spain. This difference results from the fact that Spain is situated along the Mediterranean coast and falls within the Mediterranean climate, where precipitation is primarily influenced by Mediterranean cyclones [39]. The position of China is in the East Asia region, where the East Asian monsoon serves as the primary source of rainfall. Consequently, the different sources of precipitation lead to variations in the influencing circulation patterns. At the regional scale, the WHWP serves as the primary circulation factor influencing RE in the EMR. Park et al. concluded that the changes in summer SST of the WHWP near North American inland seas contribute significantly to climate variability in the northwest Pacific (including the eastern and southern regions of China) [92]. Zhang et al. found a close correlation between the cumulative frequency of precipitation intensity in the range of 20–50 mm per hour in the Three Gorges Reservoir area and the WHWP index in February [34]. The NAO is the dominant atmospheric circulation factor affecting RE in NAR. Lee et al. identified a positive correlation between the NAO and rainfall in the northwestern region at decadal to centennial scales [93]. Yu et al. also established a significant negative correlation between a weak (strong) NAO and the displacement of the westerly jet stream along with decreased (increased) associated moisture over China’s northwest, leading to drought conditions [94]. The AMO is the primary circulation factor influencing RE in the QTR. Sun et al. demonstrated that the positive phase of the AMO has led to an anomalous subtropical westerly jet, resulting in increased summer precipitation within the Qinghai–Tibetan Plateau since the mid-1990s [33]. Zhang et al. found a consistent changing trend between the average cumulative precipitation in most parts of the Qinghai–Tibetan Plateau and the AMO index. The factors influencing RE in China are likely to be varied, encompassing temperature, rainfall, topographic characteristics, and large-scale atmospheric circulations, among others [95]. These elements do not exist in isolation but are frequently intertwined through atmospheric circulation and intricate physical processes and mechanisms. Furthermore, due to natural constraints such as topography and climate, meteorological stations exhibit uneven distribution, with sparse coverage in mountainous areas and differences in density between urban and rural stations. These characteristics contribute to increased uncertainty in research outcomes [96,97]. Consequently, there is a need for further analysis aimed at a quantitative and systematic examination of these impact factors and their interconnections. Pursuing research in this direction will contribute to enhancing strategies for mitigating regional hazards.

4.3. Sensitivity of RE to Rainfall

In this research, the sensitivity varies spatially across different regions. The EMR exhibited the highest sensitivity, with a value of 8.71 MJ·mm·ha−1·h−1/mm, followed by the NAR with 6.19 MJ·mm·ha−1·h−1/mm, while the QTR showed relatively lower sensitivity, with 3.60 MJ·mm·ha−1·h−1/mm. The results are similar to the calculations by Lai et al. [3]. Zhang et al. also concluded that sensitivity coefficients are higher in the southeast than in the northwest in the Loess Plateau region [46]. Existing research has indicated that despite a slight decrease in average precipitation occurring in some eastern areas of China, the occurrence of heavy and extremely heavy rainfall events has notably increased, and heavy rainfall contributes predominantly to precipitation [82,98]. Moreover, under the backdrop of global warming, precipitation in the QTR and NAR exhibits an upward trend [98]. To further explore the reasons for the spatial variability in sensitivity, the contribution rates of changes in erosive rainfall of different levels to the overall erosive rainfall changes were calculated. In other words, the level of rainfall changes that predominantly drive the changes in total rainfall are investigated.
C P i = mean P i a P i b T i a T i b   ( a > b )
where C P i represents the contribution of grade P erosive rainfall changes to total erosive rainfall changes in area i . P ( P = moderate; large; heavy) represents different levels of erosive rainfall; T indicates total erosive rainfall. a and b represents the years from 1960 to 2020. Simultaneously, the z-score method is used to remove outliers before the averaging treatment [99]. According to Figure 9, it is evident that changes in heavy rainfall exert a substantial influence on the fluctuations in erosive precipitation in the EMR, and the contribution rate of heavy rainfall variations to the total erosive rainfall changes is 67.95%. In other words, the increase in heavy rainfall primarily contributes to the rise in erosive rainfall in EMR. In contrast to EMR, the increase in moderate rainfall, contributing 72.93%, is the main driver of erosive rainfall changes in the QTR, while in NAR, the increase in large rainfall is the primary cause of such variations, contributing 45.80%. High-intensity rainfall significantly contributes more to erosivity than low-intensity rainfall [25]. Consequently, despite similar changes in rainfall amount, the distinct patterns of rainfall type changes result in different variations in erosive rainfall across these three regions. As a result, the sensitivity coefficient of RE is lower in northwestern regions than in southeastern regions.

5. Conclusions

This study utilized the data of 611 stations in China from 1960 to 2020 to analyze the spatiotemporal variation characteristics of RE and the contribution rate of RE generated by different levels of rainfall to total RE in the three subregions of China and explored its associated influencing factors. Furthermore, the sensitivities of RE to rainfall were analyzed. The main results are described as follows:
(1)
In the entire region of China, the annual RE shows a significant increasing trend, with a change rate of 81.7 MJ·mm·ha−1·h−1/decade. In the three subregions, EMR and QTR also exhibit significant increasing trends in annual RE, while NAR shows a nonsignificant increasing trend.
(2)
There are differences in the dominant types of RE among the three subregions. In EMR, heavy RE prevails; in NAR, large RE is dominant; and in QTR, moderate RE prevails.
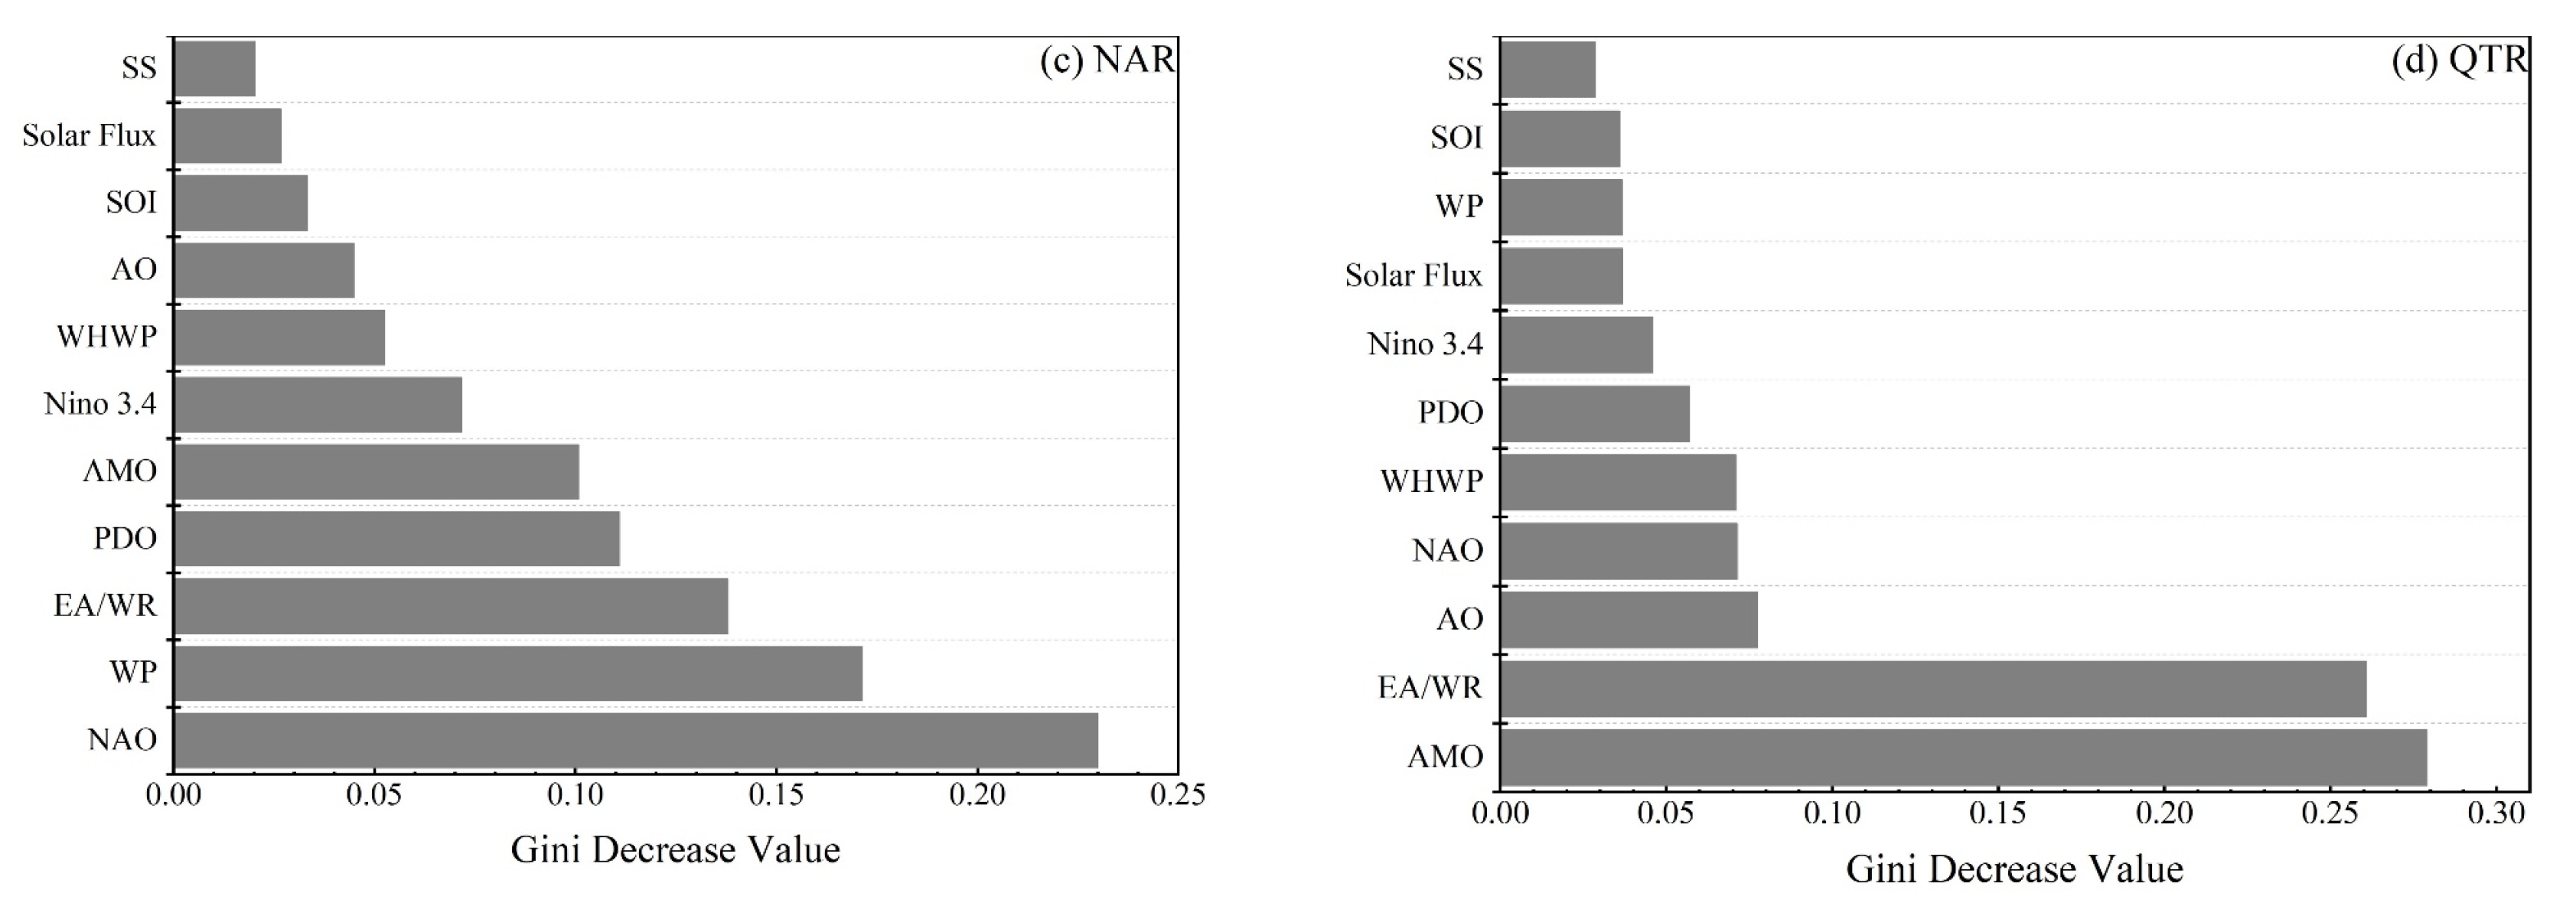
(3)
In three different regions of China, the dominant atmospheric circulation indices affecting RE are not the same. WHWP, NAO, and AMO events are the dominant circulation factors influencing changes in RE in the EMR, NAR, and QTR, respectively.
(4)
In China, there is spatial variation in the sensitivity of RE to annual rainfall changes. The EMR exhibits the highest sensitivity to rainfall changes, with a sensitivity coefficient of 8.71 MJ·mm·ha−1·h−1/mm, followed by a decreasing sensitivity in NAR and QTR.
Our study suggests that, for the eastern region of China, the focus of erosion prevention should shift from traditional erosive rainfall to the prevention of heavy rainfall erosion. In the northern and western regions, raising awareness of the increasing trend of large RE and enhancing the existing level and intensity of management of soil erosion are necessary. In the Qinghai–Tibet Plateau, emphasis should be placed on soil erosion caused by low-level rainfall. Taking appropriate soil conservation measures in the face of different levels of RE is essential to ensure the sustainable development of land ecosystems. This study can offer scientific guidance for regional agricultural production and soil erosion predictions.

Author Contributions

Conceptualization, M.D.; Methodology, C.L. and Q.L.; Software, M.D. and Q.L.; Original draft preparation writing, M.D., C.L., Z.C. and Y.W. All authors have read and agreed to the published version of the manuscript.

Funding

The Project of Beijing Key Laboratory of Traditional Chinese Medicine Protection and Utilization (BJZYL-KF-2023-4), and The Central Public-interest Scientific Institution Basal Research Fund of China (No. CKSF2023311/TB and CKSF2021485/TB).

Institutional Review Board Statement

Not applicable.

Informed Consent Statement

Not applicable.

Data Availability Statement

Daily rainfall data from 1960 to 2020 can be found in the China Meteorological Administration (CMA) (http://data.cma.cn/ (accessed on 1 September 2023)). Monthly atmospheric circulation indices can be obtained from the NOAA Physical Sciences Laboratory (https://psl.noaa.gov/data/ (accessed on 1 September 2023)). The Royal Observatory of Belgium (ROB) (https://www.astro.oma.be/en/ (accessed on 1 September 2023)) provides long-term sunspot data series, which are available for download.

Conflicts of Interest

The authors declare no conflict of interest.

References

  1. Hoyos, N.; Waylen, P.R.; Jaramillo, Á. Seasonal and spatial patterns of erosivity in a tropical watershed of the Colombian Andes. J. Hydrol. 2005, 314, 177–191. [Google Scholar] [CrossRef]
  2. Jiang, N.; Yao, F.; Liu, T.; Chen, Z.; Hu, C.; Geng, X. Estimating the Soil Erosion Response to Land-Use Change Using GIS-Based RUSLE and Remote Sensing: A Case Study of Heilongjiang Province, China. Sustainability 2023, 15, 8004. [Google Scholar] [CrossRef]
  3. Lai, C.; Chen, X.; Wang, Z.; Wu, X.; Zhao, S.; Wu, X.; Bai, W. Spatio-temporal variation in rainfall erosivity during 1960–2012 in the Pearl River Basin, China. Catena 2016, 137, 382–391. [Google Scholar] [CrossRef]
  4. Lee, J.-H.; Heo, J.-H. Evaluation of estimation methods for rainfall erosivity based on annual precipitation in Korea. J. Hydrol. 2011, 409, 30–48. [Google Scholar] [CrossRef]
  5. Wischmeier, W.H.; Smith, D.D. Predicting Rainfall Erosion Losses: A Guide to Conservation Planning (No. 537); Department of Agriculture, Science and Education Administration: Washington, DC, USA, 1978.
  6. Renard, K.G.; Foster, G.R.; Weesies, G.A.; Mccool, D.K.; Yoder, D.C. Predicting Soil Erosion by Water: A Guide to Conservation Planning with the Revised Universal Soil Loss Equation (RUSLE); Agriculture Handbook; USDA: Washington, DC, USA, 1997.
  7. Lin, J.; Lin, Y.; Zhao, H.; He, H. Soil Erosion Processes and Geographical Differentiation in Shaanxi during 1980–2015. Sustainability 2022, 14, 10512. [Google Scholar] [CrossRef]
  8. Fang, F.; Fang, Q.; Yu, W.; Fan, C.; Zi, R.; Zhao, L. RUSLE Model Evaluation of the Soil and Water Conservation Ratio of the Guizhou Province in China between 2000 and 2019. Sustainability 2022, 14, 8219. [Google Scholar] [CrossRef]
  9. Ali, A.A.; Al-Abbadi, A.M.; Jabbar, F.K.; Alzahrani, H.; Hamad, S. Predicting Soil Erosion Rate at Transboundary Sub-Watersheds in Ali Al-Gharbi, Southern Iraq, Using RUSLE-Based GIS Model. Sustainability 2023, 15, 1776. [Google Scholar] [CrossRef]
  10. Wang, Z.; Su, Y. Assessment of Soil Erosion in the Qinba Mountains of the Southern Shaanxi Province in China Using the RUSLE Model. Sustainability 2020, 12, 1733. [Google Scholar] [CrossRef]
  11. Chen, G.; Zhang, Z.; Guo, Q.; Wang, X.; Wen, Q. Quantitative Assessment of Soil Erosion Based on CSLE and the 2010 National Soil Erosion Survey at Regional Scale in Yunnan Province of China. Sustainability 2019, 11, 3252. [Google Scholar] [CrossRef]
  12. He, J.; Wan, Y.-R.; Chen, H.-T.; Wang, S.-L. Effects of Land Use Change on Rainfall Erosion in Luojiang River Basin, China. Sustainability 2022, 14, 8441. [Google Scholar] [CrossRef]
  13. Xu, Y.; Sun, H.; Ji, X. Spatial-temporal evolution and driving forces of rainfall erosivity in a climatic transitional zone: A case in Huaihe River Basin, eastern China. Catena 2021, 198, 104993. [Google Scholar] [CrossRef]
  14. Lee, J.H.; Julien, P.Y.; Cho, J.; Lee, S.; Kim, J.; Kang, W. Rainfall erosivity variability over the United States associated with large-scale climate variations by El Niño/southern oscillation. Catena 2023, 226, 107050. [Google Scholar] [CrossRef]
  15. Shin, J.-Y.; Kim, T.; Heo, J.-H.; Lee, J.-H. Spatial and temporal variations in rainfall erosivity and erosivity density in South Korea. Catena 2019, 176, 125–144. [Google Scholar] [CrossRef]
  16. Sujatha, E.R.; Sridhar, V. Landslide susceptibility analysis: A logistic regression model case study in Coonoor, India. Hydrology 2021, 8, 41. [Google Scholar] [CrossRef]
  17. Sujatha, E.R.; Sridhar, V. Mapping debris flow susceptibility using analytical network process in Kodaikkanal Hills, Tamil Nadu (India). J. Earth Syst. Sci. 2017, 126, 116. [Google Scholar] [CrossRef]
  18. Ballabio, C.; Borrelli, P.; Spinoni, J.; Meusburger, K.; Michaelides, S.; Begueria, S.; Klik, A.; Petan, S.; Janecek, M.; Olsen, P.; et al. Mapping monthly rainfall erosivity in Europe. Sci. Total Environ. 2017, 579, 1298–1315. [Google Scholar] [CrossRef] [PubMed]
  19. Klik, A.; Haas, K.; Dvorackova, A.; Fuller, I.C. Spatial and temporal distribution of rainfall erosivity in New Zealand. Soil Res. 2015, 53, 815–825. [Google Scholar] [CrossRef]
  20. Feng, Q.; Dong, L.; Liu, J.; Liu, H. Detection Framework of Abrupt Changes and Trends in Rainfall Erosivity in Three Gorges Reservoir, China. Sustainability 2023, 15, 2062. [Google Scholar] [CrossRef]
  21. Micic Ponjiger, T.; Lukic, T.; Basarin, B.; Jokic, M.; Wilby, R.L.; Pavic, D.; Mesaros, M.; Valjarevic, A.; Milanovic, M.M.; Morar, C. Detailed Analysis of Spatial-Temporal Variability of Rainfall Erosivity and Erosivity Density in the Central and Southern Pannonian Basin. Sustainability 2021, 13, 13355. [Google Scholar] [CrossRef]
  22. Musabbir, M.; Islam, A.R.M.T.; Rahman, M.S.; Pal, S.C.; Alam, E.; Mallick, J. Spatiotemporal variability of rainfall erosivity and its teleconnection with atmospheric circulation in monsoon-driven climate region. Catena 2023, 221, 106762. [Google Scholar] [CrossRef]
  23. Patriche, C.V.; Rosca, B.; Pirnau, R.G.; Vasiliniuc, I.; Irimia, L.M. Simulation of Rainfall Erosivity Dynamics in Romania under Climate Change Scenarios. Sustainability 2023, 15, 1469. [Google Scholar] [CrossRef]
  24. Qin, W.; Guo, Q.; Zuo, C.; Shan, Z.; Ma, L.; Sun, G. Spatial distribution and temporal trends of rainfall erosivity in mainland China for 1951–2010. Catena 2016, 147, 177–186. [Google Scholar] [CrossRef]
  25. Chen, Y.; Xu, M.; Wang, Z.; Chen, W.; Lai, C. Reexamination of the Xie model and spatiotemporal variability in rainfall erosivity in mainland China from 1960 to 2018. Catena 2020, 195, 104837. [Google Scholar] [CrossRef]
  26. Feng, R.; Jiazhen, L.; Yongjin, C.; Zhenfang, H. Variations analysis of multi-years rainfall erosivity and erosivity growth rate in Shandong Province. J. Nat. Disasters 2017, 26, 83–92. [Google Scholar]
  27. Zhao, P.; Ping, G. Characteristics of Rainfall Erosivity Changes in Northwest Yunnan from 1980 to 2013. Sci. Geogr. Sin. 2015, 35, 1306–1311. [Google Scholar]
  28. Li, W.; Wang, J. Spatial and temporal variations of rainfall erosivity at each level in Taihang Mountain. J. Nat. Resour. 2019, 34, 785–801. [Google Scholar] [CrossRef]
  29. Jiang, G.Y.; Lv, J.R.; He, X.B.; Bao, Y.H. Influence of reservoir impoundment on rainfall erosivity in the Three Gorges Reservoir region of China. Hydrol. Res. 2022, 53, 1357–1371. [Google Scholar] [CrossRef]
  30. Li, J.; Sheng, F.; Liu, S.; Zhang, T.; Yu, M. Variation of Rainfall Erosivity and Its Influencing Factors in Jiuqushui Watershed, Southern Jiangxi Province. J. Soil Water Conserv. 2022, 36, 63–73. [Google Scholar]
  31. Martin-Benito, D.; Ummenhofer, C.C.; Köse, N.; Güner, H.T.; Pederson, N. Tree-ring reconstructed May–June precipitation in the Caucasus since 1752 CE. Clim. Dyn. 2016, 47, 3011–3027. [Google Scholar] [CrossRef]
  32. Lu, E.; Liu, S.; Luo, Y.; Zhao, W.; Li, H.; Chen, H.; Zeng, Y.; Liu, P.; Wang, X.; Higgins, R.W.; et al. The atmospheric anomalies associated with the drought over the Yangtze River basin during spring 2011. J. Geophys. Res. Atmos. 2014, 119, 5881–5894. [Google Scholar] [CrossRef]
  33. Sun, J.; Yang, K.; Guo, W.; Wang, Y.; He, J.; Lu, H. Why Has the Inner Tibetan Plateau Become Wetter since the Mid-1990s? J. Clim. 2020, 33, 8507–8522. [Google Scholar] [CrossRef]
  34. Zhang, T.; Wang, Y.; Liu, B.; Sun, Y.; Chen, X. Variation of Hourly Extreme Precipitation in the Three Gorges Reservoir Region, China, from the Observation Record. Water 2021, 13, 2855. [Google Scholar] [CrossRef]
  35. Wang, P.; Wu, X.; Hao, Y.; Wu, C.; Zhang, J. Is Southwest China drying or wetting? Spatiotemporal patterns and potential causes. Theor. Appl. Climatol. 2019, 139, 1–15. [Google Scholar] [CrossRef]
  36. Rahman, M.S.; Islam, A. Are precipitation concentration and intensity changing in Bangladesh overtimes? Analysis of the possible causes of changes in precipitation systems. Sci. Total Environ. 2019, 690, 370–387. [Google Scholar] [CrossRef] [PubMed]
  37. Bhattacharyya, S. Possible association between Indian monsoon rainfall and solar activity. Geophys. Res. Lett. 2005, 32, GL021044. [Google Scholar] [CrossRef]
  38. Panagos, P.; Ballabio, C.; Borrelli, P.; Meusburger, K. Spatio-temporal analysis of rainfall erosivity and erosivity density in Greece. Catena 2016, 137, 161–172. [Google Scholar] [CrossRef]
  39. Angulo-Martínez, M.; Beguería, S. Do atmospheric teleconnection patterns influence rainfall erosivity? A study of NAO, MO and WeMO in NE Spain, 1955–2006. J. Hydrol. 2012, 450–451, 168–179. [Google Scholar] [CrossRef]
  40. Lee, J.H.; Lee, J.-H.; Julien, P.Y. Global climate teleconnection with rainfall erosivity in South Korea. Catena 2018, 167, 28–43. [Google Scholar] [CrossRef]
  41. Cao, Q.; Yuan, X.; Yan, Q.; Zhu, F. Decadal change of rainfall erosivity during rainy season in mainland China and its underlying causes. J. Hydrol. 2023, 620, 129391. [Google Scholar] [CrossRef]
  42. Liu, S.; Huang, S.; Xie, Y.; Leng, G.; Huang, Q.; Wang, L.; Xue, Q. Spatial-temporal changes of rainfall erosivity in the loess plateau, China: Changing patterns, causes and implications. Catena 2018, 166, 279–289. [Google Scholar] [CrossRef]
  43. Ponjiger, T.M.; Lukic, T.; Wilby, R.L.; Markovic, S.B.; Valjarevic, A.; Dragicevic, S.; Gavrilov, M.B.; Ponjiger, I.; Durlevic, U.; Milanovic, M.M.; et al. Evaluation of Rainfall Erosivity in the Western Balkans by Mapping and Clustering ERA5 Reanalysis Data. Atmosphere 2023, 14, 104. [Google Scholar] [CrossRef]
  44. Zhang, W.; Yun, X.; Baoyuan, L. Spatial Distribution of Rainfall Erosivity in China. Mt. Res. 2003, 21, 33–40. [Google Scholar]
  45. Zhu, Z.; Yu, B. Validation of rainfall erosivity estimators for mainland China. Trans. ASABE 2015, 58, 61–71. [Google Scholar]
  46. Zhang, J.; Ren, Y.; Jiao, P.; Xiao, P.; Li, Z. Changes in rainfall erosivity from combined effects of multiple factors in China’s Loess Plateau. Catena 2022, 216, 106373. [Google Scholar] [CrossRef]
  47. Ma, X.; He, Y.; Xu, J.; van Noordwijk, M.; Lu, X. Spatial and temporal variation in rainfall erosivity in a Himalayan watershed. Catena 2014, 121, 248–259. [Google Scholar] [CrossRef]
  48. Xu, X.; Yan, Y.; Dai, Q.; Yi, X.; Hu, Z.; Cen, L. Spatial and temporal dynamics of rainfall erosivity in the karst region of southwest China: Interannual and seasonal changes. Catena 2023, 221, 106763. [Google Scholar] [CrossRef]
  49. Xu, L.; Xu, X.; Meng, X. Risk assessment of soil erosion in different rainfall scenarios by RUSLE model coupled with Information Diffusion Model: A case study of Bohai Rim, China. Catena 2013, 100, 74–82. [Google Scholar] [CrossRef]
  50. Da Silva, A.M. Rainfall erosivity map for Brazil. Catena 2004, 57, 251–259. [Google Scholar] [CrossRef]
  51. Zhang, Y.; Zhang, M.; Wang, S.; Du, M.; Ma, R.; Wang, J. Changes of precipitation area in China from 1961 to 2015. Arid Land Geogr. 2019, 42, 762–773. [Google Scholar]
  52. Ding, Z.; Lu, R.; Wang, Y. Spatiotemporal variations in extreme precipitation and their potential driving factors in non-monsoon regions of China during 1961–2017. Environ. Res. Lett. 2019, 14, 024005. [Google Scholar] [CrossRef]
  53. Wu, Y.; Ji, H.; Wen, J.; Wu, S.-Y.; Xu, M.; Tagle, F.; He, B.; Duan, W.; Li, J. The characteristics of regional heavy precipitation events over eastern monsoon China during 1960–2013. Glob. Planet. Chang. 2019, 172, 414–427. [Google Scholar] [CrossRef]
  54. Zhao, D.; Xiong, D.; Zhang, B.; He, K.; Wu, H.; Zhang, W.; Lu, X. Long-term response of runoff and sediment load to spatiotemporally varied rainfall in the Lhasa River basin, Tibetan Plateau. J. Hydrol. 2023, 618, 129154. [Google Scholar] [CrossRef]
  55. Gong, X.W.; Wang, X.Y.; Li, Y.Q.; Ma, L.; Li, M.Y.; Si, H.T. Observed Changes in Extreme Temperature and Precipitation Indices on the Qinghai-Tibet Plateau, 1960–2016. Front. Environ. Sci. 2022, 10, 888937. [Google Scholar] [CrossRef]
  56. Ding, Y.H. Summer Monsoon Rainfalls in China. J. Meteorol. Soc. Jpn. 1992, 70, 373–396. [Google Scholar] [CrossRef]
  57. Wang, N.; Cheng, W.; Lombardo, L.; Xiong, J.; Guo, L. Statistical spatiotemporal analysis of hydro-morphological processes in China during 1950–2015. Stoch. Environ. Res. Risk Assess. 2022, 36, 2377–2397. [Google Scholar] [CrossRef]
  58. Wang, Y.; Yang, K.; Huang, W.Y.; Qiu, T.P.; Wang, B.B. Dominant Contribution of South Asia Monsoon to External Moisture for Extreme Precipitation Events in Northern Tibetan Plateau. Remote Sens. 2023, 15, 735. [Google Scholar] [CrossRef]
  59. Zhou, Y.S.; Xie, Z.M.; Liu, X. An Analysis of Moisture Sources of Torrential Rainfall Events over Xinjiang, China. J. Hydrometeorol. 2019, 20, 2109–2122. [Google Scholar] [CrossRef]
  60. Du, Q.; Zhang, M.; Wang, S.; Che, C.; Qiu, X.; Ma, Z. Changes in air temperature of China in response to global warming hiatus. Acta Geogr. Sin. 2018, 73, 1748–1764. [Google Scholar]
  61. Ejaz, N.; Elhag, M.; Bahrawi, J.; Zhang, L.; Gabriel, H.F.; Rahman, K.U. Soil Erosion Modelling and Accumulation Using RUSLE and Remote Sensing Techniques: Case Study Wadi Baysh, Kingdom of Saudi Arabia. Sustainability 2023, 15, 3218. [Google Scholar] [CrossRef]
  62. Wu, J.; Cheng, Y.; Mu, Z.; Dong, W.; Zheng, Y.; Chen, C.; Wang, Y. Temporal Spatial Mutations of Soil Erosion in the Middle and Lower Reaches of the Lancang River Basin and Its Influencing Mechanisms. Sustainability 2022, 14, 5169. [Google Scholar] [CrossRef]
  63. Zhang, W.B.; Xie, Y.; Liu, B.Y. Rainfall erosivity estimation using daily rainfall amounts. Sci. Geogr. Sin. 2002, 22, 705–711. [Google Scholar]
  64. Zhang, W.B.; Fu, J.S. Rainfall erosivity estimation under different rainfall amount. Resour. Sci. 2003, 25, 35–41. [Google Scholar]
  65. Mann, H.B. Nonparametric Tests Against Trend. Econometrica 1945, 13, 245–259. [Google Scholar] [CrossRef]
  66. Kendall, M.G. Further Contributions to the Theory of Paired Comparisons. Biometrics 1955, 11, 43–62. [Google Scholar] [CrossRef]
  67. Huang, J.; Zhang, J.; Zhang, Z.; Xu, C.-Y. Spatial and temporal variations in rainfall erosivity during 1960–2005 in the Yangtze River basin. Stoch. Environ. Res. Risk Assess. 2013, 27, 337–351. [Google Scholar] [CrossRef]
  68. Wang, Z.; Lai, C.; Chen, X.; Yang, B.; Zhao, S.; Bai, X. Flood hazard risk assessment model based on random forest. J. Hydrol. 2015, 527, 1130–1141. [Google Scholar] [CrossRef]
  69. Calle, M.L.; Urrea, V. Letter to the Editor: Stability of Random Forest importance measures. Brief. Bioinform. 2011, 12, 86–89. [Google Scholar] [CrossRef] [PubMed]
  70. Zheng, Y.; He, Y.; Chen, X. Spatiotemporal pattern of precipitation concentration and its possible causes in the Pearl River basin, China. J. Clean. Prod. 2017, 161, 1020–1031. [Google Scholar] [CrossRef]
  71. Zhang, A.; Zhao, X. Changes of precipitation pattern in China: 1961–2010. Theor. Appl. Climatol. 2022, 148, 1005–1019. [Google Scholar] [CrossRef]
  72. Wang, R.; Fu, Y.; Xian, T.; Chen, F.; Yuan, R.; Li, R.; Liu, G. Evaluation of Atmospheric Precipitable Water Characteristics and Trends in Mainland China from 1995 to 2012. J. Clim. 2017, 30, 8673–8688. [Google Scholar] [CrossRef]
  73. Su, B.; Xiao, C.; Zhao, H.; Huang, Y.; Dou, T.; Wang, X.; Chen, D. Estimated changes in different forms of precipitation (snow, sleet, and rain) across China: 1961–2016. Atmos. Res. 2022, 270, 106078. [Google Scholar] [CrossRef]
  74. Wang, W.; Yin, S.; Gao, G.; Papalexiou, S.M.; Wang, Z. Increasing trends in rainfall erosivity in the Yellow River basin from 1971 to 2020. J. Hydrol. 2022, 610, 127851. [Google Scholar] [CrossRef]
  75. Xin, Z.; Yu, X.; Li, Q.; Lu, X.X. Spatiotemporal variation in rainfall erosivity on the Chinese Loess Plateau during the period 1956–2008. Reg. Environ. Chang. 2011, 11, 149–159. [Google Scholar] [CrossRef]
  76. Angulo-Martinez, M.; Begueria, S. Trends in rainfall erosivity in NE Spain at annual, seasonal and daily scales, 1955–2006. Hydrol. Earth Syst. Sci. 2012, 16, 3551–3559. [Google Scholar] [CrossRef]
  77. Wu, Y.; Mu, H.; Wu, S.-y.; Xu, Y.; Xu, M.; Wu, H.; Clark, R.T.; Gao, C. Changes in mean and extreme homogeneous precipitation in China during 1960–2020. Atmos. Res. 2023, 292, 106891. [Google Scholar] [CrossRef]
  78. Panagos, P.; Borrelli, P.; Meusburger, K.; Yu, B.; Klik, A.; Jae Lim, K.; Yang, J.E.; Ni, J.; Miao, C.; Chattopadhyay, N.; et al. Global rainfall erosivity assessment based on high-temporal resolution rainfall records. Sci. Rep. 2017, 7, 4175. [Google Scholar] [CrossRef] [PubMed]
  79. Zeng, L.; Liu, W.; Liu, Z.; Gao, Y. Evaluating the effects of topographical factors on the precipitation simulated by kilometer-scale versus quarter-degree dynamical downscaling models in eastern China. Atmos. Ocean. Sci. Lett. 2023, 16, 100287. [Google Scholar] [CrossRef]
  80. Luo, H.; Wang, Z.; Yang, S.; Hua, W. Revisiting the impact of Asian large-scale orography on the summer precipitation in Northwest China and surrounding arid and semi-arid regions. Clim. Dyn. 2022, 60, 33–46. [Google Scholar] [CrossRef]
  81. Wei, L.; Hu, K.H.; Hu, X.D. Rainfall occurrence and its relation to flood damage in China from 2000 to 2015. J. Mt. Sci. 2018, 15, 2492–2504. [Google Scholar] [CrossRef]
  82. Xu, X.; Zhang, X.; Dai, E.; Song, W. Reseach of trend variability of precipitation intensity and their contribution to precipitation in China from 1961 to 2010. Geogr. Res. 2014, 33, 1335–1347. [Google Scholar]
  83. Yao, C.; Qian, W.; Yang, S.; Lin, Z. Regional features of precipitation over Asia and summer extreme precipitation over Southeast Asia and their associations with atmospheric–oceanic conditions. Meteorol. Atmos. Phys. 2009, 106, 57–73. [Google Scholar] [CrossRef]
  84. Cui, D.; Wang, C.; Santisirisomboon, J. Characteristics of extreme precipitation over eastern Asia and its possible connections with Asian summer monsoon activity. Int. J. Climatol. 2019, 39, 711–723. [Google Scholar] [CrossRef]
  85. Tang, Y.; Huang, A.; Wu, P.; Huang, D.; Xue, D.; Wu, Y. Drivers of Summer Extreme Precipitation Events Over East China. Geophys. Res. Lett. 2021, 48, e2021GL093670. [Google Scholar] [CrossRef]
  86. Tong, X.; Liu, X.; Jia, Q.; Yingming, H.; Yang, C. Spatial and Temporal Variability of Daily Precipitation Concentration in China during 1960−2011. Clim. Environ. Res. 2017, 22, 301–314. [Google Scholar]
  87. Xu, L.; Zhou, H.; Liang, C.; Du, L.; Li, H. Spatial and temporal variability of annual and seasonal precipitation over the desert region of China during 1951–2005. Hydrol. Process. 2010, 24, 2947–2959. [Google Scholar] [CrossRef]
  88. Ayitken, M.; Yang, L.; Zhang, Y.; Musa, Y. Characteristic analysis of environment of short-time heavy rainfall under the background of the Central Asian Vortex in Xinjiang in recent ten years. Arid Land Geogr. 2018, 41, 273–281. [Google Scholar]
  89. Qin, H.; Chen, C.; Ablimitijan, A.; Li, N. Characteristics of Short-duration Heavy Rainfall in Warm Season in Xinjiang. Arid Zone Res. 2019, 36, 1440–1449. [Google Scholar]
  90. Abbas, A.; Zhang, T.; He, Q.; Bo, L.; Jin, L.; Zhang, J.; Salam, A. Variations in different types and levels of daily precipitation in the Tarim Basin, Northwest China. Theor. Appl. Climatol. 2022, 149, 1509–1520. [Google Scholar] [CrossRef]
  91. Cao, W.F.; Li, J.H.; Acharya, S. Cryospheric changes in the Tibetan Plateau and its effects on ecosystem. In Proceedings of the International Conference on Intelligent Transportation, Big Data and Smart City (ICITBS), Halong Bay, Vietnam, 19–20 December 2015. [Google Scholar]
  92. Park, J.H.; Kug, J.S.; An, S.I.; Li, T. Role of the western hemisphere warm pool in climate variability over the western North Pacific. Clim. Dyn. 2019, 53, 2743–2755. [Google Scholar] [CrossRef]
  93. Lee, H.F.; Zhang, D.D. Relationship between NAO and drought disasters in northwestern China in the last millennium. J. Arid Environ. 2011, 75, 1114–1120. [Google Scholar] [CrossRef]
  94. Yu, Y.; Yang, T.; Li, J.; Liu, J.; An, C.; Liu, X.; Fan, Z.; Lu, Z.; Li, Y.; Su, X. Millennial-scale Holocene climate variability in the NW China drylands and links to the tropical Pacific and the North Atlantic. Paleogeogr. Paleoclimatol. Paleoecol. 2006, 233, 149–162. [Google Scholar] [CrossRef]
  95. Zhang, L.; Shen, M.; Shi, C.; Shi, F.; Jiang, N.; Yang, Z.; Ji, Z. Local Climatic Factors Mediated Impacts of Large-Scale Climate Oscillations on the Growth of Vegetation Across the Tibetan Plateau. Front. Environ. Sci. 2021, 9, 597971. [Google Scholar] [CrossRef]
  96. Shen, X.; Liu, B.; Li, G.; Wu, Z.; Jin, Y.; Yu, P.; Zhou, D. Spatiotemporal change of diurnal temperature range and its relationship with sunshine duration and precipitation in China. J. Geophys. Res. Atmos. 2015, 119, 13–163, 179. [Google Scholar]
  97. Landry, M.; Selph, K.E.; Hood, R.R.; Beckley, L. Low temperature sensitivity of picophytoplankton P: B ratios and growth rates across a natural 10 °C temperature gradient in the oligotrophic Indian Ocean. Limnol. Oceanogr. Lett. 2021, 7, 112–121. [Google Scholar] [CrossRef]
  98. Wu, Y.; Wu, S.-Y.; Wen, J.; Xu, M.; Tan, J. Changing characteristics of precipitation in China during 1960–2012. Int. J. Climatol. 2016, 36, 1387–1402. [Google Scholar] [CrossRef]
  99. Jamshidi, E.J.; Yusup, Y.; Kayode, J.S.; Kamaruddin, M.A. Detecting outliers in a univariate time series dataset using unsupervised combined statistical methods: A case study on surface water temperature. Ecol. Inform. 2022, 69, 101672. [Google Scholar] [CrossRef]
Figure 1. Geographic distribution of three major natural zones and weather stations in China.
Sustainability 16 00111 g001
Figure 2. Trend charts of RE from 1960 to 2020 in China and its subregions.
Sustainability 16 00111 g002
Figure 3. Spatial distribution of mean annual RE during 1960–2020.
Sustainability 16 00111 g003
Figure 4. Spatial distribution of linear trends of mean annual RE.
Sustainability 16 00111 g004
Figure 5. The RE at different intensities and their contribution to the overall RE.
Sustainability 16 00111 g005
Figure 6. Pie chart of the proportion of RE at different intensities.
Sustainability 16 00111 g006
Figure 7. Sensitivity of RE to rainfall over China and its three subregions from 1960 to 2020.
Sustainability 16 00111 g007
Figure 8. The importance degree of the influencing factors in China.
Sustainability 16 00111 g008aSustainability 16 00111 g008b
Figure 9. The contribution of changes in erosive precipitation at different intensity levels to the overall erosive precipitation variations in China and its three subregions from 1960 to 2020.
Sustainability 16 00111 g009
Table 1. Number and percentage of stations with increasing trends and decreasing trends.
RegionNumber of StationsNumber/Percent of IncreasingNumber/Percent of Decreasing
China611434/71.03%177/28.97%
EMR431294/68.21%137/31.79%
NAR11289/79.46%23/20.54%
QTR6851/75.00%17/25%
Disclaimer/Publisher’s Note: The statements, opinions and data contained in all publications are solely those of the individual author(s) and contributor(s) and not of MDPI and/or the editor(s). MDPI and/or the editor(s) disclaim responsibility for any injury to people or property resulting from any ideas, methods, instructions or products referred to in the content.

