Abstract
The present study aimed to assess the effect of alternative packaging materials on the quality retention and shelf-life of whole fish under low and abuse temperature conditions. Red sea bream (Pagrus major) was harvested and stored in different packaging containers, i.e., a conventional polystyrene (PS) box, a CaCO3-based box and a cardboard box (tested as a simple alternative container for transportation and short-term storage of food). After harvesting and transportation, fish was stored in the tested containers at 2 °C for 11 days and periodically kept at room temperature (25 °C) to simulate potential temperature fluctuations in the actual supply chain. The effect of temperature fluctuations and packaging materials on the quality and remaining shelf-life of fish was determined by microbial enumeration (total viable counts, Pseudomonas spp. and Enterobacteriaceae). PS retained fish quality and maintained a low temperature of fish for longer periods of time during storage at ambient conditions. The CaCO3-based containers also showed satisfactory performance, resulting in a similar microbial load in fish flesh to the samples stored in PS boxes after 11 days of simulated transportation and storage (TVC load 7.8–8.0 logcfu/g). Cardboard resulted in a rapid increase in the internal temperature during the temperature fluctuations at ambient conditions, resulting in higher microbial loads of fish flesh at all stages of the simulated cold chain. The replacement of conventional plastic packaging materials with alternative, environmentally friendly packaging systems without affecting the shelf-life of fish may reduce plastic waste while ensuring the high quality and shelf-life of perishable food products.
1. Introduction
Safety and quality standards of seafood products are significantly affected by the cold chain management. In any product supply chain there are points at which potential improvements may be made. Packaging plays an important role in the preservation of perishable food at any stage of the supply chain, while the reduction of plastics is adopted by the current legislation. Recent research in the food packaging sector has started to focus on the latest major trends regarding health, the green movement, and food safety [1].
For fish and seafood, significant amounts of products are wasted globally because of flesh spoilage caused during various stages of the chill chain, such as chilling, packing, distribution and storage (waste percentage varies from ≈30% of the initial amount of fish and seafood caught in Latin America, Africa and Europe to 50% for North America and Oceania, according to FAO). Meanwhile, fish and seafood consumption has risen from 9.9 kg (in 1960) to approximately 20 kg (in 2015) [2]. Fresh and chilled fish are characterized as highly perishable products since they form an excellent substrate for microbial growth. At higher temperatures, microbial growth gets more intense and in combination with the short shelf-life of seafood products, these are major concerns for seafood quality level along the cold chain.
Quality deterioration of refrigerated and lightly preserved seafood is caused mainly by microbial growth. It is a common phenomenon that the position of the fish landing stations is often distant from the processing facilities or the retail markets, and thus, the duration of the seafood transportation increases. In order to control microbial growth timely, proper handling of the fish, such as refrigeration or freezing, is necessary immediately after the catching stage. In this context, the packaging stage, including the type and quality of materials and the method of packaging, is also vital for the quality and shelf life of the final products. The design of innovative and effective packaging systems to enhance food quality and prolong shelf-life and thus eliminate food waste without raising the amount of packaging materials wasted, is a major challenge during promoting the sustainability of the fish and seafood supply chains.
Nowadays, polystyrene (PS) is the most frequently used packaging material in the fish and seafood sector for either bulk or individual storage and transportation. The structure of PS is based on styrene units and is created by the polymerization of almost ~1000 of monomers. Polystyrene’s desirable attributes such as high moldability, rigidness, and clarity made it the first commercially available plastic of its category in large volumes in the late 1940s. Some of the main advantages of the PS foam include increased tensile strength, low moisture transmission, good water resistance, ease of fabrication and cost effectiveness. PS forms lightweight closed-cell foams that are characterized by great thermal insulating capability and satisfactory cushioning properties. For this reason, it has been extensively used for the transportation and storage of perishable food products, such as fish and seafood. The extrusion of PS foam creates a closed cell sheet, with thickness ranging from 0.13 to 6.4 mm and density from 32 to 160 kg m−3. Matched metal molds are used to achieve thermoforming of the largest part of the foam sheet. In order to improve the sensory parameters of the produced material, a blowing agent may be necessary. Usually, CO2 is used for this purpose. This procedure has generated new opportunities in the food packaging sector [3].
Despite the desirable attributes of conventional packaging materials, such as polystyrene, there are severe sustainability issues rising from their wide usage. A high percentage of plastic pollution is caused by the food and beverages applications, affecting the sustainability of the sector [4]. A million tons of plastic litter find their way annually into the environment. Landfills are 30% filled with polystyrene, while a staggering volume of it ends up at the ocean [5]. Plastic litter poses severe risks for both freshwater and marine systems [6]. Abandoned plastic units break into smaller particles through a series of degradation processes (microplastics). There is an increasing amount of microplastics deriving from polystyrene, that could seriously harm aquatic animals’ health, accumulate in their bodies and pass on to humans through the food chain [7,8]. In view of the high prevalence of expanded polystyrene litter in the (mainly marine) environment, single-use food containers made of expanded polystyrene have been restricted, while styrene has been placed in the Category 1 in the list of highly disrupting chemicals for endocrine system by the European Union.
Another critical sustainability factor for petrochemical materials concerns greenhouse gas emissions. For instance, increased CO2 emissions (almost 210 kg CO2/1 m3 PS) are generated during the polystyrene production process [9]. Overall, the increased interest for circular economy promotion in conjunction with the EU Directive 2019/904 that highlights the urgent need for reducing the impact of plastic materials on the environment has brought up considerable concerns regarding the sustainability and wide usage of conventional polymers as food packaging materials.
Furthermore, there is an emerging need for the development and application of packaging materials that could both provide the desirable attributes of synthetic plastic materials, such as the thermal insulating capability of polystyrene, and promote sustainability. Several approaches can be considered for the development of sustainable packaging of fish and seafood. One approach is to use biodegradable or compostable materials that are derived from renewable resources [10]. Eco-friendly materials such as biopolymers, that do not consist of fossil-generated components and are biodegraded in a short period of time, could replace conventional synthetic plastics and reduce environmental harm. Biopolymer-based packaging materials are the materials that consist of agricultural or marine generated raw components [11].
Recently, calcium carbonate (CaCO3) has started to gain attention as a promising sustainable component for developing alternative packaging materials that may reduce the required amount of conventional plastic. Calcium carbonate can be extracted from egg and oyster shells, promoting a circular economy [12]. Highly porous modified CaCO3 powder has found application in packaging with the formulation of a coating, including thyme and rosemary essential oils, for the preservation of ready-to-eat (RTE) meat products [13]. Pechyen et al. (2017) utilized the ability of CaCO3 particles to act as a β-nucleating agent to promote the formation of the β-crystalline phase of polypropylene and reduce the spherulite size in microwavable packaging systems [14]. Luo et al. (2015) tested the effect of nano-CaCO3-based low density polyethylene films on fresh-cut Chinese yam packaging. They observed that the fabricated CaCO3-based packaging material managed to retard total bacterial counts as well as delay browning and extend the product’s shelf-life for 2 days [15]. Another application regarding the effects of nano-CaCO3/chitosan composite coatings on the shelf life of Sciaenops ocellatus revealed that the material’s physicochemical properties were improved due to the hydrogen bonds formed between chitosan and CaCO3 and the product’s shelf life was extended [16].
The main challenge in replacing conventional petroleum-based packaging materials with novel biopolymers is to retain the quality and shelf-life of food without compromising its safety, with minimal environmental and economic impact. The aim of the present study was to assess the applicability of alternative packaging materials that contain less conventional polymers, specifically a CaCO3-based box consisting of 70% CaCO3 and 30% polyethylene (PE), on the quality retention and shelf-life of whole Mediterranean fish at low and abuse temperature conditions as alternatives to the conventional PS boxes.
2. Materials and Methods
2.1. Sample Preparation and Storage
Red sea bream (Pagrus major) was obtained from Philosofish S.A. (Larymna, Greece) and delivered to the Laboratory of Food Process Engineering of the Department of Food Science and Human Nutrition, Agricultural University of Athens within 1 day from harvesting, stored at 0–2 °C. Fish body weight was on average 500 g (400–600 g batch) while their height ranged between 20 and 35 cm. Upon receipt, fish was placed into the tested containers (12 specimens/package), i.e., a commercial PS box, a commercial corrugated cardboard box and a corrugated CaCO3-based box (Uniqcor®, Disruptive Packaging, Sydney, Australia). The CaCO3-based boxes were made of 70% CaCO3 (limestone) and 30% high-density polyethylene (HDPE) and were delivered flat-packed (folded) to be converted into boxes. All boxes had similar dimensions (57–58 cm length, 37–38 cm width and 12–13 cm height) and were stored in a controlled temperature refrigerator (EVERMED MPR 1365 PRO medical refrigerator, Motteggiana, Italy) at 2 °C and periodically kept at ambient temperature (25 °C) to simulate potential temperature fluctuations of the actual supply chain. Temperature inside the boxes (PS, cardboard, CaCO3-based) and externally (environmental temperature) was constantly monitored using electronic data loggers (RC-5 USB temperature recorders, Elitech, London, UK) during fish transportation and storage in the simulated cold chain conditions. During the first days of the study, boxes with fish were kept for a short amount of time at ambient temperature (25 °C) (e.g., 3–4 h) while this amount increased gradually until the final days of the study (e.g., 8–10 h). The cumulative time that boxes with fish were kept at ambient temperature (25 °C) is estimated to be 33–35 h, while the rest of the time (almost 230 h) they were kept at 2 °C and intermediate temperatures.
2.2. Measurement of the Thermal Properties of the Packaging Materials
Thermal properties of the tested packaging materials were measured using the transient line heat source method, with the KD2 thermal properties analyzer and a 6 cm single needle sensor (Decagon Devices Inc., Pullman, WA, USA). All measurements were carried out in 5 different specimens for each tested container.
2.3. Microbiological Analysis
For the microbiological analysis, 10 g of fish samples (including skin and flesh) were placed into a sterile stomacher bag with 90 mL sterilized Ringer solution (Ringer Tablets, Merck, Darmstadt, Germany). In order to homogenize the samples, a Stomacher (BagMixer®, Ιnterscience, Saint-Nom-la-Breteche, France) was used for 60 s. Samples (0.1 mL) of 10-fold serial dilutions were spread on the surface of appropriate media in Petri dishes for enumeration of the selected spoilage bacteria. Microbial load was expressed as the average logcfu/g. Total Viable Count (TVC) was enumerated on plate count agar (PCA; Condalab, Torrejon De Ardoz, Spain) after incubation at 25 °C for 72 h, whereas Pseudomonas spp. were enumerated on Cetrimide agar (CFC; Condalab, Torrejon De Ardoz, Spain) after incubation at 25 °C for 48 h. For the enumeration of Enterobacteriaceae the poor plate method was used on Violet Red Bile Glucose Agar (VRBG, Condalab, Torrejon De Ardoz, Spain) and incubation at 25 °C for 48 h. Sampling for microbiological analysis was performed on days 0, 1, 4, 6, 8 and 11 of the experiment. Overall, 12 fish samples in each tested container were analyzed for microbial growth, in order to achieve duplicate measurements. Two replicates of at least three appropriate dilutions were enumerated for each fish sample and growth medium.
2.4. DNA Extraction and 16S rRNA Sequencing
Sampling for molecular analysis was performed on days 0 and 11 of the experiment. Total DNA was extracted from fish samples using a slightly modified cetyltrimethylammoniumbromide (CTAB) extraction protocol [17] and the NucleoSpin® Tissue Kit (MACHEREY-NAGEL GmbH & Co. KG., Düren, Germany), following the manufacturer’s instructions.
Briefly, approximately 100 mg of frozen fish flesh was grinded in a preheated lysis buffer (20 mM EDTA, 100 mM Tris-HCl pH 8.0, 1.4 M NaCl, 2% CTAB, 2-mercaptoethanol, and 10 mg/mL proteinase K) and incubated at 57 °C for 2 h [18]. RNase A (10 mg/mL) was added to each sample, followed by incubation for 15 min at 37 °C. Afterwards, we conducted an extraction using an equivalent amount of chloroform: isoamyl alcohol ratio of 24:1 at a temperature of 4 °C. Subsequently, the mixture was precipitated with isopropanol overnight at −20 °C. Following centrifugation at 7500× g for 15 min at 4 °C, the liquid portion was removed, and the remaining substance underwent two washes with 75% and 100% ethanol, sequentially. Then, the DNA pellet was resuspended in double distilled water and purified through a NucleoSpin® Tissue spin column according to the manufacturer’s protocol. The quality of the extracted DNA was estimated based on the abundance of DNA content and the evaluation of impurity levels through the 260/230 and 260/280 ratios, conducted using an ND-1000 spectrophotometer (NanoDrop, Wilmington, DE, USA). Three biological replicates were made for each day (2 days—Day 1 and Day 11—× 3 biological replicates at 2 °C).
A total of 50 ng of DNA underwent amplification, following the Illumina protocol for the construction of 16S Metagenomic Sequencing Libraries [19]. Briefly, for the initial amplification stage, primers were created with the following components: (i) a universal linker sequence enabling amplicons for the integration of indexes and sequencing primers through the Nextera XT Index kit (Illumina, San Diego, CA, USA); and (ii) universal primers targeting the V3–V4 region of the 16S rRNA gene, as described by Klindworth et al. (2012) [20]. In the second and final assay, the quantification of amplicon libraries was performed using fluorimetry with the Quant-iT™ PicoGreen™ dsDNA Assay Kit (Thermofisher, Waltham, MA, USA). The pooled libraries were then subjected to sequencing on the NovaSeq 2000 platform system (Illumina, San Diego, CA, USA) with a configuration of 250 cycles for paired reads. The size and quantity of the library pool were evaluated using the Bioanalyzer 2100 (Agilent, Santa Clara, CA, USA) and the Library Quantification Kit for Illumina (Kapa Biosciences, Wilmington, MA, USA), respectively.
2.5. Data Analysis
The obtained experimental data were fitted using the Baranyi Growth Model to model the microbial growth in the tested samples [21]. For curve fitting, the macros included in DMFit 3.5 software (IFR, Institute of Food Research, Reading, UK) were used (available at http://www.combase.cc/index.php/en/, accessed on 24 April 2023). Kinetic parameters such as the microbial growth rate (k) and lag phase (λ) were calculated through DMFit software.
Analysis of variance (two-factor ANOVA) at a significance level of 95% was applied for the analysis of the studied quality degradation rates for all sample series. Significant differences were determined based on Duncan’s multiple range test (a = 0.05). Descriptive statistics were used to evaluate the frequency of temperature during the simulated distribution and storage of whole fish using the alternative containers (XLSTAT 2023.1.1, http://www.xlstat.com/en, accessed on 22 May 2023). Principal Coordinate Analysis (PCoA) for 16S rRNA sequencing results was performed using the vegan R package [22].
3. Results and Discussion
3.1. Thermal Properties of the Packaging Materials and Time-Temperature Profile of Stored Fish Using the Alternative Containers
The thermal conductivity and thermal resistivity of the tested packaging materials are presented in Table 1. Thermal resistivity was higher for the PS, followed by the CaCO3-based and the cardboard boxes. The thermal conductivity value for the tested PS was in agreement with the respective values reported by Harvey (1997), while the CaCO3-based material also exhibited thermal conductivity within the limits 0.036–0.048 W/m°C reported for the main air-based insulations, such as fiberglass, cellulose and expanded PS, indicating that the tested CaCO3-based containers may serve as insulating cool boxes for perishable products [23]. Monisha et al. (2022), studied the incorporation of CaCO3 derived from aquatic sources in cement mortar and reported that it led to thermal insulation behavior. They also reported that compared to other substitution components that can be found in cement and concrete, CaCO3 from marine wastes has retained great thermal resistivity [24]. Similar results were reported by Liu et al. (2020), in their study regarding the thermal properties of environmentally friendly brick made from oyster shells and sorghum waste, which contain about 95% CaCO3. By increasing the oyster shell percentage from 15% to 40%, the thermal conductivity coefficient K-value of the brick decreased from 0.188 to 0.083 W/mK, thus offering better thermal insulation [25]. The thermal conductivity of cardboard was determined as 0.05 W/m°C, which is within the range 0.05–0.12 W/m°C reported for cardboard, depending on the internal structure [26]. Asdrubali et al. (2015), also estimated the thermal conductivity of cardboard-based panels to be around 0.055 W/m°C [27].

Table 1.
Thermal properties of the tested packaging materials.
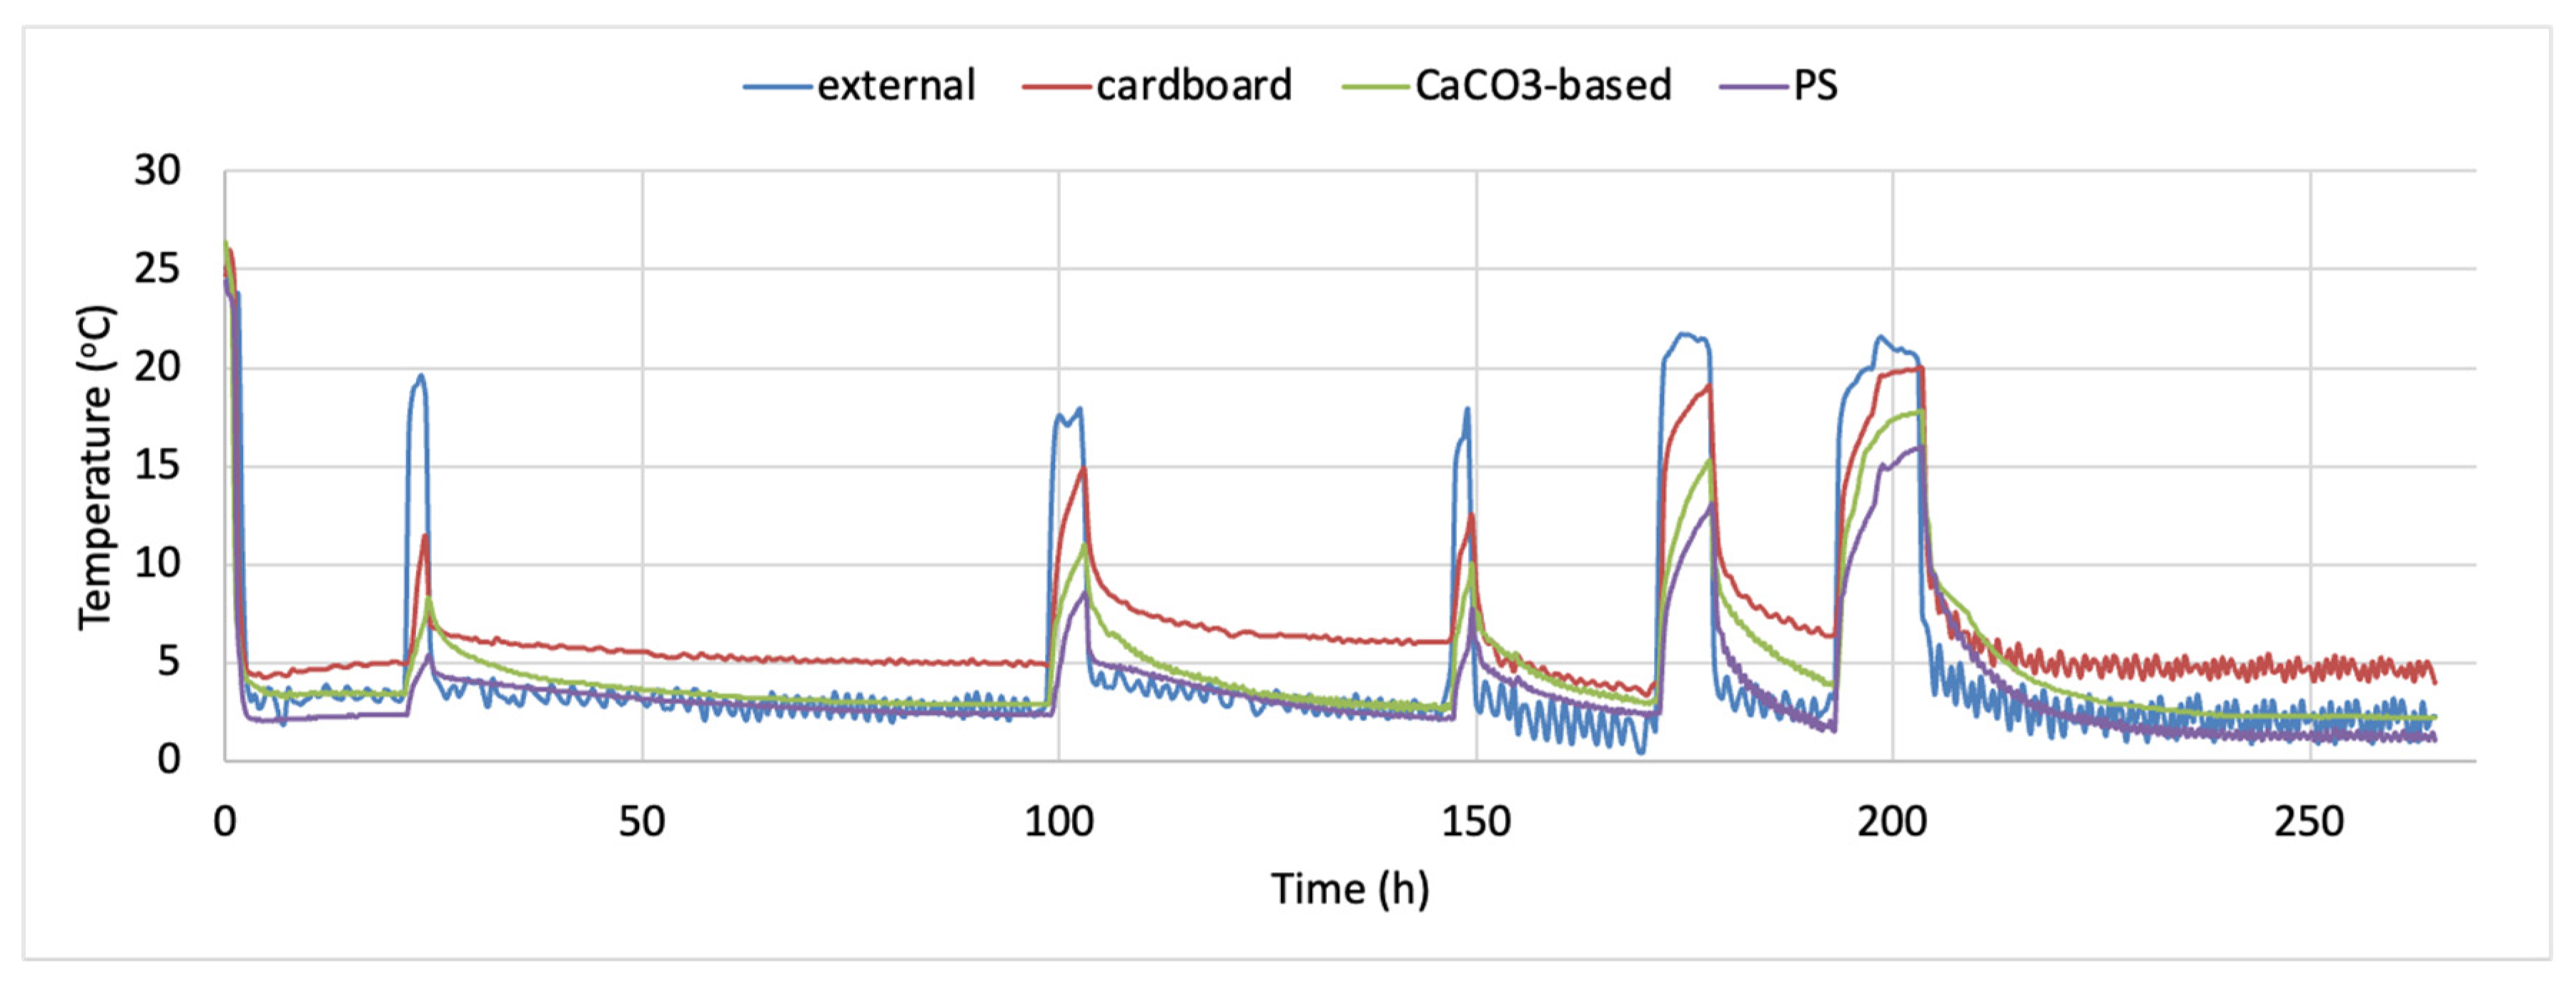
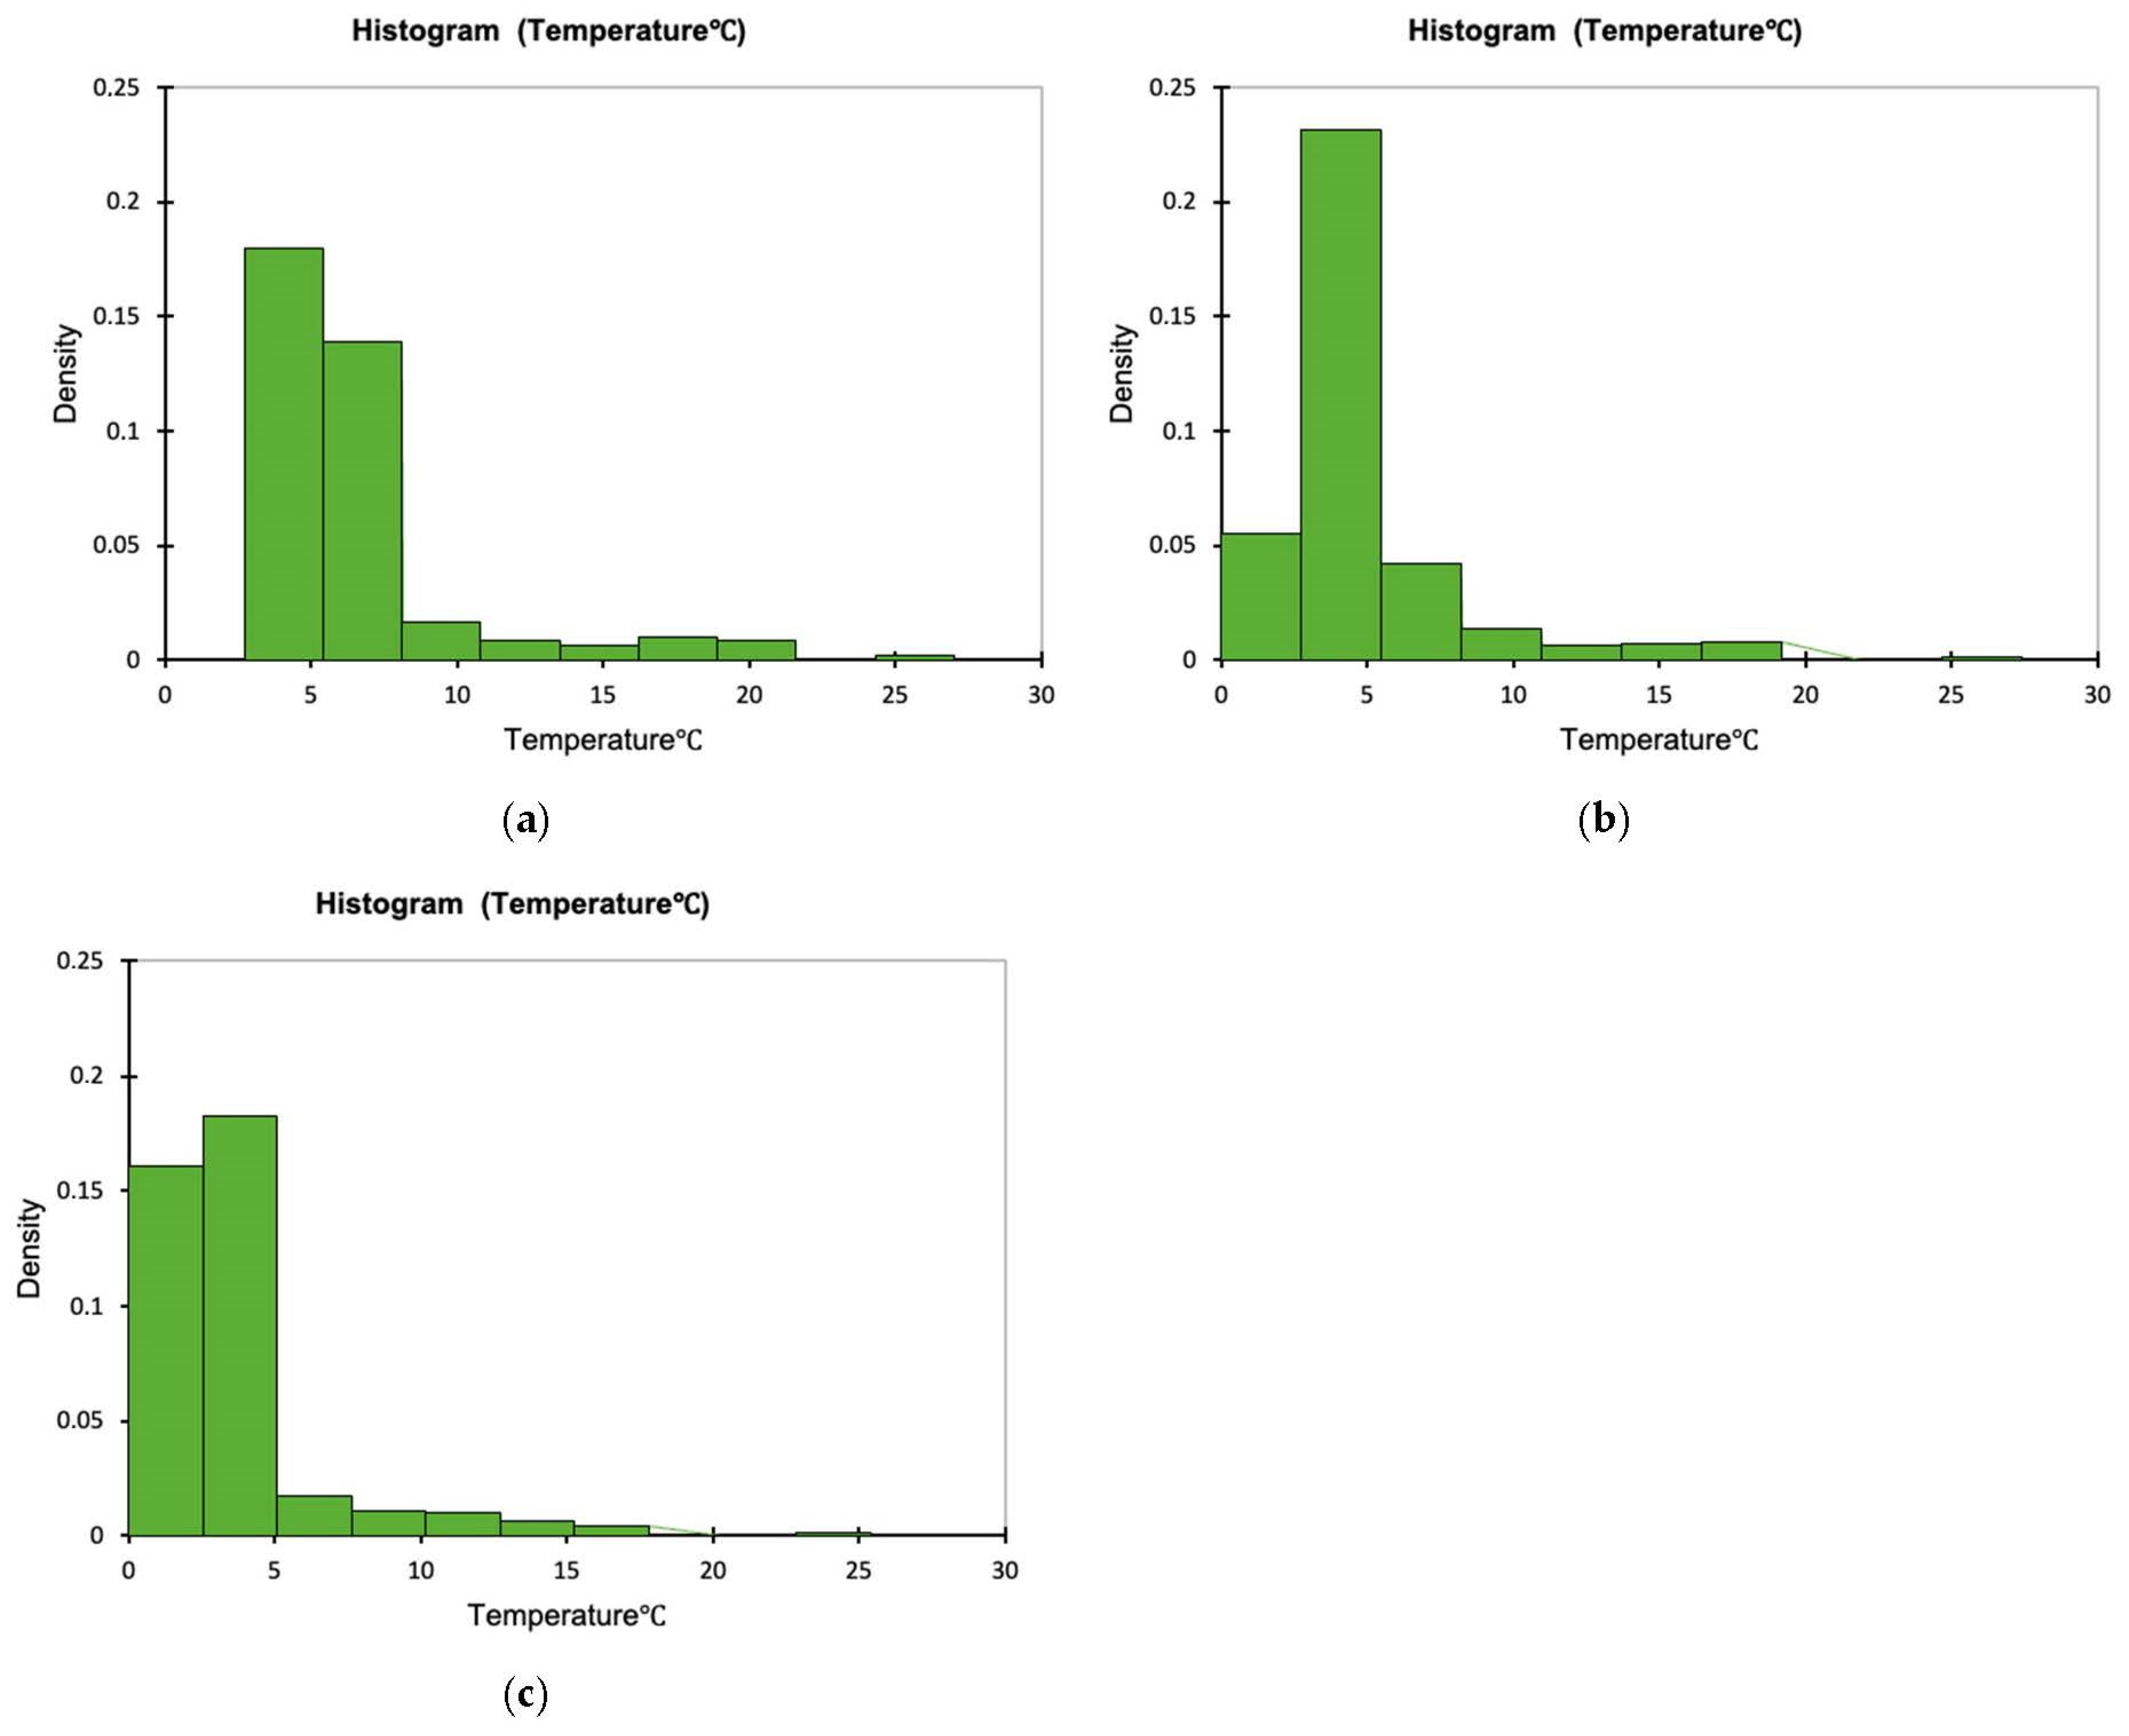
The time–temperature conditions inside each one of the tested containers and externally, during the 11 days storage test for whole red sea bream, is presented in Figure 1. The density plots indicating the proportion of the temperature values observed inside the tested containers during the simulated fish transportation and storage are presented in Figure 2a–c. It is evident that temperature inside the cardboard boxes remained higher during the temperature fluctuations (mean temperature was 6.687 ± 3.629 °C during the 11 days of non-isothermal storage test, while the respective mean temperatures for the CaCO3-based boxes and the conventional PS containers was 4.728 ± 3.363 and 3.738 ± 3.058 °C, respectively). The minimum and maximum temperature during the temperature fluctuations inside the cardboard container was 3.4 and 26.0 °C, respectively, while the respective minimum and maximum temperature for the CaCO3-based boxes and the conventional PS containers were 2.2 and 26.4 °C and 1.1 and 24.4 °C. This finding is in compliance with the reported results of Leducq et al. (2015). They compared the performance of three materials—a phase change material (PCM), carton board and polystyrene- in terms of thermal diffusivity with the aim of using them as an additional packaging for ice cream. They observed that as the ambient air temperature varied from −21.1 °C to −22.6 °C the amplitude of the temperature inside the carton board was 0.5 °C while in both EPS and PCM was 0.2 °C. That implies the lower thermal insulation of carton materials [28]. None of the histograms is symmetric, while all Figure 2a–c are right skewed. Skewness was determined as 2.758, 2.800 and 3.129, indicating that in the case of the PS boxes, more temperature values are observed on the left side of the graph (corresponding to lower temperatures inside the box). The lowest skewness value was observed for the cardboard boxes.
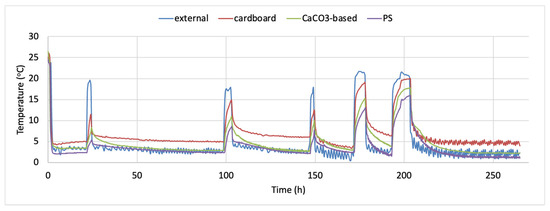
Figure 1.
Time–temperature profile of whole fish storage using the alternative containers (data loggers placed inside the cardboard, CaCO3-based or PS boxes) and external conditions (data logger placed outside the containers during the storage test).
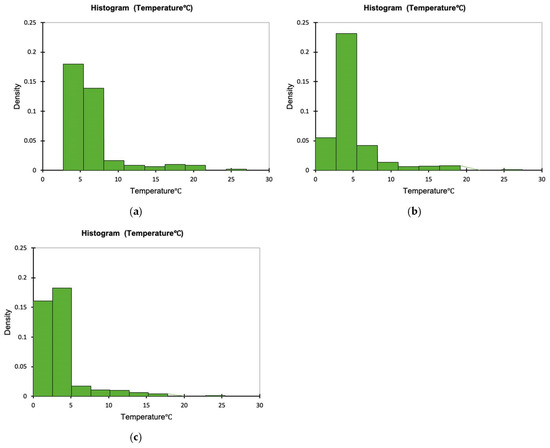
Figure 2.
Temperature distribution inside the tested containers: (a) cardboard (mean = 6.687, standard deviation = 3.629), (b) CaCO3-based (mean = 4.728, standard deviation = 3.363) and (c) PS boxes (mean = 3.738, standard deviation = 3.058) containing whole red sea bream under non-isothermal conditions.
3.2. Microbiological Analysis of Red Sea Bream Stored into the Alternative Containers under Non-Isothermal Conditions
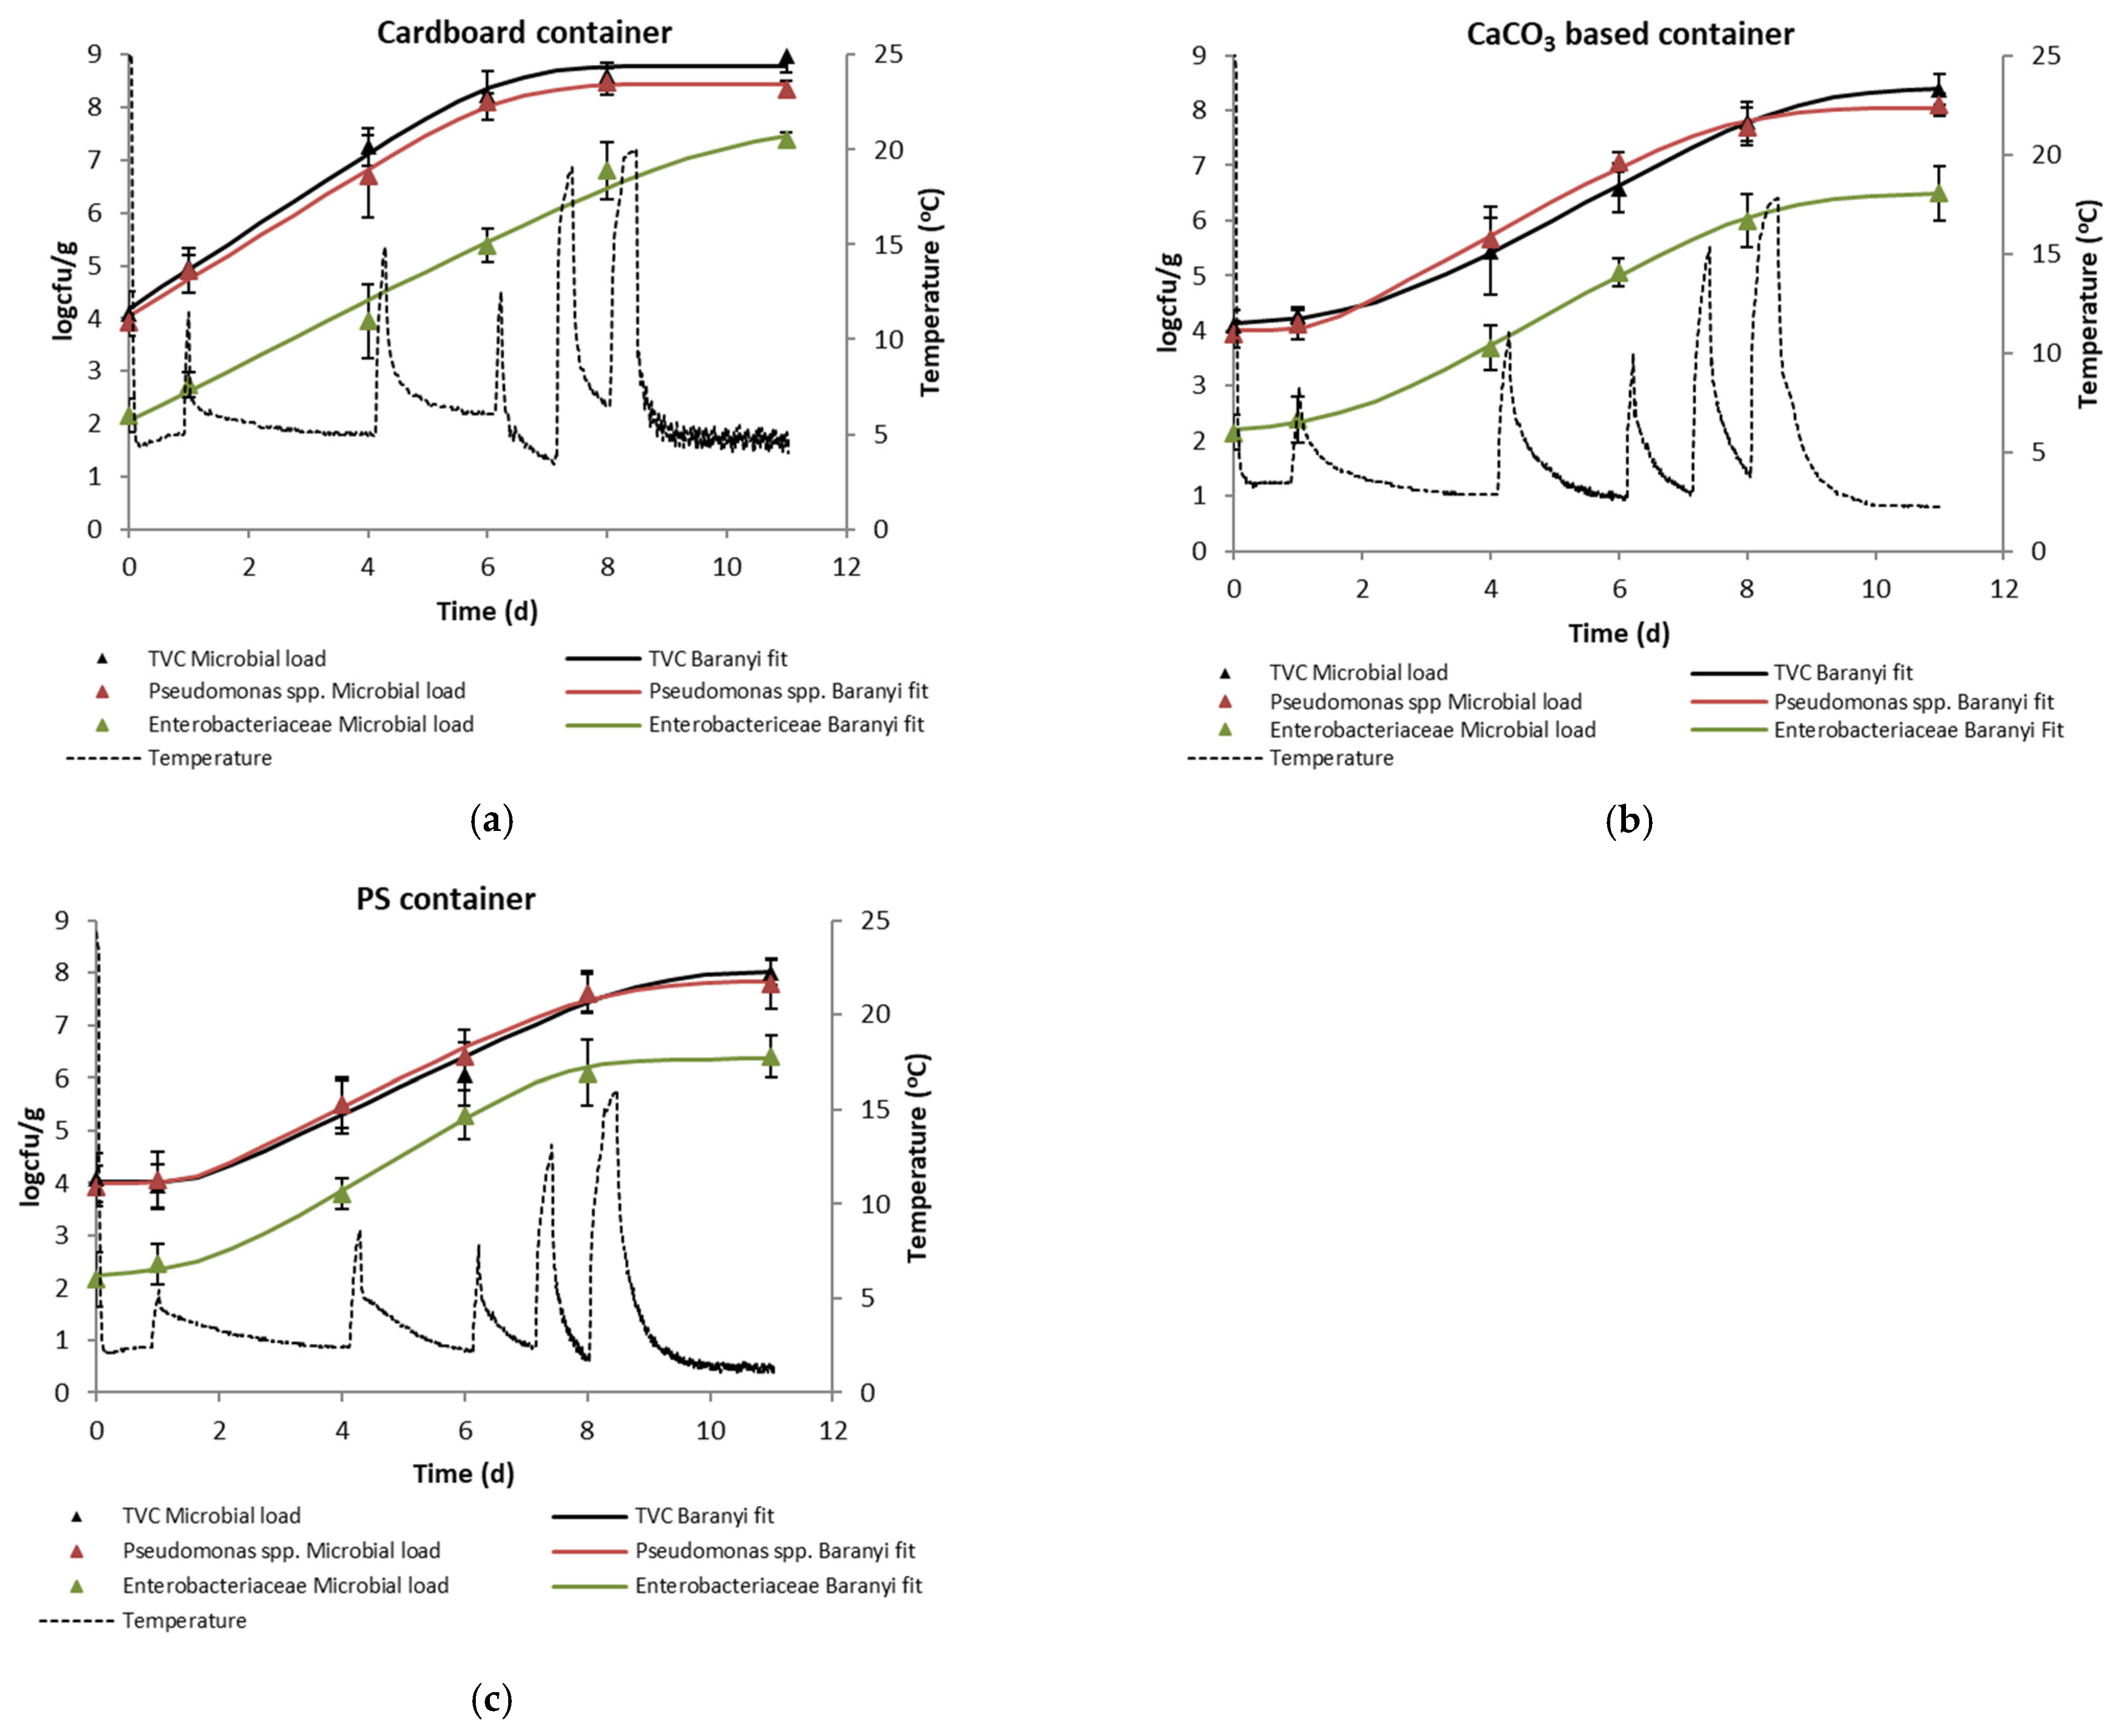
The microbial growth curves of TVC, Pseudomonas spp. and Enterobacteriaceae in the edible part of red sea bream during the non-isothermal simulated transportation and storage are presented in Figure 3a–c. Duncan multiple range test results can be seen in Table 2. The growth parameters (i.e., growth rate, lag phase, maximum population at the end of storage, and the statistical fit of the Baranyi Growth Model to the experimental data) are presented in Table 3. The results showed that the populations of all tested species increased as a function of storage time. The initial microbial load of flesh (including skin) in red sea bream was 4.1, 3.9 and 2.2 logcfu/g for TVC, Pseudomonas spp. and Enterobacteriaceae, respectively. The initial TVC is in agreement with the reported initial microbial load of whole red sea bream and other Mediterranean species reported in the literature [29,30]. In general, any differences in the initial populations of surface bacteria in different fish may be a cause of different spoilage rates related to sensory shelf-life, as the poikilotherm nature of fish may enable bacteria with a broad temperature range to grow on a specific substrate [30].
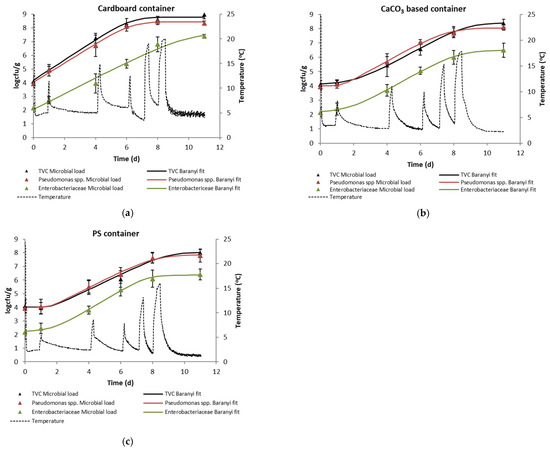
Figure 3.
Microbial growth of TVC, Pseudomonas spp. and Enterobacteriaceae inside the tested containers (a) cardboard, (b) CaCO3-based and (c) PS boxes containing whole red seabream stored under non-isothermal conditions.
Table 2.
Duncan multiple range test (a = 0.05) for microbial load of the tested species and containers.
Table 3.
Baranyi parameters, i.e., k: growth rate (d−1), λ: lag phase (d) and Nmax: maximum population at the end of storage (logcfu/g), of microbial growth in whole red sea bream stored under non-isothermal conditions packed into the alternative containers (cardboard, CaCO3-based and PS boxes).
The microbial growth in the flesh (including skin) of red sea bream follows the pattern of the time-temperature profile presented in Figure 1, where the use of the cardboard boxes resulted in higher temperature and sharper temperature increase steps during the simulated fluctuations of the supply chain. According to Gram and Huss (1996), microbial growth in raw refrigerated fish is strongly temperature-dependent [31]. Based on the Arrhenius kinetics, the temperature dependence of microbial growth in fresh fish stored under aerobic conditions ranges 60–80 kJ/mol [32]. Considering the limit of acceptability of 7 logcfu/g for TVC [33], the shelf-life of red sea bream samples under the non-isothermal conditions of the simulated transportation and storage can be calculated as 4, 6 and 7 days for the fish stored in the cardboard boxes, the CaCO3-based and the PS boxes, respectively. More explicitly, the final microbial load of total viable counts in the CaCO3-based container was 8.37 logcfu/g (day 11), while the respective microbial load in the PS box was 8 logcfu/g, a difference that was not found to be statistically significant (p > 0.05). The respective TVC population of the cardboard box was 8.97 logcfu/g (statistically significant difference, p < 0.05). Similar results were observed for the Enterobacteriaceae, with final microbial loads of 6.5 and 6.41 logcfu/g for the CaCO3-based and the PS box, respectively (p > 0.05) and 7 logcfu/g for the cardboard container (p < 0.05). For Pseudomonas spp., no statistically significant differences were found between the final microbial loads for any of the tested boxes. Under this context, the tested CaCO3-based boxes may be an efficient alternative to conventional PS containers for the transportation and storage of fresh fish in the actual supply chain.
3.3. 16S rRNA Sequencing Profile for Red Sea Bream
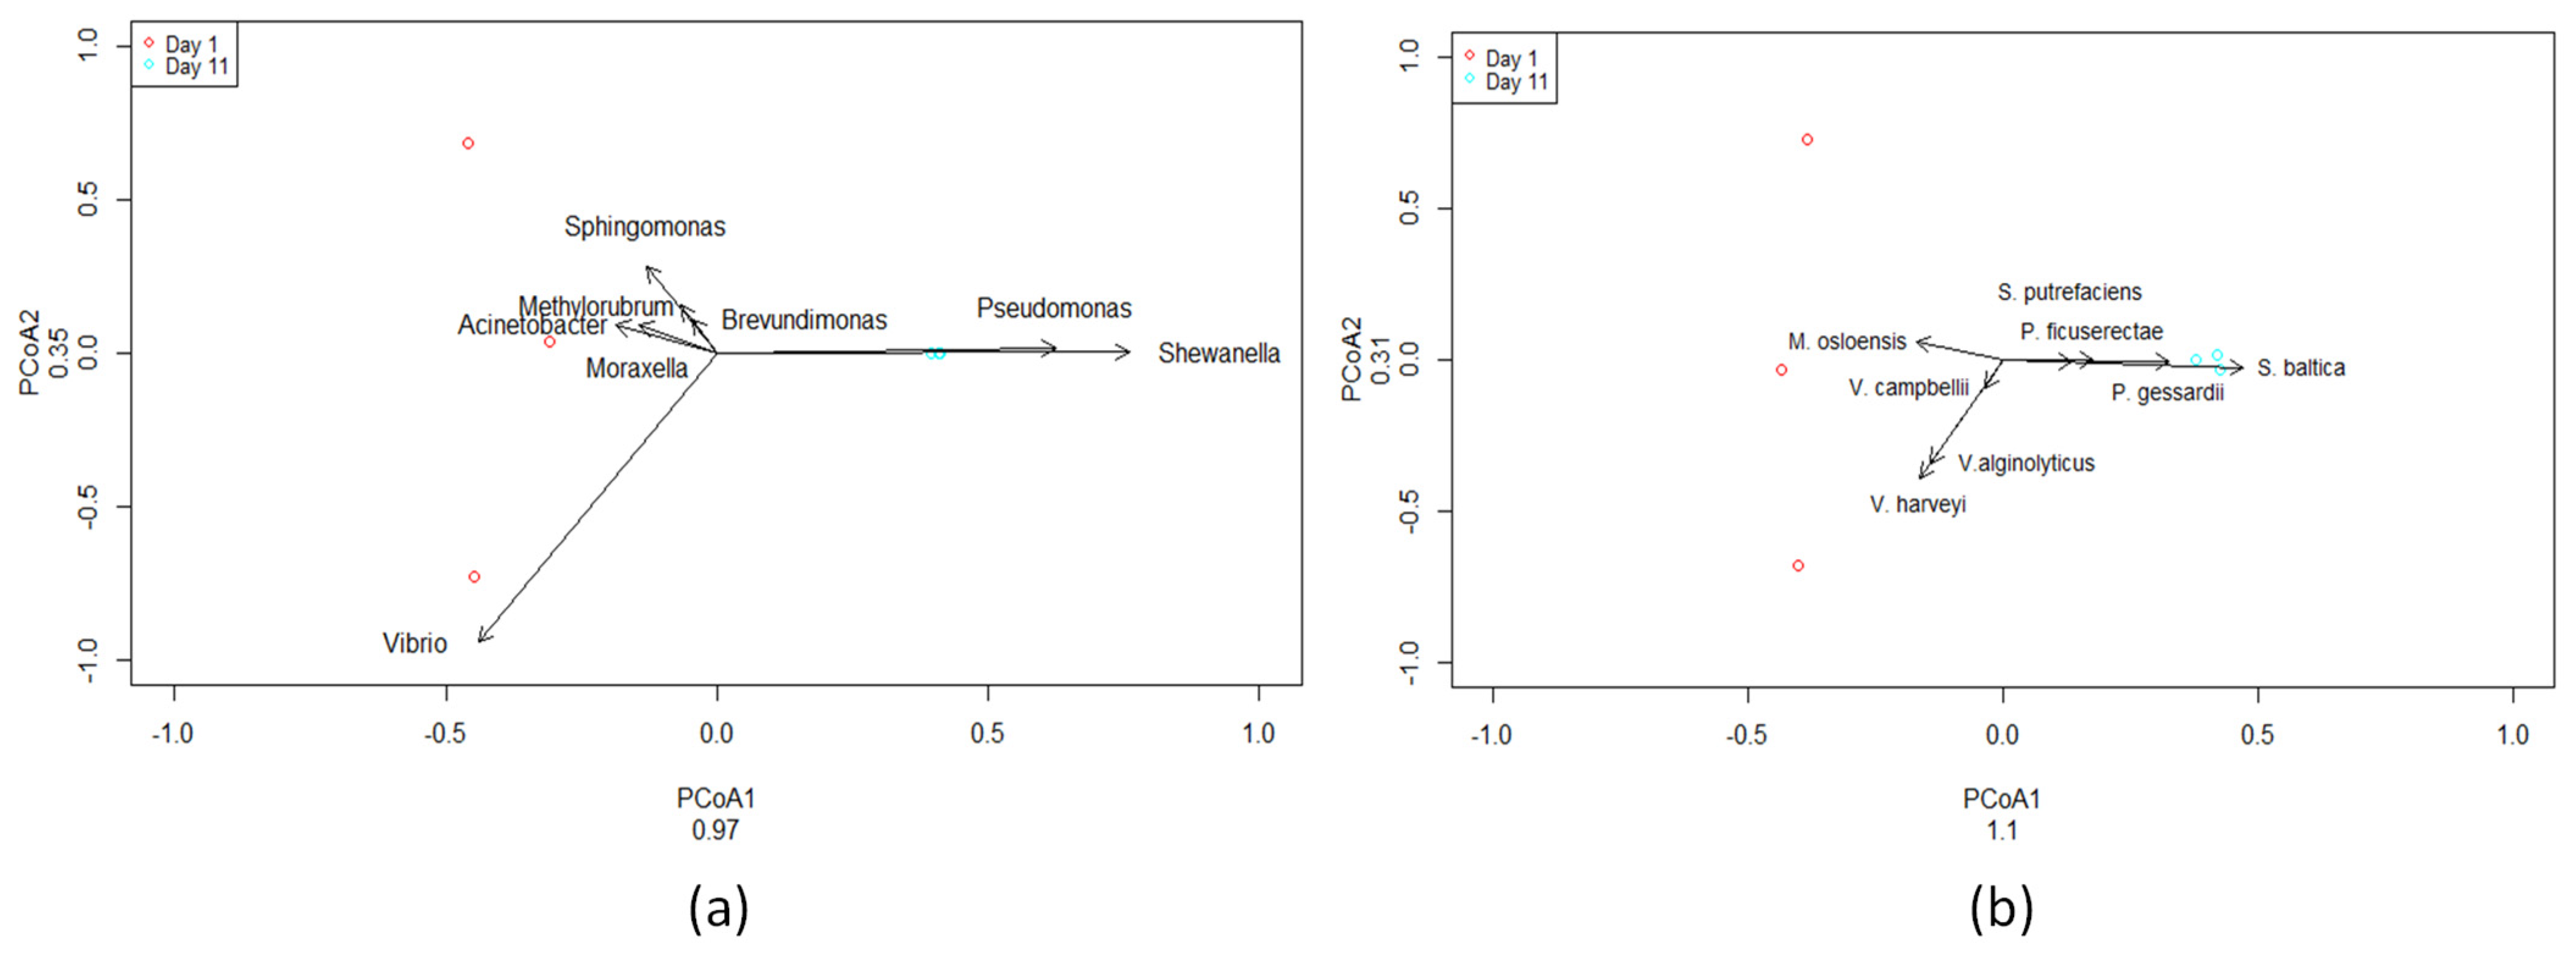
A total of six samples were sequenced using paired-end sequencing. Bacteroidetes abundance increased in fish flesh after 11 days (Figure S1) while Vibrio sp. (Figure 4 and Figure S2) decreased by 98% after 11 days compared to the first day. Pseudomonas sp. (Figure 4 and Figure S2) and Shewanella sp. (Figure 4 and Figure S2) relative abundances were increased after 11 days compared to the first day. Acinetobacter sp. (Figure 4 and Figure S2) abundance decreased by 92% after 11 days compared to the first day. By the end of the storage period lasting 11 days, the microbiome of red sea bream was primarily characterized by the prevalence of Pseudomonas, Shewanella, and Aeromonas (Figure S1).
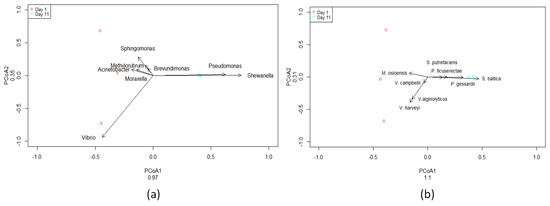
Figure 4.
Two-Dimensional PCoA plot of most abundant bacterial genera (a) and species (b) on Day 1 and Day 11. PCoA1, first principal component; PCoA2, second principal component. Small dots (three red and three cyan) indicate samples from the 16S rRNA Sequencing Data. Each point represents a sample based on microbial composition, with distances reflecting dissimilarities. Clustering reveals distinct community patterns, offering insights into the diversity and relationships within the analyzed samples. (V. harveyi → Vibrio harveyi, V. alginolyticus → Vibrio alginolyticus, S. baltica → Shewanella baltica, P. gessardii → Pseudomonas gessardii, M. osloensis → Moraxella osloensis, P. ficuserectae → Pseudomonas ficuserectae, S. putrefaciens → Shewanella putrefaciens, V. campbellii → Vibrio campbellii).
Shannon values at the genus level suggest a slightly higher level of diversity in the first-day samples and a lower level of diversity after 11 days (Table S3). Shannon values at species level suggest a slightly higher level of diversity in the first-day samples and a lower level of diversity after 11 days (Table S3). Earlier studies have noted a decline in diversity in meat, fish, and shellfish products over time in storage [34]. The current findings suggest a reduction in bacterial diversity and the survival of a limited number of genera/species of bacteria that thrived under favorable conditions during the spoilage of red sea bream.
According to the results of the study, the shelf-life of whole red sea bream under non-isothermal conditions was shorter than the respective reported values for Mediterranean fish stored at isothermal conditions in the recommended range (0–2 °C). Microbial spoilage of sea bream during aerobic storage under isothermal conditions was investigated by Parlapani et al. (2015) using conventional and 16S rRNA gene analysis. According to this study, spoilage was evident when TVC reached 8.3 and 8.6 logcfu/g at 0 and 5 °C, respectively, with an initial microbial load of 4 logcfu/g, resulting in a shelf-life of 14 and 5 days, respectively [35].
The present study also highlights the detrimental effect of temperature fluctuations of the fish supply chain on fish quality and remaining shelf-life, resulting in food waste and thus potential financial damage. Several researchers have been focusing recently on inefficient temperature conditions during the cold food supply chains and reported various critical issues that need to be considered [36,37]. Goransson et al. (2018) compared the performance of temperature in various cold food supply chains in relation to dynamically predicted shelf-life. They observed significant differences in the shelf-life of cod fillets packed under modified atmosphere between the most and least efficient cold chain (temperature of cod was logged from producer to retail) [38]. Similar results were obtained by Lorentzen et al. (2020), who explored the effects of temperature fluctuations in the shelf-life of fresh cod fillets (Gadus morhua L.). After 12 days, cod shelf-life was reduced significantly by a temperature increase of +2 °C, instead of controlled storage at 0 °C, with a rapid increase in TVB-N above the limit of acceptance of 35 mg TVB-N/100 g [39].
In this context, temperature control along the cold chain is an important issue because of the large impact of temperature on both microbial and chemical degradation of fish products [40]. In addition to temperature monitoring, effective packaging materials that protect perishable food from external temperature variations along the food supply chain are necessary for bulk packaging, transportation and storage. However, alternative materials to the expanded polystyrene (EPS), which currently dominates the market, should be encouraged with respect to the current food packaging challenge to reduce plastic use and waste. The utilization of more sustainable packaging materials, such as CaCO3, may significantly reduce the environmental impact, as well as reduce plastic waste, without compromising the quality and shelf-life of the packed food products [41].
Overall, the study aimed to investigate the applicability of alternative fish packaging materials that meet sustainability and preservation criteria in accordance with current legislation, under the context of replacing EPS boxes with cardboard or a container based on CaCO3. The introduction of innovative containers for fish and seafood should be included in the design of an integrated system of use, reuse and recycling that meets the requirements and limitations of the existing handling and transport of fresh fish.
The tested time–temperature scenario for the present study is an exceptionally unfavorable case of fish transportation and storage, which results in rapid quality deterioration and limitation of shelf-life when packed fish is not adequately protected by insulating packaging materials to delay temperature increase. According to the study by Papaharisis et al. (2019) [30], the shelf-life of whole red sea bream stored isothermally at 0 °C is 10–14 days, which is significantly longer than the shelf-life of 4–7 days reported for the same product stored at dynamic conditions (corresponding to mean temperatures of 3.7–6.7 °C, as presented in Figure 2). This means that proper preservation of fresh fish by maintaining temperature within the recommended range of 0–2 °C along the cold chain will maximize the shelf-life of the packed products using any of the tested packaging materials. However, temperature fluctuations are often reported in the actual food supply chain, which makes the adequate packaging and protection of foods from temperature increases a critical issue for preservation and shelf-life extension. These temperature fluctuations are attributed to the on/off control of refrigeration systems and typically range by 2–3 °C [42]. Especially during transportation, food temperature may increase by 3–8 °C, depending on the distribution vehicle type. In most cases, the limited thermal insulation and low thermal buffering capacity of standard carton-based containers do not provide enough protection from unforeseen warming [43].
The systematic investigation of the thermal behaviour of packed food products when an alternative packaging material is considered is essential in order to evaluate its applicability and define the optimal thermal protection during transport and in cases of temperature abuse or fluctuation. Appropriate materials need to be developed and selected according to the required temperature and the possible duration of temperature abuse.
The results of the study indicate the potential of the tested CaCO3-based containers to protect fresh fish from failures in distribution channels and reduce temperature abuse along the cold chain. Any proposed alternative material for food packaging should provide low environmental impact and cost efficiency while meeting the legislative requirements for food contact materials (FCM). In addition to high resistance to the transfer of heat, mechanical strength and thus appropriate protection of food from mechanical stresses (also inside humid environments, such as refrigerators and freezers or in direct contact with ice, as a typical process for fish storage and transportation), are essential properties of an adequate container for fresh fish. Low weight is also important, as it reduces costs in shipping and transportation. Such containers may also be applied to other temperature-sensitive food products, such as, for example, meat and poultry or fresh fruits and vegetables.
The introduction of alternative raw materials, such as CaCO3, which can also be obtained from renewable sources, for the design and production of containers appropriate for perishable food products may deliver breakthrough sustainable science and technological “circular” solutions to replace the current “take-make-dispose” economic models and impact positively on waste valorization, resource utilization and effective preservation of perishable food, with the aim of reducing food and packaging material waste from farm to fork. Further research and development in the field of sustainable packaging for sensitive food products for retaining low temperatures and extending shelf-life during transportation and storage may also include the replacement of conventional polymers with alternative, sustainable materials and the development of new multilayer sandwich structures with optimized thermal properties. The application of efficient recycling of the raw materials and the investigation of the potential reuse of the developed containers may further improve the environmental impact and applicability on an industrial scale. Further studies need to be implemented for the evaluation of the applicability of the developed packaging materials on a pilot scale, including palleting and storage in industrial refrigerators, so as to determine their stability at high-relative humidity environments, impact resistance and compression strength to effectively preserve fresh fish in the actual supply chain.
4. Conclusions
The CaCO3-based containers showed satisfactory performance, resulting in a similar microbial load in fresh fish to the samples stored in PS boxes during 11 days of simulated transportation and storage under fluctuating temperature conditions. The results of the study show increased potential for replacing conventional PS-based fish packaging containers with an alternative system that is environmentally friendly without limiting the shelf-life of perishable food.
Supplementary Materials
The following supporting information can be downloaded at: https://www.mdpi.com/article/10.3390/su16010130/s1, Figure S1: Relative abundance of the most abundant genera in Pagrus major flesh on the 1st day of the experiment (Day 1) and on the last day of the experiment (Day 11).; Figure S2: Relative abundance of the most abundant species in Pagrus major flesh on the 1st day of the experiment (Day 1) and on the last day of the experiment (Day 11).; Table S1: Average abundance (±SE) for Days 1 and 11 of the most abundant genera in Pagrus major flesh.; Table S2: Average abundance (±SE) for Days 1 and 11 of the most abundant species in Pagrus major flesh.; Table S3: Shannon Diversity Index Values for Days 1 and 11 on Genus and Species level.
Author Contributions
Conceptualization, T.T., A.K. and E.F.; methodology, E.B., E.M., P.P., D.L. and T.T.; validation, E.B., E.M., D.L., P.P., E.F., A.K. and T.T.; formal analysis, E.B., D.L., P.P., E.F. and T.T.; investigation, E.B., E.M. and P.P.; data curation, E.B., D.L., P.P. and T.T.; writing—original draft preparation, E.B. and T.T.; writing—review and editing, E.B., E.M., D.L., P.P., E.F., A.K. and T.T.; supervision, T.T.; project administration, T.T.; funding acquisition, T.T. All authors have read and agreed to the published version of the manuscript.
Funding
This study was supported by the Greek Operational Programme for Fisheries, Priority Axis “Innovation in Fisheries”, Project title: “Design and development of innovative packaging materials with enhanced protective activity for fisheries and from biodegradable materials using fish by-products (pack4fish)” (2021–2023) MIS5074718, website: http://pack4fish.aua.gr.
Institutional Review Board Statement
Not applicable.
Informed Consent Statement
Not applicable.
Data Availability Statement
Derived data supporting the findings of this study are available from the corresponding author upon reasonable request.
Conflicts of Interest
The authors declare no conflict of interest.
References
- Tsironi, T.N.; Taoukis, P.S. Current Practice and Innovations in Fish Packaging. J. Aquat. Food Prod. 2018, 27, 1024–1047. [Google Scholar] [CrossRef]
- FAO (Ed.) Contributing to Food Security and Nutrition for All. In The State of World Fisheries and Aquaculture; FAO: Rome, Italy, 2016. [Google Scholar]
- Robertson, G.L. Food Packaging: Principles and Practice, 3rd ed.; CRC Press: Boca Raton, FL, USA, 2013. [Google Scholar]
- Sewwandi, M.; Wijesekara, H.; Rajapaksha, A.U.; Soysa, S.; Vithanage, M. Microplastics and plastics-associated contaminants in food and beverages. Global trends, concentrations, and human exposure. Environ. Pollut. 2023, 317, 120747. [Google Scholar] [CrossRef] [PubMed]
- Savoldelli, J.; Tomback, D.; Savoldelli, H. Breaking down polystyrene through the application of a two-step thermal degradation and bacterial method to produce usable byproducts. Waste Manage 2017, 60, 123–126. [Google Scholar] [CrossRef] [PubMed]
- Browne, M.A.; Crump, P.; Niven, S.J.; Teuten, E.; Tonkin, A.; Galloway, T.; Thompson, R. Accumulation of microplastic on shorelines woldwide: Sources and sinks. J. Environ. Sci. Technol. 2011, 45, 9175–9179. [Google Scholar] [CrossRef]
- do Sul, J.A.; Costa, M.F. The present and future of microplastic pollution in the marine environment. Environ. Pollut. 2014, 185, 352–364. [Google Scholar] [CrossRef] [PubMed]
- Setälä, O.; Fleming-Lehtinen, V.; Lehtiniemi, M. Ingestion and transfer of microplastics in the planktonic food web. Environ. Pollut. 2014, 185, 77–83. [Google Scholar] [CrossRef]
- Hansen, A.P.; da Silva, G.A.; Kulay, L. Evaluation of the environmental performance of alternatives for polystyrene production in Brazil. Sci. Total Environ. 2015, 532, 655–668. [Google Scholar] [CrossRef]
- Piedrahíta Márquez, D.G.; Fuenmayor, C.A.; Suarez Mahecha, H. Effect of Chitosan-propolis Edible Coatings on Stability of Refrigerated Cachama (Piaractus brachypomus) Vacuum-packed Fish Fillets. Packag. Technol. Sci. 2019, 32, 143–153. [Google Scholar] [CrossRef]
- Cha, D.S.; Chinnan, M.S. Biopolymer-Based Antimicrobial Packaging: A Review. Crit. Rev. Food Sci. Nutr. 2004, 44, 223–237. [Google Scholar] [CrossRef]
- Zhan, J.; Lu, J.; Wang, D. Review of shell waste reutilization to promote sustainable shellfish aquaculture. Rev. Aquac. 2022, 14, 477–488. [Google Scholar] [CrossRef]
- Rüegg, N.; Teixeira, S.R.; Beck, B.M.; Monnard, F.W.; Menard, R.; Yildirim, S. Application of Antimicrobial Packaging Based on Modified Calcium Carbonate and EOs for RTE Meat Products. Food Packag. Shelf Life 2022, 34, 100982. [Google Scholar] [CrossRef]
- Pechyen, C.; Ummartyotin, S. Development of Isotactic Polypropylene and Stearic Acid-Modified Calcium Carbonate Composite: A Promising Material for Microwavable Packaging. Polym. Bull. 2017, 74, 431–444. [Google Scholar] [CrossRef]
- Luo, Z.; Wang, Y.; Jiang, L.; Xu, X. Effect of nano-CaCO3-LDPE packaging on quality and browning of fresh-cut yam. LWT-Food Sci. Technol. 2015, 60, 1155–1161. [Google Scholar] [CrossRef]
- Sun, T.; Hao, W.T.; Li, J.R.; Dong, Z.J.; Wu, C.L. Preservation properties of in situ modified CaCO3–chitosan composite coatings. Food Chem. 2015, 183, 217–226. [Google Scholar] [CrossRef] [PubMed]
- Besbes, N.; Sáiz-Abajo, M.J.; Sadok, S. Comparative study of DNA extraction to initiate harmonized protocol for a simple method of species identification: Fresh and canned Tuna case study. CYTA J. Food 2022, 20, 39–49. [Google Scholar] [CrossRef]
- Sharma, R.; Mahla, H.R.; Mohapatra, T.; Bhargava, S.C.; Sharma, M.M. Isolating plant genomic DNA without liquid nitrogen. Plant Mol. Biol. Rep. 2003, 21, 43–50. [Google Scholar] [CrossRef]
- Illumina. 16S Metagenomic Sequencing Library Preparation Protocol. Available online: https://support.illumina.com/documents/documentation/chemistry_documentation/16s/16s-metagenomic-library-prep-guide-15044223-b.pdf (accessed on 21 November 2023).
- Klindworth, A.; Pruesse, E.; Schweer, T.; Peplies, J.; Quast, C.; Horn, M.; Glöckner, F.O. Evaluation of general 16S ribosomal RNA gene PCR primers for classical and next-generation sequencing-based diversity studies. Nucleic Acids Res. 2013, 41, e1. [Google Scholar] [CrossRef] [PubMed]
- Baranyi, J.; Roberts, T.A. Mathematics of Predictive Food Microbiology. Int. J. Food Microbiol. 1995, 26, 199–218. [Google Scholar] [CrossRef]
- Vegan: Community Ecology Package, R. Available online: https://CRAN.R-project.org/package=vegan. (accessed on 8 December 2023).
- Harvey, H.S. Development of Straw Insulation Board: Fabrication Methods, Structure, Thermal Performance. Master’s Thesis, Massachusetts Institute of Technology, Department of Architecture, Cambridge, MA, USA, 1997. [Google Scholar]
- Monisha, R.; Balasubramanian, M. Experimental Study of the Addition of Aquatic Calcium Carbonate Composites in Cement Mortar. In Sustainable Construction Materials; Satyanarayanan, K.S., Seo, H.J., Gopalakrishnan, N., Eds.; Springer: Singapore, 2022; Volume 194, pp. 343–352. [Google Scholar] [CrossRef]
- Liu, H.-Y.; Wu, H.-S.; Chou, C.-P. Study on Engineering and Thermal Properties of Environment-Friendly Lightweight Brick Made from Kinmen Oyster Shells & Sorghum Waste. Constr. Build. Mater. 2020, 246, 118367. [Google Scholar] [CrossRef]
- Čekon, M.; Struhala, K.; Slávik, R. Cardboard-Based Packaging Materials as Renewable Thermal Insulation of Buildings: Thermal and Life-Cycle Performance. J. Renew. Mater. 2017, 5, 84–93. [Google Scholar] [CrossRef]
- Asdrubali, F.; Pisello, A.L.; Alessandro, F.D.; Bianchi, F.; Cornicchia, M.; Fabiani, C. Innovative Cardboard Based Panels with Recycled Materials from the Packaging Industry: Thermal and Acoustic Performance Analysis. Energy Procedia 2015, 78, 321–326. [Google Scholar] [CrossRef]
- Leducq, D.; NDoye, F.T.; Alvarez, G. Phase Change Material for the Thermal Protection of Ice Cream during Storage and Transportation. Int. J. Refrig. 2015, 52, 133–139. [Google Scholar] [CrossRef]
- Koutsoumanis, K.; Giannakourou, M.C.; Taoukis, P.S.; Nychas, G.J. Application of Shelf Life Decision System (SLDS) to Marine Cultured Fish Quality. Int. J. Food Microbiol. 2002, 73, 375–382. [Google Scholar] [CrossRef] [PubMed]
- Papaharisis, L.; Tsironi, T.; Dimitroglou, A.; Taoukis, P.; Pavlidis, M. Stress Assessment, Quality Indicators and Shelf Life of Three Aquaculture Important Marine Fish, in Relation to Harvest Practices, Water Temperature and Slaughter Method. Aquac. Res. 2019, 50, 2608–2620. [Google Scholar] [CrossRef]
- Gram, L.; Huss, H.H. Microbiological Spoilage of Fish and Fish Products. Int. J. Food Microbiol. 1996, 33, 121–137. [Google Scholar] [CrossRef] [PubMed]
- Tsironi, T.; Houhoula, D.; Taoukis, P. Hurdle Technology for Fish Preservation. Fish. Aquac. J. 2020, 5, 65–71. [Google Scholar] [CrossRef]
- ICMSF. Sampling Plans for Fish and Shellfish. In Microorganisms in Foods 2 Sampling for Microbiological Analysis: Principles and Specific Applications; Blackwell Scientific Publications: Toronto, ON, Canada, 1986; pp. 181–196. [Google Scholar]
- Chaillou, S.; Chaulot-Talmon, A.; Caekebeke, H.; Cardinal, M.; Christieans, S.; Denis, C.; Hélène Desmonts, M.; Dousset, X.; Feurer, C.; Hamon, E.; et al. Origin and ecological selection of core and food-specific bacterial communities associated with meat and seafood spoilage. ISME J. 2015, 9, 1105–1118. [Google Scholar] [CrossRef]
- Parlapani, F.F.; Kormas, K.A.; Boziaris, I.S. Microbiological Changes, Shelf Life and Identification of Initial and Spoilage Microbiota of Sea Bream Fillets Stored under Various Conditions Using 16S rRNA Gene Analysis. J. Sci. Food Agric. 2015, 95, 2386–2394. [Google Scholar] [CrossRef]
- Mercier, S.; Villeneuve, S.; Mondor, M.; Uysal, I. Time–Temperature Management Along the Food Cold Chain: A Review of Recent Developments. Comp. Rev. Food Sci. Food Safe 2017, 16, 647–667. [Google Scholar] [CrossRef]
- Ndraha, N.; Hsiao, H.-I.; Vlajic, J.; Yang, M.-F.; Lin, H.-T.V. Time-Temperature Abuse in the Food Cold Chain: Review of Issues, Challenges, and Recommendations. Food Control 2018, 89, 12–21. [Google Scholar] [CrossRef]
- Göransson, M.; Nilsson, F.; Jevinger, Å. Temperature Performance and Food Shelf-Life Accuracy in Cold Food Supply Chains—Insights from Multiple Field Studies. Food Control 2018, 86, 332–341. [Google Scholar] [CrossRef]
- Lorentzen, G.; Ageeva, T.N.; Heide, M.; Esaiassen, M. Temperature Fluctuations in Processing and Distribution: Effect on the Shelf Life of Fresh Cod Fillets (Gadus morhua L.). Food Control 2020, 112, 107102. [Google Scholar] [CrossRef]
- Giannakourou, M.C.; Koutsoumanis, K.; Nychas, G.J.E.; Taoukis, P.S. Field Evaluation of the Application of Time Temperature Integrators for Monitoring Fish Quality in the Chill Chain. Int. J. Food Microbiol. 2005, 102, 323–336. [Google Scholar] [CrossRef] [PubMed]
- Hansen, A.Å.; Svanes, E.; Hanssen, O.J.; Void, M.; Rotabakk, B.T. Advances in Bulk Packaging for the Transport of Fresh Fish. In Advances in Meat, Poultry and Seafood Packaging; Elsevier: Amsterdam, The Netherlands, 2012; pp. 248–260. [Google Scholar] [CrossRef]
- Ben-Yoseph, E.; Hartel, R.W. Computer Simulation of Ice Recrystallization in Ice Cream during Storage. J. Food Eng. 1998, 38, 309–329. [Google Scholar] [CrossRef]
- Leducq, D.; Ndoye, F.T.; Charriau, C.; Alvarez, G. Thermal Protection of Ice Cream during Storage and Transportation. In Proceedings of the 24th IIR International Congress of Refrigeration, Yokohama, Japan, 16–22 August 2015. [Google Scholar]
Disclaimer/Publisher’s Note: The statements, opinions and data contained in all publications are solely those of the individual author(s) and contributor(s) and not of MDPI and/or the editor(s). MDPI and/or the editor(s) disclaim responsibility for any injury to people or property resulting from any ideas, methods, instructions or products referred to in the content. |
© 2023 by the authors. Licensee MDPI, Basel, Switzerland. This article is an open access article distributed under the terms and conditions of the Creative Commons Attribution (CC BY) license (https://creativecommons.org/licenses/by/4.0/).