Article

Insight into the Evolutionary Mechanism of the Rear Fissure of Landslides That Conform to the Three-Section Mechanism

1
School of Resources and Environmental Engineering, Jiangxi University of Science and Technology, Ganzhou 341000, China
2
State Key Laboratory of Geohazard Prevention and Geoenvironment Protection, Chengdu University of Technology, Chengdu 610059, China
3
College of Geosciences and Engineering, North China University of Water Resources and Electric Power, Zhengzhou 450046, China
4
Institute of Geology and Geophysics, Chinese Academy of Sciences, Beijing 100029, China
*
Author to whom correspondence should be addressed.
Sustainability 2024, 16(1), 17; https://doi.org/10.3390/su16010017
Submission received: 5 November 2023 / Revised: 15 December 2023 / Accepted: 16 December 2023 / Published: 19 December 2023
(This article belongs to the Section Hazards and Sustainability)

Abstract

:
In landslides that conform to the three-section mechanism, the rear fissure is the essential component of the potential sliding surface. Hence, the evolutionary mechanism behind that is important for reducing the risk of such landslides. In this research, the evolutionary features and processes were analyzed through a case of landslides that conform to the three-section mechanism; then, base friction testing was carried out to explore the evolutionary mechanism of the rear fissure. On the reliability–validation basis of the consistency of outside deformation features between the testing model and real slopes, deeper analysis of the inner deformation field linked to different rear fissure depths indicates that the weak front interlayer controls the inevitability of the rear tension fissure onset. During rear tension fissure propagation from zero to the critical depth (Hcr), the driving effect of tension fissure propagation undergoes a process of accelerating followed by decelerating roughly bounded by Hcr/2. Moreover, the rear tension fissure closure trend may start at a tension fissure depth of approximately Hcr/2 instead of starting at nearly Hcr. Because of this, the rear tension fissure closure trend that previously suggested by researchers may not always be a perfect indicator of landslides that conform to the three-section mechanism. It may result in the misprediction of such landslides. The findings of this research contribute to a better understanding of the evolutionary mechanisms underlying rear fissures, which, in turn, can help to promote disaster mitigation for landslides that conform to the three-section mechanism. This research can enhance sustainable development by improving safety for people and their property.

1. Introduction

Landslide geohazard mitigation is tightly associated with sustainable development and greatly relies on landslide prediction and early warning on the basis of mechanism analyses [1]. Locked landslides are a kind of landslide with one or more locking sections [2], e.g., rock bridges along the potential sliding surface. They have obvious deformation-failure features and processes controlled by the corresponding slope structures [3]. The typical landslide conforms to the three-section mechanism, i.e., the creep section controlled by the weak front interlayer drives the initiation and propagation of the rear tension fissure section to shorten the locking section until the circular-arc shear failure of the locking section occurs to induce a sudden landslide [4]. Hence, it usually results in numerous casualties and financial losses, e.g., a village destroyed by the Chana landslide, 221 people killed by the Xikou landslide, and 12 houses buried by the Jiweishan landslide, among others, which significantly restrict the sustainable development of the economy and society. In order to form a basis for the geohazard mitigation of these landslides, the critical tension crack depth has been empirically proposed [5], summarily recommended [3], and theoretically optimized [4] to determine the evolutionary stages of such landslides and those mutation points. However, our insight into the evolutionary mechanism of the rear tension fissure depth from zero to the critical value is still lacking.
Rear tension fissures are a category of universally geomorphological features in landslides [6,7]; thus, for landslide geohazard mitigation, the mechanism of tension fissures in landslides ought to be explored more systematically [8,9]. However, with field research, the limitations on time and spatial scales make it nearly impossible to dynamically control and record the features and processes of a landslide in enough detail. Thus, many studies have used physical simulation experiments to explore the evolutionary mechanism [10,11,12,13,14,15]. As a type of physical simulation experiment [16], base friction testing is an available method to produce gravity effects [17] through the drag or friction of a belt moving along the base of a slope model [18]. This method is supported by the mathematical principle developed by Bray and Goodman [19]. Therefore, determined by the advantages of low cost, ease of control, and solid theory, it has become one of the most commonly used methods for gravity simulation in the laboratory [20,21]. Combining a noncontact measurement system with its advantages of quick and undisturbed operation [22], the deformation-failure process associated with displacement/strain field evolution [23] can be validly analyzed by measured point tracking [24] for rocky slopes with locking sections [25].
In this research, for landslides that conform to the three-section mechanism, the rear fissure evolutionary process was analyzed from an outside perspective based on a real landslide case. Then, in order to explore the evolutionary mechanism from the perspective of the inner deformation field, another potential landslide was selected as a slope prototype to design and conduct a series of base friction model tests. By analyzing the responses of deformation fields (the displacement and strain fields) to different rear fissure depths, the evolutionary features of the rear fissure in such landslides were investigated in detail to reveal the evolutionary mechanism of the rear tension fissure. The research results show that the initiation of the rear tension fissure is inevitable and is controlled by the weak front interlayer, and during rear tension fissure propagation from zero to the critical depth (Hcr), the driving effect accelerates, then decelerates, roughly within the bounds of Hcr/2, coinciding with the beginning of the rear tension fissure closure trend. The findings of this study will be useful for a deeper understanding of evolutionary mechanisms and precursor information for landslides that conform to the three-section mechanism.

2. Rear Fissure in a Typical Landslide

The Sale Hill landslide (105°35′10″ E, 35°33′40″ N) occurred in 1983 northwest of Sale Village in Guoyuan Township, Dongxiang Autonomous County, Gansu Province, China [2]. The 3.1 million-cubic-meter landslide mass traveled through an 800-meter-wide river channel and dropped straight down the opposite bank slope in less than a minute. It started at an elevation of 2283 m and reached 2080 m. The catastrophically dynamic process destroyed three communities along the landslide line, killing 237 people [26]. This proved that the ability of society to grow sustainably could be seriously threatened by landslides of this kind.
According to interviews with villagers and the site geological investigations conducted after the occurrence of slope instability, the original slope was steep and exposed, and a series of gullies were developed to provide good topographic conditions for the side boundaries. Based on geophysical profiles and on-site drilling data, the slope structures and landslide evolutionary features were speculated as follows. The entire sliding surface was speculated to be a circular chair shape, including the rear tension fissure controlled by a high and steep unloading fissure and the creep section at the toe controlled by a nearly horizontal mudstone layer. The creep section and tension fissure section were speculated to be connected by a transition curve in the middle, i.e., a locking section (Figure 1c). Therefore, the geomechanical mode of the Sale Hill landslide conforms to the three-section mechanism, which is controlled by the corresponding slope structures [3]. The river depicted in Figure 1a, a third-level tributary of the Yellow River, was, likewise, a seasonal river. The Sale Hill landslide occurred during the dry season on the Loess Plateau. In addition, there was no obvious rainfall or earthquake when the landslide occurred, indicating that the occurrence of the Sale Hill landslide is not directly related to river erosion, earthquakes, or rainfall; therefore, it is a typical gravity landslide.
The landslide accumulation body resembles a palm in the plan view (Figure 1a), with a length of approximately 1600 m; a width of approximately 1100 m; an area of approximately 1.3 km2; and maximum and average thicknesses of approximately 70 m and 24 m, respectively. Obviously, the Sale Hill landslide is characterized by high-speed and long-distance sliding after sudden instability. However, it experienced a long-term evolutionary process. According to the measurements carried out by emergency administrators, the tension fissure started forming at the slope rear in 1970 and spread to the following widths: 10 cm in 1979, 20 cm in 1981, 40 cm in 1982, 80 cm in January 1983, 150 cm in February 1983, and 100 cm on 6 March. On 7 March 1983, around 17:00, the slope started to abruptly slide. According to the observations of villagers, the evolution of the rear fissure conjecturally experienced three stages, as shown in Figure 1b: (1) the uniform cracking stage, with a constant velocity; (2) the stage of accelerated cracking; and (3) the stage of fissure closure before instability [27]. Taking the locking section in the middle of the slope as the fulcrum, the deformation at the slope top accumulated continuously with the creep at the slope toe, and the crack state underwent a dynamically evolutionary process. Therefore, the rear tension fissure closure trend was recommended as a precursor to landslides that conform with the three-section mechanism [4,5].

3. Base Friction Testing for Landslide Fissure Extension

As one of the physical simulation experiments, base friction testing necessitates a suitable field prototype in order to build the slope model. The aforementioned Sale Hill landslide is excellent for studying the rear fissure features, but it does not meet the requirements for a physical prototype because the original slope features prior to instability cannot be precisely captured. Thus, deformation body II was chosen as the prototype slope for testing. It is a potential landslide that conforms to the three-section mechanism. But instability did not occur after active support measures due to its link to the safety of the Laxiwa hydropower station in Qinghai Province, China [4,5]. Therefore, the original slope features of deformation body II are clear enough for base friction testing in a landslide that conforms to the three-section mechanism.

3.1. Sample Preparation

The lithology of the prototype slope is grayish–white massive granite with a medium coarse-grained texture, which can be regarded as a homogeneous rock mass with the following physical and mechanical parameters: bulk density: γ = 26.5 kN/m3; cohesion: c = 14~16 MPa; and friction angle: φ = 47~55° [4,5]. A tiny fault (Hf4) with the mechanical and physical characteristics of γ = 18.0~23.5 kN/m3, c = 0.39~0.64 MPa, and φ = 22~27° [28] created the creep section. This fault is depicted in Figure 2a. The base friction slope model was built by the similarity principle [29], considering the requirements of geometric, bulk density, and strength similarities, i.e., Sc = SγSL, in which SL, Sγ, and Sc are the geometry, bulk density, and cohesion similarity coefficients of the prototype and the model, respectively. In this research, SL and Sγ were set to 500 and 1.1, respectively, to create a testing slope model that has the geometries displayed in Figure 2b and the physical and mechanical parameters listed in Table 1. The model can validly represent slope structure characteristics. Therefore, a reasonable investigation can be conducted to explore the evolutionary mechanism of the rear fissure in a landslide that conforms to the three-section mechanism.
The flour- and oil-based materials that are commonly used for base friction models by many scholars [30] were used in this experimental research because of their advantages in simulating deformation and dehiscence. The compositions and ratios of these materials were determined through multiple trials and are displayed in Table 1. Before slope model construction, all materials were weighed and mixed in accordance with the abovementioned ratios. Then, based on the geometric design of the slope model (Figure 2b), the sizes of different parts of the slope model on the horizontal conveyor belt were measured and marked to form a sample preparation zone fixed by prismatic-shaped iron blocks. The sample preparation zone is slightly larger than the geometry of the slope model. After that, the mixed material, which was nearly homogeneous, was poured into the sample preparation zone to prepare the slope model according to the procedures of dispersing, tamping, smoothing, and trimming. The material in the creep section was then replaced with the corresponding material shown in Table 1. The thickness of the slope model was about 5 mm. To mitigate the influence of friction on the experiment, a small amount of lubricant was applied to the fixed frame prior to sample preparation, and buffer zones with a width of 60 mm were designed and fabricated (Figure 2b) between the fixed frame and the slope model.

3.2. Testing Scheme

Base friction testing aims to produce friction on the base of a model in a manner that mimics the prototype’s gravity effect. As a result, the slope prototype’s gravity direction should match the direction in which the conveyor belt movement produces friction. Except for the free surface of the model slope, the lower and back parts of the sample slope were blocked by the fixed frame shown in Figure 2 to create a pseudogravity effect through the action of friction. The base friction tests reported in this research were conducted by employing the testing apparatus in the State Key Laboratory of Geo-hazard Prevention and Geo-environment Protection, which is located at Chengdu University of Technology. The base friction testing apparatus is able to create a stable rotary speed to ensure that no sudden changes in friction occur. In addition, particle image velocimetry (PIV) techniques were employed to reveal the deformation mechanism of potential instability slopes. The tracer particles in the PIV measurement system can be dispersed automatically along the entire slope via a plane. Particle motion is accompanied by slope deformation. As a result, finding all of the particle paths between two images makes it simple to determine the displacement and velocity, which has shown good sensor results in landslide model tests. The loading scheme and corresponding steps of base friction testing are shown as follow:
(I)
According to the material ratio listed in Table 1, two different materials were determined and stirred evenly;
(II)
The testing model slope was constructed on the belt of the base friction tester according to the schematic design of the base friction model shown in Figure 2; then, preconsolidation was completed;
(III)
After the reasonable arrangement of the light supplement equipment, the PIV high-speed camera (Figure 2c,d) was arranged at a suitable height above the slope model and connected to the computer control system. The camera was configured with a sample interval of 30 frames per second;
(IV)
The conveyor belt began to rotate to render model deformation stable for more than 1 min, along with PIV measurement;
(V)
Belt rotation was suspended to excavate the first section of the top fissure (Section I in Figure 2b, labeled by a red dashed line), with a length of 20 mm and a width of about 1.5 mm, and the conveyor belt began to rotate to render model deformation stable for more than 1 min, along with PIV measurement;
(VI)
In order to create a fissure with a total depth of 60 mm and a width of roughly 1.5 mm, conveyor belt rotation was stopped in order to excavate the second section of the fissure (Section II in Figure 2b, labeled by a red dashed line). After that, the belt resumed rotating to make the model deformation stable for more than a minute, accompanied by PIV measurements;
(VII)
Repeating the operations outlined in steps (V) and (VI), the slope models with a fissure with a total depth of 100/140/180/220 mm were loaded and measured on the conveyor belt of the base friction tester. It is noted that visible damage on both sides of the fissure was prohibited during fissure excavation; thus, a thin and pointed tool, e.g., a toothpick, was recommended in the experiment.

3.3. Experimental Results

The PIV Process system, which is based on digital image measurement technology, was used to create the slope displacement field by extracting the position coordinates and the corresponding displacement characteristics. This process was applied uniformly to obtain the displacement vectors of random points within the slope model range. The corresponding calculations were completed by the corresponding software of the PIV system, i.e., PIVProcessV1.0.
The effect of the creep section at the slope toe on the fissure section at the slope rear is inevitable and is delivered by the middle locking section. Hence, the locking section area of slope samples was selected to view the deformation development with base friction time. The results show that the deformation field remains relatively stable under an action of stable sliding friction force (e.g., the displacement vectors of different frames in different slope models with different fissure depths in Figure 3), which is consistent with the basic theory of physics. Therefore, for slope models with different fissure depths, the digital images at frame 3001 were selected to analyze the evolutionary mechanism of the rear fissure in locked landslides.
(1)
Evolution of the displacement field
Under the action of the pseudogravity of friction in the slope model without a rear fissure, the direction of displacement vectors of the potential landslide body above the creep section deflected from the initial direction of pseudogravity to the direction nearly perpendicular to the weak interlayer, indicating that the slope structure features, including a creep section, are legitimately imitated to be consistent with landslides that conform with the three-section mechanism. Furthermore, as indicated by the black solid-line ellipse in Figure 4a, the displacement field differentiation phenomenon further presaged the initiation and position of the rear tension fissure, which is consistent with the prototype slope of deformation body II (see Figure 2a and Figure 4a). Both experimental phenomena demonstrate the reliability of model testing.
While the rear fissure depth is 20 mm (corresponding to the rear tension fissure depth of 10 m in the prototype slope), displacement vectors of the potential landslide body above the creep section presented an obvious traction action, reflecting that the action of the weak interlayer provided a driving force for rear fissure extension, especially in the slope rear fissure tip, as shown in Figure 4b.
While the rear fissure depth is 60 mm (corresponding to the rear tension fissure depth of 30 m in the prototype slope), as shown in Figure 4c, a small block-shedding failure occurred at the right side of the rear fissure (Figure 3b0), forming a bell-mouth landform on the slope surface, which is consistent with the deformation–failure phenomenon in the prototype slope shown in Figure 2a. In addition, the possible landslide body, especially near part of the locking section, emerged with a more significant traction action reflected by the displacement vectors, resulting in a maximum deformation area surrounding the rear fissure (Figure 4c).
While the rear fissure depth is 100 mm (corresponding to the rear tension fissure depth of 50 m in the prototype slope), the direction of displacement vectors on the right side of the rear fissure changed slightly toward the inside of the slope. Moreover, from the toe to the top in the potential landslide body, there are obvious rhythmic zones in the displacement magnitudes depicted by different colors, presenting a traction effect to drive the further propagation of the rear fissure (Figure 4d).
While the rear fissure depth is 140 mm (corresponding to the rear tension fissure depth of 70 m in the prototype slope), as labeled by a black solid-line ellipse in Figure 4e, the magnitudes of displacement vectors on the right side of the rear fissure to the inside of the slope increased further, presenting a preliminary trend of rear fissure closure. Furthermore, it is evident from Figure 4e that the maximum displacement area represented by the black solid-line ellipse stayed away from the rear fissure tip, suggesting a relative decline in the driving force behind fissure propagation.
While the rear fissure depth is 220 mm (corresponding to the rear tension fissure depth of 110 m in the prototype slope), as labeled by the black solid-line ellipse in Figure 4f, on the right side of the rear fissure, the magnitudes of the displacement vector to the slope inside increased further, driving the rear fissure to close, which is consistent with actual evolutionary features of landslides that conform with the three-section mechanism, as presented by the Sale Hill landslide (see Section 2 in this paper). Meanwhile, a rotation trend of the potential landslide body was presented through the displacement vectors shown in Figure 4f, predicting the impending shear failure of the locking section along a circular-arc fracture path, which is consistent with the three-section mechanism (see Section 1; more details can be found in [4]). These experimental phenomena not only demonstrate the reliability of model testing but also reveal the reason why rear tension fissure closure is recommended as a type of precursory information for landslides that conform to the three-section mechanism [18].
(2)
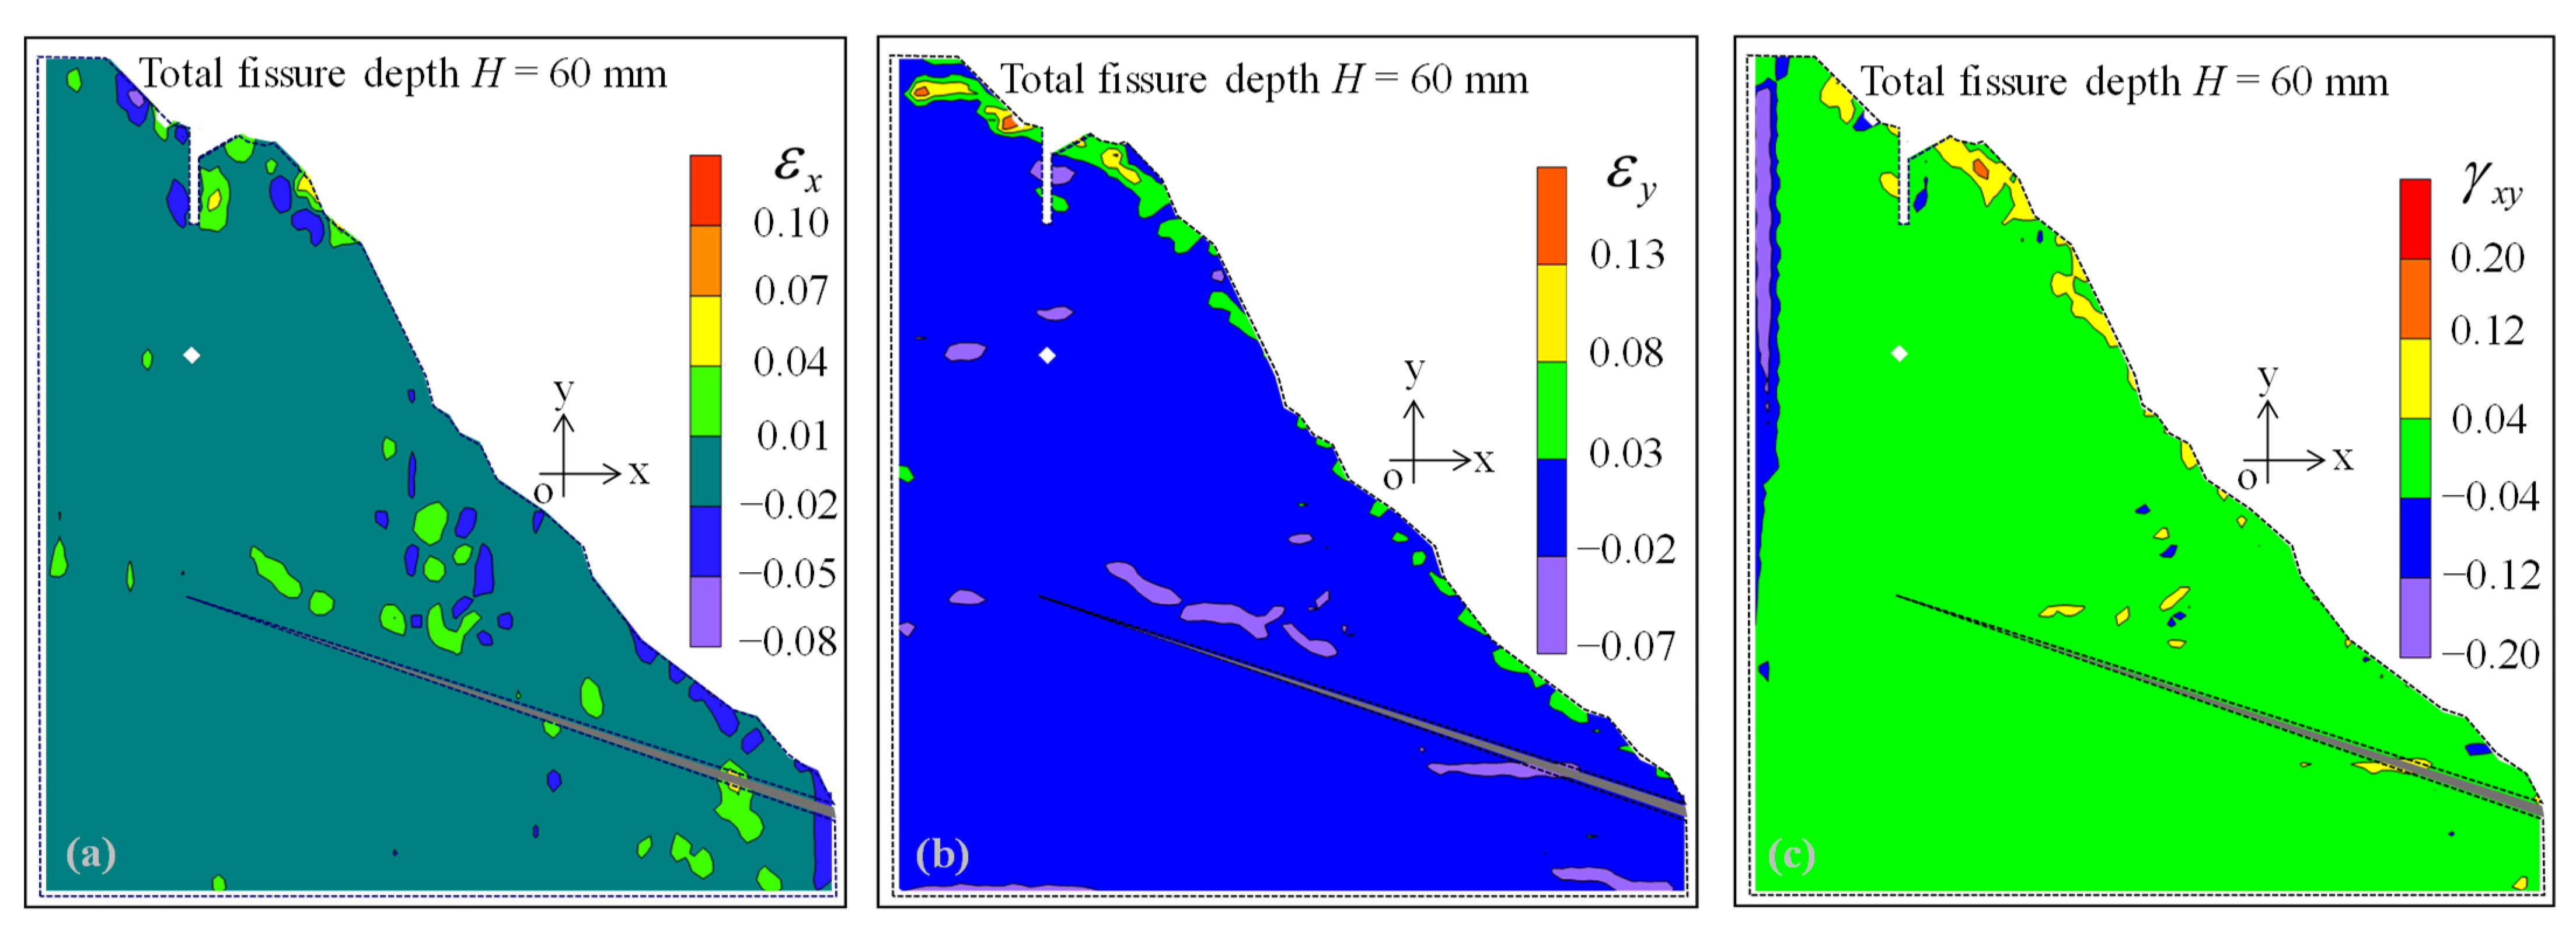
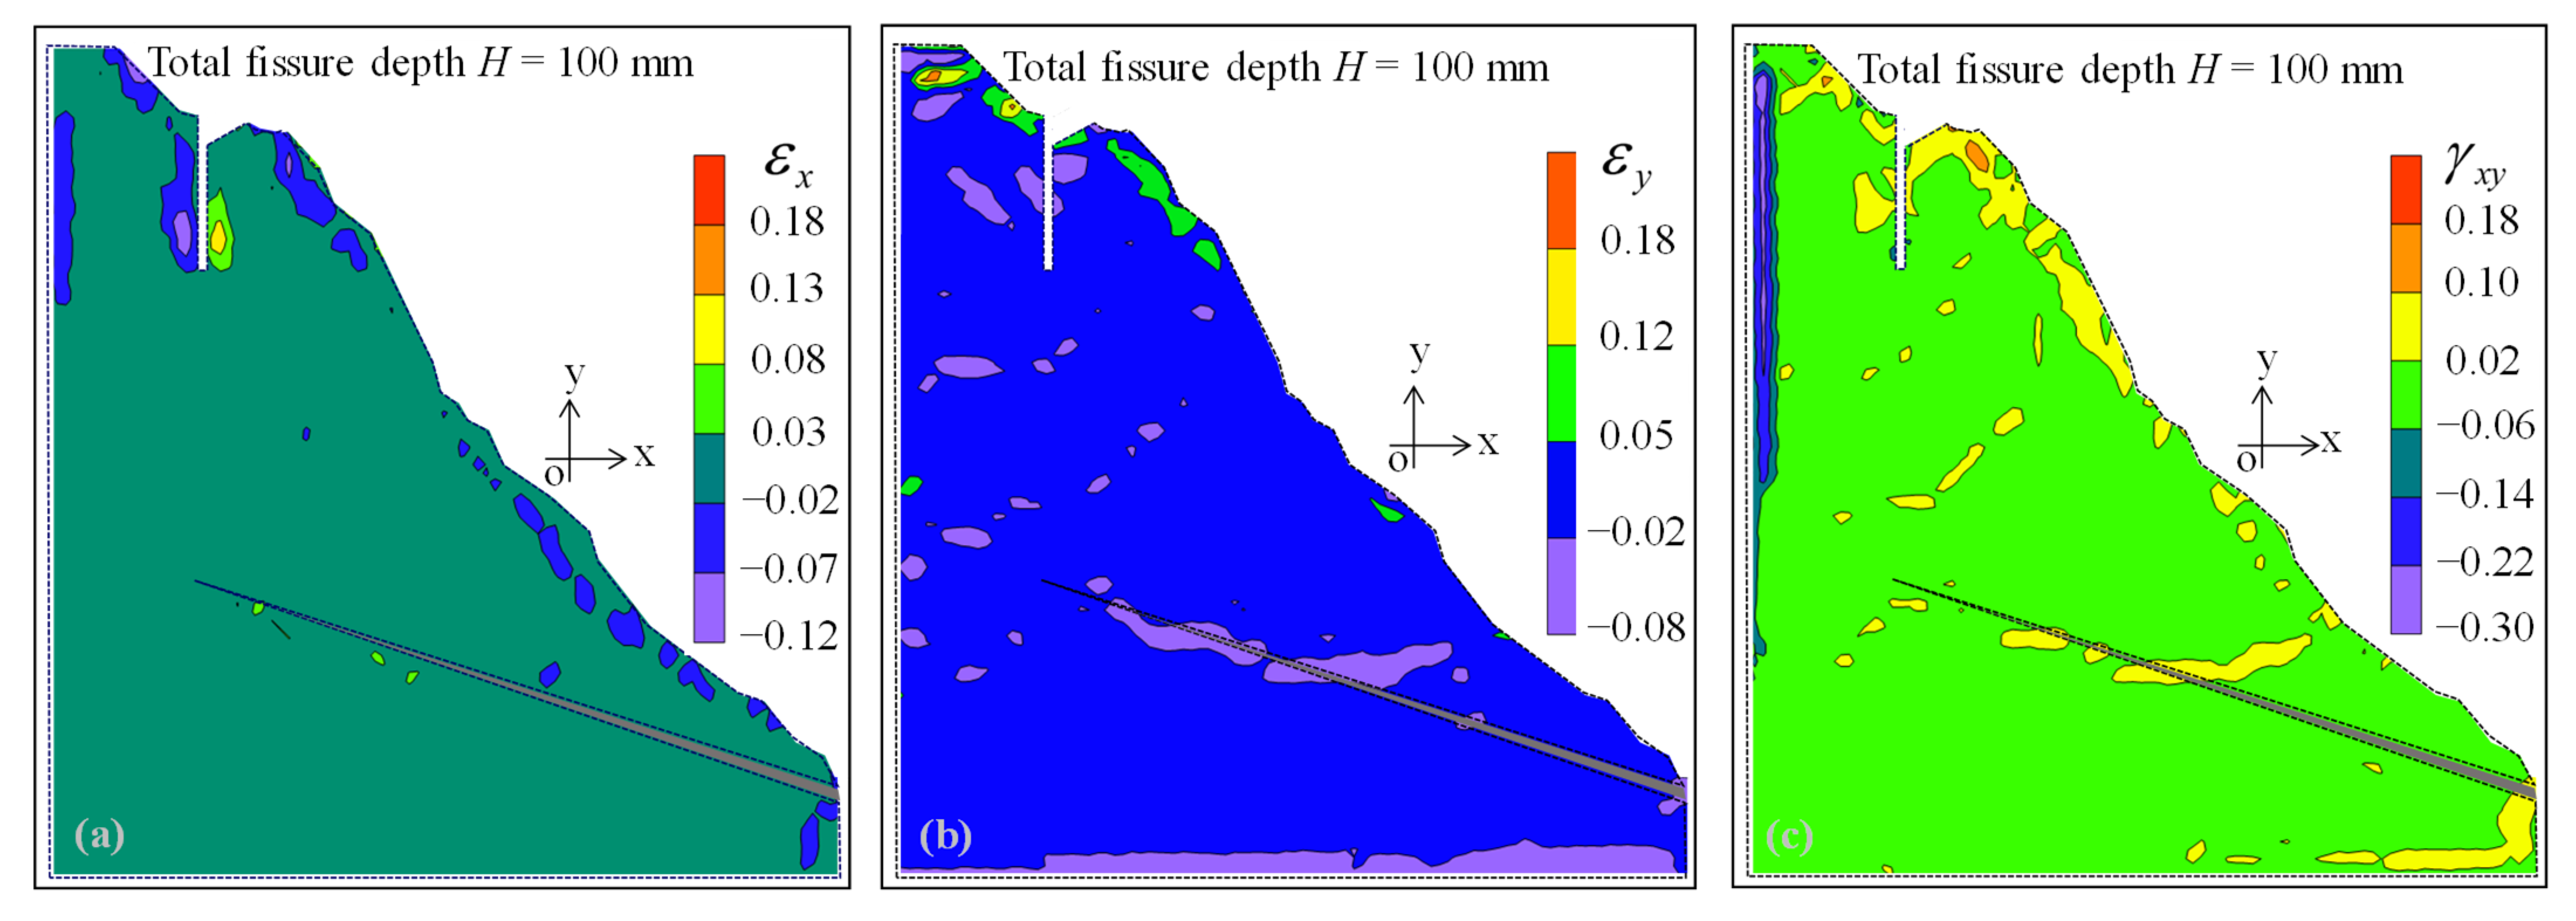
Evolution of strain fields
According to the basic theory of elastic–plastic mechanics, if the displacement components of an object can be completely expressed as a deterministic function of the position coordinates, the strain components can be determined by Equations (1)–(3):
ε x = δ x x
ε y = δ y y
γ x y = δ x y + δ y x
where δx and δy denote displacements in the x and y directions, respectively; εx and εy are the normal strains in the x and y directions, respectively; and γxy denotes the shear strain.
For a triangular element composed of any three adjacency points in the displacement field shown in Figure 4, there are theoretically six degrees of freedom based on the piecewise interpolation of the finite element method. Therefore, in Equations (4) and (5), six undetermined coefficients of α1, α2, α3, α4, α5, and α6 can be defined to express the relationship between displacements and coordinates shown in Figure 5.
δ x i δ x j δ x k = α 1 + α 2 x i x j x k + α 3 y i y j y k
δ y i δ y j δ y k = α 4 + α 5 x i x j x k + α 6 y i y j y k
where xi/yi, xj/yj, and xk/yk are the x/y-direction coordinates for the three adjacency points identified by points i, j, and k, respectively.
Due to the “known” displacements and coordinates of measurement points, as shown in Figure 4, six undetermined coefficients of α1, α2, α3, α4, α5, and α6 can be denoted as Equations (6) and (7).
α 1 α 2 α 3 = x j y k x k y j y j y k x k x j x k y i x i y k y k y i x i x k x i y j x j y i y i y j x j x i T δ x i δ x j δ x k / 2 S Δ
α 4 α 5 α 6 = x j y k x k y j y j y k x k x j x k y i x i y k y k y i x i x k x i y j x j y i y i y j x j x i T δ y i δ y j δ y k / 2 S Δ
where SΔ is the area of the triangle bounded by points i, j, and k and can be denoted as Equation (8).
S Δ = 1 2 1 1 1 x i x j x k y i y j y k
Therefore, Equations (4) and (5) can be combined with Equations (6) and (7) to yield
δ x = 1 x y T x j y k x k y j y j y k x k x j x k y i x i y k y k y i x i x k x i y j x j y i y i y j x j x i T δ x i δ x j δ x k / 2 S Δ
δ y = 1 x y T x j y k x k y j y j y k x k x j x k y i x i y k y k y i x i x k x i y j x j y i y i y j x j x i T δ y i δ y j δ y k / 2 S Δ .
Since the slope model is thin enough, the friction force can be regarded as acting uniformly to impact the entire thickness. Assuming it is a plane stress problem, combining Equations (1)–(3), (9), and (10), three strain components can be obtained according to Equation (11). Ultimately, the strain field was obtained by solving the displacement field to form the relevant strain cloud map.
ε x ε y γ x y = y j y k 0 y k y i 0 x k x j 0 x k x j y j y k x i x k 0 y i y j 0 x i x k 0 x j x i y k y i x j x i y i y j δ x i δ y i δ x j δ y j δ x k δ y k / 2 S Δ
For the slope model without a rear fissure, the horizontal tension strain concentration zone in the range of 0.004–0.013, as labeled by a white solid-line ellipse in Figure 6a, was found at a specific position, which is consistent with the rear tension fissure in the prototype slope of deformation body II (see Figure 2a and Figure 6a). As shown in Figure 6b, for the vertical strains, the beaded tension-compression interval distribution is also highly overlapped with the tension fissure section at the rear slope of the prototype, as determined by the prototype slope (see Figure 2a and Figure 6b). These experimental phenomena not only demonstrated the reliability of model testing but also reveal the location and generation of the rear tension fissure, both of which were inevitable.
When the rear fissure is 20 mm in length (corresponding to the rear tension fissure depth of 10 m in the prototype slope), the influence of left boundary friction on the shear strain concentration shown in the left buffer zone (Figure 6c) becomes weaker, as shown in Figure 7c. As presented by the x-normal strain cloud image (Figure 7a), significant tension and compression strain concentrations were formed at the left and right of the tension fissure, indicating that slope deformation in this state accelerates the extension of the tension fissure. In addition, near the left side of the tension fissure, the concentrations of y-normal strain (Figure 7b) and shear strain (Figure 7c) predicted the compression–shear fracture along the white dashed line, leading to local block-sliding instability (Figure 3b0).
When the rear fissure is 60 mm in length (corresponding to the rear tension fissure depth of 30 m in the prototype slope), the abovementioned local block slips in the direction of the tension fissure, resulting in the formation of a bell-mouth landform (Figure 8 and Figure 3b0), which is consistent with the deformation-failure phenomenon of the bell-mouth landform [4] on the prototype slope (Figure 2a). Furthermore, the significant strain concentrations were distributed on both sides of the tension fissure (Figure 8), nearly at the tip of the tension fissure (Figure 8a), indicating that slope deformation in this state accelerates the extension of the tension fissure.
When the rear fissure is 100 mm in length (corresponding to the rear tension fissure depth of 50 m in the prototype slope), the cores of strain concentration areas are distributed on both sides of the tension fissure (Figure 9) but diverging from the tip of the tension fissure (Figure 9a), indicating that the acceleration effect of slope deformation on tension fissure propagation is weakened. In this state, Figure 9b,c show that the slope creep section was subjected to significant compression-shear strain concentrations with the change from the outer (Figure 7 and Figure 8) to inner (Figure 9) slope zones. This indicates that, with the propagation of the rear tension fissure, the creep effect in the front weak interlayer transformed towards the inside of the slope.
When the rear fissure is 140 mm in length (corresponding to the rear tension fissure depth of 70 m in the prototype slope), the cores of strain concentration areas distributed at both sides of the tension fissure (Figure 10) diverge from the tip of the tension fissure (Figure 10a), indicating the weakening of the acceleration effect of slope deformation on tension fissure propagation. In this state, a significant tensile strain concentration was presented at the tension fissure tip (Figure 10b), accompanying the obvious compression-shear deformation in the shallow slope (Figure 10b,c).
When the rear fissure is 180 mm in length (corresponding to the rear tension fissure depth of 90 m in the prototype slope), the strain concentration areas distributed at both sides of the tension fissure (Figure 11) diverge from the tip of the tension fissure (Figure 11a), indicating the significant weakening of the driving forces for tension fissure propagation. As a result, tension fissure propagation tends to stagnate, as inferred from the strain field approaching zero at the tension fissure tip (Figure 11a–c).
When the rear fissure depth is 220 mm (corresponding to the rear tension fissure depth of 110 m in the prototype slope), the strain concentration areas distributed at both sides of the tension fissure, especially the cores of strain concentration areas at the half-depth of the tension fissure, diverge from the tension fissure tip (Figure 12a). Moreover, the strain field near the tension fissure tip (Figure 12b,c) shows that the tension fissure tip tends toward a compression–shear stress state, portending the followup brittle shear failure of the locking section, which is consistent with the three-section mechanism (see Section 1; more details can be found in [4]), in addition to demonstrating the reliability of model testing.

4. Evolutionary Mechanism of the Rear Fissure

For the prototype slope, i.e., deformation body II, which conforms to the three-section mechanism, including a locking section, the critical tension crack depth is 111 m in theory [4]. In this experiment, the rear fissure with a length of 220 mm, corresponding to the rear tension fissure depth of 110 m in the prototype slope, is close to the critical tension fissure depth (Hcr). Therefore, from the perspective of the internal evolution of slope bodies, the evolutionary mechanism of the rear fissure in locked landslides can be summarized as follows:
  • Without the rear tension fissure, controlled by the specially sloped structure with a weak interlayer in front, it is inevitable that the rear fissure will initiate in the special position according to displacement differentiation and strain concentration;
  • For the rear tension fissure propagation from zero to approximately 0.5 Hcr, with the creep active zone of the front weak interlayer migrating from outside to inside, the traction action, especially for the fissure tip, is gradually increased to accelerate rear tension fissure extension, accompanying significant strain concentrations at the tension fissure tip;
  • For the rear tension fissure propagation from approximately 0.5 Hcr to nearly Hcr, with an increasing trend of the rear fissure closure, the strain concentration cores, mainly at the half-depth of the tension fissure, gradually diverge from the tension fissure tip, resulting in a reduction in the propagation drive of the rear tension fissure;
  • With a tension fissure of nearly Hcr and a rotation trend of the slope body, the rear tension fissure tip is dominated by compression–shear stresses, portending the upcoming shear failure of the locking section along a circular-arc fracture path.

5. Discussion

The gravity effects in landslides can be simulated relatively accurately in centrifuge testing [31], while simulation is difficult, expensive, and unreliable in the testing domain, resulting in difficulties in dynamic control to create or expand a rear tension crack in a slope model during experiments. While a landslide is considered a plane problem due to the similarity between the friction force field and the gravity field, the base friction of the physical model simulates the gravity effect of the prototype slope. To improve base friction experiments from a qualitative demonstration to a more accurate quantitative analysis [19], Egger [19] refined the technique by applying human-controlled pressure to the model surface, resulting in stress and strength similitude. However, this refinement has the drawback of photogrammetrically hindering deformation monitoring. Therefore, because of insufficient stress similarity, the pertinent experimental research conducted in this study is still at the qualitative demonstration stage.
But gravity is a body force, not a face force. Is the aforementioned qualitative demonstration trustworthy? Similar model tests were based on the similarity principle to scale down the actual slope, then reshape it in order to comprehensively explore the internal evolutionary mechanism of the rear tension fissure. This allowed for a more realistic reflection of the actual slope deformation [32] and a more intuitive grasp of the deformation evolution of the actual slope body from the inner perspective. Furthermore, it was shown that the base friction test could validly replicate the body force effect, as presented by the consistency of evolutionary features between the experimental model and the slope prototype, such as the rear fissure initiation position, the bell-mouth landform at the top, the rear fissure closure trend, etc. Hence, as long as the model is consist with the prototype in terms of slope structures, the rear tension fissure evolution mechanism obtained from testing is reliable. The protocol for the base friction test reported in this paper is summarized in Table 2, which has been recommended and used in many studies [22,31,33].
The macroscopic instability of a slope is a process that evolves from local failure to global failure. The potential tensile sliding surface is of significance for stability analysis but is difficult to accurately position. Therefore, for the stability evaluation of landslides that conform to the three-section mechanism, it is necessary to consider the inevitability of the rear tension fissure on the basis of the evolutionary mechanism (Table 2). For example, while using the vector sum method (VSM) proposed by Ge [34], due to the “known” potential failure path determined by the evolutionary mechanism, the sliding force originated from the potential landslide body gravity, and the antisliding force originates from the creep section, the locking section, and the potential tension fissure. The antisliding force from the locking section (Fia) can be expressed as
F i a = 0 π 2 α { r γ y 0 y sin 2 θ [ sin α s + θ π 2 + tan φ i cos α s + θ π 2 ] + c i r cos α s + θ π 2 } d θ
where α, r, y0, and y are parameters or functions determined by the geometric features of the slope, the definition of which can be found in [4]; γ is the unit weight of the potential sliding body; ci and φi are the cohesion and internal friction angle of the locked section, respectively; and αs is a parameter reflecting the instability direction in the limit state, as defined in [4].
The antisliding force from the creep section (Fja) can be expressed as
F j a = x 1 x c { γ y 0 y cos α [ sin α s α + tan φ j cos α s α ] + c j sec α cos α s α } d x
where cj and φj are the cohesion and internal friction angle of the creep section, respectively, and x1 and xc are parameters defined in [4], which are determined by the geometric features and evolutionary mechanisms of a potential landslide that conforms to the three-section mechanism.
The sliding force on the failure path of the locking section (Fis) can be expressed as
F i s = 0 π 2 α { r γ y 0 y sin θ [ cos θ cos α s + θ π 2 + sin θ sin α s + θ π 2 ] } d θ
The sliding force on the failure path of the locking section (Fjs) can be expressed as
F j s = x 1 x c γ y 0 y [ sin α cos α s α + cos α sin α s α ] d x
For a potential landslide that conforms to the three-section mechanism with a rear tension fissure depth of Hc, the stability coefficient (Fs) can, thus, be expressed as
F s = F i a + F j a + ( H c r H c ) σ t F i s + F j s
where Hcr is the critical tension fissure depth defined in [4], and σt is the tensile strength of the potential tension fissure section.
For early warning of landslides that conform to the three-section mechanism, this research revealed that the rear tension fissure closure trend may start at a tension fissure depth of approximately Hcr/2, then increase gradually to be maximized at a critical tension fissure depth. Thus, the rear tension fissure closure trend is not a sufficient condition for landslide occurrence. For locked landslides that conform to the three-section mechanism, the rear tension fissure closure trend is not an absolutely reliable precursor to slope instability because of the possibility of misreporting in early landslide warning. In order to improve sustainable development through more accurate landslide geohazard prediction, it should be combined with other precursor information for the purpose of comprehensive cross validation.

6. Conclusions

Landslide prevention associated with sustainable development greatly relies on instability prediction and early warning, the key to which is progress in mechanism analyses of landslide evolution. For landslides that conform to the three-section mechanism, including a locked section, the evolutionary process was investigated by landslide case analysis and base friction testing in order to reveal the evolutionary mechanism of the rear fissure in locked landslides. The following conclusions can be drawn:
(1)
Through displacement differentiation and strain concentration controlled by the front weak interlayer, the rear tension fissure is inevitable; therefore, we recommend consideration of in the stability evaluation of landslides that conform to the three-section mechanism;
(2)
For the rear tension fissure propagation from zero to nearly Hcr, controlled by the migration of displacement differentiation and strain concentration, the driving effect undergoes acceleration, then deceleration, roughly bounded by the half critical tension fissure at the slope rear;
(3)
The trend of rear tension fissure closure may originate from a tension fissure depth of approximately Hcr/2, which is not a sufficient condition for landslide occurrence, which may result in misreporting of precursor information with respect to early warning of locked landslides that conform to the three-section mechanism.

Author Contributions

Conceptualization, G.C.; Formal analysis, P.T.; Investigation, P.T.; Writing—original draft, P.T.; Writing—review & editing, S.Q.; Project administration, G.C. All authors have read and agreed to the published version of the manuscript.

Funding

This research was supported by the National Natural Science Foundation of China (Grant No. 41941019). This work was supported by the Science and Technology Research Project of Jiangxi Provincial Education Department (GJJ210864).

Institutional Review Board Statement

Not applicable.

Informed Consent Statement

Not applicable.

Data Availability Statement

Data are contained within the article.

Conflicts of Interest

The authors declare no conflict of interest.

References

  1. Tao, Z.G.; Geng, Q.; Zhu, C.; He, M.; Cai, H.; Pang, S.; Meng, X. The mechanical mechanism of large-scale toppling failure for counter-inclined rock slopes. J. Geophys. Eng. 2019, 16, 541–558. [Google Scholar] [CrossRef]
  2. Huang, R.Q.; Chen, G.Q.; Guo, F.; Zhang, G.; Zhang, Y. Experimental study on the brittle failure of the locking section in a large-scale rock slide. Landslides 2016, 13, 583–588. [Google Scholar] [CrossRef]
  3. Huang, R.Q. Mechanisms of large-scale landslides in China. B Eng. Geol. Environ. 2012, 71, 161–170. [Google Scholar] [CrossRef]
  4. Chen, G.Q.; Tang, P.; Huang, R.Q.; Wang, D.; Lin, Z.; Huang, D. Critical tension crack depth in rockslides that conform to the three-section mechanism. Landslides 2021, 18, 79–88. [Google Scholar] [CrossRef]
  5. Zhang, Z.Y.; Liu, H.C. Key Engineering Geology Problem and Research on Longyangxia Hydropower Station of Huanghe River; University of Technology Press: Chengdu, China, 1990. [Google Scholar]
  6. Li, X.S.; Li, Q.; Wang, Y.M.; Liu, W.; Hou, D.; Zheng, W.; Zhang, X. Experimental study on instability mechanism and critical intensity of variation rainfall of high-steep rock slopes under unsaturated conditions. Int. J. Min. Sci. Technol. 2023, 33, 1243–1260. [Google Scholar] [CrossRef]
  7. Yin, Y.; Deng, Q.; Li, W.; He, K.; Wang, Z.; Li, H.; An, P.; Fang, K. Insight into the crack characteristics and mechanisms of retrogressive slope failures: A large-scale model test. Eng. Geol. 2023, 327, 107360. [Google Scholar] [CrossRef]
  8. Wu, X.Y.; Niu, F.J.; Liang, Q.G.; Li, G. Study on tensile strength and tensile-shear coupling mechanism of loess around Lanzhou and Yanan city in China by unconfined penetration test. Ksce J. Civ. Eng. 2019, 23, 2471–2482. [Google Scholar] [CrossRef]
  9. Lu, Y.; Chen, X.; Wang, L. Research on Fracture Mechanism and Stability of Slope with Tensile Cracks. Appl. Sci. 2022, 12, 12687. [Google Scholar] [CrossRef]
  10. Zhu, C.; He, M.; Karakus, M.; Cui, X.; Tao, Z. Investigating toppling failure mechanism of anti-dip layered slope due to excavation by physical modelling. Rock Mech. Rock Eng. 2020, 53, 5029–5050. [Google Scholar] [CrossRef]
  11. Wang, C.; Wang, H.; Qin, W.; Wei, S.; Tian, H.; Fang, K. Behaviour of pile-anchor reinforced landslides under varying water level, rainfall, and thrust load: Insight from physical modelling. Eng. Geol. 2023, 325, 107293. [Google Scholar] [CrossRef]
  12. Tao, Z.G.; Zhu, C.; He, M.C.; Liu, K. Research on the safe mining depth of anti-dip bedding slope in Changshanhao Mine. Geomech. Geophys. Geo. 2020, 6, 36. [Google Scholar]
  13. Ren, F.Q.; Zhu, C.; He, M.C. Moment tensor analysis of acoustic emissions for cracking mechanisms during schist strain burst. Rock Mech. Rock Eng. 2020, 53, 153–170. [Google Scholar] [CrossRef]
  14. Dong, M.; Zhang, F.; Lv, J.; Hu, M.; Li, Z. Study on Deformation and Failure Law of Soft-hard rock interbedding Toppling slope Base on Similar Test. Bull. Eng. Geol. Environ. 2020, 79, 4625–4637. [Google Scholar] [CrossRef]
  15. Dong, M.; Zhang, F.; Hu, M.; Liu, C. Study on the Influence of Anchorage Angle on the Anchorage Effect of Soft-hard Inter-bedded Toppling Deformed Rock Mass. Ksce J. Civ. Eng. 2020, 24, 2382–2392. [Google Scholar] [CrossRef]
  16. Zhang, D.-B.; Zhang, Y.; Cheng, T.; Meng, Y.; Fang, K.; Garg, A.; Garg, A. Measurement of displacement for open pit to underground mining transition using digital photogrammetry. Measurement 2017, 109, 187–199. [Google Scholar] [CrossRef]
  17. Beng, X.T.; Zhang, G.C.; Yang, Y.C.; Zhu, C.; Karakus, M.; Wang, D. Flexural toppling characteristics of anti-dip soft rock slope with base friction test. B Eng. Geol. Environ. 2023, 82, 21. [Google Scholar] [CrossRef]
  18. Tu, G.; Deng, H.; Li, M. Development and evolution of deep-seated toppling landslide by rapid river downcutting. Bull. Eng. Geol. Environ. 2023, 82, 185. [Google Scholar] [CrossRef]
  19. Bray, J.W.; Goodman, R.E. The Theory of Base Friction Models. Int. J. Rock Mech. Min. Sci. Geomech. Abstr. 1981, 18, 453–468. [Google Scholar] [CrossRef]
  20. Wang, Y.K.; Sun, S.W.; Pang, B.; Liu, L. Base friction test on unloading deformation mechanism of soft foundation waste dump under gravity. Measurement 2020, 163, 108054. [Google Scholar] [CrossRef]
  21. Zhang, S.; Shi, W.; Yang, C.; Wang, Y.; Yu, X. Experimental evaluation of gentle anti-dip slope deformation and fracture network under the action of underground mining. Landslides 2022, 20, 381–408. [Google Scholar] [CrossRef]
  22. Fang, K.; Zhang, J.; Tang, H.; Hu, X.; Yuan, H.; Wang, X.; An, P.; Ding, B. A quick and low-cost smartphone photogrammetry method for obtaining 3D particle size and shape. Eng. Geol. 2023, 322, 107170. [Google Scholar] [CrossRef]
  23. Zhu, C.; He, M.C.; Karakus, M.; Zhang, X.; Tao, Z. Numerical simulations of the failure process of an aclinal slope physical model and control mechanism of negative Poisson’s ratios cable. B Eng. Geol. Environ. 2021, 80, 3365–3380. [Google Scholar] [CrossRef]
  24. Bao, M.; Chen, Z.H.; Zhang, L.F.; Nian, G.; Zhu, T.; Hao, J. Experimental study on the sliding instability mechanism of slopes with weak layers under creeping action. Measurement 2023, 212, 112690. [Google Scholar] [CrossRef]
  25. Zhou, Z.H.; Chen, Z.H.; Shen, Y.; Bao, M.; Nian, G.; Zhang, L.; Liu, Y. Failure of rock slopes with intermittent joints: Failure process and stability calculation models. Lithosphere 2022, 2021, 8923718. [Google Scholar] [CrossRef]
  26. Huang, R.Q. Some catastrophic landslides since the twentieth century in the southwest of China. Landslides 2009, 6, 69–81. [Google Scholar]
  27. Huang, R.Q.; Xu, Q. Typical Catastrophic Landslides in China; Science Press: Beijing, China, 2008. [Google Scholar]
  28. Huang, R.Q.; Zhang, Z.Y.; Wang, S.T. Systematic Engineering Geology Studying of the Stability of High Slope; Chengdu University of Technology Press: Chengdu, China, 1991. [Google Scholar]
  29. Tao, Z.G.; Zhu, C.; He, M.C.; Karakus, M. A physical modeling-based study on the control mechanisms of Negative Poisson’s ratio anchor cable on the stratified toppling deformation of anti-inclined slopes. Int. J. Rock Mech. Min. 2021, 138, 104632. [Google Scholar] [CrossRef]
  30. Zhang, L.F.; Chen, Z.H.; Nian, G.Q.; Bao, M.; Zhou, Z. Base friction testing methodology for the deformation of rock masses caused by mining in an open-pit slope. Measurement 2023, 206, 112235. [Google Scholar] [CrossRef]
  31. Fang, K.; Tang, H.M.; Li, C.D.; Su, X.; An, P.; Sun, S. Centrifuge modelling of landslides and landslide hazard mitigation: A review. Geosci. Front. 2023, 14, 101493. [Google Scholar] [CrossRef]
  32. Ning, Y.B.; Tang, H.; Zhang, G.; Smith, J.V.; Zhang, B.; Shen, P.; Chen, H. A complex rockslide developed from a deep-seated toppling failure in the upper Lancang River, Southwest China. Eng. Geol. 2021, 293, 106329. [Google Scholar] [CrossRef]
  33. Fang, K.; Dong, A.; Tang, H.; An, P.; Zhang, B.; Miao, M.; Ding, B.; Hu, X. Comprehensive assessment of the performance of a multismartphone measurement system for landslide model test. Landslides 2022, 20, 845–864. [Google Scholar] [CrossRef]
  34. Ge, X.R. Deformation control law of rock fatigue failure, real-time X-ray CT scan of geotechnical testing and new method of stability analysis of slopes and dam foundations. Chin. J. Geotech. Eng. 2008, 30, 1–20.w. [Google Scholar]
Figure 1. Sale Hill landslide: (a) the engineering geological planar schematic [27]; (b) the evolutionary process of the rear fissure width with time [27]; and (c) the speculative geological profile reflecting structural features of the locked landslide, which was modified from the literature [2].
Sustainability 16 00017 g001
Figure 2. Base friction testing: (a) the slope prototype [4]; (b) the geometric design of the slope model; (c) the test site; (d) a schematic diagram of the base friction testing principle.
Sustainability 16 00017 g002
Figure 3. Digital images of slope models with fissure depths of 0, 100, and 220 mm labeled as (a), (b), and (c), respectively. In addition, for the critical area, including a locking section marked by red outlines from images at different frames (frame 1, frame 1201, and frame 3001) were extracted and labeled by subscripts of (1), (2), and (3), respectively. H denotes the fissure depth at the rear of the slope, indicating that the deformation field remains relatively stable under a stable sliding friction force. The distance of adjacent tracer particles is about 1 cm.
Sustainability 16 00017 g003
Figure 4. Evolution of the displacement field obtained from digital images of slope models with an increased rear fissure depth of (a) H = 0, (b) H =20 mm, (c) H = 60 mm, (d) H = 100 mm, (e) H = 140 mm, and (f) H = 220 mm, in which the arrow direction represents the displacement direction. In addition, the displacement magnitudes are reflected by the arrow length and rendered in different colors. The data were collected from the measuring results of the PIV system.
Sustainability 16 00017 g004
Figure 5. A map of any three adjacency points that are not on the same line, identified by i, j, and k with x/y-direction displacements of δix/δiy, δjx/δjy, and δkx/δky, respectively.
Sustainability 16 00017 g005
Figure 6. Strain field obtained from digital images of slope models without a rear fissure: (a) the normal strains in the horizontal direction of x; (b) the normal strains in the vertical direction of y; (c) the shearing strain with the same definition as elasticity mechanics. For normal strains, a positive value represents tension, and a negative value represents compression. The creep section is represented by a gray fill zone.
Sustainability 16 00017 g006
Figure 7. Strain field of the slope model with a rear fissure depth H of 20 mm (corresponding to the rear tension fissure depth of 10 m in the prototype slope): (a) the normal strains in the horizontal direction of x; (b) the normal strains in the vertical direction of y; (c) the shearing strain with the same definition as elasticity mechanics. For normal strains, the positive value represents tension, and the negative value represents compression. The creep section is represented by a gray fill zone.
Sustainability 16 00017 g007
Figure 8. Strain field of the slope model with a rear fissure depth H of 60 mm (corresponding to the rear tension fissure depth of 30 m in the prototype slope): (a) the normal strains in the horizontal direction of x; (b) the normal strains in the vertical direction of y; (c) the shearing strain with the same definition as elasticity mechanics. For normal strains, a positive value represents tension, and a negative value represents compression. The creep section is represented by a gray fill zone.
Sustainability 16 00017 g008
Figure 9. Strain field of the slope model with a rear fissure depth H of 100 mm (corresponding to the rear tension fissure depth of 50 m in the prototype slope): (a) the normal strains in the horizontal direction of x; (b) the normal strains in the vertical direction of y; (c) the shearing strain with the same definition as elasticity mechanics. For normal strains, a positive value represents tension, and a negative value represents compression. The creep section is represented by a gray fill zone.
Sustainability 16 00017 g009
Figure 10. Strain field of the slope model with a rear fissure depth H of 140 mm (corresponding to the rear tension fissure depth of 70 m in the prototype slope): (a) the normal strains in the horizontal direction of x; (b) the normal strains in the vertical direction of y; (c) the shearing strain with the same definition as elasticity mechanics. For normal strains, a positive value represents tension, and a negative value represents compression. The creep section is represented by a gray fill zone.
Sustainability 16 00017 g010
Figure 11. Strain field of the slope model with a rear fissure depth H of 180 mm (corresponding to the rear tension fissure depth of 90 m in the prototype slope): (a) the normal strains in the horizontal direction of x; (b) the normal strains in the vertical direction of y; (c) the shearing strain with the same definition as elasticity mechanics. For normal strains, a positive value represents tension, and a negative value represents compression. The creep section is represented by a gray fill zone.
Sustainability 16 00017 g011
Figure 12. Strain field of the slope model with a rear fissure depth H of 220 mm (corresponding to the rear tension fissure depth of 110 m in the prototype slope): (a) the normal strains in the horizontal direction of x; (b) the normal strains in the vertical direction of y; (c) the shearing strain with the same definition as elasticity mechanics. For normal strains, a positive value represents tension, and a negative value represents compression. The creep section is represented by a gray fill zone.
Sustainability 16 00017 g012
Table 1. Similar material ratios and the related physical and mechanical parameters.
Slope PartMaterial Ratio (Mass Ratio)γ (kN/m3)c (kPa)φ (°)
Main massBarite:quartz sand:paraffin oil = 32:16:724.029.233.9
Weak interlayerBentonite:barite:quartz sand:water = 10:3:2:518.00.7618.6
Table 2. Summary of the protocol of the base friction test, as proposed by Fang et al. [31] to condense the pertinent and important information from the test.
Test Aim Exploring the Evolutionary Mechanism of the Rear Fissure in a Kind of Landslide
BasicTriggersGravity-like forceContainerModel typeTwo-dimensional
Force actionBase frictionModel sizeLength: 543 mm; width: 520 mm; thickness: 5 mm
Landslide Classification Potential RockslidePreparationCompaction
Slope modelTension fissureMan-madeMonitor toolPIV systemDisplacements of various marker points dispersed automatically
Material
(Main mass)
58% barite,
29% quartz sand,
13% paraffin oil.
TestPrototypePotential landslide named deformation body II
Material
(Weak interlayer)
50% bentonite,
15% barite,
10% quartz sand,
25% water.
ConditionTest variableDifferent fissure length
Important results
The rear tension fissure has an inevitability to initiate controlled by the specially slope structures and the three-section mechanism of potential landslides.
For the rear tension fissure propagation from zero to nearly Hcr, the driving effect of tension fissure propagation undergoes a process from accelerating to then decelerating, roughly bounded by the half critical tension fissure at the slope rear.
Disclaimer/Publisher’s Note: The statements, opinions and data contained in all publications are solely those of the individual author(s) and contributor(s) and not of MDPI and/or the editor(s). MDPI and/or the editor(s) disclaim responsibility for any injury to people or property resulting from any ideas, methods, instructions or products referred to in the content.

