Abstract
Responding to calls for climate action, this article develops and introduces a Sustainability Transition Framework (STF), which is a high-level interpretation of the complex dynamics dominating the current historical moment characterised by an aspiration for accelerated climate action and challenges with implementing change. This STF brings together and integrates a set of theories about change which were developed in different disciplines and not commonly discussed at the same time. The four key theories are: (1) sustainability transitions, transition management and related theories which consider the necessary change in sociotechnical regimes; (2) diffusion of innovation theory, which provides a high-level overview of patterns with uptake of innovation; (3) a change curve which explains complex emotional experiences when facing organisational change; and (4) a conceptualisation of the style cycle, which is commonly used in the history of art and architecture. These are visually depicted and integrated into a novel STF diagram. The STF presents one of the most comprehensive integrations of currently available knowledge on how change happens, which is essential for accelerated climate action. The STF helps understand individual or social group experiences. Through an improved understanding of the sustainability transition, the STF empowers climate action.
1. Introduction
We live in a complex historical moment where the science is unequivocally saying that human activities since 1850 have caused an increase in global surface temperature, and that this trend has continued to increase in the last decade, 2010–2019 [1]. Numerous news reports appear to agree that the change in climate is starting to be felt across the globe, and even climate migration is on the rise [2]. However, research shows that people respond to climate change facts through a range of individual lenses, including personality traits, values, political views, etc., but also that our individual responses are mediated by a range of assumptions about what is normal behaviour compared to others [3,4,5,6]. As a consequence, even direct personal experience of extreme weather events does not intensely correlate to a heightened recognition of climate change [3]. At the same time, climate anxiety is increasingly recognised as an issue and discussed, especially among the younger generations [7,8].
Arguably, for architecture and related disciplines, these discussions are even more complex. In order to meet the 2030 and 2050 goals set to limit global warming to 1.5–2 °C, buildings and the built environment must contribute a significant reduction in CO2 emissions [1]. Currently, it remains unclear how this can be achieved, given that, despite much effort, emissions from the construction industry globally are still increasing [1]. Further to that, architecture is one of the areas where energy conservation and sustainability started to be discussed in the early 1970s [9], which begs the question: where is the progress one would expect after half a century of effort? Complicating things further, many schools of architecture had included courses on sustainability by around 2000, but some sustainable practices appear to have gone backwards [10]. Indeed, since around 2000, the global consumption of materials for construction has exponentially increased [11,12].
Jointly, this global sense of urgency, the disciplinary agreement that architecture should be part of the solution, and the lack of obvious success can lead to a sense of confusion, discouragement, and delays at the time when acceleration is very much needed.
Responding to this context, this article introduces a Sustainability Transition Framework (STF). The aim of the STF is to develop an interpretation of the existing complexities to offer a sense of clarity as to why the current moment is complex, and to use this clarity to empower action. The STF provides a simple, high-level view of the transitions generally. The core proposition of this article is that understanding the patterns of the change process can help accelerate action, because it aids sensemaking. The STF enables us to articulate an overall view of the changes around us, which can give us confidence in our own power to make a positive difference and clarity on what needs doing, and therefore can be very helpful during these unsettled times.
Introducing the Sustainability Transition Framework (STF)
The Sustainability Transition Framework (STF) brings together a set of theories about change which were developed in different disciplines and are not commonly discussed at the same time. Some of these theories are fairly recent, while others are much older. The four key existing conceptualisations of change, discussed in Section 3, are: (1) sustainability transitions, transition management and related theories as one set of conceptualisations considering the necessary sociotechnical regime change to achieve sustainable outcomes; (2) diffusion of innovation theory, which provides a high-level overview of patterns with uptake of innovation; (3) a change curve which is based on the five stages of grieving and explains the complex emotions experienced when facing organisational change; and (4) a conceptualisation of the style cycle, which is common in the history of art and architecture. Each of these theories explain one aspect of the change process; by considering the dynamics through the important regime shift that is needed (1); the adoption of innovative solutions (2); the emotional complexities experienced by all of us (3); and by attempting to articulate how these aspects relate to the change of style in architecture and other design disciplines (4). However, this article asserts that these theories are most effective when considered jointly, and that these can be effectively brought together.
Although some aspects of the framework are contextualised within architecture and the built environment, overall, this framework applies to any situation which is facing any complex transitions. In fact, the STF presents one of the most comprehensive integrations of currently available knowledge on how change happens, which is essential for climate action in any area, and therefore possibly contributes more to the understanding of sustainability transitions generally than specifically to sustainability transitions in architecture and the built environment.
In addition to considering this set of theories at the same time, the article presents their visualisations, and visually brings these together into an integrated STF diagram. The resulting diagram achieves a high level of simplicity when describing very complex patterns. Of course, that requires simplifications. In fact, even the four key theories which are brought together into the STF have already received criticisms for their relative tendency towards simplification.
Simplicity helps clarity because simplicity, rather than complexity, is psychologically desirable. A bias towards simplicity and abstraction has a long history of study in psychology and its application in relation to learning [13,14,15]. Although some aspects of this bias could still be explained more fully, it is already established that the human ‘mind seeks the simplest available interpretation of observations’ [14]. This appears to be true for a range of situations, including perception (finding tasks), memory (learning), cognition (problem solving tasks, rational analysis, etc.), and is equally applicable in nature, due to the Universal Law of Generalisation [13,14,15]. This could be why most of the theories discussed here are still in use (key books still in print), some more than half a century since their first release.
However, whilst accepting and proactively working with this simplicity bias, it is also critical to acknowledge that very few phenomena can be fully explained through a simple summary. Rather, the simple, high-level summary can be seen as a table of contents enabling the outsider of the field to grasp it somewhat, while deciding how to dive deeper into it. This helps the sensemaking, and sensemaking has been recognised as important in helping alter recipients’ understanding and support the process of change [16,17,18]. Once the simplicity of the STF has helped us see the bigger, high-level picture, we should dive into the complexity of any point within it.
One important feature of the STF is that it makes it easier to understand the challenges, and what particular challenges might be about. Through an improved understanding of the transitions at foot, the STF empowers climate action. Further to that, it directs that action into the right areas for the particular phase of change and instils a sense that desirable change is not only possible, but that it has been taking place all along, which is an empowering position for accelerated action.
2. Methods, Scope, and Definitions
This article opens with a series of reviews of the relevant bodies of knowledge, and an introduction of the four key theories and their diagrammatic visualisations (Section 3). These are followed by an introduction of the integrated STF diagram and a discussion of how it brings the four theories together, its features and potential applications (Section 4). The hypothesis is that by bringing together this set of theories of change, and integrating them into the STF, it will be possible to better understand the change process.
The core argument proposed here develops primarily from four specific theories of change. Reviewed information is interpreted to effectively explain each theory, and the theories are also analysed against each other, which informs a newly developed interpretative framework for these discussions of change.
The STF uses the word ‘sustainability’ as defined through the Sustainable Development Goals (SDGs) by the United Nations [19], which is one of the most comprehensive and holistic definitions of sustainability, with a good balance of focus on social, environmental, and other aspects. The name Sustainability Transition Framework aspires to capture the framework’s essential features: it is about sustainability (in terms of SDGs) and how to achieve transition to a stronger addressing of SDGs in all areas of human activities, and it is a framework which can be used as a reference to inform and inspire action. However, underpinning the discussion and the establishment of the SDGs is the climate emergency. While the climate emergency is the problem that this article is responding to, the SDGs provide a holistic definition on what such responses should include.
3. Theories of Change
Conceptualising change itself has a long history and has been considered in different areas of study through specific disciplinary lenses. What these conceptualisations share is an assumption that some underlying patterns can be identified, and that these explain phases of development in a broad range of diverse human activities including science, technology, economy, or art styles. The existence of such theories, and their similarities and complementary differences, signals the potential value of high-level considerations of broader patterns. This contextual section provides a brief introduction to a selection of such discussions.
Since at least around the 18th century, a consideration of cycles or phases of development has been a recurring theme in interpretations of historical developments. One influential conceptualisation of this nature tends to be attributed to Johann Joachim Winckelmann (1717–1768) [20,21], and is discussed more in Section 3.5. Winckelmann is generally considered to be one of the earliest authors to develop an interpretation of past art developments within their own cultural and social milieu [22,23]. It can be said that it was at this time of the Age of Enlightenment (17th–18th centuries) that modern conceptualisations of history moved from simple accounts of chronological events to explaining history as a coherent process [24]. Consequently, modern conceptualisations of history started giving greater attention to synergetic connections between ‘scientific, technological and social advancements’ [24]. Such ideas are strongly connected to the German concept of Zeitgeist, or the spirit of the time [21,22,23,24,25], and ideas of connection between a range of factors which influence patterns of change have dominated art and architecture history works since. Although it is possible to trace older sources for the conceptualisation of change through a set of development phases, and Winckelmann includes some such references, it seems that the connection between art and broader social developments helped forge the modern interpretation of the development of style.
Another significant conceptualisation of change was the mid-20th century proposal by Thomas S. Kuhn in The Structure of Scientific Revolutions (1962) that while much of normal scientific development is formed from the incremental evolution of ideas, some periods produce more revolutionary changes in the way science is conceptualised [26]. According to Kuhn, these revolutionary moments respond to anomalies which could not be explained by normal incremental scientific developments, and once a new paradigm of thinking is established, normal science embarks on puzzle-solving, examining the implications of the revolutionary shift [26]. The core contribution of this work is seen to be the notion that there is a ‘structure’, a core pattern which organises components in the way scientific knowledge develops: normal science undertakes incremental puzzle-solving (these could be part of a paradigm or not), but once the puzzle-solving identifies a number of anomalies, the paradigm experiences a crisis, which leads to a revolution and the establishment of a new paradigm [27]. These stages of scientific revolution are primarily focused on the early stage of development of a paradigm shift [27], and fully situated in the consideration of the patterns of how scientific knowledge is created. Although more investigation is needed in this area, some more recent studies suggest that similar patterns can be quantitatively confirmed [28].
Economic theory and forecasting have also been investigating if it is possible to identify patterns in economic growth and downturn. Some economists proposed 50-year patterns of economic growth and decline, but these have proven challenging to fully confirm [29,30,31]. During the 1980s and early 1990s, while responding to the economic slowdown of the 1970s and 1980s, there was a period of renewed interest in theories of this nature [31,32]. Interest in such theories has since continued cycling in and out of research focus [33,34], trying to explain the reasons for such possible patterns. In 1991, Korpinen described economic and technological development as an outcome of the interaction between the ‘techniques, scientific paradigms, policy regimes, organisational principles or artistic styles’ [35]. The proposed core idea was that: ‘[w]hen an old approach is weakening, creative activity is directed to something basically new. After a breakthrough, creativeness concentrates for some time around improvements until the stage of maturity and declining returns is reached’ [35]. Around the same time, other works on economic theory reported on similar general patterns, that technological innovation comes in clusters which are interrelated and stimulate each other and lead to a period of economic growth which is followed by subsequent deceleration [30,31]. However, these studies in economy could not quantitatively confirm a clear pattern, only highlight the periodic nature of economic fluctuation.
Attempting to explain similar forces, in 1994, Thomas Hughes expanded upon his 1960s proposition of ‘technological momentum’ by explaining that the ‘technological’ includes both the technical and the social, and these two shape each other [36]. Further, as the technical systems became large enough, they start to gather momentum, ‘the system became less shaped by and more the shaper of its environment’ and eventually the momentum is so large that it can only be stopped by ‘a historical event of large proportions’ [36]. This conceptualisation of ‘technological momentum’ can be seen as resolving some of the limitations of ‘technological determinism’, which tends to focus on technology as the main driver of change, and ‘social construction’, which emphasises social forces and factors influencing change [36]. In fact, this is just one of the earlier theories examining the dynamic relationship between technology and people. Within a broad range in this area, social practice theory [37,38] and a few other approaches investigate this aspect, but in most part, these fall out of the scope of this article.
Finally, theories such as the three horizons theory in foresight (scenario planning and similar) and transition design look at the development of desirable future change, but also use elements of cycles or stages. The three horizons theory uses the present as the first horizon, transition as the second horizon, and the future as the third horizon, and employs these to support participatory visions for change [39,40,41]. Transition design uses the same components but with an adjusted order, starting with the envisioning of the long-term desired future, and then, through the transition pathway, working backwards to the mid-term vision and present before refining the initial long-term vision [42,43,44]. These theories focus on projecting and forecasting the future change.
While coming from different areas of study, these theories share the core agreements: (1) that developments in a range of human activities are not progressing at an even pace; (2) that some underlying patterns can be identified; and (3) that understanding these patterns can be useful when trying to anticipate the future or understand the change process. The emphasis is on cyclical change; differentiation between slower, incremental change and faster, revolutionary change; and economic and socio-technical forces which influence or reflect on the change. The majority of the reviewed theories use past examples to assert and confirm their validity, although some are specifically focused on developing future change. For the purpose of this article, a balance between well-understood past patterns and foresight is useful.
The following four sections discuss the theories which stand out in part due to the level of their development and articulation, but also in part due to being commonly visually depicted through diagrams.
3.1. Regime Change and Sustainability Transitions
Building on notions of technological regime from the late 1970s [45], researchers in the late 1990s and early 2000s examined the process and necessary preconditions for complex, or simpler, sociotechnical transitions [46,47,48,49,50]. René Kemp was one of the early researchers considering environmental sustainability as a type of technological regime shift, or technological transition [51]. Kemp argued that transition to a more sustainable set of practices will be a gradual and slow process because it requires a significant regime shift, including a change in the technology of production, transport, consumption, pollution control, and reuse systems, and the development of environmentally safer materials and technologies [51], but also that, in order to achieve a regime change, further, more transformative changes are also likely to be needed [51]. However, while change within regimes is constant, changes of regimes are far less frequent and much more comprehensive [47]. This is because a regime change requires changes in a range of policy and regulatory settings [51], but also because of the inseparable nature of the relationship between technology and social practices, routines, patterns of behaviours, or organisations which employ it [46]. Yet, regime change is the level of change needed for successful climate action, because regime dynamics limit what any one individual company or person can do in their effort to affect change [52].
Sustainability transitions, transition management, and related transition theories have since grown into a burgeoning area of study because they offer conceptualisations which help comprehension and, thus, potentially accelerate sustainability transitions [53]. Some authorities, leading the way in climate action, are already using this research to help current practices and policies aimed at accelerating climate action [54], which is why the STF draws substantially from this body of knowledge.
Generally, sociotechnical transitions are seen as an incremental continuous change process which leads to an eventual structural change in the character of society, and does so without a uniform or deterministic pre-design, but rather through the sociotechnical actors negotiating and navigating a range of possible development paths [49]. This is why this body of work sees transitions not as a planned, but as a managed process over a reasonably long period, about one generation, 25–50+ years [45,49]. From this perspective, it can be summarised that transition management tries to understand the process and patterns associated with transition shifts by examining what is supporting or hindering the process [55].
Works on multilevel interpretations of sociotechnical transitions [47,49,50,56] help situate what regime change means. On the macro level, the sociotechnical landscape consists of slowly changing external factors which can influence the regimes both by stabilising and stimulating the need for change [47,50,56]. Regimes are nested into the landscape, while niches, which operate at the micro level, are nested into the regimes [50]. Niche-innovation is where novelty and invention tend to occur, and these can also transition into new regimes [50]. Although the niche tends to be read as the place of innovation, both the niche and the landscape can generate the impetus for regime change [56]. For example, protest calling for action, but without clear solutions, is one instance of a landscape signalling impetus for change, just as the invention of a new technology which solves a particular problem could lead to a rapid change in regime.
One characteristic of sociotechnical transitions is that their path can only be described after the fact, in historical hindsight [46]. This prevents projecting into the future and anticipating the patterns of the transitions which are still to come, because new dimensions of possible developments are continually emerging and could stimulate solutions previously unforeseeable [46]. This presents real challenges when trying to utilise transition management to anticipate, manage, or accelerate needed sustainability transitions. Nevertheless, some patterns which are very valuable have been identified by these works. For this article, especially important are the concepts of transition S-curves and X-curves.
3.1.1. S-Curve
The S-curve (Figure 1) has been used to explain the uptake of new technology since at least the 1960s [51]. It can also be seen as effectively capturing Kurt Lewin’s three stages of change: unfreezing, change, and (re)freezing, articulated in the late 1940s, where each stage has several steps with feedback loops [16]. Conceptually, the S-curve is a useful tool for generalising the shift from one socio-technical regime to another. Sustainability transitions and transition management are adopted from the idea from older theories that sociotechnical transitions do not exhibit linear trends, but rather exponential, or S-curve trends. The S-shape illustrates the initial slow technological development, which ‘advances rapidly for a period, and then slows’ into the stabilisation of a new regime, and this is similar to a learning curve [46]. The S-curve shows the transition from one reasonably stable regime to another reasonably stable regime.
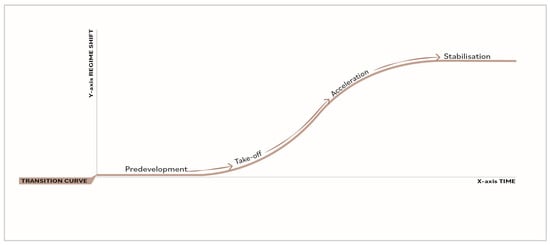
Figure 1.
The transition curve is an S-curve and it shows a slow start of regime change, an increase in the rate of change while the change is taking place, and a slowing down towards the arrival at a newly established regime. This is taking place through four phases of the regime transition pathway: the pre-development phase, take-off, acceleration, and stabilisation into the new regime. (Image co-authors: Boatemaa Amoafo and Emina Kristina Petrović.)
Transition management emphasises the long-term visions and the process aspect of transitions, which is inherently different from any ‘preconceived’ goals or ‘blueprint’ visions with clear, fixed, final goals [47,57]. For this reason, the transition process should be seen as ‘a goal-seeking process’ where the start of the S-curve is known, but a range of possible points, or ‘a basket of images’, signals the area of the possible final transition outcome [47]. This is especially true for sustainability transitions where the goals are uncertain and still to be developed [57].
Commonly, four stages are identified as taking place during the regime change: the pre-development phase, take-off, acceleration, and stabilisation into the new regime [47]. Figure 1 shows this progression. More granulated phases are also in use when considering regime change transitions [58,59].
3.1.2. X-Curve
Another useful conceptualisation from these theories is the X-curve, which has in recent years especially gained both conceptual and empirical popularity [53,60,61,62]. In 2014, Derek Loorbach introduced the X-curve, which consists of two intersecting S-curves, one of which is the already discussed S-curve showing the transition itself (Figure 1), while the other is its mirror image showing the destabilisation and breakdown of the incumbent regime [61,63]. The intersection of the two curves is conceptualised as an explosive and chaotic moment of shift between the two, or a point after which reversal is no longer possible. Originally, Loorbach discussed a set of possible patterns that the progression of the new regime and phasing out of the old could take, with the two symmetrical mirror image S-curves introduced as an ‘ideal typical’ situation of both processes progressing at about equal speed [63]. However, since, this ideal X-curve has been commonly used, leaving the less ideal progressions possibly less examined.
It is also important to note that in this ‘ideal typical’ X-curve, the transition phases have been adjusted compared to the older and more general versions of the S-curve (Figure 1), with experimentation, acceleration, and emergence all appearing before the intersection at the middle, and institutionalisation and stabilisation after. This means that although the intersection is often depicted in the middle of the S-curve, that would correspond to a position reasonably late on the older versions of the S-curve. However, because these curves conceptualise very significant and complex changes, such adjustments are in line with the surrounding theories and probably reflect greater focus being given to some parts of the process, in this case to the progression towards stabilisation of the new regime.
3.2. Diffusion of Innovation
Many of the more recent theories of diffusion or adoption of innovation still use elements of Everett M. Rogers’ 1962 Diffusion of Innovation [64,65]. One of the central ideas that Roger’s theory propounded was that the process of diffusion was not limited by what innovation was disseminated, but rather followed a general process of uptake of a new practice [66]. These core patterns equally apply to diffusion of agricultural innovation, which was the focus of the Rogers’ book [67], and other areas of human activity. Because of this ability to draw universally applicable conclusions and patterns, Diffusion of Innovation quickly became popular both in the US and internationally, offering an explanation of how the macro process, during the diffusion, is linked to the individual or group micro level [67]. In 2003, Rogers explained this to be the result of the theory, allowing a higher-level generalisation which can be applied to specific cases [66]. Diffusion of Innovation was based on Rogers’ Ph.D. research, which reviewed a range of approaches and considered multiple empirical data sets, and in the decades since, he continued collecting new data in this area, and these empirical confirmations probably helped sustain the theory.
Central to Rogers’ concept of diffusion is that innovation on its own is not enough for people to adopt a new practice or technology, but rather that the innovation communicated over time between peers helps the process of adoption [66,68]. Within this process, a particularly critical component is subjective evaluations of the innovation by peers, whose recommendations are trusted more than marketing itself. Because this is essentially a social process, the meaning of an innovation is developed over time through the process of social diffusion, and this process is a kind of social change [66]. Some of the core concepts which are still in use are the bell curve, the S-curve, and the five groups of adopter categories: innovators, early adopters, early majority, late majority, and laggards [66].
Figure 2 displays the adopter categories, with the bell curve showing the increase and decrease in numbers of people in each adopter group as the diffusion process progresses in time. However, total adoption could also be represented by an S-curve, and Rogers provides the overlap of the two curves, with the intersection of the apex of the bell curve and the midpoint of the S-curve [66]. Importantly, those two overlapping curves represent different information on their Y-axis: the level of uptake at any one point of time on the bell curve, and the total uptake to date on the S-curve.
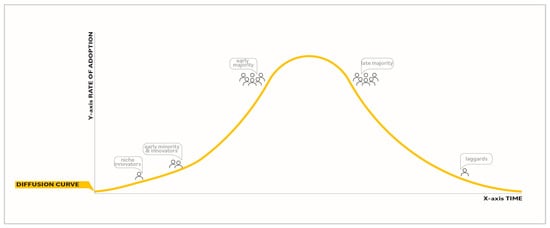
Figure 2.
Diffusion curve based on Rogers’ diffusion of innovation bell curve and showing five groups of adopter categories: innovators, early adopters, early majority, late majority, and laggards. (Image co-authors: Boatemaa Amoafo and Emina Kristina Petrović.)
However, over the years, Rogers’ diffusion theory evolved. One of the refinements was Geoffrey A. Moore’s 1991 introduction of the emphasis on ‘crossing the chasm’ between the early market consisting of innovators and early adopters, which are the first two groups of Rogers’ adopter categories, and the later market [69]. This concept was developed in the firm Regis McKenna, after observing patterns of this nature when disseminating high-tech products [69]. In contrast to Rogers’ ideas, which apply to many contexts equally, the importance of crossing the chasm was situated within the area of high-tech products which were starting to play an increasingly prominent role on the market during the 1980s. Another difference is that Moore approaches dissemination and uptake of new practices from the perspective of marketing, and the focus is on accelerating uptake, consumption of new goods and practices, and what might be preventing that uptake. In other ways, Moore adopts many aspects of Rogers’ theory, and uses the same bell curve, the five groups of adopters, and the focus on diffusion [69].
Another important development upon Rogers’ diffusion curve was the introduction of the tipping point. In mathematical catastrophe theory, the tipping point represents the moment at which growth shows a sudden jump, represented in diagrams as a change in the growth curve [28]. In 2000, Malcolm Gladwell published a book titled Tipping Point: how little things can make a big difference, which, through the example of crime reduction efforts, proposed that there are moments of very accelerated change, and compares these with epidemics [70]. This was later linked with the diffusion theory diagram, leading to a joint conceptualisation of these three theories in Figure 3, with the chasm signalling discontinuity, disruption, and an overall unpredictability at that point.
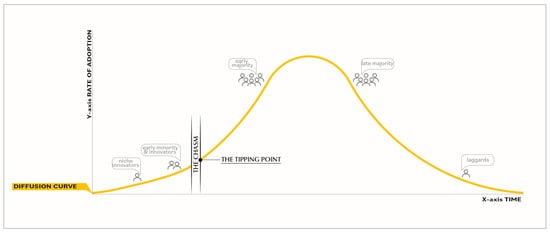
Figure 3.
Diffusion curve including Rogers’ diffusion of innovation bell curve and adopter groups, Moore’s chasm, and the tipping point. (Image co-authors: Boatemaa Amoafo and Emina Kristina Petrović.)
Since the 1970s, accelerated discussion of diffusion often focused on the uptake of new computer or digital systems, as this is where much new innovation was occurring. A series of works examined factors which influence individual processes of making the decision to adopt a particular new technology, leading to a series of technology acceptance models (TAM) [71,72,73,74,75,76]. In contrast to Rogers’ focus on adoption by the group, TAM tries to explain individual processes, and over time, TAM became increasingly complex [74,75]. Other new theories emerged in this space during the late 20th and early 21st centuries. An example is Gartner’s hype cycle, formulated by the employees of the business and technology analytics firm Gartner [77], which aims to describe the overenthusiasm when the emergence of a new technology is announced, which is generally followed by disillusionment before a more balanced response [77]. This theory still lacks clear empirical confirmation [78]. This review of diffusion theories shows that there is a range of existing theories in this area, which reasonably well complement one another, with simpler and group approaches being empirically better substantiated.
3.3. Organisational Change Curve
In the last couple of decades, there has been a real increase in the consideration of emotional responses of employees, and other change recipients, to organisational change [79]. In part, this growth might be reflective of the consistent development of methods to study how to support the deployment of new digital technologies, which has been growing since the 1980s [72,80]. In other ways, this can be seen as an extension of the efforts since the late 1940s to consider a range of group factors influencing individual behaviours during the change process, and the development of participatory management in an effort to reduce resistance to change [16,81]. The result of these works is the development of the change curve.
The change curve is based on the stages of grief proposed by Elisabeth Kübler-Ross in 1969 [82]. The work of Kübler-Ross was very influential on the way death, dying, and grief are considered in the US and beyond, although the concept of the stages of grief has been debated for a long time, with passionate views from both sides [83,84,85,86,87]. According to this work, the five stages of grief consist of denial, anger, bargaining, depression, and acceptance, which are common but not experienced by all people, nor in a particular order. The main criticism of this theory is its limited empirical confirmation. In 2007, the Journal of American Medical Association published an article presenting an empirical study in support of the theory, which was followed by a heated debate [88,89,90,91,92]. However, the theory is still defended as enabling people to make sense of the events and emotions surrounding loss [84], and is discussed in many current American textbooks [85]. Possibly, this enduring popularity, despite repeated criticisms, links with simplicity bias, which was discussed earlier as a helpful component of sensemaking, and sensemaking is especially important at the time of grieving stress.
Shortly after the publication of the five stages of grief, the theory started to be applied to other contexts. For example, in 1976, John D. Adams, John Hayes, and Barrie Hopson proposed a set of stages to offer readers the means for self-management and control of a range of personal and professional experiences around transition, such as ‘culture shock, geographical transitions, bereavement, redundancy, job change, marital separation, and major changes in lifestyle’ [93].
Since then, the Kübler-Ross grief stages have been applied in a range of settings. When examining the emotional response to change in school and community college settings, two studies found the Kübler-Ross grief stages applicable and useful [94,95]. The Kübler-Ross stages of grief were used in an attempt to understand resistance from health-care professionals when facing a health-care reform [96]. They were also used when examining the emotional response of leaders of energy companies when phasing out nuclear electricity generation in Germany [97]. The five stages of grief have also already been directly associated with emotional responses to climate change [98]. And, generally, grief and anxiety have been considered in relation to climate change, because such feelings can inspire action but also trigger defences that might immobilise individuals from any action [99].
The reason why the Kübler-Ross grief stages can be effective in such a broad range of examples is that in all these settings there is sense of loss associated with change. Essentially, regardless of how positive a particular change is, the change itself triggers a sense of loss and, consequently, grief [16,94]. Further to that, in organisational settings, the grief stages offer a missing piece, because this framework allows the considerations to move from the assumption that people are fully rational in the workplace to acknowledging natural emotional responses from involved individuals [95].
However, the change curve and the Kübler-Ross grief stages are not identical. Also, the clearly defined progression through the change curve prevents some of the core flexibility of the Kübler-Ross theory. To an extent, this is because the change curve is mapping a group response to change, while the Kübler-Ross grief stages are aimed at mapping individual responses. This is possibly also why empirical confirmations of the change curve are more readily available [80,82,94], as opposed to the ongoing debate about the empirical accuracy of the Kübler-Ross grief stages. Nevertheless, there is still limited consistency in the terminology to describe stages on the change curve, which could be contributing to these empirical findings.
For the purposes of this article, Figure 4 shows the change curve starting with the denial of many in an organisation where change is needed, moving to anger and depression as it becomes clear that the change in inevitable, before the uplift towards experimentation, decision, and integration.
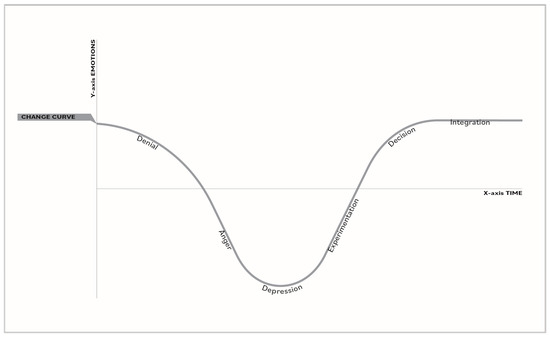
Figure 4.
Change curve showing the progression of the emotional response of the change recipient groups during organisational change. (Image co-authors: Boatemaa Amoafo and Emina Kristina Petrović.)
3.4. Style Cycle
As noted at the start of this review, Winckelmann can be seen as providing one of the earliest conceptualisations of art developing through a series of stylistic phases which form a cyclical pattern similar to a wave. In the History of art of antiquity (1764), Winckelmann discussed the four stylistic periods or stages of development of ancient Greek art: ancient style, grand or high style, beautiful style, and decline into imitation to a fall or as ‘origin, growth, change and fall’ [100]. Winckelmann explains that similar patterns can be found in poetry in five stages of progression: ‘beginning, development, plateau, waning, and end’ [100]. Following naturalistic references, this has since often been simplified to three core periods: early, mature, and late [21,22,23]. Variations of this system have since remained reasonably popular in both art and architecture, possibly because Winckelmann used a mixture of art and architecture, and ancient and contemporary examples, when explaining [101]. Other scholars have already noted that Winckelmann appears to aspire to identify universal patterns when discussing these examples [20,23]. This is normal for the Age of Enlightenment when he was working, as was the nature of casual mixing of the examples in the text and the assumption that the reader shares his view [100], and thus, conveys a level of normalisation of these views. Taking these ideas further, the triad of renaissance, mannerism, and baroque, or the triad of early modernism, normative modernism, and postmodernism, could be seen as reflective of the same general patterns.
At times, Winckelmann’s stages of art development have been considered as reflective of biological growth in general: childhood, adulthood, and elderhood of an organism, being expressed in the way early, mature, and late stages of development are considered [101]. This could be seen as reflective of evolution, but the concept of evolution in the 18th century, well before Darwin’s theory of evolution, would have been reflective of the older Latin verb describing the movement of the unrolling of a papyrus scroll [101]. Unfortunately, Winckelmann’s stages share the same general limitation as regime transition considerations, that it is really challenging to accurately interpret events without adequate historical distance.
If visually represented, this set of 3–5 stylistic phases could be summarised as in Figure 5, as a bell curve showing the upward development, plateau, and decline, where almost any number of actual phases can be discerned. Figure 5 illustrates this by using illustrations of archaic, classical, and Hellenistic Greek sculpture.
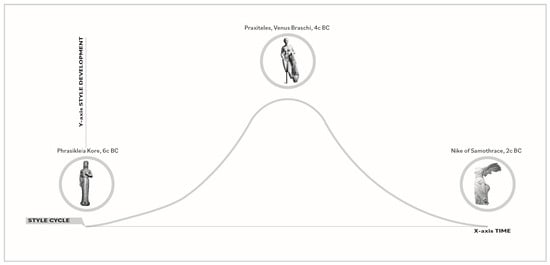
Figure 5.
Style cycle based on Winckelmann and illustrated by a progression from the archaic, to classical and Hellenistic, Greek sculpture. (Image co-authors: Boatemaa Amoafo and Emina Kristina Petrović.)
Examples of recent considerations of historical patterns, as part of the search for an explanation of contemporary architectural and art responses to the environmental crisis, can be seen as following aspects of the aforementioned tradition of seeking universality to explain the present and future [102]. Unfortunately, this could also be reflective of the longstanding tradition in design and architecture to develop new ideas based on precedents, which has been criticised as potentially giving these disciplines some traditional overtones and inhibiting thinking outside existing regimes [44]. For architecture, this might be especially strongly pronounced because, as the discipline of making shelters, architecture developed over the centuries through experiential understanding of which solutions worked and which failed.
In contrast to these concerns about traditional outlook, architectural texts and practices have a long tradition of placing high interest on the moments of arrival of new styles [101]. Because of this dichotomy of working with tradition yet celebrating the new, both the upward and the downward parts of the style cycle are deeply embedded in how architecture conceptualises change. In fact, with the long tradition of architecture thinking about change through style cycles which succeed each other, this pattern could be conceptualised as a K-curve, or a series of up and down waves.
This discussion about stylistic change in art and architecture also comes close to one of the core issues when considering climate action in the architecture and built environment disciplines: the relative ‘invisibility’ of what needs to be changed. If architecture is understood as applied art, then ‘form making’ is its central activity, and visibility is essential for any architectural desirability. Yet, for a long time, sustainability and climate action have been discussed in architecture with no apparent bearing on the form. Rather, these were primarily discussed as the quantitative and performance issues, at times even removed from that which architects would design and hand over to engineers and other technical experts. In order to achieve accelerated progress, giving form to a pro-sustainable architectural vision might be essential. Unfortunately, the currently limited scholarship in this area indicates some real challenges. We are starting to see strong indications that, on one hand, the general public is actually more interested in building aesthetic features than energy efficiency [103], and on the other, that design professions are starting to respond by developing architectural stylistic responses which visually read as doing something about climate action but are not necessarily performing in that way [102]. Following the long tradition of the stylistic ‘-ism’ in architecture, Peña and Cucuzzella propose that we could call this ‘sustainabilism’ [102].
3.5. Summarising Theories of Change
Summarising this review of a set of theories about change, it is possible to see some shared trends. Simple and clear theories have lasted in use for a long time, at times even despite repeated criticism of oversimplification. This reinforces the notion of simplicity bias mentioned in the introduction above. Also, theories applied to groups and higher-level interpretations of change appear to have received less criticism, and even some empirical confirmation, compared with theories which focused on individuals. This certainly reflects the reality that true individual variability is most clearly seen when studying individual responses; however, it is possible that some aspects of social normalisation also impact the higher cohesion found in group responses.
Although there are some similarities between these theories, such as the use of the same type of curves or similar ideas, fundamentally, the four key theories do not overlap, but rather provide insight on different, but equally relevant, aspects of change. However, the similarities allow for a level of mutual comparability. Therefore, it is possible to bring them together into one integrated model.
4. Integration of the Different Models into the Sustainability Transition Framework (STF)
Figure 6 shows the Sustainability Transition Framework (STF) and all the discussed theories in one diagram, which visually communicates how they interrelate. For each of the curves in the diagram, the X-axis represents time, while, conceptually, the Y-axis represents a completely different measure for each of the curves (Figure 1, Figure 2, Figure 3, Figure 4 and Figure 5). For the transition curve, the Y-axis signals the rate of change from one regime to another and the four phases of the transition pathway (Figure 1). In order for that change to happen, many people need to adopt new practices, and the diffusion curve shows how, over the same period of time, a progression needs to happen, from innovators and early minority adopters to early majority and late majority, and eventually, even the laggard will be adopting the change as the regime transition enters into the stabilisation phase (Figure 2 and Figure 3). For this curve, the Y-axis signals how many people are adopting a certain innovation at any a given moment of time throughout the transition. The change curve traces the group emotional response to the change, and the Y-axis expresses how positive or negative the group emotions are likely to be throughout the transition (Figure 4). And finally, the style cycle captures a move from an early, to high, to late style, with the Y-axis representing how developed, popular, and therefore established, a particular style is at the time (Figure 5).
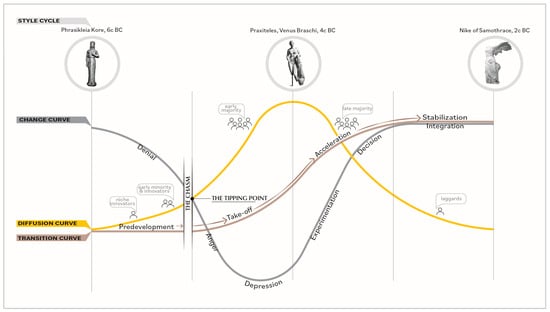
Figure 6.
Sustainability Transition Framework (STF): showing four theories of change integrated into one holistic diagram. (Image co-authors: Boatemaa Amoafo and Emina Kristina Petrović.)
Reading the diagram through the interrelationships between these four curves over four phases shows more clearly some of the interactions between theories which are brought together into the STF:
- Stage 1: In the predevelopment stages of regime transition, technological innovation and very early stages of adoption are the focus, because the majority in society are still in denial that a regime change is about to happen. Early style starts to develop at the same time, and generally this is the point of emergence of the ‘new world’.
- Stage 2: As the system arrives at the tipping point, the regime transition moves to a take-off, with the early majority starting to adopt the new practices, while those who were in denial descend into anger and depression as the momentum of change starts to accelerate. The style is articulated during this phase and starts to arrive towards its highest point.
- Stage 3: With the regime change progressing to acceleration, the late majority are joining in the adoption of the change, and emotional responses are improving through an emphasis on experimentation and decision. The style is clearly articulated but starts to develop some eclectic features.
- Stage 4: The regime transition is arriving at stabilisation, and the emotions at integration. Laggards are still adopting the change and style is progressing into an eclectic decadence. This sets the scene for regime stability until the next change phase.
Returning to the importance of sensemaking throughout the change process, the STF diagram also explains why, at the time when the tipping point is being approached for a positive change and many are supportive of it, anger could lead those who have just moved away from denial to actively protest against the change. Seen in this way, such protests could be understood as a positive signal that the change is truly starting to gain momentum.
Theoretically, the STF cycle can be seen as continually repeating for a range of different changes, such as changes in transport, diets, energy use at home, or how buildings are built more efficiently. Some of these changes will be faster or slower, and therefore visually more compressed or stretched, but also might have started earlier/later. Similarly, some of these changes will be more intense, expanded on the Y-axis, or very subtle, constricted on the Y-axis. In fact, in reality, there would be a set of STF cycles overlapping and taking place at the same time. In addition, the STF can equally be used to look backwards and map out past transitions, and to look forwards and prepare for the transition stages still to come.
4.1. Possible uses of the Sustainability Transition Framework (STF)
One of the benefits of the STF diagram is that we can see ourselves in it both as individuals and as part of a society. In the contemporary consideration of climate action, most of us are at the same time going through more than one change cycle as members of society and as individuals. As individuals, for some of those areas, we might be more progressive compared to the society around us, while for others, we might be lagging, and there might be real reasons for both. The hope is that, by rationally seeing these in the STF diagram, it becomes easier to recognise the likely context and to use that either to stimulate better progress or to understand delays which are impossible to address on the individual level. The same can be said for society at large: by using the STF diagram, it is possible to see what currently needs focus in any one specific area for acceleration to happen—in some areas, that is a need for more innovation; in others, that is a need for regulative action.
The simplest possible application of the STF is that any one of us can simply analyse aspects of our own life and actions against the STF and see what we can improve. This self-reflection can enhance awareness of ourselves, but also of others who might be, at the same time, at a different point of the STF. This ability to see others for having the right to their own views can enhance the sense of empathy and collaboration. This is why the STF could also be used in a group setting, similarly to the way the change curve and X-curve have been used, to help a group envision collective future action, and it might be very effective. The methodology for this is still to be developed.
However, the most impactful potential application of the STF is that it can also be used to look at various dimensions of a transition which are not necessarily synchronised, nor apparently related, to gain a better high-level understanding of the transition at a macro level.
Importantly, because the STF can help us look at change at an individual, group, and macro level, it can be described as a multilevel framework. But also, because the STF can equally be used to examine past transitions and to forecast the future, it effectively works across timescales. This high level of generalisability signals that further applications could be identified.
However, if following the patterns exhibited by the other reviewed theories, similar to the change curve and diffusion theory, the STF is more likely to have empirical validity if applied to groups and other higher-level settings than when applied to individuals. A high-level simplicity of the STF is unlikely to be something that can be empirically confirmed on an individual level because it is probably too simple to accurately capture the diversity of human differences and free choices. Nevertheless, it could be helpful for an individual navigating personal climate action in a similar way that the Kübler-Ross grief stages help those grieving.
4.2. Sustainability Transition Framework (STF) and the X-Curve
As discussed, sustainability transitions, in addition to the S-curve, also use the X-curve (Section 3.1.2.). Figure 6 of the STF does not include an ‘ideal typical’ X-curve with a symmetrical intersection of the two S-curves in the middle of the diagram. This is because there are two X-curve types of intersect, demarking what can be interpreted as the start and end of the period during which the X-curve intersect would take place for different dimensions of the STF and the particular transition. The first intersect is when the change curve intersects with the other three curves at the tipping point, and this is the point when emotional reaction tips as other aspects of the transition gain momentum, and that starts the destabilisation of practices associated with the incumbent regime. This is when shared perception of the stability of the regime undergoes a crisis and starts to break, which is why it is signalled as the tipping point for the whole regime, although much more needs to happen before this change is completed. The second intersect is when the acceleration phase of the transition curve intersects with the late majority adopting the innovation, and the change curve moving into the decision stage. This is the latest point at which the regime transition would tip the governance structures and systems to support the new regime as an emerging incumbent regime, and this would be especially the case for grass-root transitions, which might achieve much change before being formally included in the regulations. Between these two points would be a series of other tipping points, depending upon the nature and needs of the particular change, especially how much it is driven top-down vs. bottom-up.
By proposing a range within which a series of X-curve type intersections occur, this conceptualisation might be able to address two weaknesses of the X-curve. First, in 2022, Hebinck et al. reported that when using the X-curve to facilitate group envisioning of transitions, challenges appeared when discussing the notions of ‘chaos, destabilisation and breakdown’ [61]. By contrast, for this aspect, the STF uses the change curve, which has already been effective when dealing with organisational change. Second, in 2023, the EU Commission reported on the application of the X-curve to envision transition pathways for the EU [62]. Reported outcomes include a complex mix of a range of considerations challenging to read using the X-curve, but similar considerations would have been given separate paths in the STF, making these easier to follow. While the STF currently has no empirical data, nor a clear path for consideration of governance of transitions, it seems that it might be able resolve some of these challenges and provide a useful new tool when envisioning sustainability transitions.
5. Discussion of the Sustainability Transition Framework (STF)
When discussing the challenges for the acceleration of sustainability transitions in 2020, Markard et al. established, based on a range of parameters, that currently, we are facing the emergence and acceleration phases, depending on which aspects of transition are considered [53]. This is because, while some facets of climate solution are already on the market and are progressing well into the early majority adoption, like solar electricity generation and electric vehicles, other solutions are still to be developed [53]. Applying the STF to the example of accelerated uptake of electric vehicles, and some regime adjustments in that space, a range of protests by truckers and diesel and petrol vehicle users which have taken place in the last couple of years in different countries can be seen as an expression of their descent into anger [104,105,106]. Admittedly, these protests generally rebelled against more than just one issue, but one contributing factor was related to the upswing in uptake of electric vehicles or the adjustment to regulations to support that change. Such protests can also be seen as what Geels calls ‘regime stability as the outcome of active resistance by incumbent actors’ [107]. Therefore, the uptake of electric vehicles illustrates well a transition which is going through the unpredictable complexities of the chasm and the tipping point, and the dimensions of the STF assist the sensemaking of this phase of transition.
An even more explicit and faster shift through the chasm and the tipping point playing out in recent years could be the Black Lives Matter movement. Starting as the George Floyd protest late in May 2020, by early July, it was already possibly the largest movement in US history, with suggestions that by then, about 15–26 million people were participating [108]. Before long, similar protests were taking place in other countries [109]. However, along with the massive uptake of this positive change, anger followed from those who were in denial, and this was voiced as another set of protests. This suggests that when approaching the tipping point of any transition, anger and resistance to change should be anticipated, but also that once a transition has arrived to the chasm and the tipping point, it can trigger extremely fast changes, and this is the aspiration with climate action.
However, for many areas of climate action, we are not close to the chasm and the tipping point, but rather in a range of pre-development stages. That is where we still need more innovation to emerge, more consensus building, and very early adoption modelling possible solutions [58,59]. This means that for activities which are in this pre-development phase, frustration that regulations are not yet being changed is not helpful, because a widespread agreement that such a change is required is first needed [58,59], and such stages are important to complete before a more significant take-off or acceleration can be possible [58]. By using the STF to aid this evaluation, it is also possible to see the importance of building and supporting emotional resilience of the minority who see the need for change and who are surrounded by the majority in denial. It also shows that generating a shared vision and tested innovation can help transition through the chasm, because during the pre-development stages, the transition should arrive to the point when the early majority can start consuming the innovation and many are starting to accept it as an effective solution to the particular climate problem. Until those conditions are met, the efforts should primarily focus on meeting them. At the same time, the high-level perspective of the STF allows for anticipation of the future stages of the transition and it is possible to start making decisions and preliminary preparations for elements which are likely to help acceleration later. This enables simultaneous action on a multiplicity of levels towards sustainability transition.
The STF diagram and discussions in this article also explain that it is not that the change is not happening, but rather that the change is needed in a number of areas at the same time, and that, in total, it is a very substantive change of the kind that takes a very long time. Although, within a regime, change is taking place continually, this is taking place along reasonably predetermined directions or pathways, because these are constrained by the technological and institutional context [110]. That is why, as noted in Section 3.2, regime changes take at least 25–50 years, or at least one generation. Other reviews of significant changes of common practices suggest this might take even longer [111]. The key is to persist in assembling elements which are needed for preconditions for accelerated change, so that the chasm and the tipping point can arrive sooner and take a faster form.
Implications for Architecture and the Built Environment
This paper opened with an acknowledgement of limited success of the half-century of effort to make architecture and the built environment more sustainable. The question is whether the STF helps explain this situation.
The energy crises of the early 1970s stimulated an awareness of the importance of energy conservation, and, for buildings, that meant reductions in the energy needed to operate them, especially regarding the indoor heating and cooling requirements. In the 1950s and 1960s, modern buildings were built without a real consideration of insulation and other operational energy loads. One of many striking examples of this is the Eero Saarinen complex of buildings for IBM, containing a manufacturing and administrative centre, which was built between 1956 and 1958 in Rochester, Minnesota, US [112,113]. The building is celebrated for achieving a high level of success in articulating the identity of IBM, yet the façade was built by alternating glass and blue enamel panels made out of a sandwich of two sheets of aluminium with an asbestos-cement core, totalling 7.6 cm in thickness and costing a celebrated low USD $4 per square foot of the wall surface [112]. In addition, many spaces were intentionally set without access to the façade, with the assertion that florescent lighting and modern ventilation would be equally effective [113]. Unfortunately, in the four-season climate of Minnesota, this façade solution thermally significantly underperformed, and the complex required much operational energy for both heating and lighting.
The operational energy wastefulness of the IBM building complex would be unimaginable for newly built buildings nowadays and shows the progress of this particular transition. Since the 1970s, many countries have introduced building regulations which insist on insulating building envelopes. The efficiency of heating, lighting, and ventilation has also greatly improved. Preferencing of the daylight over artificial light is also common. Therefore, it could be asserted that the transition curve for the operational energy efficiency of buildings is possibly nearing its stabilisation phase. The popular acceptance that all buildings should be insulated supports this, even if some of the applications might still be lagging, like retrofitting older buildings. However, this is a general trend, with different countries or individuals being in a range of different actual positions within their individual transitions.
Energy efficiency is just one important transition which has faced the sustainability efforts since the 1970s, and the majority of the other dimensions are currently less progressed. For example, presently there is an increase in the development of necessary knowledge to better understand the impacts of building materials and embed that into practices. Broadly speaking, that could be seen in the pre-development or take-off stages, because some aspects are significantly more progressed, like consideration of embodied carbon, while others are far less developed, like considerations of toxicity and pollution from building materials.
However, of particular concern might be the current absence of a clear stylistic response to climate action efforts, indicating that this change is still in the fairly early innovation stages. Similarly, the denial that climate action will change architectural style is still felt in the profession. The STF shows that this is unlikely to remain unchanged for much longer.
6. Conclusions
This article has introduced the Sustainability Transition Framework (STF), which is simple enough to follow, yet effective in acknowledging much of the relevant complexities that the world is currently experiencing when facing the necessity of climate action.
The STF was developed with the primary goal to help accelerate sustainability transition. The key features of the STF are its simplicity and effectiveness in aiding understanding of the complexities associated with climate action. The STF presents one of the most comprehensive integrations of currently available knowledge on how change happens, and understanding change can help with accelerating climate action. The STF also helps understand individual or social group experiences and enables empathy and social cohesion when dealing with a range of views on the same issue.
The STF offers a clear, high-level summary of some of the main complexities when facing any significant regime change. It brings together different and complementary perspectives to enrich the sensemaking of sustainability transition. The framework offers an explanation of how the innovation, uptake of innovation, regime structures, stylistic expression, and the emotional responses to these interrelate. Although the STF uses a particular simplifying lens, and theoretically further refinement is possible, the achieved simplicity helps sensemaking. It allows readers to grasp the interrelatedness of a range of threads which are part of sustainability transition. By seeing these clearly, the readers are in a better position to articulate which action is most appropriate, and for some, this could be an antidote to climate anxiety.
Although the simplicity captured in the STF diagram, and the simplicity of the theories which dominate this article, are clearly valuable, the same simplicity is also a limitation of the STF. Throughout this article, there are a number of opportunities for undesirable oversimplifications. Further to that, the majority of the readership of this framework will not be especially familiar with most of the considered theories, which could lead to partial understanding or misunderstanding of the discussion, or further simplifications. While the aspiration is to address these in the future, this work asserts that such transgressions into other disciplines considering related phenomena are necessary if we are to truly articulate how to respond to complex problems like climate action.
This article proposed the STF from a reasonably observational perspective, introducing a set of theories and explaining how those could be seen as interrelated, despite being developed in separate disciplines. Future work could explore how the STF performs when used to interpret historical examples, and empirically to help individual or group participatory envisioning of future transitions. Also, because, at its centre, the STF is about aiding sensemaking, evaluating its effectiveness in sensemaking is one of the important dimensions to be still explored more fully.
Finally, the way in which the STF deals with complexities of the needed changes and aids simplicity and sensemaking could prove to be invaluable when facing the urgent need for accelerated climate action. The STF can help understand the past better, and articulate clearer foresight of the future, while empowering action in the present. Through an improved understanding of the sustainability transitions, the STF empowers climate action.
Funding
This research was internally funded by the SHEADI Faculty Strategic Research Grant no. 10115, and the FoADI Research Support 400025, Te Herenga Waka—Victoria University of Wellington, New Zealand.
Institutional Review Board Statement
Not applicable.
Informed Consent Statement
Not applicable.
Data Availability Statement
Data are contained within the article.
Acknowledgments
I acknowledge assistance of Boatemaa Amoafo with preparations of illustrations, Asmae Rashidi Mohammadi with the early literature sourcing, and Dermott McMeel, who provided input on the early versions, and reviewers of this paper for useful suggestions.
Conflicts of Interest
The author declares no conflicts of interest.
References
- IPCC. Climate Change 2023: Synthesis Report; A report of the Intergovernmental Panel on Climate Change. Contribution of working groups I, II, and II to the Sixth Assessment Report of the Intergovernmental Panel on Climate Change; Core Writing Team, Lee, H., Romero, J., Eds.; IPCC: Geneva, Switzerland, 2023. [Google Scholar]
- Piguet, E. Linking climate change, environmental degradation, and migration: An update after 10 years. WIREs Clim. Chang. 2021, 13, e746. [Google Scholar] [CrossRef]
- Marlon, J.R.; Wang, X.; Mildenberger, M.; Bergquist, P.; Swain, S.; Hayhoe, K.; Howe, P.D.; Maibach, E.; Leiserowitz, A. Hot dry days increase perceived experience with global warming. Glob. Environ. Chang. 2021, 68, 102247. [Google Scholar] [CrossRef]
- Ogunbode, C.A.; Doran, R.; Böhm, G. Exposure to the IPCC special report on 1.5 °C global warming is linked to perceived threat and increased concern about climate change. Clim. Chang. 2020, 158, 361–375. [Google Scholar] [CrossRef]
- Gustafson, A.; Ballew, M.T.; Goldberg, M.H.; Cutler, M.J.; Rosenthal, S.A.; Leiserowitz, A. Personal stories can shift climate change beliefs and risk perceptions: The mediating role of emotion. Commun. Rep. 2020, 33, 121–135. [Google Scholar] [CrossRef]
- Ballew, M.T.; Leiserowitz, A.; Roser-Renouf, C.; Rosenthal, S.A.; Kotcher, J.E.; Marlon, J.R.; Lyon, E.; Goldberg, M.H.; Maibach, E.W. Climate change in the American mind: Data, tools and trends. Environment 2019, 61, 4–18. [Google Scholar] [CrossRef]
- Hickman, C.; Marks, E.; Pihkala, P.; Clayton, S.; Lewandowski, R.E.; Mayall, E.E.; Wray, B.; Mellor, C.; van Susteren, L. Climate anxiety in children and young people and their beliefs about government responses to climate change: A global survey. Lancet Planet. Health 2021, 5, e863–e873. [Google Scholar] [CrossRef]
- Wray, B.; Veidis, E.M.; Flores, E.C.; Phillips, A.A.; Alani, O.; Barry, M. A Call to Action for Gender Equity in Climate Leadership. Am. J. Trop. Med. Hyg. 2023, 108, 1088–1092. [Google Scholar] [CrossRef]
- Vale, B.; Vale, R.J.D. The Autonomous House: Design and Planning for Self-Sufficiency; Thames and Hudson: London, UK, 1975. [Google Scholar]
- Brown, A.; Gee, S. An evolution of sustainable house construction technologies. In Sustainability and Toxicity of Building Materials: Manufacture, Use and Disposal Stages; Petrović, E.K., Gjerde, M., Chicca, F., Marriage, G., Eds.; Elsevier, Woodhead Publishing: Sawston, UK, 2024. [Google Scholar]
- Oberle, B.; Bringezu, S.; Hatfield-Dodds, S.; Hellweg, S.; Schandl, H.; Clement, J. Global Resource Outlook 2019: Natural Resources for the Future We Want; UN Environment Programme and International Resource Panel: Paris, France, 2019; Available online: https://www.resourcepanel.org/reports/global-resources-outlook (accessed on 10 May 2023).
- Plank, B.; Streeck, J.; Virág, D.; Krausmann, F.; Haberl, H.; Wiedenhofer, D. From resource extraction to manufacturing and construction: Flows of stock-building materials in 177 countries from 1900 to 2016. Resour. Conserv. Recycl. 2022, 179, 106122. [Google Scholar] [CrossRef]
- Ho, M.K.; Abel, D.; Griffiths, T.L.; Littman, M.L. The value of abstraction. Curr. Opin. Behav. Sci. 2019, 29, 111–116. [Google Scholar] [CrossRef]
- Feldman, J. The simplicity principle in perception and cognition. Wiley Interdiscip. Rev. Cogn. Sci. 2016, 7, 330–340. [Google Scholar] [CrossRef]
- Charter, N.; Vitányi, P. Simplicity: A unifying principle in cognitive science? Trends Cogn. Sci. 2003, 7, 19–22. [Google Scholar] [CrossRef] [PubMed]
- Belschak, F.; Jacobs, G. The role of time in organizational change. In The Psychology of Organizational Change: Viewing Change from the Employee’s Perspective; Oreg, S., Michel, A., By, R.T., Eds.; Cambridge University Press: Cambridge, UK, 2023; pp. 42–66. [Google Scholar]
- Maitlis, S.; Sonenshein, S. Sensemaking in crisis and change: Inspiration and insights from Weick (1988). J. Manag. Stud. 2010, 47, 551–580. [Google Scholar] [CrossRef]
- Gioia, D.A.; Chittipeddi, K. Sensemaking and sensegiving in strategic change initiation. Strateg. Manag. J. 1991, 12, 433–448. [Google Scholar] [CrossRef]
- United Nations: Sustainable Development Goals (SDGs). Available online: Sdgs.un.org (accessed on 15 November 2023).
- Harloe, K. Winckelmann and the Invention of Antiquity: History and Aesthetics in the Age of Alterrumswissenschaft; Oxford Scholarship Online: Oxford, UK, 2013. [Google Scholar]
- Hvattum, M. Zeitgeist, style, and stimmung: Historiography of architecture. In The Companions to the History of Architecture; Mallgrave, F.H., van Eck, C., de Jong, S., Eds.; Volume II: Eighteenth-Century Architecture; Wiley Blackwell: Chichester, UK, 2017; pp. 691–714. [Google Scholar]
- Carter, D. Introduction. In Johann Joachim Winckelmann, Johann Joachim Winckelmann on Art, Architecture, and Archaeology; Boydell & Brewer, Camden House: Rochester, NY, USA, 2013; pp. 1–28. [Google Scholar][Green Version]
- Potts, A. Introduction. In Johann Joachim Winckelmann, History of the Art of Antiquity; Getty Publications: Los Angeles, CA, USA, 2006; pp. 1–53. [Google Scholar][Green Version]
- Iggers, G.G.; Wang, Q.E.; Mukherjee, S. A Global History of Modern Historiography; Taylor & Francis: Abingdon, UK, 2016. [Google Scholar][Green Version]
- Payne, A. Wölfflin, architecture and the problem of Stilwandlung. J. Art Hist. 2012, 7, 1–20. [Google Scholar][Green Version]
- Kuhn, T.S. The Structure of Scientific Revolutions: 50th Anniversary Edition, 4th ed.; Originally published in 1962; The University of Chicago Press: Chicago, IL, USA; London, UK, 2012. [Google Scholar][Green Version]
- Hacking, I. Introduction Essay. In The Structure of Scientific Revolutions: 50th Anniversary Edition, 4th ed.; Kuhn, T.S., Ed.; First published in 1962; The University of Chicago Press: Chicago, IL, USA; London, UK, 2012; pp. vii–xivi. [Google Scholar][Green Version]
- Cunningham, S.W.; Kwakkel, J.H. Tipping points in science: A catastrophe model of scientific change. J. Eng. Technol. Manag. 2014, 32, 185–205. [Google Scholar] [CrossRef]
- Kleinknecht, A. Are there Schumpeterian waves of innovations? Camb. J. Econ. 1990, 14, 81–92. [Google Scholar] [CrossRef]
- Nakicenovic, N. Dynamics of change and long waves. In Life Cycles and Long Waves; Papers Presented at a Work Workshop in 1987; Vasko, T., Ayres, R., Fontivieille, L., Eds.; Springer: Berlin/Heidelberg, Germany, 1990; pp. 147–192. [Google Scholar]
- Mansfield, E. Long waves and technological innovation. Am. Econ. Rev. 1983, 73, 141–145. [Google Scholar]
- Vasko, T.; Ayres, R.; Fontivieille, L. (Eds.) Life Cycles and Long Waves; Papers Presented at a Work Workshop in 1987; Springer: Berlin/Heidelberg, Germany, 1990. [Google Scholar]
- Göransson, B.; Söderberg, J. Long waves and information technologies—On the transition towards the information society. Technovation 2005, 25, 203–211. [Google Scholar] [CrossRef]
- Linstone, H.A.; Devezas, T. Technological innovation and the long wave theory revisited. Technol. Forecast. Soc. Chang. 2012, 79, 414–416. [Google Scholar] [CrossRef]
- Korpinen, P. Long cycles and the development of style: Painting in the 19th and 20th centuries. World Futures J. Gen. Evol. 1991, 31, 35–46. [Google Scholar] [CrossRef]
- Hughes, T.P. Technological momentum. In Does Technology Drive History? The Dilemma of Technological Determinism; Smith, M.R., Marx, L., Eds.; MIT Press: Cambridge, MA, USA, 1994; pp. 101–113. [Google Scholar]
- Shove, E.; Walker, G. CAUTION! Transitions ahead: Politics, practice, and sustainable transition management. Environ. Plan. A 2007, 39, 763–770. [Google Scholar] [CrossRef]
- Shove, E. Connecting Practices: Large Topics in Society and Social Theory; Taylor & Francis Group: Abingdon, UK, 2022. [Google Scholar]
- Sharpe, B.; Hodgson, A.; Leicester, G.; Lyon, A.; Fazey, I. Three horizons: A pathways practice for transformation. Ecol. Soc. 2016, 21, 47. [Google Scholar] [CrossRef]
- Sharpe, B. Three horizons and working with change. APF Compass 2014, 6–8. [Google Scholar]
- International Training Centre (ITC). Three Horizons Framework; Foresight Toolkit. Available online: https://training.itcilo.org/delta/Foresight/3-Horizons.pdf (accessed on 15 December 2023).
- Irwin, T. The emerging transition design approach. In Design Research Society 2018: Catalyst; University of Limerick: Limerick, Ireland, 2018. [Google Scholar]
- Kossoff, G.; Tonkinwise, C.; Irwin, T. Transition design: The importance of everyday life and lifestyles as a leverage point for sustainability transitions. In Proceedings of the 6th International Sustainability Transitions Conference, Brighton, UK, 25–28 August 2015. [Google Scholar]
- Tonkinwise, C. Some theories of change behind and within transition designing. In Strategic Thinking, Design and the Theory of Change; Simeone, L., Drabble, D., Morelli, N., de Götzen, A., Eds.; Edward Elgar Publishing Ltd.: Cheltenham, UK, 2023; pp. 270–318. [Google Scholar]
- Markard, J.; Raven, R.; Truffer, B. Sustainability transitions: An emerging field of research and its prospects. Res. Policy 2012, 41, 955–967. [Google Scholar] [CrossRef]
- Rip, A.; Kemp, R. Technological change. In Human Choice and Climate Change: Vol. II, Resources and Technology; Rayner, S., Malone, E.L., Eds.; Battelle Press: Columbus, OH, USA, 1998; pp. 327–399. [Google Scholar]
- Kemp, R.; Rotmans, J. The management of the co-evolution of technical, environmental and social systems. In Proceedings of the International Conference Towards Environmental Innovation Systems, Garmisch-Partenkirchen, Germany, 27–29 September 2001. [Google Scholar]
- Rotmans, J.; Kemp, R.; van Asselt, M. More evolution than revolution: Transition management in public policy. Foresight 2001, 3, 15–31. [Google Scholar] [CrossRef]
- Rip, A. A co-evolutionary approach to reflexive governance–and its ironies. In Reflexive Governance for Sustainable Development; Voss, J.P., Bauknecht, D., Kemp, R., Eds.; Edward Elgar Publishing: Cheltenham, UK; Northampton, MA, USA, 2006; pp. 82–100. [Google Scholar]
- Geels, F.W. Technological transitions as evolutionary reconfiguration processes: A multi-level perspective and a case study. Res. Policy 2002, 31, 1257–1274. [Google Scholar] [CrossRef]
- Kemp, R. Technology and the transition to environmental sustainability: The problem of technological regime shifts. Futures 1994, 26, 1023–1046. [Google Scholar] [CrossRef]
- Smith, A.; Stirling, A.; Berkhout, F. The governance of sustainable socio-technical transitions. Res. Policy 2005, 34, 1491–1510. [Google Scholar] [CrossRef]
- Markard, J.; Geels, F.W.; Raven, R. Challenges in the acceleration of sustainability transitions. Environ. Res. Lett. 2020, 15, 081001. [Google Scholar] [CrossRef]
- Loorbach, D.; Schwanen, T.; Doody, B.J.; Arnfalk, P.; Langeland, O.; Farstad, E. Transition governance for just, sustainable urban mobility: An experimental approach from Rotterdam, the Netherlands. J. Urban Mobil. 2021, 1, 100009. [Google Scholar] [CrossRef]
- Hölscher, K.; Wittmayer, J.M.; Loorbach, D. Transition versus transformation: What’s the difference? Environ. Innov. Soc. Transit. 2018, 27, 1–3. [Google Scholar] [CrossRef]
- Geels, F.W.; Schot, J. Typology of sociotechnical transition pathways. Res. Policy 2007, 36, 399–417. [Google Scholar] [CrossRef]
- Loorbach, D.; Rotmans, J. Managing transitions for sustainable development. In Understanding Industrial Transformation; Olsthoorn, X., Wieczorek, A., Eds.; Environment & Policy; Springer: Dordrecht, The Netherlands, 2006; Volume 44. [Google Scholar] [CrossRef]
- Brown, R.R.; Farrelly, M.A.; Loorbach, D.A. Actors working the institutions in sustainability transitions: The case of Melbourne’s stormwater management. Glob. Environ. Chang. 2013, 23, 701–718. [Google Scholar] [CrossRef]
- Brown, R.; Rogers, B.; Werbeloff, L. Moving Toward Water Sensitive Cities: A Guidance Manual for Strategists and Policy Makers; Cooperative Research Centre for Water Sensitive Cities Pty Ltd.: Clayton, Victoria, Australia, 2016. [Google Scholar]
- Loorbach, D.; Frantzeskaki, N.; Avelino, F. Sustainability transitions research: Transforming science and practice for societal change. Annu. Rev. 2017, 42, 599–626. [Google Scholar] [CrossRef]
- Hebinck, A.; Diercks, G.; von Wirth, T.; Beers, P.J.; Barsties, L.; Buchel, S.; Greer, R.; van Steenbergen, F.; Loorbach, D. An actionable understanding of societal transitions: The X-curve framework. Sustain. Sci. 2022, 17, 1009–1021. [Google Scholar] [CrossRef]
- Matti, J.; Bontoux, G.; Pistocchi, S. Towards a Fair and Sustainable Europe 2050: Social and Economic Choices in Sustainability Transitions; Publications Office of the European Union: Luxembourg, 2023. [Google Scholar] [CrossRef]
- Loorbach, D. To Transition!: Governance Panarchy in the New Transformation; Erasmus University Rotterdam: Rotterdam, The Netherlands, 2014; Available online: https://drift.eur.nl/nl/publicaties/transition-governance-panarchy-new-transformation/ (accessed on 15 December 2023).
- Robinson, L. Changeology: How to Enable Groups, Communities and Societies to Do Things They’ve Never Done Before; Green Books: Totnes, UK, 2009. [Google Scholar]
- Dibra, M. Rogers theory of diffusion of innovation—The most appropriate theoretical model in the study of factors influencing the integration of sustainability in tourism business. Procedia Soc. Behav. Sci. 2015, 195, 1453–1462. [Google Scholar] [CrossRef]
- Rogers, E.M. Diffusion of Innovation, 5th ed.; Free Press: Glencoe, IL, USA, 2003. [Google Scholar]
- Dearing, J.W.; Singhal, A. Communication of Innovations: A Journey with Ev Rogers; Singhal, A., Dearing, J.W., Eds.; Sage Publications: Thousand Oaks, CA, USA, 2006; pp. 15–28. [Google Scholar] [CrossRef]
- Dearing, J.W.; Meyer, G. Revisiting diffusion theory. In Communication of Innovations: A Journey with Ev Rogers; Singhal, A., Dearing, J.W., Eds.; Sage Publications: Thousand Oaks, CA, USA, 2006; p. 29. [Google Scholar] [CrossRef]
- Moore, G.A. Crossing the Chasm: Marketing and Selling High-Tech Products to Mainstream Customers; Harper Business: New York, NY, USA, 1991. [Google Scholar]
- Gladwell, M. Tipping Point: How Little Things Can Make a Big Difference; Back Bay Books: Boston, MA, USA, 2000. [Google Scholar]
- Fishbein, M. A theory of reasoned action: Some applications and implications. Neb. Symsposium Motiv. 1979, 27, 65–116. [Google Scholar]
- Davis, F.D. A Technology Acceptance Model for Empirically Testing New End-User Information Systems: Theory and Results. Ph.D. Dissertation, MIT Sloan School of Management, Cambridge, MA, USA, 1986. [Google Scholar]
- Davis, F.D. Perceived usefulness, perceived ease of use, and user acceptance of information technology. MIS Q. 1989, 13, 319–340. [Google Scholar] [CrossRef]
- Ajzen, I. The theory of planned behavior. Organ. Behav. Hum. Decis. Process. 1991, 50, 179–211. [Google Scholar] [CrossRef]
- Venkatesh, V.; Thong, J.Y.; Xu, X. Unified theory of acceptance and use of technology: A synthesis and the road ahead. J. Assoc. Inf. Syst. 2016, 17, 328–376. [Google Scholar] [CrossRef]
- Marangunić, N.; Granić, A. Technology acceptance model: A literature review from 1986 to 2013. Univers. Access Inf. Soc. 2014, 14, 81–95. [Google Scholar] [CrossRef]
- Linden, A.; Fenn, J. Understanding Gartner’s Hype Cycles: Strategic Analysis Report. Available online: http://ask-force.org/web/Discourse/Linden-HypeCycle-2003.pdf (accessed on 15 November 2023).
- Dedehayir, O.; Steinert, M. The hype cycle model: A review and future directions. Technol. Forecast. Soc. Chang. 2016, 108, 28–41. [Google Scholar] [CrossRef]
- Oreg, S.; Michel, A.; By, R.T. Introduction. In The Psychology of Organizational Change: Viewing Change from the Employee’s Perspective; Oreg, S., Michel, A., By, R.T., Eds.; Cambridge University Press: Cambridge, UK, 2023. [Google Scholar]
- Nikula, U.; Jurvanen, C.; Gotel, O.; Gause, D.C. Empirical validation of the classic change curve on a software technology change project. Inf. Softw. Technol. 2010, 53, 680–696. [Google Scholar] [CrossRef]
- Elrod, P.D.; Tippett, D.D. The ‘death valley’ of change. J. Organ. Change Manag. 2002, 12, 273–291. [Google Scholar] [CrossRef]
- Kübler-Ross, E. On Death and Dying: What the Dying Have to Teach Doctors, Nurses, Clergy and Their Own Families; Macmillan: New York, NY, USA, 1969. [Google Scholar]
- Corr, A.C. Coping with dying: Lessons that we should and should not learn from the work of Elisabeth Kübler-Ross. Death Stud. 1993, 17, 69–83. [Google Scholar] [CrossRef]
- Prigerson, H.G.; Maciejewski, P.K. Grief and acceptance as opposite sides of the same coin: Setting a research agenda to study peaceful acceptance of loss. Br. J. Psychiatry 2008, 198, 435–437. [Google Scholar] [CrossRef]
- Corr, A.C. The ‘five stages’ in coping with dying and bereavement: Strengths, weaknesses and some alternatives. Mortality 2019, 24, 405–417. [Google Scholar] [CrossRef]
- Stroebe, M.; Schut, H.; Boerner, K. Cautioning health-care professionals: Bereaved persons are misguided through the stages of grief. OMEGA J. Death Dying 2017, 74, 455–473. [Google Scholar] [CrossRef]
- Corr, A.C. Elisabeth Kübler-Ross and the ‘five stages’ model in a sampling of recent American textbooks. OMEGA J. Death Dying 2020, 82, 294–322. [Google Scholar] [CrossRef]
- Maciejewski, P.K.; Zhang, B.; Block, S.D.; Prigerson, H.G. An empirical examination of the stage theory of grief. J. Am. Med. Assoc. 2007, 297, 716–724. [Google Scholar] [CrossRef]
- Silver, R.C.; Wortman, C.B. To the Editor. J. Am. Med. Assoc. 2007, 297, 2692. [Google Scholar] [CrossRef] [PubMed]
- Weiner, J.S. To the Editor. J. Am. Med. Assoc. 2007, 297, 2692–2693. [Google Scholar] [CrossRef] [PubMed]
- Bonanno, G.A.; Boerner, K. To the Editor. J. Am. Med. Assoc. 2007, 297, 2693. [Google Scholar]
- Maciejewski, P.K.; Zhang, B.; Block, S.D.; Prigerson, H.G. In reply. J. Am. Med. Assoc. 2007, 297, 2693–2694. [Google Scholar]
- Appley, D.G. Book review of Transition: Understanding and managing personal change. J. Appl. Behav. Sci. 1978, 14, 548–549. [Google Scholar] [CrossRef]
- Kearney, K.S. A Study of the Emotional Effects on Employees Who Remain through Organisational Change: A View through Kübler-Ross (1969) in an Educational Institution. Ph.D. Thesis, Oklahoma State University, Stillwater, OK, USA, 2002. [Google Scholar]
- Kearney, K.S. Emotions and sensemaking: A consideration of a community college presidential transition. Community Coll. J. Res. Pract. 2013, 37, 901–914. [Google Scholar] [CrossRef]
- Smaldone, M.C.; Uzzo, R.G. The Kübler-Ross model, physician distress, and performance reporting. Nat. Rev. Urol. 2013, 10, 425–428. [Google Scholar] [CrossRef] [PubMed]
- Friedrich, E.; Wüstenhagen, R. Leading organisations through the stages of grief: The development of negative emotions over environmental change. Bus. Soc. 2017, 56, 186–213. [Google Scholar] [CrossRef]
- Running, S.W. The 5 Stages of Climate Grief. Numerical Terradynamic Simulation Group Publications. 2007, Volume 173. Available online: https://scholarworks.umt.edu/ntsg_pubs/173 (accessed on 15 November 2023).
- Hoggett, P.; Randall, R. Engaging with climate change: Comparing the cultures of science and activism. Environ. Values 2018, 27, 223–243. [Google Scholar] [CrossRef]
- Winckelmann, J.J. Johann Joachim Winckelmann on Art, Architecture, and Archaeology; First published in 1764 in German; Boydell & Brewer, Camden House: Rochester, NY, USA, 2013. [Google Scholar]
- Petrović, E.K. Two conceptualisations of change in architectural history: Towards driving pro-sustainable change in architecture. In Proceedings of the Society of Architectural Historians, Australia and New Zealand: 38 Annual Conference, Ultra: Positions and Polarities Beyond Crisis, Adelaide, Australia, 10–13 November 2021; Kroll, D., Curry, J., Nolan, M., Eds.; 2022; pp. 544–551. [Google Scholar] [CrossRef]
- Peña, G.; Cucuzzella, C. Ecomannerism. Sustainability 2021, 13, 1307. [Google Scholar] [CrossRef]
- Aydin, Y.C.; Mirzaei, P.A.; Akhavannasab, S. On the relationship between building energy efficiency, aesthetic features and marketability: Toward a new policy for energy demand reduction. Energy Policy 2019, 128, 593–606. [Google Scholar] [CrossRef]
- Kelly, R. Farmers, Tractors, and Tradies Expected at ‘ute’ Protests around the Country. Stuff, 26 June 2021. Available online: https://www.stuff.co.nz/business/farming/125572546/farmers-tractors-and-tradies-expected-at-ute-protests-around-the-country (accessed on 10 November 2023).
- Lindeman, T. Maple Leaf Flags, Conspiracy Theories and The Matrix: Inside the Ottawa Truckers’ Protests. The Guardian, 11 February 2022. Available online: https://www.theguardian.com/world/2022/feb/11/canada-ottawa-truckers-protest-covid-vaccine-mandates (accessed on 10 November 2023).
- Christafis, A.; Long Queues at French Petrol Stations as Fuel Subsidy is Scaled Down. The Guardian, 15 November 2022. Available online: https://www.theguardian.com/world/2022/nov/15/long-queues-at-french-petrol-stations-as-fuel-subsidy-is-scaled-down (accessed on 10 November 2023).
- Geels, F.W. Regime resistance against low-carbon transitions: Introducing politics and power into the multi-level perspective. Theory Cult. Soc. 2014, 31, 21–40. [Google Scholar] [CrossRef]
- Buchanan, L.; Bui, Q.; Patel, J.K. Black Lives Matter May Be the Largest Movement in US History. The New York Times, 3 July 2020. Available online: https://www.nytimes.com/interactive/2020/07/03/us/george-floyd-protests-crowd-size.html (accessed on 10 November 2023).
- Mohdin, A.; Campbell, L. ‘So Many People Care!’ The Young Britons Whose Lives Were Changed by Black Lives Matter. The Guardian. 13 November 2020. Available online: https://www.theguardian.com/world/2020/nov/13/how-black-lives-matter-has-inspired-a-generation-of-new-uk-activists (accessed on 10 November 2023).
- Berkhout, F. Technological regimes, path dependency and the environment. Glob. Environ. Chang. 2002, 12, 1–4. [Google Scholar] [CrossRef]
- Petrović, E.K. Persisting issues with the most recognized building material health risks: Lead and asbestos. In Materials for a Healthy, Ecological and Sustainable Built Environment: Principles for Evaluation; Petrović, E.K., Vale, B., Pedersen Zari, M., Eds.; Woodhead Publishing: Duxford, UK, 2017; pp. 155–174. [Google Scholar]
- Grover, T. IBM Manufacturing and Administrative Center, Rochester, MN, USA. Available online: https://sah-archipedia.org/buildings/MN-01-109-0005 (accessed on 15 December 2023).
- Knowles, S.G.; Leslie, S.W. ‘Industrial Versailles’: Eero Saarinen’s corporate campuses for GM, IBM, and AT&T. Isis 2001, 92, 1–33. [Google Scholar] [CrossRef]
Disclaimer/Publisher’s Note: The statements, opinions and data contained in all publications are solely those of the individual author(s) and contributor(s) and not of MDPI and/or the editor(s). MDPI and/or the editor(s) disclaim responsibility for any injury to people or property resulting from any ideas, methods, instructions or products referred to in the content. |
© 2023 by the author. Licensee MDPI, Basel, Switzerland. This article is an open access article distributed under the terms and conditions of the Creative Commons Attribution (CC BY) license (https://creativecommons.org/licenses/by/4.0/).