Article

The Effect of Size on the Mechanical Properties of 3D-Printed Polymers

1
School of Architecture, Building and Civil Engineering, Loughborough University, Loughborough LE11 3TU, UK
2
Department of Civil Engineering, Razi University, Kermanshah 6718773654, Iran
3
Navier Laboratory, Ecole des Ponts ParisTech, 77455 Paris, France
4
Department of Civil Engineering, Islamic Azad University, Maragheh Branch, Maragheh 5519747591, Iran
5
Civil Engineering Program, Ingram School of Engineering, Texas State University, San Marcos, TX 78666, USA
*
Author to whom correspondence should be addressed.
Sustainability 2024, 16(1), 356; https://doi.org/10.3390/su16010356
Submission received: 9 November 2023 / Revised: 22 December 2023 / Accepted: 28 December 2023 / Published: 30 December 2023

Abstract

:
Most of the experiments on additively manufactured polymers are on a small scale, and it remains uncertain whether findings at a small scale can be extrapolated to their larger-scale counterparts. This uncertainty mainly arises due to the limited studies on the effect of size on three-dimensional (3D)-printed polymers, among many others. Given this background, this preliminary study aims to investigate the effect of geometric dimensions (i.e., the size effect) on the mechanical performance of four representative types of 3D-printable polymers, namely, (1) polycarbonate acrylonitrile butadiene styrene (PC/ABS), (2) acrylonitrile-styrene-acrylate (ASA), (3) polylactic acid (PLA) as a bio biodegradable and sustainable material, and (4) polyamide (PA, nylon), based on compression, modulus of elasticity, tension, and flexural tests. Eight different sizes were investigated for compression, modulus of elasticity, and tension tests, while seven different sizes were tested under flexure as per relevant test standards. A material extrusion technique was used to 3D-print the polymers in a flat build orientation and at an infill orientation angle of 45°. The results have shown that the mechanical properties of the 3D-printed polymers were size-dependent, regardless of the material type, with the most significant being flexure, followed by tension, compression, and modulus of elasticity; however, no clear general trend could be identified in this regard. All the materials except for nylon showed a brittle failure pattern, characterized by interfacial failure rather than filament failure. PLA outperformed the other three polymer specimens in terms of strength, irrespective of the type of loading.

1. Introduction

The rapid proliferation of additive manufacturing, commonly referred to as three-dimensional (3D) printing, has made significant inroads across various domains of science and engineering. Its application spans a wide spectrum of fields, encompassing agriculture [1], medicine [2], civil engineering [3], the automotive industry [4], education [5], dentistry [6], architecture [7], food production [8], electrical engineering [9], and biomechanics [10], to mention but a few. While the potential benefits of 3D printing are immense, it is imperative to acknowledge that this technology currently comes with a hefty price tag. Furthermore, a significant proportion of the specimens that are generated through this methodology is limited to the laboratory scale, which poses challenges when considering up-scaling. It remains uncertain whether their performance at a smaller scale reliably reflects their behavior at a larger scale. This dichotomy between the promise of 3D printing and its current limitations underscores the critical importance of comprehending the size effect. This becomes especially relevant when considering that numerous materials, ranging from silicon carbide (SiC) ceramics [11] to sea ice [12], composites [13], steel [14], vinyl foam [15], concrete [16], rock [17], lime [18], and an array of polymers [19], exhibit characteristics that are contingent on size. This phenomenon poses a formidable challenge to the scientific community, emphasizing the pressing need for systematic investigations into size effects in additively manufactured polymers. Addressing this gap in our understanding holds the key to unlocking the full potential of large-scale 3D printing applications.
Currently, there is a paucity of comprehensive studies delving into the effect of size on additively manufactured polymers. The majority of research efforts in this domain have been predominantly directed toward the exploration of novel printing methodologies [20,21], the development of metamaterials [22], the creation of lattice-structured innovative materials [23,24], and the augmentation of mechanical properties [25]. While these endeavors are undoubtedly pivotal in advancing the field of additive manufacturing, it is imperative to recognize that an in-depth understanding of how size impacts the performance and behavior of additively manufactured polymers remains conspicuously absent from the current body of knowledge. This critical research gap not only hinders the innovation potential but also limits the practical application of 3D printing technology in scenarios necessitating large-scale production of polymer-based components. In light of the aforementioned, a compelling impetus emerges to embark on a comprehensive and systematic exploration of the size effect within the realm of additively manufactured polymers. Such an undertaking would not only contribute significantly to the existing body of knowledge but also catalyze the development of more effective and efficient additive manufacturing processes on a larger scale. This represents a crucial step forward in realizing the full potential of 3D printing technology in diverse real-world applications.
Few research studies have delved into the size effect phenomenon. Bell and Siegmund [26] subjected acrylic beams that were additively manufactured using PolyJet to three-point bending with an effective depth ( d ) of 1–5.48 mm and initial notch V-notches of 0.4 d in depth. The research revealed that the connection between strength and size was not straightforward for this size range. Instead, it showed a local peak followed by a decline in strength. This drop in strength in smaller specimens was linked to the presence of layer interfaces and a higher ratio of layer thickness to specimen size. On the other hand, larger specimens adhered to the expected scaling pattern. In other words, nonlinear size strength governed the behavior, and neither linear elastic fracture mechanics nor the strength criterion were valid. These findings suggest that designers working on 3D-printed structures could enhance their strength by implementing a specific size limit during the component design phase. Wu et al. [27] tested 3D-printed cubic plasters (size range: 10–100 mm) and polylactic acid (PLA) beams with d values of 4–20 mm under three-point bending. The findings revealed that the compressive strength of the 3D-printed plaster samples showed a noticeable size-dependent effect; the smaller specimens had the capacity to absorb a relatively higher amount of fracture energy, resulting in greater strength than their larger counterparts. The flexural strength of the 3D-printed PLA specimens also demonstrated a clear size-dependent impact. The findings revealed that the tensile strength of the printed strips within each layer surpassed the interlayer adhesion strength between the printed layers. In both the plaster and PLA samples, there is a variation in strength among specimens of the same size. Notably, this scattering tendency is more pronounced in smaller specimens, because the smaller specimens are influenced to a greater extent by the uneven distribution of material brought about by the 3D printing process, resulting in increased uncertainties in material strength. Conversely, in larger specimens, the printing scheme exerts a smaller impact, and the material distribution tends to be more uniform, resulting in fewer uncertainties in terms of material strength.
In their comprehensive study to establish a correlation among size, infill percentage, and mechanical properties, Elmrabet and Siegaks [28] embarked on a series of compression and tension tests. These tests were conducted on 3D-printed materials, namely, PLA and thermoplastic polyurethane (TPU), employing three distinct infill percentages: 20%, 60%, and 100%. The design of the tensile specimens adhered strictly to the specifications outlined in ISO-527 Type 1A and 1B [29] and ISO-37 Type 2 [30]. This investigation highlighted the inadequacies of the ISO standard guidelines, particularly in the realm of finite element simulations for 3D-printed polymers. Additionally, it underscored the challenge posed by the nonuniformity of material distribution, especially in cases involving significant cross-sectional variations. These revelations have significant implications for the accurate modeling and simulation of mechanical behavior in 3D-printed materials. The investigation conducted by Nurizada and Kirane [31] on 3D-printed acrylonitrile butadiene styrene (ABS) unveiled a noteworthy revelation: the size effect holds significant implications in the realm of additively manufactured materials. Specifically, the fracture toughness of specimens, a characteristic marked by a substantial fracture process zone within the laboratory setting, tends to be prone to underestimation when produced at practical dimensions. This observation sheds light on the intricacies of translating laboratory-scale findings to real-world applications, emphasizing the critical importance of comprehending size-dependent behavior in additive manufacturing.
Similarly, an additional study which focused on additively manufactured PLA within a 0.1 mm to 0.3 mm thickness range corroborated a size effect [32]. Meanwhile, the research conducted by Guessama et al. [33] and delving into 3D-printed ABS cubic specimens spanning sizes from 5 mm to 40 mm not only confirmed a minor size effect in compression for downsizing the filament diameter up to 20 times but also reported a discernible reduction in compressive strength with increasing specimen size. Furthermore, an analysis encompassing a substantial corpus of 200 tensile tests on ABS, acrylonitrile styrene acrylate (ASA), PLA, and polyamide (PA, commonly known as nylon) was conducted, yielding intriguing results [34]. Surprisingly, the findings underscored the complexity of the size effect, as increasing the cross-sectional area by a factor of 60 only led to a 72% enhancement in tensile strength. This discovery challenges conventional assumptions and underscores the nuanced nature of size-dependent behavior in additively manufactured materials. Moreover, the infill orientation within specimens emerged as a critical factor influencing mechanical properties. Specimens with an infill orientation angle of 90° exhibited a lower tensile strength and followed straight fracture paths, which is indicative of a weaker interface strength than specimens with a 0° infill orientation angle [34]. This observation underscores the importance of considering both size and orientation in evaluating mechanical characteristics in additively manufactured components. These cumulative findings emphasize the intricate interplay of various factors in determining the mechanical behavior of additively manufactured materials, urging a holistic approach in future research endeavors. Furthermore, the study by Ng et al. [35] utilized 2D X-ray imaging due to its rapid imaging and processing capabilities in comparison to a 3D microcomputed tomography (micro-CT) scan, employing ABS as the model material. Various void sizes were intentionally introduced into tensile test coupons to investigate their impact on tensile properties. A strong linear correlation ( R 2 = 0.998) was observed between void sizes and tensile strength, forming the basis for the development of a model outlining the acceptance criteria for the parts. The criteria, derived from 2D X-ray imaging and mechanical test data, indicate the viability of employing this approach for quality checks in 3D-printed parts. This eliminates the necessity for time-consuming 3D micro-CT scans and unsustainable destructive testing.
The comprehensive review of previous studies underscores a pressing need for further exploration into the size effect phenomenon within the domain of 3D-printed polymers. This urgency arises primarily from the inherent challenge of achieving scalability for 3D-printed polymers in real-world applications. Recognizing this critical gap, the present study is poised to embark on an investigation aimed at characterizing the size effect exhibited by four polymers: polycarbonate acrylonitrile butadiene styrene (PC/ABS), ASA, PLA, and nylon. Each of these polymers holds distinctive applications in a diverse array of industries; for instance, PC/ABS finds prominent utility in blow-molded seatbacks [36] and automotive exterior components [37], while ASA is widely employed in the automotive industry for its excellent performance in exterior applications [38], as well as in the construction sector [39]. Based on initial findings, it has been suggested that recycling PLA has an environmental impact that is 50 times more favorable than composting and 16 times more favorable than combustion, which is considered quite sustainable [40,41]. PLA can be employed as formwork for structural concrete elements and as a material for mesh molds. This approach, utilizing plastic reinforcements rather than traditional steel or plywood, presents an appealing ecological perspective [42]. Moreover, PLA proves to be a viable option for the repair or retrofitting of concrete structures [43]. There is a potential to make PLA from cow manure to address sustainability issues and recycling [44]. Regarding carbon dioxide emissions, 3D printing energy and human toxicity PLA are environmentally friendly options [45]. PLA is a solution to replacing fossil plastics [46]. Reviews have indicated that using spent coffee grounds as the main source for bacterial fermentation to produce lactic acid and ring-opening polymerization to produce PLA are both possible [47]. Meanwhile, the unparalleled fatigue performance exhibited by nylon renders it indispensable in manufacturing components that are subjected to rigorous wear and tear, such as high-performance gears [48,49], among various other applications.
The objective of this study is to examine the size effect phenomenon in four different materials. To the best knowledge of the authors, this study is one of the few attempts to characterize the size effect phenomenon with relatively large-scale specimens (for example, up to 457.5 mm in length for the tensile specimen). Knowing the size effect concept in additive manufacturing of polymers allows us to rationally up-scale the relatively expensive specimens fabricated using this technology, especially from a design perspective, not to mention the fact that numerous materials show an effect of size in terms of strength, as previously outlined.

2. Materials and Methods

This study employed the material extrusion technique to fabricate the polymers, employing a flat build orientation with an infill angle set at 45°. The 3D printing was performed using a Creality Ender-3 V-2 printer, chosen for its precision and reliability in achieving the desired outcomes. Materials are given below, and all the printing parameters are outlined in Table 1.
-
PC/ABS filament was from the Polymaker brand with a density of 1.1 g/cm3, tensile strength of 39.9 ± 1 MPa in the X-Y plane, and Charpy impact strength of 25.8 ± 1.3 kJ/m2 in the X-Y plane.
-
ASA filament was from the PM brand with a density of 1.07 g/cm3, flexural strength of 1800 MPa, and impact strength of 12 kJ/m2.
-
PLA filament was from the 3DJacke brand with a density of 1.24 g/cm3 and a tensile strength of 70 MPa.
-
Nylon filament was from the FIBERLOGY brand with a density of 1.01 g/cm3, tensile strength of 51 MPa, and IZOD impact strength of 12 kJ/m2.
A series of mechanical tests that were undertaken in this study and the corresponding specimen sizes are detailed in Table 2. For the tension, compression, and elastic modulus tests, an array of eight distinct specimen sizes ranging from 0.5X to 2.5X (where X symbolizes the magnification factor) were considered. The flexure tests encompassed seven different sizes, varying from 1.0X to 3.0X. The testing protocols were adhered to with high precision. The tensile tests were conducted at a controlled displacement rate of 5 mm/min, in line with established standards. Similarly, for the compression, elastic modulus, and flexure tests, a displacement rate of 1 mm/min was adhered to as per the specific stipulations outlined in the relevant standards. SPICO universal testing machine (UTM) with a capacity of 25 kN was used to carry out tensile and flexural tests. SANTAM UTM with a capacity of 1000 kN was used to carry out modulus of elasticity and compression tests. Figure 1, Figure 2, Figure 3 and Figure 4 showcase the PC/ABS, ASA, PLA, and nylon specimens, respectively.

3. Results and Discussion

3.1. Tension Results

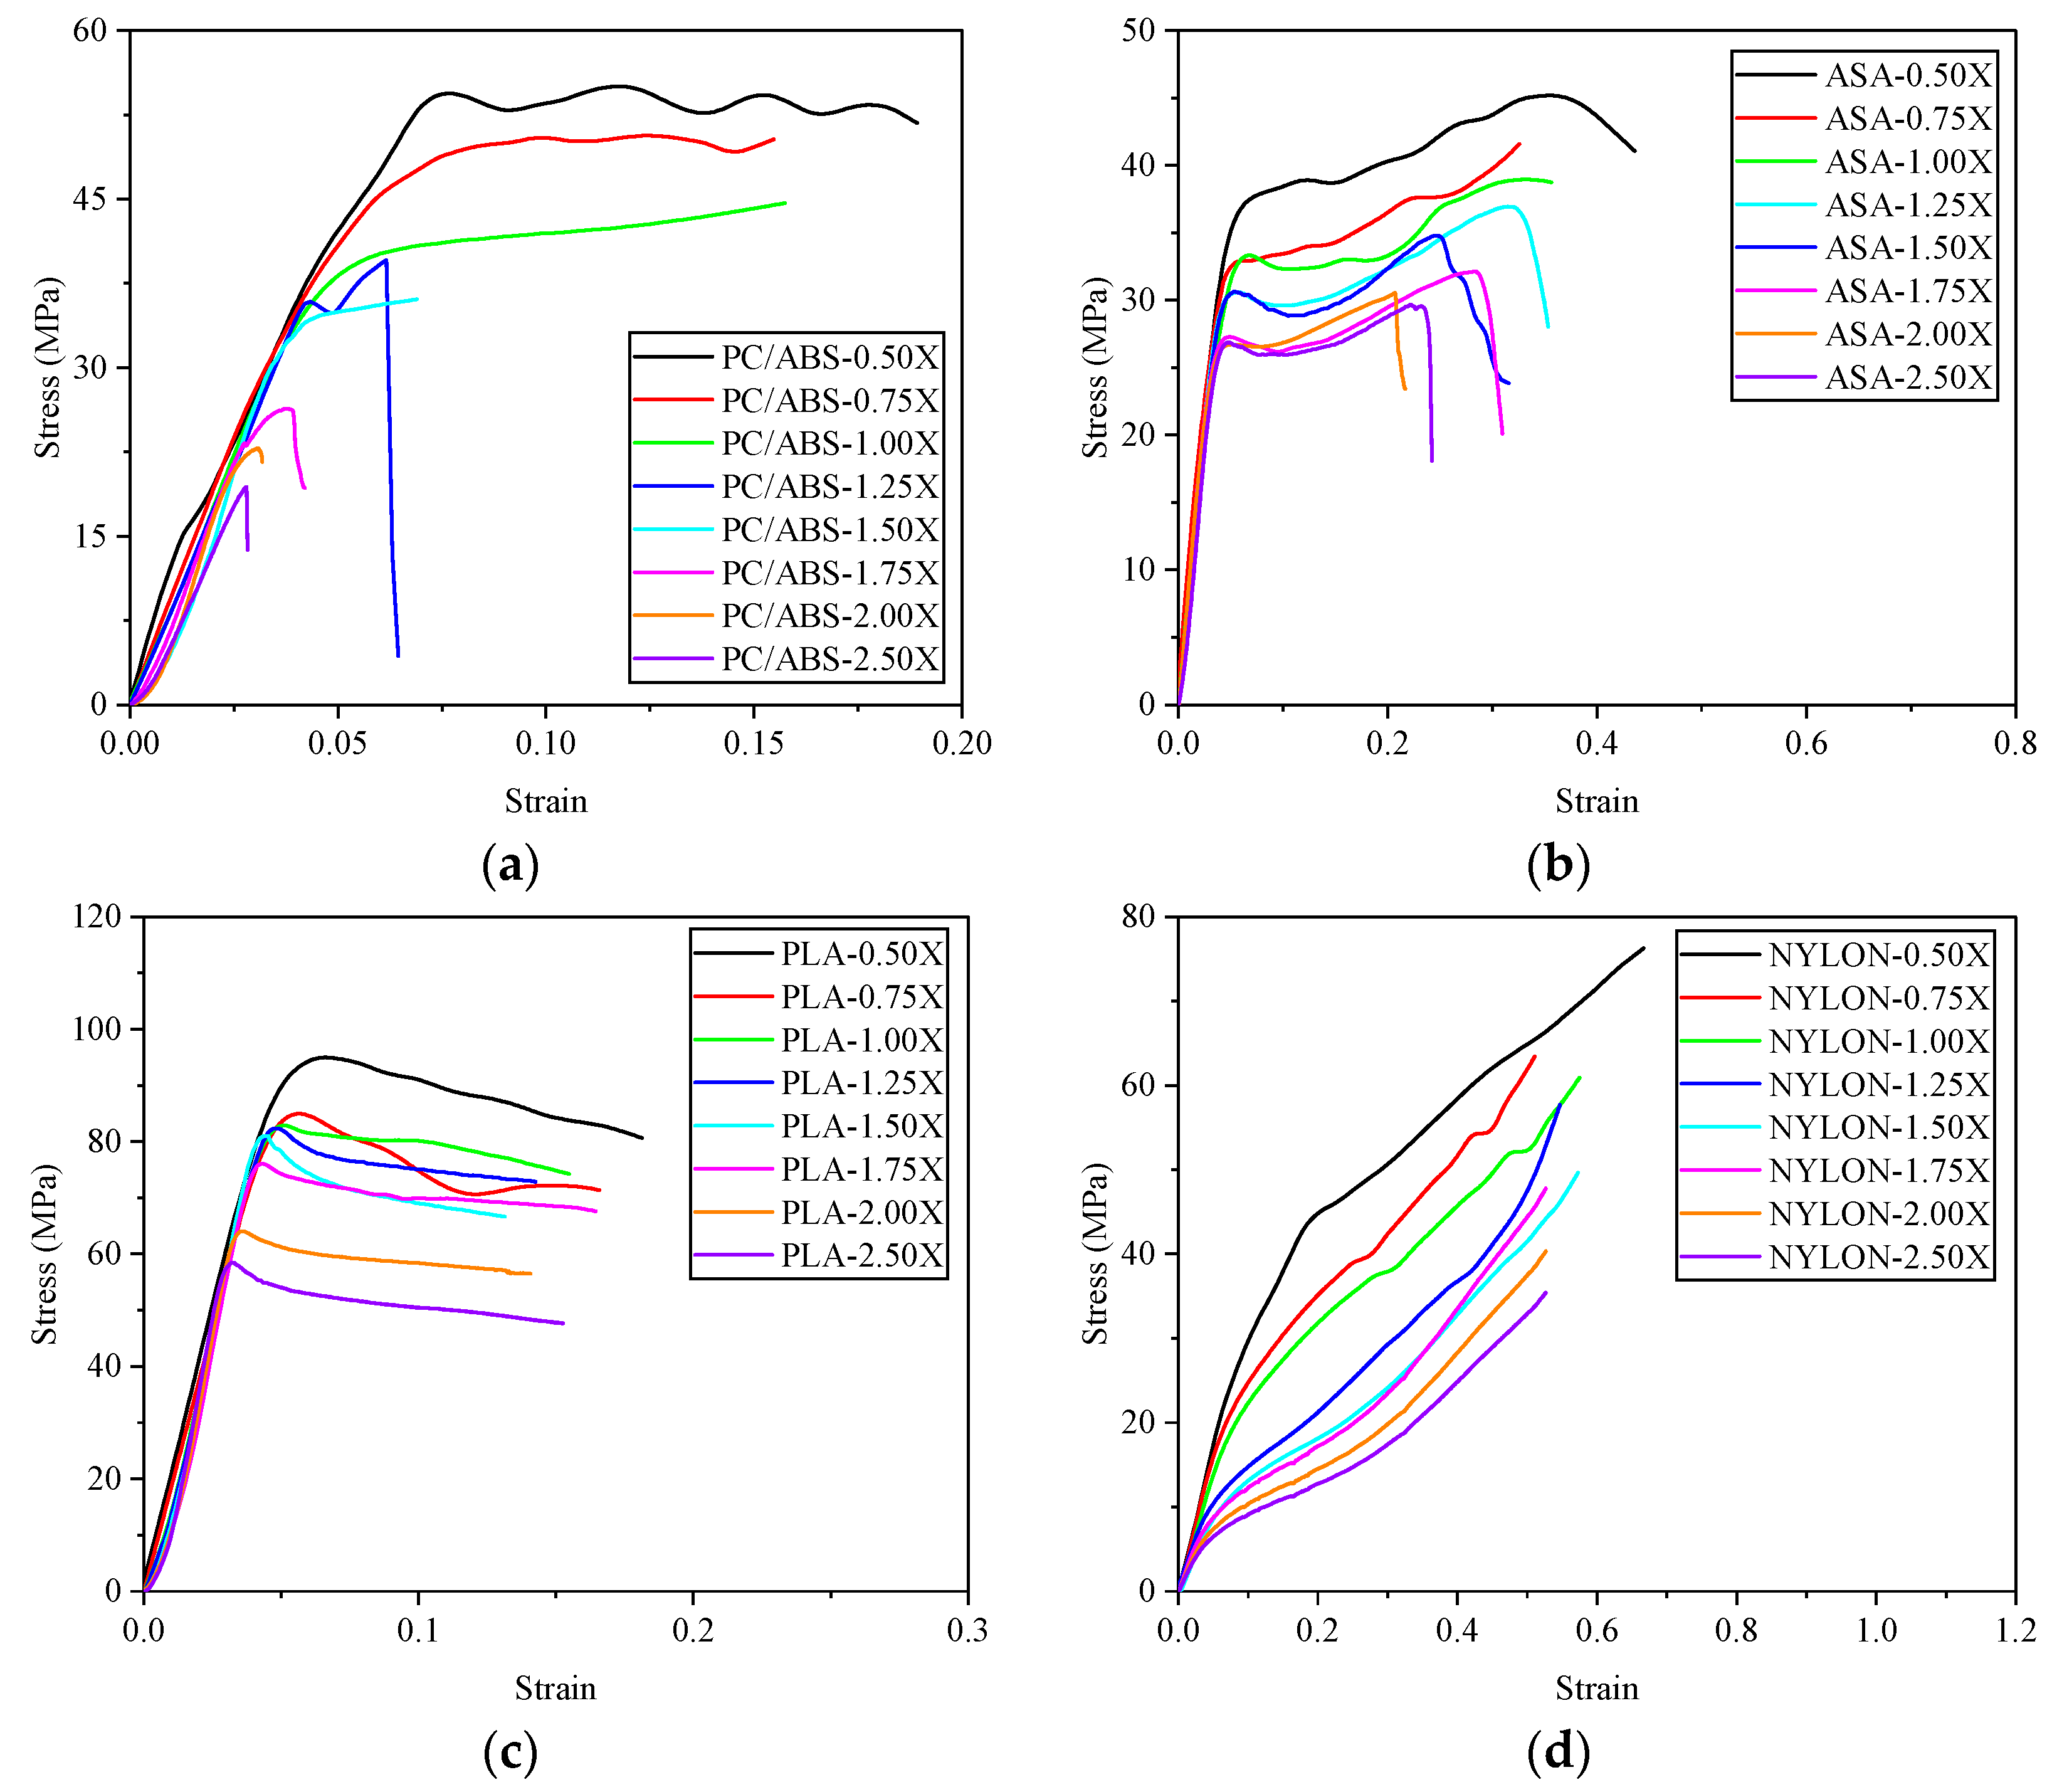
Based on the analysis presented in Figure 5, it was evident that a distinct pattern emerged across all examined specimens. Each specimen demonstrated a linear response leading up to the peak load, a characteristic behavior that was universally observed. However, a notable deviation from this trend was observed in the nylon specimens, where substantial strains were sustained even at the point of failure. Nylon behaved like a foam, where a linear trend up to the first peak was followed by a strain hardening behavior with a slight slope; as the external load increases the internal stress of the specimens so that the stress thresholds were reached for the filaments, the specimen underwent large strain values with an insignificant slope in comparison to the linear branch. At the final stage, which is denoted as “densification”, filaments across layers began to interact with one another, which increased the slope in the plastic region. This phenomenon is mainly encountered in compressive loadings, where the plastic collapse of inner segments is followed by the collapse of the outer walls. This intriguing observation regarding tension warrants further exploration and may offer valuable insights into the unique mechanical properties exhibited by nylon. Furthermore, it is worth highlighting that the ASA and PLA specimens of 0.5X size displayed a somewhat extended plateau phase prior to the eventual failure. This observation introduces an intriguing dimension to the mechanical behavior of these materials, potentially indicative of specific structural features or material properties at play. This nuanced understanding of the behavior at varying sizes can significantly contribute to refining structural design considerations. Delving deeper into the specific tensile strengths observed, PLA emerged as the frontrunner, boasting an impressive tensile strength of up to 61 MPa for the 0.5X-size specimen. PC/ABS, nylon, and ASA were closely behind, each showcasing commendable strength characteristics. The clearest size effect was observed in nylon (47%), followed by ASA (41%), PLA (33%), and PC/ABS (31%) when the size increased from 0.5X to 2.5X. This hierarchy of strengths provides invaluable insights into the relative performance of these materials under tensile loading conditions. It is pertinent to underscore that tension involves pulling forces that can lead to the separation of individual layers along the printed lines. If there are any weaknesses in the layer adhesion or bonding, they are more likely to be exposed and result in variability in tensile strength. Hence, the standard deviation (SD) values are higher in tension than compression and flexure, which will be discussed in the subsequent sections. As the specimen becomes larger, the performance of the specimen is dictated by the overall integrity of the specimen rather than localized bonding deficiencies, therefore exhibiting lower SD values. In other words, results obtained for larger specimens are more reliable. A summary of mechanical strengths and absorbed energy values is given in Table 3. It is emphasized that the dependence of absorbed energy on dimensional values is mostly reflected in the nylon specimen (82%), followed by ASA (12%), PC/ABS (31%), and PLA (20%). We observed a decrease in absorbed energy values as the size changed from 0.5X to 2.5X.
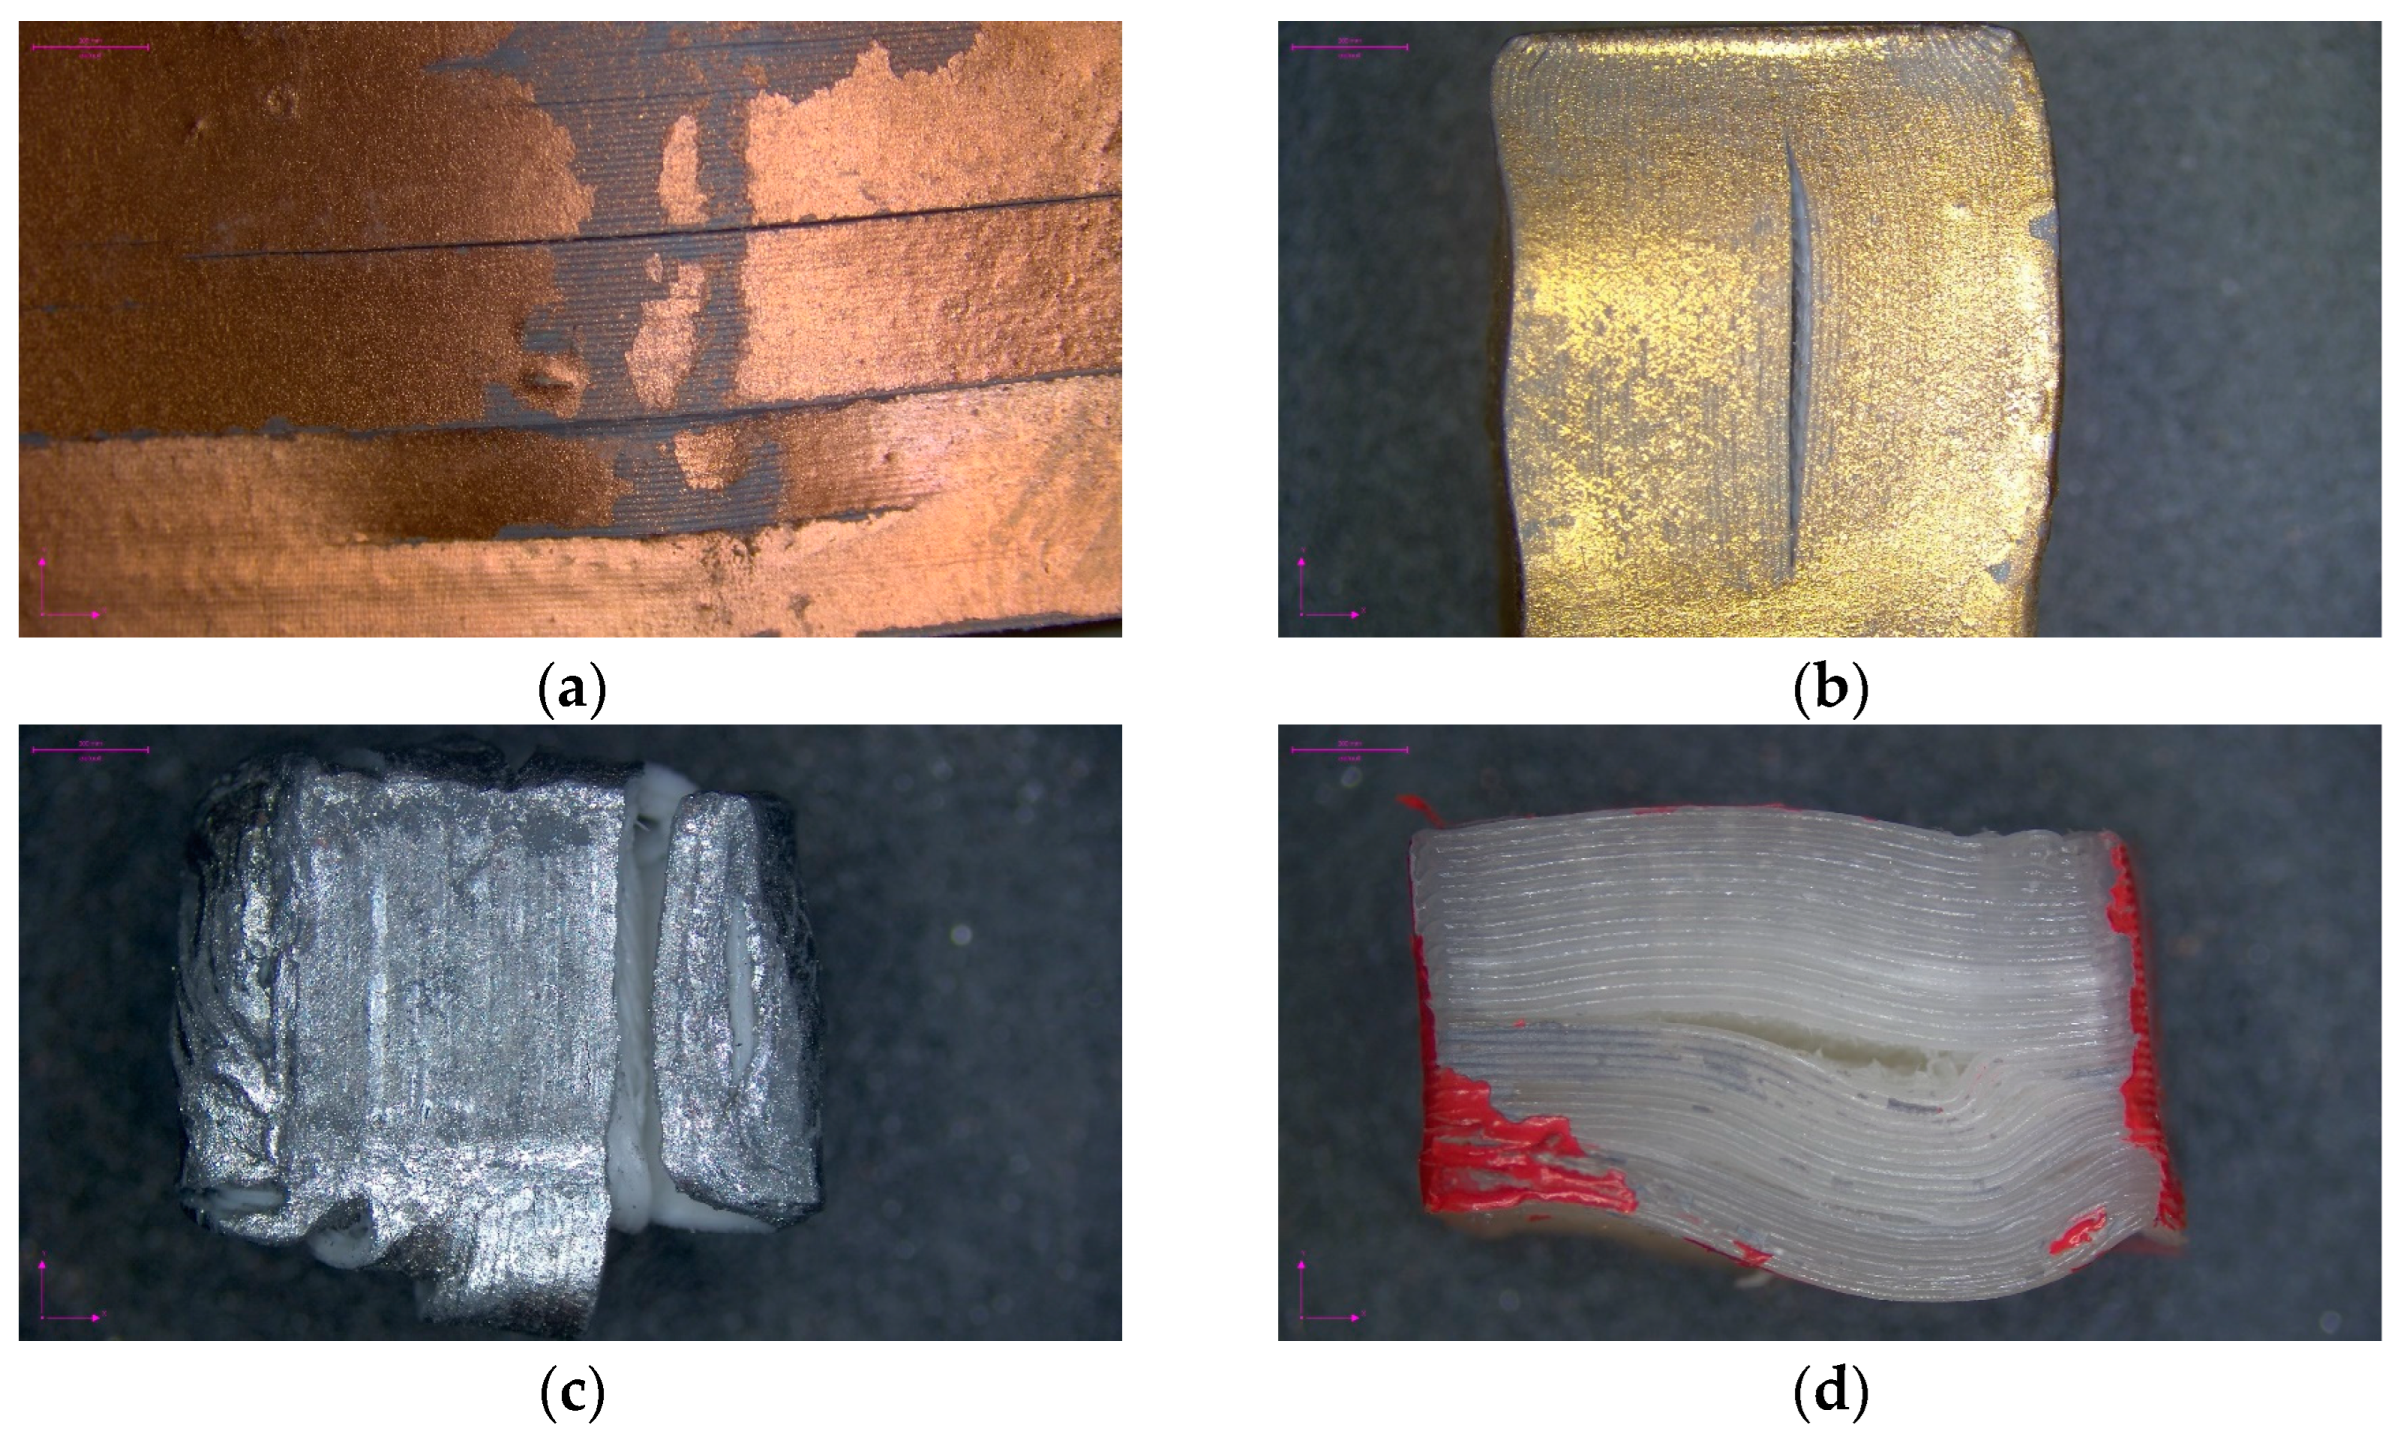
Regarding the post-peak behavior, a distinctive pattern emerges, most notably exemplified by the nylon specimens. The substantial strain that was sustained before failure in nylon highlights its remarkable plasticity and ductility. The contrasting behavior observed in other specimens prompts further investigation, particularly regarding the interfacial failure that predominates. This intriguing phenomenon suggests a significant difference in strength between the filament and interface, an aspect that warrants meticulous examination to ascertain its underlying mechanisms. The fracture surface, as depicted in Figure 6, further elucidates the distinctive failure pattern exhibited by each specimen. The nearly abrupt fracture, resulting in a clean bisecting of the specimen, is characteristic of the majority of the tested materials. However, the unique flexibility and ductility of nylon materialize in a distinct failure mode, where failure occurs upon reaching the strength threshold of the filaments. This distinction underscores the significantly higher energy absorption capacity and toughness exhibited by nylon, setting it apart from its counterparts.
Figure 7 presents a portrayal of the peak stress values that were measured under tension for various specimen sizes and diverse polymer types, shedding light on intriguing trends within this dataset. One conspicuous pattern that emerges is the discernible decline in peak stress as the specimen size escalates. However, it is worth noting that the rate of strength reduction between consecutive sizes often displays an element of variability, introducing an intriguing layer of complexity to this phenomenon. This variability indicates a multifaceted interplay of factors influencing material behavior, thereby necessitating a nuanced examination.
Furthermore, the observed trend exhibits a certain level of dependency on the specific material under consideration. Notably, the highest degree of strength reduction is manifest in the case of nylon, juxtaposed with the relatively lower strength reduction witnessed in PC/ABS. While these distinctions are noteworthy, it should be noted that the disparities in strength reduction rates among the different polymer types do not achieve a level of significance that would unequivocally attribute this behavior solely to the intrinsic nature of the polymer. The most pronounced decrease in peak stress is observed in the nylon specimens. This material exhibited a staggering 89.6% reduction in peak stress when transitioning from the 0.5X size (measuring at 44 MPa) to the 2.5X size (registering at 23.2 MPa). This dramatic shift in mechanical behavior underscores the unique response of nylon to changes in specimen size, which is potentially indicative of underlying microstructural alterations. This trend, albeit less pronounced, is also observed in the ASA specimens, suggesting a shared aspect of their mechanical behavior. Interestingly, a similar trend emerged when comparing PC/ABS and PLA specimens, hinting at a potential commonality in their underlying material responses. This intriguing parallelism warrants further investigation, potentially unearthing shared material characteristics or structural features that govern their mechanical behavior. It should also be emphasized that larger specimens than the ones fabricated in this study should be fabricated to explore the behavior beyond the 2.5X size dimension (the stress values show a declining trend, but this trend cannot be followed, as the stress for larger specimens cannot be zero. Hence, there should be a threshold beyond which stress values reach a plateau against dimensional variations and/or a different behavior is observed).

3.2. Compression Results

Figure 8 depicts the outcomes of the compression tests conducted on various 3D-printed specimens, each differing in size and polymer composition. In PC/ABS (Figure 8a), a conspicuous trend emerges: as the specimen size increased, the corresponding peak stress at failure exhibited a consistent, albeit somewhat irregular, decrease. Notably, this behavior did not adhere to any discernible pattern. This phenomenon explains the unique irregularities and imperfections that were present in each specimen, which did not adhere to a uniform scaling law based on geometric dimensions. The inherently nonlinear and intricate nature of this behavior was manifest in the resulting mechanical properties, specifically the compressive strength under consideration.
However, the same trend did not hold true for the ASA specimens, as illustrated in Figure 8b. These specimens displayed an isotropic compressive modulus of elasticity, characterized by a yield plateau with substantial strain, culminating in an abrupt rupture. The size-dependent effect for this particular specimen exhibited a striking consistency, with a reduction in compressive stress of approximately 43% when transitioning from 0.5X to 2.5X in size. Similar patterns were found in the PLA specimens (Figure 8c), where an initial pseudo-linear trend was succeeded by a sudden, brittle failure. The 0.5X specimen displayed slight slippage before fortifying its strength, ultimately attaining a comparable modulus of elasticity and greater strength than its counterparts.
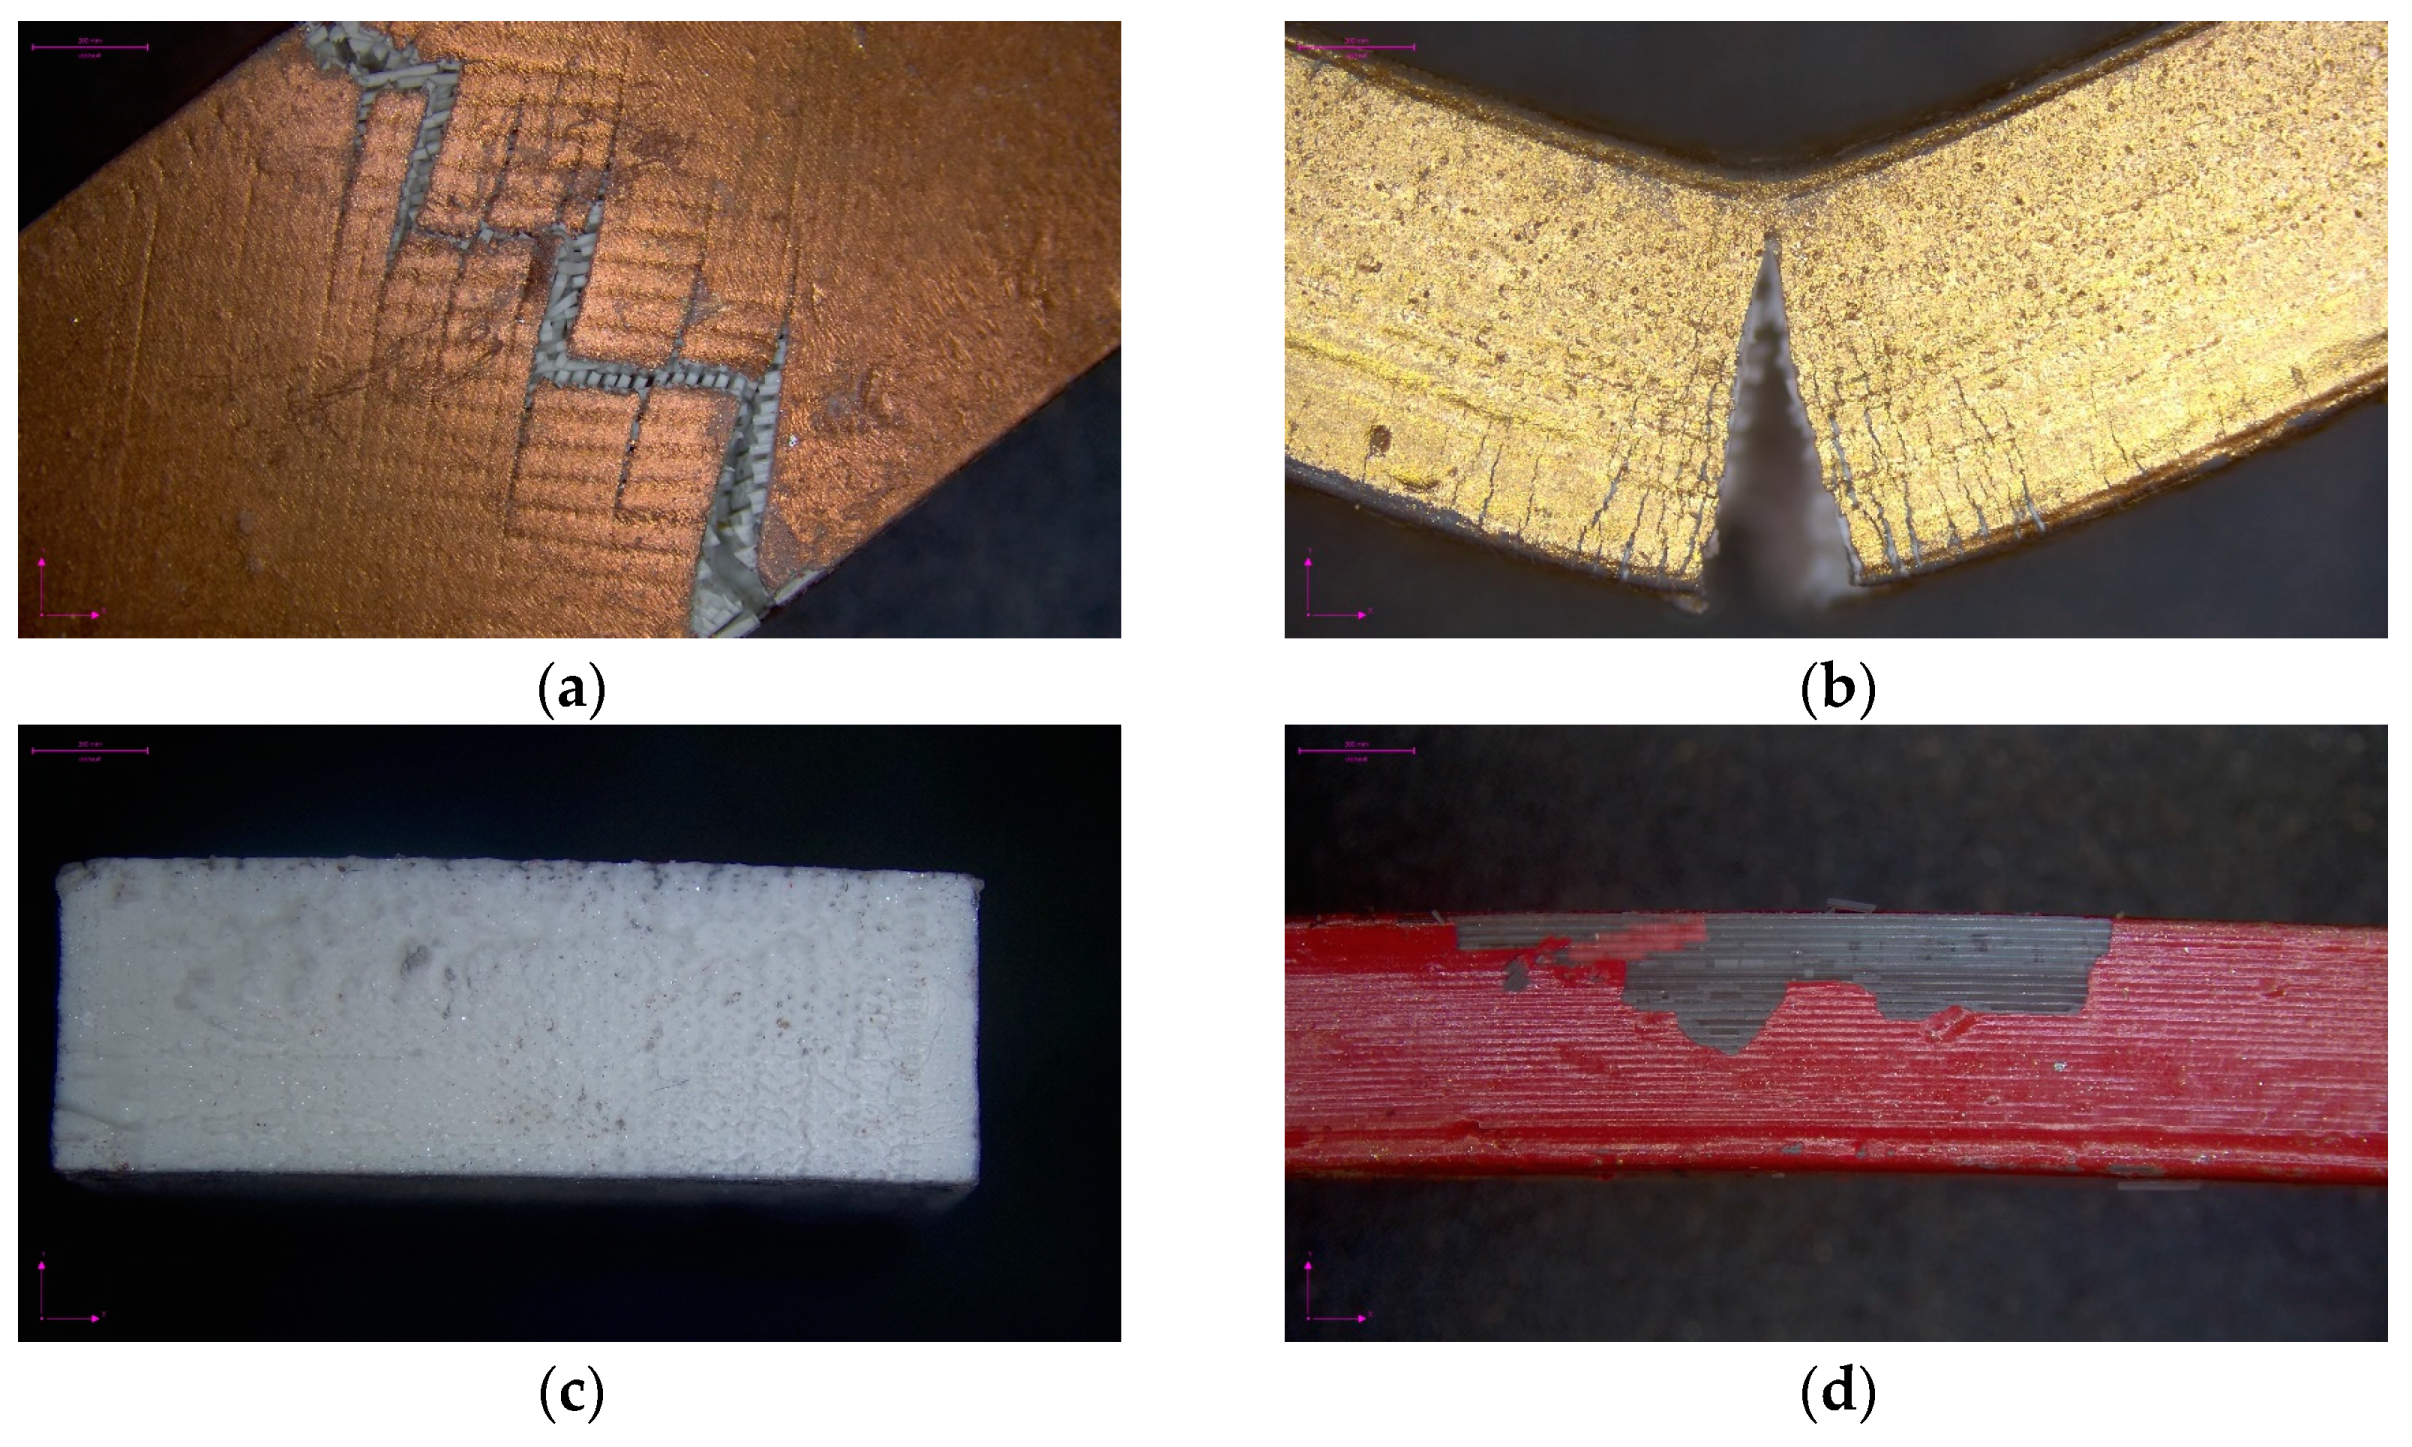
The nylon specimen (Figure 8d) exhibited characteristics akin to foams. An elastic linear behavior was initially observed, followed by a shift into plastic behavior and eventual densification in the latter stages of loading. This behavior arises from the compressive loading, which prompts the printing layers to interlock, resulting in a higher compressive strength during the final stages of loading. Due to their elastoplastic nature, the nylon specimens underwent larger strains than their counterparts while exhibiting strain-hardening behavior up until the point of fracture. It is hypothesized that smaller specimens, having a small surface area, had large portions of their area contributing to the load-bearing capacity, thereby undergoing larger strain values. In other words, more material was engaged in sustaining the load in comparison to larger specimens, where only higher strains were concentrated. This being the case, the fracture process zone (FPZ) introduced by Bažant and Kazemi [53] is applicable to justify the size effect phenomenon, as the strength is contingent upon the size ratio of the FPZ relative to the overall specimen size. This ratio is expected to be higher in smaller specimens, and that is why they absorb more energy and higher strength. This is reflected in Table 4, as smaller specimens have higher compressive strengths. A comparison of Table 3 and Table 4 reveals that in general, the standard deviation in compression is relatively lower than that in tension. Compression loading generally keeps the layers more compressed, reducing the likelihood of interlayer separation. In the overarching context, the fracture behavior adhered to a stable trend, as all specimens initially demonstrated delamination of layers. This can be attributed to the weaker interfacial strength relative to the filament strength, a phenomenon vividly depicted in Figure 9.
Figure 10 presents an analysis of the size effect in compression for various polymer types. The observed trend exhibited a degree of unpredictability, deviating from a straightforward linear progression, which was in stark contrast to the behavior witnessed in tension tests. It is worth noting that this observation was not entirely contrary to the trends observed in the specimens subjected to tension, albeit to a certain extent.
Once again, the trend emerged that the smallest specimens demonstrated the highest compression strength, surpassing their tensile counterparts in general. A discernible decline in peak stress values was particularly prominent in the case of PC/ABS, manifesting as a substantial 2.84-fold decrease. Following closely behind, nylon exhibited a 2.15-fold decrease, while PLA and ASA showed reductions of 1.62 times and 1.52 times, respectively, as the overall size varied from 0.5X to 2.5X. Furthermore, while the rate of stress variation between two consecutive sizes exhibited a monotonous trend, it did not adhere to a specific pattern.

3.3. Elastic Modulus Results

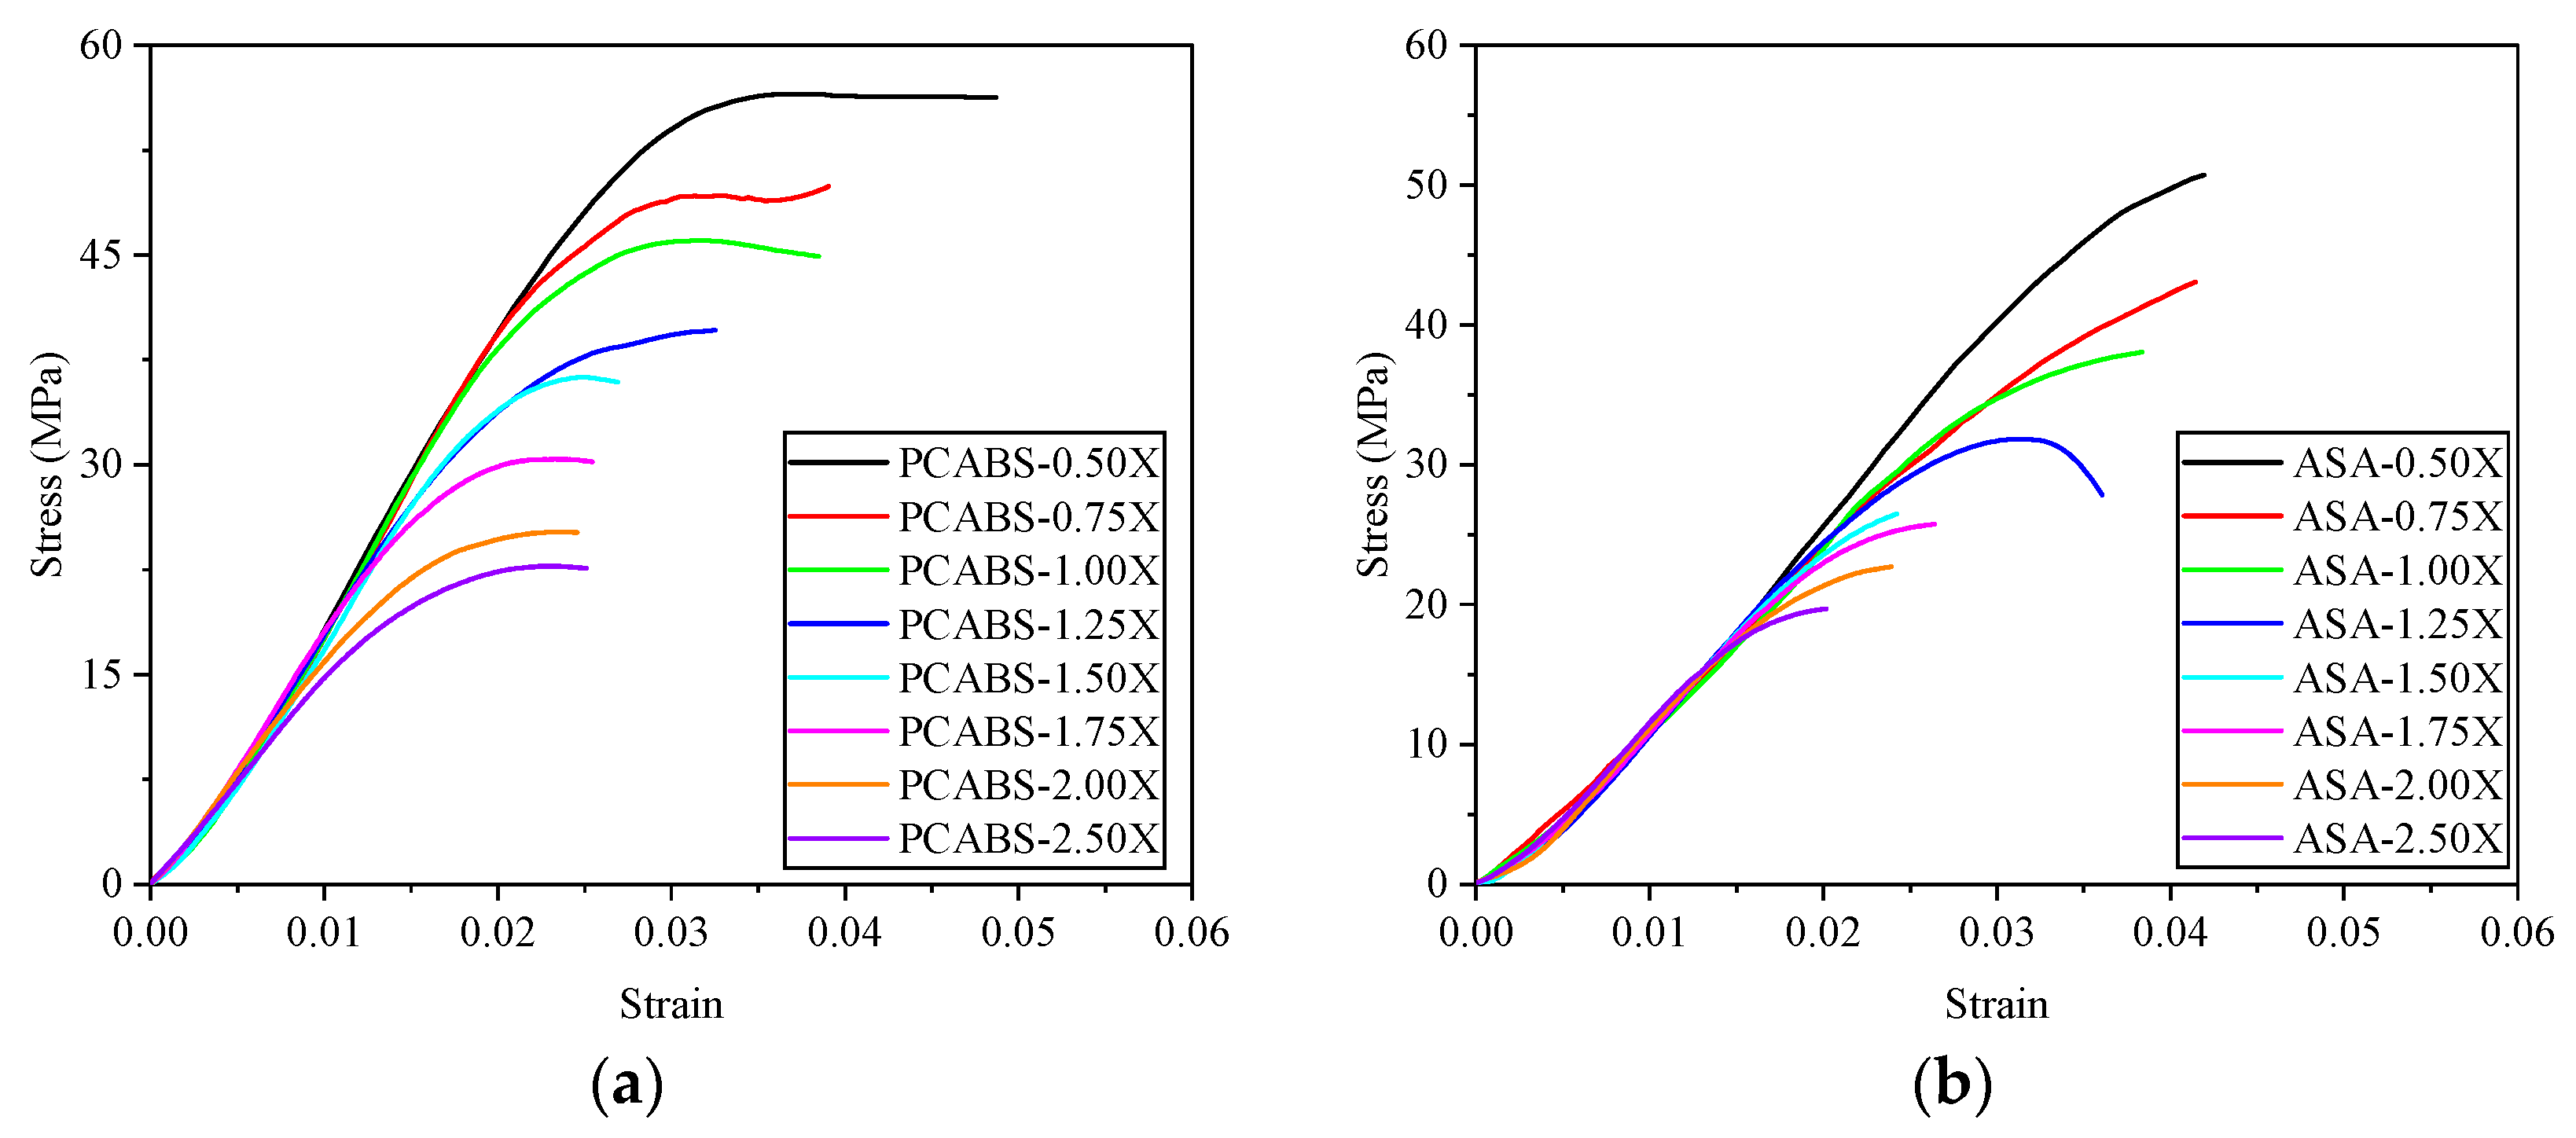
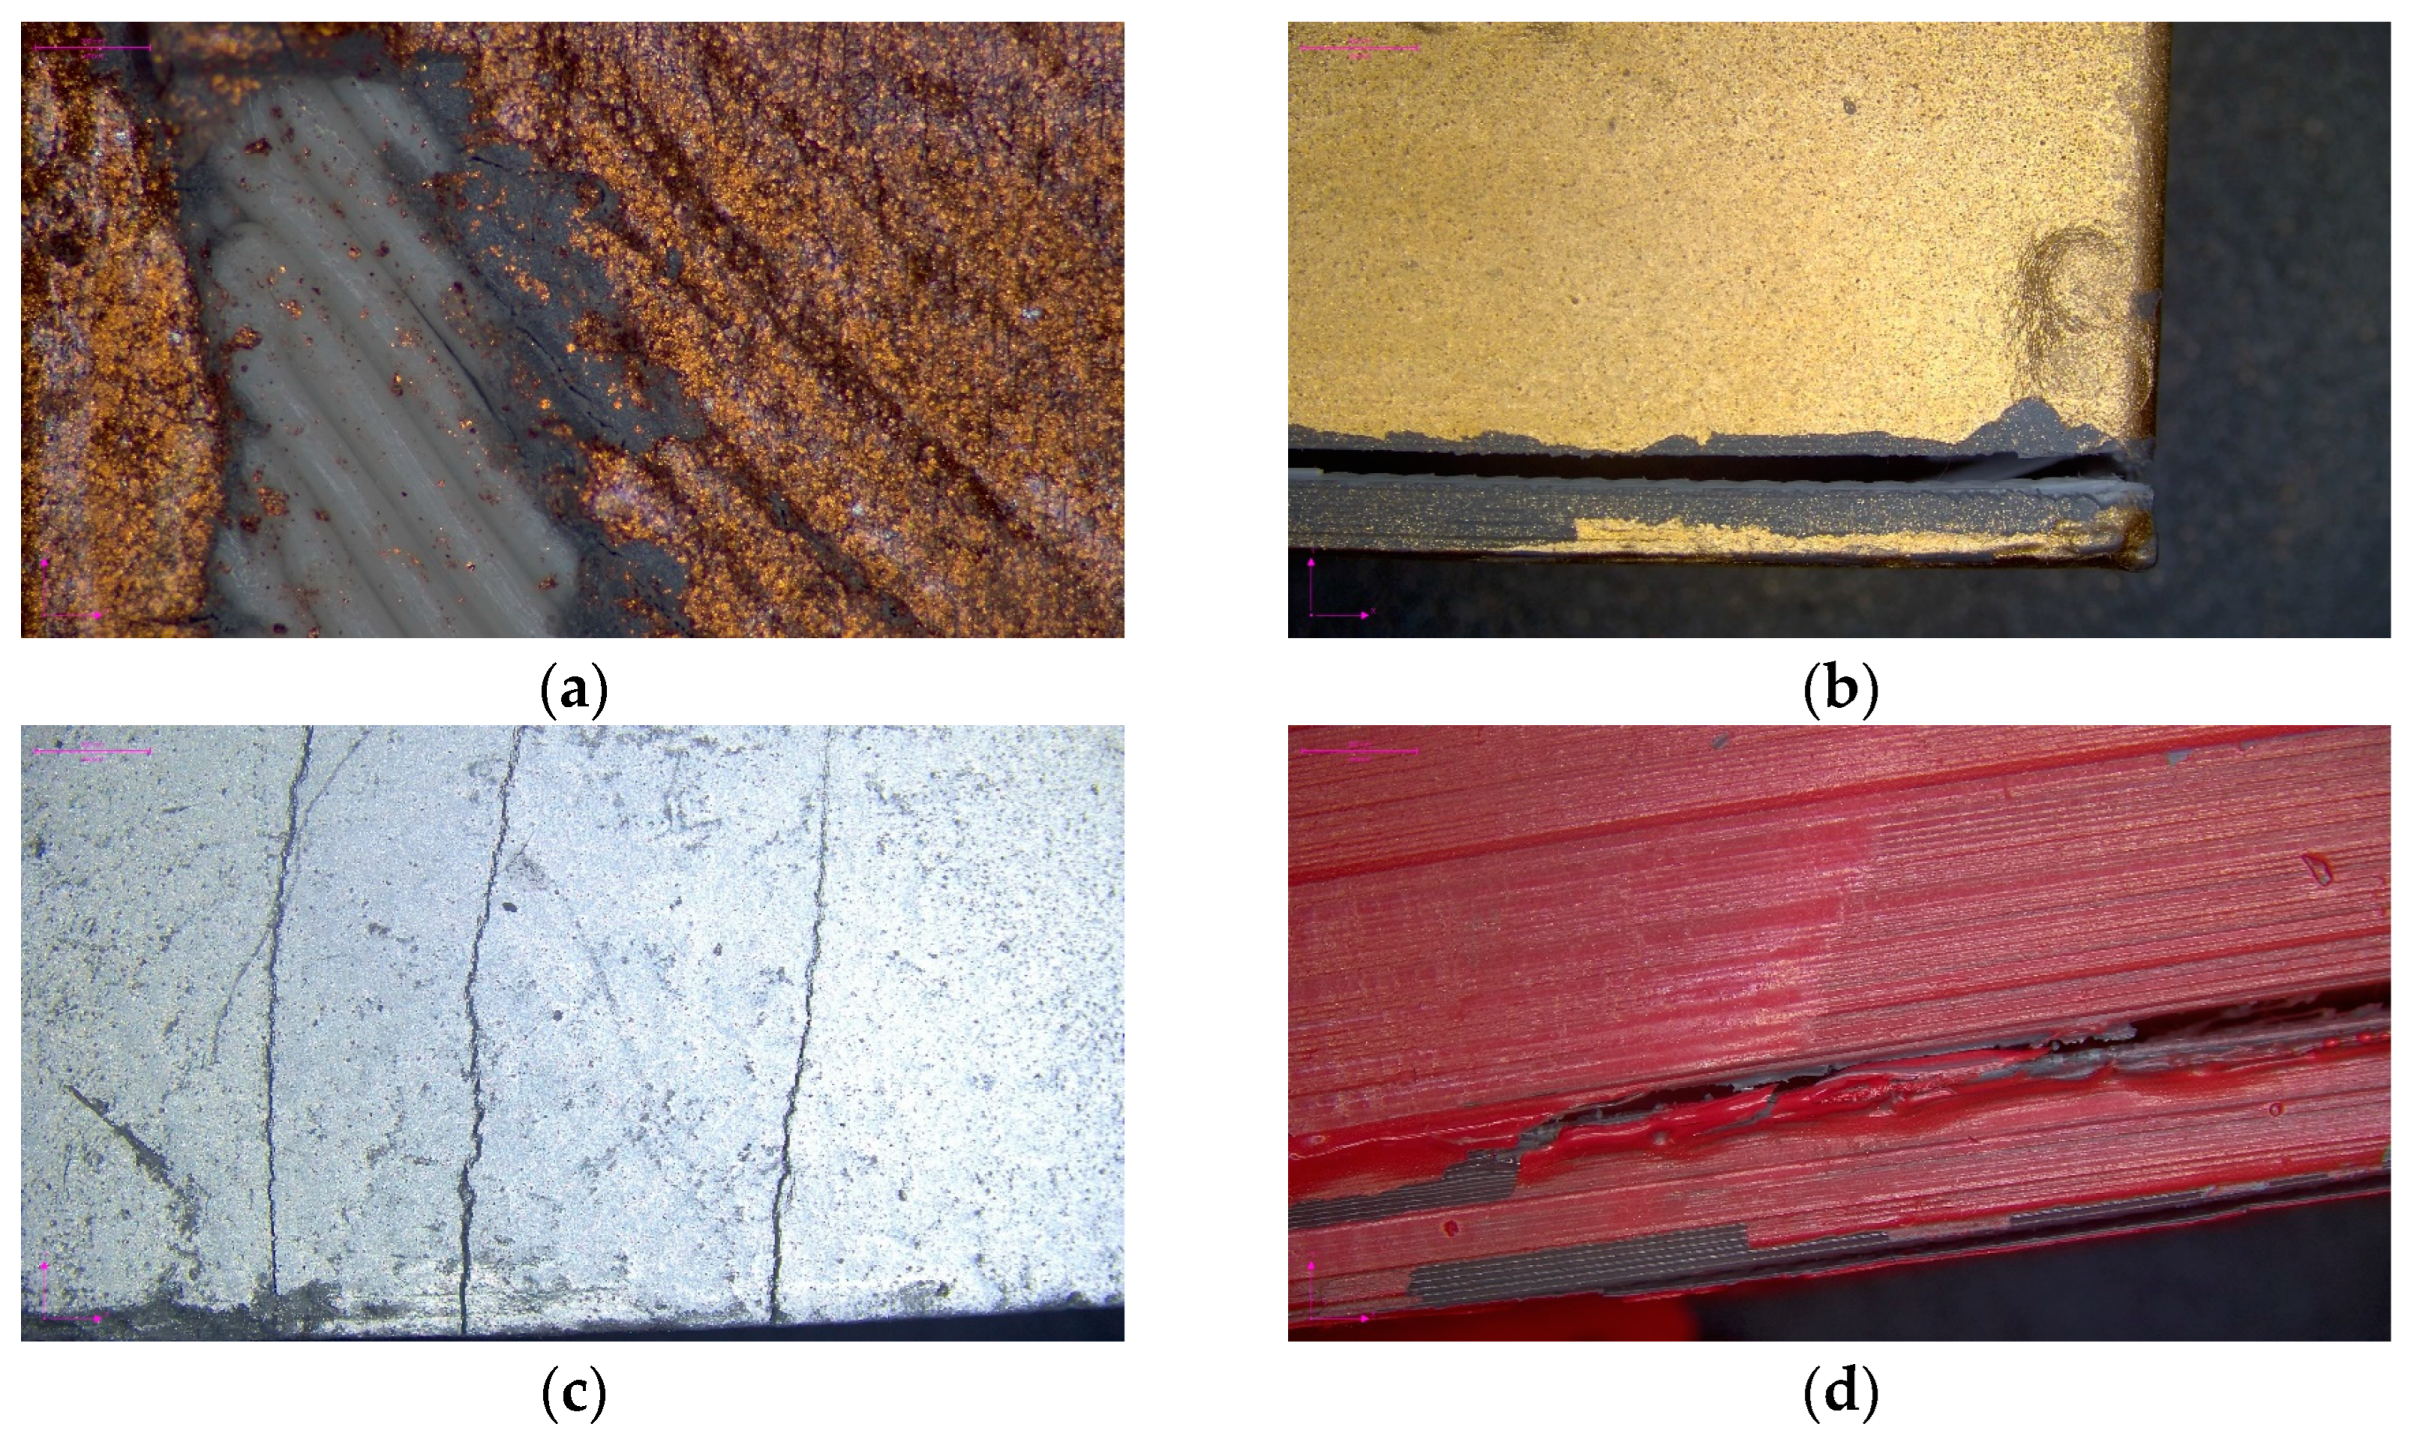
Figure 11 presents an examination of the elastic modulus, offering valuable insights into the material behavior. Notably, the outcomes of the compression tests exhibited similar trends. ASA and PLA demonstrated a commendable stability in their results, suggesting a consistent response within the elastic range. In contrast, PC/ABS and nylon exhibited a discernible size dependency in this domain. Delving specifically into the behavior of nylon, the high diameter-to-height ratio of the elastic modulus specimens, coupled with the inherent flexibility of the material, inclined towards the occurrence of significant deformations rather than an emphasis on sheer strength. This observation underscores the intricate interplay between material properties and structural response, shedding light on the nuanced behavior of different polymers under compression. When it came to PC/ABS, ASA, and PLA, an intriguing trend emerged. As the specimen dimensions expanded, there was a noticeable tendency towards a reduction in strength coupled with a decrease in ductility, leading to shorter post-peak strains. This intriguing behavior suggests that the size of the specimen plays a pivotal role in influencing its mechanical properties, an aspect that warrants further investigation and consideration in practical applications. Furthermore, the fracture patterns observed in these specimens closely mirrored those witnessed in their compression test counterparts, as illustrated in Figure 12. The presence of clearly identifiable interfacial failures highlights the critical role that is played by material interfaces in governing structural integrity and performance. Based on observations, a linear regression analysis was carried out to determine the initial slope of the specimen, which denotes the modulus of elasticity of specimens. The values for this parameter are given in Table 5. Needless to say, initiation of nonlinearity takes place earlier in larger specimens.
According to Figure 13, it is observed that moduli of elasticity values are mostly size-independent, with negligible differences as the size changes. It is crucial to note that parameters influencing the mechanical properties of 3D-printed polymers using the material extrusion technique run a wide gamut from the printer parameters, such as the size of the nozzle, printing speed, bed temperature, and nozzle temperature, to geometrical parameters such as the infill orientation angle, build orientation, and type of materials. An intricate interplay of the foregoing parameters along with the anisotropy of the material extrusion process introduced into the mechanical properties underlies the deviations in moduli of the elasticity of materials. This observation has also been reported by Zhang et al. [34]. However, their reports were based on values obtained from tensile tests, not from compression tests and specimens specifically recommended for this according to ASTM D695-15 [51].

3.4. Flexure Results

In Figure 14, a compelling illustration of the size effect in flexural specimens unfolds, offering valuable insights into the structural behavior of the materials under examination. Notably, as the size of the specimens increased, a corresponding augmentation in load-bearing capacity was observed, accentuating the pronounced strength disparities, particularly in the case of larger specimens. This intriguing observation prompts a deeper exploration into the underlying mechanisms governing the flexural behavior of these materials. Within this context, it is worth highlighting the performance of the PLA specimens, which emerged as the frontrunners in terms of flexural strength. The ASA, PC/ABS, and nylon specimens followed closely behind, exhibiting a commendable performance spectrum. This hierarchy can be attributed to the material’s inherent tensile strength characteristics, aligning with the established strength order. Given the pre-eminence of tensile behavior in the context of flexural loading, it is plausible to assert that the PLA specimens showcased a superior performance, surpassing their counterparts by a substantial margin, possibly by as much as 100%. A noteworthy fact of this investigation lies in the manner of specimen failure, characterized by a brittle mode of fracture. This initiation of flexural bottom-up cracks at the mid-span of the beam, followed by intricate entanglements of layers and filaments, paints a vivid picture of the intricate failure mechanisms at play. This detailed understanding not only deepens our comprehension of material behavior but also holds implications for designing and assessing structures that are subjected to flexural loading. In contrast, the nylon specimens presented a unique behavior. Their resistance to fracture under three-point loading can be attributed to the material’s highly ductile nature, which is particularly evident in tension. This divergence in behavior underscores the nuanced interplay between material properties and loading conditions, providing valuable insights for engineering applications. The fracture surface of these specimens, as depicted in Figure 15, serves as a visual testament to the intricate failure modes observed. The beam carries the load through tension in printing strips at the bottom and compression of strips on top. Failure initiated primarily from the interlayer bonding between filaments rather than the filaments themselves, indicating that the tensile strength of filaments is higher than that of the interlayer adhesion.
The scattering of strength becomes notably more pronounced in smaller specimens, a phenomenon that is closely linked to the microstructure of 3D-printed materials. The nonuniform distribution of material, a result of the 3D printing process, exerts a greater impact on smaller specimens, introducing heightened uncertainties in material strength. Conversely, larger specimens experience less influence from the printing method, resulting in a more uniform material distribution and consequently fewer uncertainties in material strength. This observation, which is consistent with the findings of Wu et al. [27], is reflected in Table 6 (lower SD values as the specimen becomes larger).
As depicted in Figure 16, the analysis revealed a nonmonotonic correlation between strength and size, featuring a local extremum. PC/ABS, PLA, and ASA exhibited a highly size-dependent behavior, while this was not the case for the ductile material of nylon, where size-effect variations were insignificant. Variations are such that in some cases, stress values in 3X specimens are comparable to those of 0.5X (i.e., the largest specimen). These findings suggest that designers of 3D-printed structures can optimize strength by incorporating a specific size constraint into the component design process. In cases where maintaining such a constraint proves challenging, designers should account for the size-dependent relationship to precisely predict the strength of 3D-printed components.

4. Concluding Remarks

This study embarked on an investigation into the effect of size, scrutinizing the influence of geometric dimensions on the mechanical behavior of four prominent types of widely employed three-dimensional (3D)-printable polymers: (1) polycarbonate acrylonitrile butadiene styrene (PC/ABS), (2) acrylonitrile-styrene-acrylate (ASA), (3) polylactic acid (PLA), and (4) polyamide (nylon). This study encompassed eight distinct sizes, ranging from 0.5X to 2.5X, tested under compression, elastic modulus, and tensile loadings. Furthermore, an examination in the realm of flexure tests extended to seven varying sizes, spanning from 1.0X to 3.0X. The notable findings of the present study are summarized below:
  • The abrupt and brittle nature of specimen failure was a common thread across all tested materials, except nylon. This deviation highlights the exceptional ductility of nylon, which is particularly evident in its response to applied stress during testing.
  • Anisotropy emerged as a significant characteristic, particularly conspicuous in compression and elastic modulus tests, with PC/ABS and nylon showcasing notable tendencies in this regard.
  • Examining the mechanical performance in detail, a discernible pattern emerges. PLA, PC/ABS, and ASA displayed a linear ascending branch followed by a sudden brittle failure. This contrasts starkly with the behavior of nylon, which exhibited a distinct response pattern.
  • The superior strength exhibited by PLA specimens relative to their counterparts is a noteworthy revelation, underlining the exceptional performance potential of this material. This could be attributed to its higher tensile strength in comparison to other materials.
  • Delving into the realm of tensile loading, an intriguing dual behavior emerged. While the ascending branch displayed isotropic characteristics, the strength values themselves exhibited a size-dependent tendency, revealing a nuanced interplay between material properties and loading conditions. As the specimens increase in size, the performance is influenced more by the overall integrity of the specimen rather than localized bonding deficiencies, resulting in lower standard deviation (SD) values. Put differently, the results obtained for larger specimens are more dependable. Additionally, the absorbed energy demonstrates a declining trend as the specimen size increases.
  • An intriguing facet of the failure mode was identified. Failures predominantly initiated in between layers, specifically at the interfaces, rather than within the layers themselves. This observation speaks volumes about the inherent strength of the filament relative to the interlayer bonds, shedding light on a crucial aspect of material behavior under stress.
  • It is hypothesized that during compression, smaller specimens with a reduced surface area allocate larger portions of their area to the load-bearing capacity, resulting in greater strain values. Essentially, more material is involved in supporting the load compared to larger specimens, where higher strains are concentrated. In this context, the fracture process zone (FPZ) introduced by Bažant and Kazemi [53] is relevant for explaining the size effect phenomenon, as the strength depends on the size ratio of the FPZ relative to the overall specimen size. This ratio is expected to be higher in smaller specimens, explaining their increased energy absorption and higher strength.
  • The modulus of elasticity was less affected by size variations.
  • Notably, the most pronounced size effect was observed in flexural tests. The examination unveiled a nonmonotonic association between strength and size, characterized by a local extremum. PC/ABS, PLA, and ASA demonstrated a pronounced dependence on size, in contrast to the ductile nature of nylon, where variations in size effects were negligible. These results imply that designers working on 3D-printed structures can enhance strength by integrating a defined size constraint into the component design process.
Based on the findings of this study, which need further investigation to ensure consistency, validity, and clarity, no generalizations can be made regarding the size-dependent properties of additively manufactured polymers that are fabricated using the material extrusion technique. To put it simply, while there were instances where the classic rule, often observed in conventional materials, held true—wherein strength exhibited a decline as size increased—no definitive overarching trend emerged to substantiate this observation conclusively. In summary, this study was a preliminary investigation into the size effect in additively manufactured polymers. It not only illuminates the intricate interplay between geometric dimensions and mechanical behavior but also emphasizes the need for caution in the design and assessment of structures utilizing these 3D-printable polymers for large-scale applications, urging further research.

Author Contributions

Conceptualization, H.S.; methodology, H.S. and B.D.; formal analysis, H.S. and B.D.; investigation, H.S. and B.D.; resources, M.P. and S.J.; data curation, M.P. and S.J.; writing—original draft preparation, H.S; writing—review and editing, J.H.Y.; supervision, J.H.Y.; funding acquisition, J.H.Y. All authors have read and agreed to the published version of the manuscript.

Funding

This research was partly supported by a grant (20014561) of the Regional Customized Disaster-Safety R&D Program, funded by the Ministry of Interior and Safety (MOIS, Republic of Korea).

Institutional Review Board Statement

Not applicable.

Informed Consent Statement

Not applicable.

Data Availability Statement

Data are contained within the article.

Conflicts of Interest

The authors declare no conflicts of interest.

References

  1. Villarreal, G.P.U.; Pereira, A.D.E.S.; de Freitas, R.R.M.; Moraes, M.C.B.; Sepulveda, A.F.; de Araujo, D.R.; Fraceto, L.F. Zein-based nanoformulations with encapsulated methyl salicylate incorporated in 3D printing biopolymer devices targeting potential uses in pest management. Colloids Surf. A Physicochem. Eng. Asp. 2023, 670, 131511. [Google Scholar] [CrossRef]
  2. Englezos, K.; Wang, L.; Tan, E.C.; Kang, L. 3D printing for personalised medicines: Implications for policy and practice. Int. J. Pharm. 2023, 635, 122785. [Google Scholar] [CrossRef]
  3. Bazli, M.; Ashrafi, H.; Rajabipour, A.; Kutay, C. 3D printing for remote housing: Benefits and challenges. Autom. Constr. 2023, 148, 104772. [Google Scholar] [CrossRef]
  4. Beetz, D.I.F.S. 3D Printing in the Automotive Industry. In Inkjet Printing in Industry: Materials, Technologies, Systems, and Applications; Wiley: Hoboken, NY, USA, 2022; Volume 3, pp. 1427–1460. [Google Scholar]
  5. Lau, I.; Sun, Z. The role of 3D printed heart models in immediate and long-term knowledge acquisition in medical education. Rev. Cardiovasc. Med. 2022, 23, 22. [Google Scholar] [CrossRef]
  6. Dobroś, K.; Hajto-Bryk, J.; Zarzecka, J. Application of 3D-printed teeth models in teaching dentistry students: A scoping review. Eur. J. Dent. Educ. 2023, 27, 126–134. [Google Scholar] [CrossRef]
  7. Fallacara, G.; Parisi, N. Additive manufacturing in architecture: 3D printing solutions for vaulted spaces. In Proceedings of the 75th RILEM Annual Week 2021: Advances in Sustainable Construction Materials and Structures, Merida, Mexico, 29 August—September 2021; Volume 40, p. 407. [Google Scholar]
  8. Yoha, K.S.; Moses, J.A. 3D Printing approach to valorization of agri-food processing waste streams. Foods 2023, 12, 212. [Google Scholar] [CrossRef]
  9. Košir, T.; Slavič, J. Modeling of single-process 3D-printed piezoelectric sensors with resistive electrodes: The low-pass filtering effect. Polymers 2023, 15, 158. [Google Scholar] [CrossRef]
  10. Singh, S.; Mali, H.S. 3D printed orthotic insoles for foot rehabilitation. In 3D Printing in Podiatric Medicine; Academic Press: Cambridge, MA, USA, 2023; pp. 211–219. [Google Scholar]
  11. Flauder, S.; Bombarda, I.; D’Ambrosio, R.; Langhof, N.; Lazzeri, A.; Krenkel, W.; Schafföner, S. Size effect of carbon fiber-reinforced silicon carbide composites (C/C-SiC): Part 2-tensile testing with alignment device. J. Eur. Ceramic Soc. 2022, 42, 1227–1237. [Google Scholar] [CrossRef]
  12. Ji, S.; Di, S.; Long, X. DEM Simulation of uniaxial compressive and flexural strength of sea ice: Parametric study. J. Eng. Mech. 2017, 143, C40160. [Google Scholar] [CrossRef]
  13. Dalli, D.; Varandas, L.; Scalici, T.; Arteiro, A.; Catalanotti, G. Exploiting intrinsic size effect to overcome specimen scaling limitations in fracture toughness characterisation of composite materials. Eng. Fract. Mech. 2023, 277, 108951. [Google Scholar] [CrossRef]
  14. Zhang, L.; Harrison, W.; Mehraban, S.; Brown, S.G.R.; Lavery, N.P. Size Effect on the post-necking behaviour of dual-phase 800 steel: Modelling and experiment. Materials 2023, 16, 1458. [Google Scholar] [CrossRef] [PubMed]
  15. Rahimidehgolan, F.; Altenhof, W. Compressive behavior and deformation mechanisms of rigid polymeric foams: A review. Compos. Part B Eng. 2023, 253, 110513. [Google Scholar] [CrossRef]
  16. Pathirage, M.; Tong, D.; Thierry, F.; Cusatis, G.; Grégoire, D.; Pijaudier-Cabot, G. Discrete modeling of concrete failure and size-effect. Theor. Appl. Fract. Mech. 2023, 124, 103738. [Google Scholar] [CrossRef]
  17. Wang, Y.; Wang, L.; Zhang, W.; Ma, G. Size effect of fractured rock mass based on 3D printed model testing. Rock Mech. Rock Eng. 2022, 55, 7005–7020. [Google Scholar] [CrossRef]
  18. Albayati, A.; Wang, Y.; Haynes, J. Size effect of hydrated lime on the mechanical performance of asphalt concrete. Materials 2022, 15, 3715. [Google Scholar] [CrossRef] [PubMed]
  19. Wang, G.; Najafi, F.; Ho, K.; Hamidinejad, M.; Cui, T.; Walker, G.C.; Singh, C.V.; Filleter, T. Mechanical size effect of free-standing nanoconfined polymer films. Macromolecules 2022, 55, 1248–1259. [Google Scholar] [CrossRef]
  20. Ziaee, M.; Crane, N.B. Binder jetting: A review of process, materials, and methods. Addit. Manuf. 2019, 28, 781–801. [Google Scholar] [CrossRef]
  21. Hamidi, F.; Aslani, F. Additive manufacturing of cementitious composites: Materials, methods, potentials, and challenges. Constr. Build. Mater. 2019, 218, 582–609. [Google Scholar] [CrossRef]
  22. Dunn, M.; Wheel, M. Size effect anomalies in the behaviour of loaded 3D mechanical metamaterials. Philos. Mag. 2020, 100, 139–156. [Google Scholar] [CrossRef]
  23. Muthukrishnan, S.; Kua, H.W.; Na Yu, L.; Chung, J.K.H. Fresh properties of cementitious materials containing rice husk ash for construction 3D printing. J. Mater. Civ. Eng. 2020, 32, 04020195. [Google Scholar] [CrossRef]
  24. Ma, S.; Kawashima, S. Investigating the working mechanisms of viscosity-modifying admixtures through rheological and water transport properties. J. Mater. Civ. Eng. 2020, 32, 04020195. [Google Scholar] [CrossRef]
  25. Mechtcherine, V.; Grafe, J.; Nerella, V.N.; Spaniol, E.; Hertel, M.; Füssel, U. 3D-printed steel reinforcement for digital concrete construction–Manufacture, mechanical properties and bond behaviour. Constr. Build. Mater. 2018, 179, 125–137. [Google Scholar] [CrossRef]
  26. Bell, D.; Siegmund, T. 3D-printed polymers exhibit a strength size effect. Addit. Manuf. 2018, 21, 658–665. [Google Scholar] [CrossRef]
  27. Wu, C.; Chen, C.; Cheeseman, C. Size effects on the mechanical properties of 3D printed plaster and PLA parts. J. Mater. Civ. Eng. 2021, 33, 04021152. [Google Scholar] [CrossRef]
  28. Elmrabet, N.; Siegkas, P. Dimensional considerations on the mechanical properties of 3D printed polymer parts. Polym. Test. 2020, 90, 106656. [Google Scholar] [CrossRef]
  29. ISO 527-1; Plastics—Determination of Tensile Properties—Part 1: General Principles. 3rd Edition, Technical Committee: ISO/TC 61/SC 2 Mechanical Behavior, ICS: 83.080.01 Plastics in General. International Organization for Standardization: Geneva, Switzerland, 2019. Available online: www.iso.org (accessed on 17 October 2023).
  30. ISO 37; Rubber, Vulcanized or Thermoplastic—Determination of Tensile Stress-Strain Properties, Technical Committee: ISO/TC 45/SC 2 Testing and Analysis, ICS: 83.060 Rubber. International Organization for Standardization: Geneva, Switzerland, 2017. Available online: www.iso.org (accessed on 17 October 2023).
  31. Nurizada, A.; Kirane, K. Induced anisotropy in the fracturing behavior of 3D printed parts analyzed by the size effect method. Eng. Fract. Mech. 2020, 239, 107304. [Google Scholar] [CrossRef]
  32. Yao, T.; Deng, Z.; Zhang, K.; Li, S. A method to predict the ultimate tensile strength of 3D printing polylactic acid (PLA) materials with different printing orientations. Compos. Part B Eng. 2019, 163, 393–402. [Google Scholar] [CrossRef]
  33. Guessasma, S.; Belhabib, S.; Nouri, H.; Hassana, O.B. Anisotropic damage inferred to 3D printed polymers using fused dep-osition modelling and subject to severe compression. Eur. Polym. J. 2016, 85, 324–340. [Google Scholar] [CrossRef]
  34. Zhang, G.; Wang, Q.; Ni, Y.; Liu, P.; Liu, F.; Leguillon, D.; Xu, L.R. A systematic investigation on the minimum tensile strengths and size effects of 3D printing polymers. Polym. Test. 2023, 117, 107845. [Google Scholar] [CrossRef]
  35. Ng, F.L.; Tran, T.Q.; Liu, T. A methodology to develop part acceptance criteria model using non-destructive inspection technique for FDM printed part. Mater. Today Proc. 2022, 70, 310–316. [Google Scholar] [CrossRef]
  36. Naughton, P.; Rudert, K. Improved car seats by blow-moulded plastic seat-back design. ATZ Worldw. 2006, 108, 9. [Google Scholar] [CrossRef]
  37. Meng, Z.H.; Guo, W.; Wei, X.B. Comparative analysis of automotive interior trim materials based on moldflow. Appl. Mech. Mater. 2012, 117–119, 1496–1500. [Google Scholar] [CrossRef]
  38. Govindaraj, K.; Balaji, K.V.; Vimalathithan, M.; Samir, G.; Rajesh, L. Mold in Color Diamond White ASA Material for Automotive Exterior Application (No. 2019-28-2562); SAE Technical Paper: Brisbane, Australia, 2019. [Google Scholar]
  39. Mubaraki, M.; Ali, S.I.A.; Ismail, A.; Yusoff, N.I.M. Rheological evaluation of asphalt cements modified with ASA polymer and Al2O3 nanoparticles. Procedia Eng. 2016, 143, 1276–1284. [Google Scholar] [CrossRef]
  40. Is Recycling PLA Really Better than Composting? Online News Post. Available online: https://3dprintingindustry.com/news/is-recycling-pla-really-better-than-composting-49679 (accessed on 17 October 2023).
  41. Vink, E.T.H.; Rábago, K.R.; Glassner, D.A.; Gruber, P.R. Applications of life cycle assessment to NatureWork polylactide (PLA) production. Polym. Degrad. Stab. 2003, 80, 403–419. [Google Scholar] [CrossRef]
  42. Skoratko, A.; Katzer, J. Harnessing 3D printing of plastics in construction—Opportunities and limitations. Materials 2021, 14, 4547. [Google Scholar] [CrossRef] [PubMed]
  43. Murad, Y.; Alseid, B. Poly-lactic acid and carbon fibers 3D printed bars for seismic retrofitting RC beam-to-column joints subjected to elevated temperature. Structures 2022, 43, 1530–1547. [Google Scholar] [CrossRef]
  44. Garrido, R.; Cabeza, L.F.; Falguera, V.; Navarro, O.P. Potential Use of Cow Manure for Poly(Lactic Acid) Production. Sustainability 2022, 14, 16753. [Google Scholar] [CrossRef]
  45. Mecheter, A.; Tarlochan, F. Fused Filament Fabrication Three-Dimensional Printing: Assessing the Influence of Geometric Complexity and Process Parameters on Energy and the Environment. Sustainability 2023, 15, 12319. [Google Scholar] [CrossRef]
  46. Fonseca, A.; Ramalho, E.; Gouveia, A.; Figueiredo, F.; Nunes, J. Life Cycle Assessment of PLA Products: A Systematic Literature Review. Sustainability 2023, 15, 12470. [Google Scholar] [CrossRef]
  47. Mak, S.L.; Wu, M.Y.T.; Chak, W.Y.; Kwong, W.K.; Tang, W.F.; Li, C.H.; Lee, C.C.; Li, C.Y. A Review of the Feasibility of Producing Polylactic Acid (PLA) Polymers Using Spent Coffee Ground. Sustainability 2023, 15, 13498. [Google Scholar] [CrossRef]
  48. Amel, H.; Rongong, J.; Moztarzadeh, H.; Hopkinson, N. Effect of section thickness on fatigue performance of laser sintered nylon 12. Polym. Test. 2016, 53, 204–210. [Google Scholar] [CrossRef]
  49. Letzelter, E.; Guingand, M.; De Vaujany, J.P.; Schlosser, P. A new experimental approach for measuring thermal behaviour in the case of nylon 6/6 cylindrical gears. Polym. Test. 2010, 29, 1041–1051. [Google Scholar] [CrossRef]
  50. ASTM D638; Standard Test Method for Tensile Properties of Plastics. Book of Standards Volume: 08.01; Developed by Sub-Committee: D20.10; ICS Code: 83.080.01. ASTM International: West Conshohocken, PA, USA, 2022.
  51. ASTM D695; Standard Test Method for Compressive Properties of Rigid Plastics Book of Standards Volume: 08.01; Developed by Subcommittee: D20.10; ICS Code: 83.080.01. ASTM International: West Conshohocken, PA, USA, 2015.
  52. ASTM D6272; Standard Test Method for Flexural Properties of Unreinforced and Reinforced Plastics and Electrical Insulating Materials by Four-Point Bending. Book of Standards Volume: 08.03; Developed by Subcommittee: D20.10; ICS Code: 29.035.20; 83.080.01. ASTM International: West Conshohocken, PA, USA, 2017.
  53. Bažant, Z.P.; Kazemi, M.T. Determination of fracture energy, process zone longth and brittleness number from size effect, with application to rock and conerete. Int. J. Fract. 1990, 44, 111–131. [Google Scholar] [CrossRef]
Figure 1. PC/ABS specimens for (a) tension, (b) compression, (c) elastic modulus, and (d) flexure.
Sustainability 16 00356 g001
Figure 2. ASA specimens for (a) tension, (b) compression, (c) elastic modulus, and (d) flexure.
Sustainability 16 00356 g002
Figure 3. PLA specimens for (a) tension, (b) compression, (c) elastic modulus, and (d) flexure.
Sustainability 16 00356 g003
Figure 4. Nylon specimens for (a) tension, (b) compression, (c) elastic modulus, and (d) flexure.
Sustainability 16 00356 g004
Figure 5. Tensile test results: (a) PC/ABS, (b) ASA, (c) PLA, and (d) nylon.
Sustainability 16 00356 g005aSustainability 16 00356 g005b
Figure 6. Fractured specimens under tension: (a) PC/ABS, (b) ASA, (c) PLA, and (d) nylon.
Sustainability 16 00356 g006
Figure 7. Size effect of various 3D-printed polymers in tension.
Sustainability 16 00356 g007
Figure 8. Compression test results: (a) PC/ABS, (b) ASA, (c) PLA, and (d) nylon.
Sustainability 16 00356 g008
Figure 9. Fractured specimens under compression: (a) PC/ABS, (b) ASA, (c) PLA, and (d) nylon.
Sustainability 16 00356 g009
Figure 10. Size effect of various 3D-printed polymers in compression.
Sustainability 16 00356 g010
Figure 11. Elastic modulus test results: (a) PC/ABS, (b) ASA, (c) PLA, and (d) nylon.
Sustainability 16 00356 g011aSustainability 16 00356 g011b
Figure 12. Fractured specimens under elastic modulus test: (a) PC/ABS, (b) ASA, (c) PLA, and (d) nylon.
Sustainability 16 00356 g012
Figure 13. Size effect of various 3D-printed polymers for modulus of elasticity.
Sustainability 16 00356 g013
Figure 14. Flexural test results: (a) PC/ABS, (b) ASA, (c) PLA, and (d) nylon.
Sustainability 16 00356 g014
Figure 15. Fracture of specimens under flexure: (a) PC/ABS, (b) ASA, (c) PLA, and (d) nylon.
Sustainability 16 00356 g015
Figure 16. Size effect of various 3D-printed polymers in flexure.
Sustainability 16 00356 g016
Table 1. Printing parameters for each polymer.
MaterialDensity (g/cm3)Nozzle
Temperature (°C)
Bed
Temperature (°C)
PC/ABS1.10260105
ASA 1.07260100
PLA 1.2421560
Polyamide (nylon)1.01255100
Printing speed for all specimens was 53 mm/s. Diameter of all filaments was 1.75 mm. Layer width in all specimens was 0.2 mm; nozzle diameter was 0.4 mm.
Table 2. Types of mechanical loadings and dimensions of specimens.
Test 1 X Size (mm)Specimen Sizes
Tensile—ASTM D638-22 [50]Specimen Type II (l: 183)0.5 X –0.75 X –1 X 1.25 X 1.5 X 1.75 X 2 X 2.5 X
Compression—ASTM D695-15 [51]W × d × l: 12.7 × 12.7 × 25.40.5 X 0.75 X 1 X 1.25 X 1.5 X 1.75 X 2 X 2.5 X
Elastic modulus—ASTM D695-15 [51]W × d × l: 12.7 × 12.7 × 50.80.5 X 0.75 X 1 X 1.25 X 1.5 X 1.75 X 2 X 2.5 X
Flexure—ASTM D6272-17 [52]W × d × l: 12 × 4 × 80, S : 64 1 X 1.25 X 1.5 X 1.75 X 2 X 2.5 X 3 X
Thickness of the tensile specimen is 3.2 mm. W × d × l: width × depth × length, S: clear span; X: magnification factor.
Table 3. Tensile test results.
Specimen IDTension A b s o r b e d   E n e r g y T P e a k
Peak StrainPeak Stress ± SD (MPa) N . m m
PC/ABS-0.5X0.077855.2120 ± 2.712.5131
PC/ABS-0.75X0.080350.5110 ± 2.432.38108
PC/ABS-1X0.082848.3519 ± 2.042.37244
PC/ABS-1.25X0.082446.9998 ± 1.872.39724
PC/ABS-1.5X0.104445.5095 ± 1.643.11441
PC/ABS-1.75X0.092243.4549 ± 1.052.5588
PC/ABS-2X0.088341.9903 ± 0.752.37539
PC/ABS-2.5X0.082638.1276 ± 0.542.01147
ASA-0.5X0.044843.3089 ± 2.021.00589
ASA-0.75X0.046540.7120 ± 2.011.03037
ASA-1X0.042635.8206 ± 1.880.83513
ASA-1.25X0.041033.4997 ± 1.740.76811
ASA-1.5X0.036331.2675 ± 1.320.63481
ASA-1.75X0.040730.1234 ± 1.210.71767
ASA-2X0.045129.7052 ± 0.980.78457
ASA-2.5X0.043125.7492 ± 0.760.69454
PLA-0.5X0.051761.0224 ± 3.011.54912
PLA-0.75X0.050753.9398 ± 2.281.41441
PLA-1X0.048751.8098 ± 2.111.31708
PLA-1.25X0.049549.6304 ± 1.881.38744
PLA-1.5X0.053048.7510 ± 1.341.41017
PLA-1.75X0.059246.1234 ± 1.121.607
PLA-2X0.053844.8028 ± 0.941.3569
PLA-2.5X0.058140.6771 ± 0.531.36561
NYLON-0.5X4.132043.9991 ± 2.10143.10031
NYLON-0.75X3.800838.6681 ± 1.89121.80686
NYLON-1X3.690936.9330 ± 1.75100.49585
NYLON-1.25X2.915832.4276 ± 1.3271.81942
NYLON-1.5X3.345930.8783 ± 1.2174.9468
NYLON-1.75X2.109127.4480 ± 0.9842.67815
NYLON-2X1.845525.4888 ± 0.7634.678
NYLON-2.5X1.476423.2169 ± 0.4925.26962
Table 4. Compression test results.
Specimen IDCompression
Peak StrainPeak Stress ± SD (MPa)
PC/ABS-0.5X0.116955.0104 ± 1.70
PC/ABS-0.75X0.124550.6436 ± 1.54
PC/ABS-1X0.157444.6432 ± 1.23
PC/ABS-1.25X0.061639.5815 ± 1.12
PC/ABS-1.5X0.068936.0704 ± 0.78
PC/ABS-1.75X0.037026.3288 ± 0.50
PC/ABS-2X0.030922.8352 ± 0.32
PC/ABS-2.5X0.028119.3911 ± 0.12
ASA-0.5X0.354845.1741 ± 1.61
ASA-0.75X0.325741.5776 ± 1.43
ASA-1X0.332138.9494 ± 1.21
ASA-1.25X0.316336.9471 ± 0.98
ASA-1.5X0.244734.7739 ± 0.54
ASA-1.75X0.284732.1476 ± 0.32
ASA-2X0.207130.5418 ± 0.28
ASA-2.5X0.221829.6770 ± 0.14
PLA-0.5X0.065794.9714 ± 4.02
PLA-0.75X0.056384.9381 ± 3.98
PLA-1X0.051082.8473 ± 3.21
PLA-1.25X0.047182.3288 ± 3.11
PLA-1.5X0.043780.9809 ± 3.01
PLA-1.75X0.043076.0557 ± 2.78
PLA-2X0.035764.0457 ± 2.52
PLA-2.5X0.032658.5110 ± 2.43
NYLON-0.5X0.666876.2642 ± 2.12
NYLON-0.75X0.510963.4428 ± 2.01
NYLON-1X0.574760.8946 ± 1.98
NYLON-1.25X0.547057.7265 ± 1.54
NYLON-1.5X0.572749.6329 ± 1.21
NYLON-1.75X0.526747.7792 ± 1.04
NYLON-2X0.526740.3372 ± 0.98
NYLON-2.5X0.526735.4255 ± 0.65
Table 5. Modulus of elasticity results based on regression analysis ( y = a + b x ).
Specimen IDa b   ( × 10 3 ) = E R 2
PC/ABS-0.5X−1.77452.03810.9979
PC/ABS-0.75X−2.39742.06800.9947
PC/ABS-1X−2.32902.05120.9966
PC/ABS-1.25X−0.73271.81210.9968
PC/ABS-1.5X−1.67581.85750.9963
PC/ABS-1.75X−0.16341.73150.9932
PC/ABS-2X0.21151.52400.9959
PC/ABS-2.5X0.34401.38500.9949
ASA-0.5X−2.28481.39780.9971
ASA-0.75X−0.71381.21630.9983
ASA-1X−1.21411.24060.9973
ASA-1.25X−1.81071.28710.9951
ASA-1.5X−1.50371.27090.9975
ASA-1.75X−1.37701.24470.9958
ASA-2X−1.54981.25730.9902
ASA-2.5X−1.07531.24430.9956
PLA-0.5X−2.86102.55640.9977
PLA-0.75X−6.01862.57790.9929
PLA-1X−4.91472.53130.9981
PLA-1.25X−8.55652.64290.9906
PLA-1.5X−7.36152.63630.9942
PLA-1.75X−8.77252.53370.9925
PLA-2X−7.06752.55950.9933
PLA-2.5X−7.44742.38810.9861
NYLON-0.5X0.71161.30900.9988
NYLON-0.75X−0.062771.32330.9998
NYLON-1X2.68801.11360.9911
NYLON-1.25X−2.06921.39500.9983
NYLON-1.5X−0.06011.31930.9978
NYLON-1.75X0.65761.24330.9929
NYLON-2X−0.42431.33100.9992
NYLON-2.5X−1.50341.45360.9982
Table 6. Flexural test results.
Specimen IDFlexural Strength ± SD (MPa)
PC/ABS-1X59.8800 ± 2.81
PC/ABS-1.25X55.6096 ± 2.33
PC/ABS-1.5X79.2864 ± 3.65
PC/ABS-1.75X53.5673 ± 2.12
PC/ABS-2X55.8600 ± 2.34
PC/ABS-2.5X39.7608 ± 1.75
PC/ABS-3X41.6425 ± 1.21
ASA-1X59.5050 ± 2.54
ASA-1.25X68.0704 ± 3.01
ASA-1.5X56.9556 ± 2.01
ASA-1.75X39.3796 ± 1.88
ASA-2X47.1610 ± 1.43
ASA-2.5X59.4080 ± 2.21
ASA-3X47.4764 ± 2.01
PLA-1X89.9360 ± 2.20
PLA-1.25X107.8720 ± 2.01
PLA-1.5X109.6378 ± 1.87
PLA-1.75X108.2857 ± 1.75
PLA-2X85.9800 ± 1.35
PLA-2.5X114.5382 ± 0.95
PLA-3X96.8945 ± 0.66
NYLON-1X35.0450 ± 1.51
NYLON-1.25X22.3520 ± 1.01
NYLON-1.5X19.8511 ± 0.98
NYLON-1.75X19.5086 ± 0.88
NYLON-2X17.2500 ± 0.76
NYLON-2.5X15.5384 ± 0.43
NYLON-3X19.4093 ± 0.21
Disclaimer/Publisher’s Note: The statements, opinions and data contained in all publications are solely those of the individual author(s) and contributor(s) and not of MDPI and/or the editor(s). MDPI and/or the editor(s) disclaim responsibility for any injury to people or property resulting from any ideas, methods, instructions or products referred to in the content.