Abstract
This study aims to compare the effectiveness of renewable energy and circular economy practices in reducing environmental damage and poverty in China and the European Union (EU) by using the Autoregressive Distributed Lag (ARDL) approach and the Vector Error Correction Model (VECM) technique. Analyzing data from 1995 to 2022, we compared the effectiveness of these approaches in both regions. This study offers several fresh perspectives on the fight against environmental damage and poverty, differentiating itself from existing research in a few key ways. In fact, most studies focus on a single region’s approach to sustainability. However, this research directly compares China and the European Union (EU), highlighting how factors like economic structure and development stages influence the effectiveness of renewable energy and circular economy practices. Also, this study shows how renewable energy and circular practices can simultaneously tackle both environmental damage (emissions) and social issues (poverty). Our findings reveal that factors like poverty, fossil fuel reliance, economic growth, and international trade all contribute to rising carbon emissions in both China and the EU, though their influence varies. Interestingly, China experienced greater success in curbing emissions through solar power, circular economy measures, and wind power compared to the EU. Additionally, the impact of these strategies on poverty reduction differed significantly between the two regions. Based on these results, we recommend that policy makers in both regions develop tailored strategies for tackling carbon emissions and poverty. Prioritizing renewable energy sources and circular practices is key, as they can simultaneously reduce emissions and alleviate poverty. However, it is crucial to focus on approaches that work best in each specific region, considering social, economic, and environmental factors. This study suggests that a one-size-fits-all approach will not work for fighting climate change and poverty. While renewable energy and circular economies are effective, China saw greater success with solar and wind power compared to the EU. Policy makers need to design strategies specific to their region’s economic, social, and environmental context. Further research can refine these approaches, and public education is crucial to promote sustainable behavior and empower policy makers. It is also needed to refine and improve the implementation of these strategies. Finally, public awareness and education are essential to promote sustainable behavior and empower policy makers in their fight against climate change and poverty. This study highlights the importance of a region-specific approach to energy transition and poverty alleviation. By comparing China and the EU, we gain valuable insights into the effectiveness of different strategies in tackling these interconnected challenges. The findings provide valuable guidance for policy makers looking to create a more sustainable and equitable future.
1. Introduction
In the current era, humanity is facing numerous economic and social challenges that have a detrimental impact on the standard of living and can even lead to fatalities. Poverty is one of the most significant issues, with over 9 percent of the global population living in extreme poverty, earning less than USD 1.9 per day, according to [1]. An outline of the European Union’s concept of poverty may be found in [2] ‘The SAGE Encyclopedia of World Poverty’. According to the European Union, a person or household is considered to be in poverty if their income is below a specific level when compared to the national average. This method seeks to quantify deprivation in relation to the average living standards by concentrating on the distribution of income within a community. Furthermore, the EU measures poverty using a multifaceted methodology that takes into account elements including material deprivation, low labor intensity, and social isolation. With this broad view, policy makers can address different aspects of poverty and create focused actions to reduce it in EU member states”.
However, this situation has been exacerbated in recent times due to climate change caused by rising carbon dioxide levels and environmental pollution. As a result, temperatures have increased by 0.9 °C since the 18th century and continue to rise at a rate of 0.14 °F per decade for sea surface temperature, as reported by the National Oceanic and Atmospheric Administration (NOAA) and the Environmental Protection Agency (EPA) in 2022. This temperature increase adversely affects agriculture and food security in many regions worldwide through a reduction in agricultural areas, an increase in desertification, drying up of lakes, and decreased water levels in rivers. Recently, countries such as Iraq, China, Germany, Portugal, France and Italy have experienced these negative impacts.
To confront climate change and reduce its effects, many countries have rushed to find solutions and strategies for the medium and long term. Most of these solutions are based on reducing dependence on traditional energy sources such as oil and coal, and replacing them gradually with renewable energy sources that are less expensive and preserve the environment. Additionally, circular economics is emerging as a solution to reduce the quantities of waste discharged into the environment and reuse it in industrial circuits. Circular economics is also considered a source of income for many people and families, especially in poor and developing countries. It enables the wise use of limited resources and reduces pollution. Therefore, How do economic structure and development stage influence the effectiveness of renewable energy and circular economy practices in reducing environmental damage and poverty in China compared to the EU? Can renewable energy and circular economies be implemented to simultaneously address environmental damage (CO2 emissions) and social issues (poverty) in both China and the EU? To answer these questions empirically, many authors attempt to find solutions.
This study’s originality lies in its comparative analysis of China and the EU. While research exists on renewable energy, circular economy, and their impact on poverty and emissions, focusing on these factors in both regions and comparing their effectiveness is a fresh contribution. The research combines analysis of both environmental damage (CO2 emissions) and poverty reduction, offering a more comprehensive picture of the impact of renewable energy and circular economy practices. By highlighting the different effectiveness of these strategies in China vs. EU, this study provides valuable insights for policy makers in each region. This knowledge can inform the development of more targeted and successful policies for tackling poverty and climate change. While existing research explores renewable energy, circular economies, and their impact on poverty and emissions, it often focuses on single regions. This study explains that a crucial gap exists—understanding how these strategies work across different contexts. China and the EU, as major global energy consumers with distinct economic structures and development stages, present a unique opportunity for comparison. By analyzing both regions, this study sheds light on how these factors influence the effectiveness of sustainability efforts. This comparative approach is significant because it allows us to move beyond a one-size-fits-all mentality. By seeing how China and the EU achieved varying success with similar strategies, policy makers gain valuable insights. This knowledge empowers them to design targeted approaches that consider their region’s specific social, economic, and environmental landscape, ultimately leading to a more effective fight against climate change and poverty.
The goal of this study is to detect the relationships between the indicated variables through a comparative study between two major industrial and energy consuming poles in the world (China and the European Union (EU)) based on the simultaneous equations by using the ARDL (Autoregressive Distributed Lag) and the VECM (Vector Error Correction Model).
The research design focuses on examining the potential of renewable energy and circular economy for reducing environmental damage and poverty. It try to explicitly address the direction of causality. For example, does reducing environmental damage necessarily lead to poverty reduction, or vice versa? Are there other factors at play? Also, the research mentions using the ARDL and VECM techniques, which are good for analyzing relationships between variables. However, the research looks at China and the EU as a whole. though, both regions have significant internal economic and development variations. The impact of renewable energy and circular economy policies might differ across provinces in China or member states in the EU. To sum up, this study focuses on the effectiveness of renewable energy and circular economies in tackling two major challenges: poverty and environmental degradation. The unique aspect lies in comparing these strategies in China and the EU, two significant global energy consumers. Previous research has explored these themes, but this study is the first to directly compare their effectiveness across these regions. By employing ARDL and VECM analysis, this study goes beyond simply identifying correlations and aims to determine the direction of causality between these factors. While recognizing the internal economic variations within each region, this study offers valuable insights for policy makers, nonetheless, allowing them to develop more targeted strategies for their specific contexts. The ARDL methodology and the VECM technique are two econometric methods for analyzing time series data. Because of their unique advantages, these methods may be used to investigate the connections between trade openness, gross domestic product (GDP), poverty, renewable energy, the circular economy, and the use of fossil fuels. The ARDL technique is essentially a versatile method for cointegration analysis. First of all, it works well with mixed integration; in fact, it performs best with variables that may have a variety of integration orders, some of which may be stationary (constant variance over time) at level (I(0)) or after one differentiating (I(1)). This is perfect for your research because poverty, economic variables (GDP, trade openness), and the use of fossil fuels or renewable energy sources may both be I(0) or I(1).
Second, the ARDL method is very helpful when dealing with sparse data, which is a typical problem in economic and environmental studies. This is due to the fact that it is effective with smaller datasets as it integrates the estimation of long-run cointegration and short-run dynamics in a single step. Finally, limits testing a statistical method to ascertain if a cointegrating relationship between the variables exists is made possible by the ARDL. This makes it easier to determine if these elements are in long-term balance. Nonetheless, the VECM method makes the assumption that the variables are already cointegrated. This might not be the best option for our study at first since, before employing the VECM, we need to verify cointegration using tests like Johansen’s cointegration test. Emphasis on short-run dynamics: the VECM is particularly good at examining the short-run dynamics between the variables after cointegration has been achieved. It illustrates the process by which temporal deviations from the long-run equilibrium represented by the cointegrating equation are adjusted. This is useful in understanding the potential short-term effects on poverty or GDP of changes in trade openness or the uptake of renewable energy. The Error Correction Mechanism (ECM) term included in the VECM provides flexibility by explaining the pace and amount at which the variables return to their long-term equilibrium connection. This offers insightful information on the system’s capacity for self-correction. In conclusion, ARDL and the VECM may be applied in turn to thoroughly examine the relationships in your study: to begin, use ARDL;to check for cointegration among the variables, use ARDL. If there is cointegration, move forward with the VECM: Use the VECM to learn more about the short-run dynamics and how these variables move towards their long-run equilibrium if ARDL verifies cointegration. Combining these techniques gives you a comprehensive grasp of this complicated system’s short-term modifications as well as its long-term stable linkages. In conclusion, ARDL’s flexibility with mixed integration and small samples makes it a great starting point. If cointegration is confirmed, the VECM provides valuable insights into the short-run dynamics, allowing you to paint a comprehensive picture of how poverty, renewable energy, the circular economy, fossil fuel consumption, GDP, and trade openness interact with each other.
This essay explores the complex interrelationships between environmental and economic variables that influence global trends. The main areas of interest for us are the relationships between poverty, the use of renewable energy sources like wind and solar power, the adoption of a circular economy that reduces waste and fossil fuel consumption, economic growth (measured by GDP), and trade openness. The following is, in essence, the primary research question: Is it possible to promote the shift to renewable energy sources, a circular economy, and more trade openness while also reducing CO2 emissions and achieving sustainable development, which is defined by economic growth, poverty reduction, and environmental responsibility?
In actuality, this paper’s structure is as follows: The research techniques used in this study are described in the Methodology and Data section. It is necessary to go over the procedures for gathering the data, the particular variables that were examined (CO2 emissions, rates of poverty, the capacity of solar and wind power, indicators of the circular economy, the consumption of fossil fuels, GDP, and trade openness data), and the econometric methods that were employed to look at the correlations between these variables.
The Results and Discussion section delves into this study’s core findings. It explores the statistical relationships between trade openness, GDP, poverty, renewable energy sources, the circular economy, and CO2 emissions. This section analyzes the interplay between these variables and assesses the potential for focused policy measures to achieve sustainable development. Finally, the Conclusion and Policy Implications section summarizes the key findings. It discusses the policy implications of the research, proposing potential strategies for utilizing renewable energy, a circular economy, and increased trade openness to promote economic growth, combat poverty, and reduce CO2 emissions. The conclusion emphasizes the need for a comprehensive approach that addresses these interconnected issues holistically.
2. Literature Review
Our research tackles shortcomings in our understanding of renewable energy, circular economy, and their impacts on poverty and CO2 emissions. Existing studies often overlook significant regional variations, focusing on general trends. This research addresses this gap by using a comparative approach between China and the EU, highlighting the need for region-specific policies. Additionally, while prior research acknowledges the potential of renewable energy and circular economy practices, the degree of effectiveness remains unclear. This study employs ARDL models to quantify the impact of these practices on both CO2 emissions and poverty reduction in each region. Furthermore, existing research primarily focuses on individual countries or regions. This research emphasizes the importance of knowledge sharing between China and the EU to accelerate progress in tackling shared sustainability challenges. The theoretical framework of sustainable development, recognizing the interconnectedness of environmental and socioeconomic factors, guides this research. This framework informs the methodology in several ways. The bounds test and ARDL models identify long-run relationships between variables, aligning with the theory of lasting connections between poverty, CO2 emissions, and sustainability practices. Additionally, the VECM explores the complex causal relationships between these variables, acknowledging the multifaceted nature of their interactions. Finally, the comparative approach reflects the understanding that successful sustainability strategies require considering the specific contexts of each region.
By employing a methodology grounded in these principles, the research offers a more nuanced understanding of how renewable energy and circular economy practices contribute to poverty reduction and CO2 emission mitigation in China and the EU. This enriches the existing body of knowledge by highlighting the importance of regional variations and global collaboration in achieving sustainability goals.
2.1. Renewable Energy and Poverty
In 2014, Terrapon-Pfaff et al. [3] attempted to verify the impact of various renewable energy resources, including hydro, wind, and solar power, on poverty in 23 developing countries. They conducted a cross-sectional review and found that access to renewable energy plays a crucial role in reducing poverty in these nations.
Diallo et al. [4,5,6] have shown that renewable energies can help decrease environmental damage caused by poverty. However, the increase in renewable energies has led to higher electricity prices, which negatively affect household incomes and increase the risk of poverty [7]. Masron et al. [5] investigated the dynamic influence of renewable energy in mitigating the potential adverse impact of poverty on environmental degradation using econometric methods for developing nations during the period of 2001–2014. The empirical results obtained from the Gaussian Mixture Models estimator confirmed that renewable energy tends to reduce the degree of environmental destruction caused by poverty in the selected countries. On the other hand, an increase in poverty leads to environmental degradation. Therefore, the significant use and consumption of renewable energy can contribute to a decrease in the poverty rate and promote environmental sustainability.
A recent study by [8] explored the link between energy poverty and economic development in Latin America. Employing a panel data analysis, they found evidence that initiatives promoting energy access can significantly contribute to poverty reduction. Similarly, Alleviating Energy Poverty through Renewable Energy Technology: An Investigation Using a Best-Worst Method-Based Quality Function Deployment Approach with Interval-Valued Intuitionistic Fuzzy Numbers by [9] investigated the potential of solar energy in alleviating energy poverty. Their findings, based on a best-worst method approach, suggest that solar photovoltaic systems can indeed improve household electricity access and reduce energy expenditure. However, it is important to acknowledge limitations within this area of research. Many studies, like the ones mentioned above, focus on specific regions or technologies, limiting the generalizability of their findings. Additionally, attributing poverty reduction solely to renewable energy interventions can be misleading, as other social and economic factors also play a significant role. Overall, recent literature highlights the promising role renewable energy can play in tackling energy poverty. Further research that considers the interplay of various socioeconomic factors and employing robust methodologies is needed to provide a more comprehensive understanding of this complex relationship.
The literature on renewable energy and poverty presents a nuanced picture, showing both the potential benefits and challenges associated with its implementation. Narine et al. [10]’s cross-sectional review underscores the positive impact of renewable energy access in reducing poverty across developing nations. This sentiment is echoed by [5] who highlight the role of renewable energy in mitigating environmental degradation caused by poverty. However, concerns arise regarding the affordability of renewable energy, as noted by Shukla et al. [7], whose findings suggest that increased reliance on renewable sources can lead to higher electricity prices, potentially exacerbating poverty risks. Furthermore, while studies like [8] emphasize the positive correlation between energy access initiatives and poverty reduction, it is essential to acknowledge the complexity of attributing poverty alleviation solely to renewable energy interventions, as highlighted by [9]. Overall, the literature underscores the promising potential of renewable energy in addressing energy poverty but also calls for a holistic approach considering socioeconomic factors and robust methodologies for a comprehensive understanding of this dynamic relationship.
2.2. Renewable Energy and CO2 Emissions
Using the Autoregressive Distributed Lag (ARDL) approach, Marques et al. [11] demonstrated that the adoption of renewable energy sources is an important strategy to protect the environment, promote sustainable economic growth, and reduce dependence on non-renewable energy sources. However, the authors highlighted the potential impact of renewable energy application on household income, confirming that it could lead to an increased probability of poverty or public elimination of households. Banday et al. [12] analyzed the relationship between CO2 emissions and energy consumption (non-renewable and renewable energies) for five emerging countries (South Africa, India, China, Russia, and Brazil) using the bootstrap Dumitrescu and Hurlin panel causality test. The results found a convergence relationship between renewable and non-renewable energies and CO2 emissions in South Africa, India, and Russia, while a divergence relationship existed in Brazil and China. Dias et al. [13] stressed the importance of reducing carbon dioxide emissions and substituting fossil fuels to counteract the rise in global temperatures. This requires the adoption of renewable energy sources to replace non-renewable energy sources gradually. As renewable energy continues to expand, energy capacity will be a solution to circumvent restrictions or back-up systems. Musah et al. [14] explored the relationship between non-renewable energy consumption and CO2 emissions in North Africa during the period of 1990–2015 using panel data and cross-section techniques. The estimated results indicated that non-renewable energy consumption was a significant determinant of CO2 emissions in these countries. The results also showed the existence of a bidirectional causality relationship between energy consumption and carbon emissions on the one hand and economic growth and carbon emissions on the other hand. Busu et al. [15] proposed that European countries should promote the consumption of renewable energy. In fact, the empirical results showed positive and direct effects of renewable energy consumption on the reduction in CO2 emissions. Chen et al. [16] confirmed the negative effect of renewable energy consumption on carbon dioxide emissions. This result is based on the estimation of panel data involving 97 countries during the period of 1995–2015, and it was obtained by examining the nonlinear effect of renewable and non-renewable energy consumption on CO2 emissions. Jeon et al. [17] proved that relying on renewable energies would reduce the emission of toxic gases and environmental degradation in the United States of America. Similarly, Grodzicki et al. [18] demonstrated that the proportion of renewable energy usage increased over time, while the value of CO2 emissions declined earlier than linear over the same period. This study revealed that an increase in the proportion of renewable energy consumption contributes to the reduction in CO2 emissions in Europe.
In summary, Research on renewable energy and CO2 emissions paints a complex picture. Studies by [11,12] highlight the potential economic challenges of renewable energy adoption, alongside its environmental benefits, while studies by [13,15,16,17,18] overwhelmingly support the role of renewable energy in reducing CO2 emissions, the economic considerations and varying effectiveness across regions suggest a need for nuanced solutions.
2.3. Renewable Energy and Economic Growth
Many researchers have studied the relationship between economic growth and renewable energies in various countries and regions around the world. Meanwhile, Liang et al. [19] have shown that investment in the renewable energy sector stimulates economic growth in the studied N-11 countries but only has a short-term effect. For Ghana, Justice. Gyimah et al. [20] found that there is a reciprocal impact between economic growth and renewable energy use, meaning that renewable energy use does not have a significant influence on gross domestic product. However, the increase in renewable energy use has a positive impact on economic growth. Bie et al. [21] suggest that the relationship between renewable energy consumption and economic growth is inconsistent at different thresholds for high-income nations, while the impact of renewable energy use on promoting economic growth is significant. The relationships among renewable energy consumption and economic development are disparate for middle-income nations depending on the reserve dependence and anticorruption regulation replicas. However, for poor nations, a U-shaped connection appears among renewable energy consumption and economic growth regardless of the model used. In addition, Wang et al. [22] affirm that nuclear energy decreases CO2 emissions more significantly than renewable energy, and there is a positive relationship between the increase in nuclear energy, renewable energy, and gross domestic product. Therefore, both nuclear energy and renewable energy can stimulate economic growth. As before stated, none of the researches in the literature explored the relationships in same time between renewable energies consumption (solar and wind power), non-renewable energies consumption and economic growth in the short and long run. Wu et al. [23] have studied how monetary policy affects carbon emissions in non-linear ways. The authors notably focused on non-linear effects in their investigation of the link between monetary policy and carbon emissions. The research was published in the Energy Economics journal. Wu et al. [24]’s study from 2024 adds to the expanding corpus of research on how monetary policy affects environmental consequences. The authors investigated the intricate connection between monetary policy and carbon emissions using non-linear models. This strategy is crucial because it enables a more sophisticated understanding of how monetary policy affects environmental sustainability. Based on national power heterogeneity, Cao et al. [25] studied the link between conflict and the state of natural resources. The effect of differences in national power on the state of natural resources was investigated by the writers. The knowledge of how power dynamics shape the state of natural resources is aided by this study. The results of this study may affect how resources are managed and policies are made.
The relationship between renewable energy and economic growth is complex and multifaceted. Studies show a range of outcomes depending on factors like a country’s income level and existing energy dependence. While some research suggests a positive short-term impact of renewable energy investment on economic growth [19] others find a more nuanced picture [21]. There is even evidence of a U-shaped relationship for low-income nations [21]. Interestingly, Wang et al. [22] highlight the potential of nuclear energy alongside renewables to boost economic growth and reduce emissions. Overall, the research underscores the need for further exploration that considers national contexts and the interplay of renewable energy with other factors like monetary policy and resource management [24,25].
2.4. Poverty and Economic Growth
Many research have been conducted recently on the connection between poverty and economic growth. Breunig et al. [26] looked at the relationship between economic growth, poverty, and inequality and discovered that these factors had a detrimental effect on the latter. In a similar vein, Panjawa et al. [27] discovered that fiscal decentralization has no impact on poverty through economic growth, but economic growth has a negative and large direct influence on poverty. In their investigation of the connections between remittances received, educational costs, energy consumption, income, poverty, and economic growth, Wu et al. [24] discovered that while remittances have a beneficial impact on economic growth, rising poverty has a negative impact on it. In their investigation of the relationship between rural development and poverty and economic growth [28] discovered that rural development contributes to both economic growth and the narrowing of the poverty gap.
World Bank [1] examined the link between poverty and economic growth in Vietnam. The authors discovered that poverty and inequality, especially at high levels of poverty, had a detrimental effect on economic growth. Similarly, Sumeitri et al. [29] discovered that while economic growth has a negative and small influence on poverty in Central Java, the human development index has a negative and substantial effect on poverty. After investigating the relationship between energy consumption, poverty, and income inequality and carbon dioxide emissions, Khan et al. [30] concluded that economic expansion had a beneficial impact on carbon dioxide emissions. Asongu et al. [31] highlighted the intricate interactions between these variables in influencing economic development by examining the conditional effect of poverty, inequality, and the severity of poverty on economic growth in Sub-Saharan Africa. Overall, the research points to a strong relationship between poverty and economic growth, with poverty often having a negative effect on it. There is a need for more investigation into the precise processes by which poverty affects economic growth as well as the possibility of mitigating these effects through policies and interventions.
The relationship between poverty and economic growth is multifaceted and multifaceted, with recent research offering a range of perspectives. Some studies find a negative impact of poverty on economic growth [26,27,32]. Poverty can hinder growth by limiting resources for investment and innovation. However, others highlight positive influences. For instance, remittances can stimulate growth [33] and rural development can narrow the poverty gap while boosting the economy [28]. The picture is further complicated by factors like inequality [7] and energy consumption [30]. Asongu et al. [31] emphasize the need for nuanced analyzes that consider the specific conditions of a region. Overall, research underscores the critical link between poverty and economic growth, but the direction of this influence can vary depending on the context.
2.5. Climate Change and Circular Economy
The literature on climate change and circular economy emphasizes the potential for the circular economy to mitigate the effects of climate change. Gallego-Schmid et al. [34] highlight the importance of intervention in the construction industry to achieve significant reductions in greenhouse gas emissions. Mathur et al. [35] also stress the urgent need to adopt a circular economy to reduce global resource demand and address the climate crisis. Similarly, Narine et al. and Lange et al. [10,36] focus on specific industries, such as methanol production and petrochemicals, and emphasize the importance of climate smart process design and circular carbo-chemicals as responses to climate change. Furthermore, Khanna et al. and Romero-Perdomo et al. [37,38] explores the research trends and relevance of the circular economy for climate change, highlighting the need for further exploration and understanding of this relationship. Additionally, Bellezoni et al. and Ghobadi et al. [39,40] discuss the potential of the circular economy in cities and modern timber construction as responses to climate change, further emphasizing the importance of circular economy strategies in addressing climate change. Overall, the literature reviewed underscores the potential of the circular economy as a significant catalyst for mitigating the effects of climate change, particularly in industries such as construction, methanol production, petrochemicals, and timber construction.
According to [41] managing economic recovery efforts while tackling climate change has proven to be difficult for both Lithuania and Bulgaria. These nations’ climate policies most likely include a range of tools, such as laws, subsidies, emissions reduction goals, and low-carbon economy transition plans, to encourage the use of renewable energy sources. In Bulgaria, initiatives may concentrate on areas including industry, transportation, and energy with the goal of lowering greenhouse gas emissions and boosting climate effect resistance. Being a Baltic nation, Lithuania could have climate policies designed to handle particular issues including energy security, biodiversity loss, and coastal erosion. Both nations’ recovery plans may make use of EU funding and put policies into place that support the goals of the European Green Deal. This might involve making investments in infrastructure for renewable energy, enhancing energy efficiency, funding forestry initiatives, and promoting sustainable agricultural methods. All things considered, the effectiveness of Lithuania’s and Bulgaria’s recovery plans and climate policies would depend on things like political will, stakeholder participation, resource availability, and alignment with larger EU energy and climate goals.
Romero-Perdomo et al. [38] presents a comprehensive analysis of research trends at the intersection of climate change and the circular economy, employing knowledge mapping techniques to identify key themes, methodologies, and gaps in existing literature. Their findings reveal a growing interest in the topic, with a significant portion of research focused on renewable energy, sustainable development, and waste management. Methodologically, the authors employ bibliometric analysis and text mining to analyze a vast corpus of academic publications, identifying prominent research clusters and emerging trends. They highlight the increasing importance of interdisciplinary approaches, particularly in addressing complex challenges related to climate change adaptation and mitigation through circular economy strategies. However, this also identifies limitations, such as potential bias in the selection of databases and the need for more empirical research to validate theoretical frameworks and models. Overall, this article provides valuable insights into the evolving landscape of research on climate change and the circular economy, offering guidance for future studies and policy interventions aimed at fostering sustainability and resilience in the face of environmental challenges.
A growing body of research highlights the circular economy’s potential as a powerful tool in combating climate change. Studies emphasize its effectiveness in various sectors, from construction [34] to resource-intensive industries like methanol production [10]. However, challenges exist. Kotseva-Tikova et al. [41] showcase the complexities of integrating economic recovery with climate action, pointing out the need for strong political will and resource allocation for such strategies to succeed. Additionally, research by [38] identify a need for more interdisciplinary approaches and robust methodologies to bridge the gap between theoretical models and real-world implementation. Overall, the research highlights a promising synergy between the circular economy and climate change mitigation, but achieving its full potential requires overcoming practical challenges and fostering collaboration across various disciplines.
3. Methodology and Data
The objective of this paper is to analyze the role of renewable energy and the circular economy in saving the environment and reducing poverty, using evidence from China and the European Union. In effect, China’s rising economy places equal emphasis on environmental sustainability and growth, which might result in an increase in renewable energy sources in addition to economic growth. The EU may be able to discern a stronger connection between poverty reduction and decreasing reliance on fossil fuels due to its emphasis on social assistance and regulations. China’s energy balance is changing as the country relies less on coal and more on renewable energy sources. This may indicate a complicated short-term link between emissions and fossil fuels. With its well-established renewable industry, the EU may show a more pronounced inverse relationship between CO2 emissions and renewable energy. In China, the circular economy generates jobs in waste management, which may indicate a connection between its acceptance and the decline of poverty. Leading the way in circular practices, the EU may demonstrate a tighter connection between resources recovery and lower fossil fuel consumption. China’s trade openness has a complicated connection with pollution. While greater production volumes may cause emissions to rise, increased efficiency may help reduce them. The EU may see a stronger correlation between commerce and sustainability due to its emphasis on environmental requirements in trade agreements. Different methods to policy are used. The centralized government of China makes it possible to enact environmental laws swiftly, which accelerates the reduction in energy use. The EU’s emphasis on rules may cause the shift to a low-carbon economy to happen more slowly but maybe more sustainably.
Both ARDL and the VECM are wellsuited to analyzing the impact of renewable energy and circular economy practices on environmental damage (emissions) and poverty reduction in two distinct regions (China and EU) over a time period (1995–2022). These models can capture both the short-term effects (how changes in one variable immediately impact another) and the long-term equilibrium relationships between the variables. This study likely involves analyzing several variables like poverty, fossil fuel reliance, economic growth, international trade, renewable energy adoption, and circular economy measures. ARDL and the VECM are powerful tools for handling such complex scenarios where multiple variables potentially influence each other. However, a key aspect of the research is comparing the effectiveness of these sustainability practices in China and the EU. These models allow for the investigation of how these variables interact differently in each region, considering factors like economic structure and development stages. In essence, ARDL and the VECM provide a robust framework to analyze the interconnectedness of these variables over time, compare the effectiveness of different approaches across regions, and understand the complex dynamics at play in the fight against environmental damage and poverty.
While the Autoregressive Distributed Lag (ARDL) approach and the Vector Error Correction Model (VECM) technique offer valuable insights into the dynamics between renewable energy, circular economy practices, environmental damage, and poverty, they also come with certain limitations. One limitation of the ARDL approach is its sensitivity to model specification. The choice of lag length and included variables can significantly impact the results, potentially leading to biased estimates if not carefully selected. Moreover, ARDL assumes that the relationships between variables are linear, which may not always accurately capture the complex dynamics inherent in socioeconomic and environmental systems.
Similarly, the VECM technique has its own set of limitations. Firstly, it requires the time series data to be stationary, which may not always hold true for real-world datasets. Additionally, the VECM assumes that all variables are cointegrated, implying a long-term relationship among them. However, this assumption may not be put in certain cases, leading to inaccurate results. Furthermore, the VECM is sensitive to the presence of outliers and structural breaks in the data, which can affect the reliability of the estimated coefficients.
In the first step, we define the econometric model by writing the Autoregressive Distributive Lag (ARDL) and the Vector Error Correction Model (VECM). The tests and estimations results are presented in step three. Following the work of [42], we develop an empirical model based on a typical production function with constant returns, and the combined output function with respect to time (t) can be expressed as follows:
By including our variables, the econometric models become as the following form:
where
- : White-noise disturbance term.
lnCO2E represents CO2 emissions expressed as a logarithmic function, while POV denotes poverty, SP denotes solar power, PW denotes power wind, CE represents circular economy, lnFC represents fossil fuel consumption expressed as a logarithmic function, lnGDP represents per capita gross domestic product expressed as a logarithmic function, and TO denotes trade openness.
In selecting variables to analyze the role of renewable energy and the circular economy in saving the environment and reducing poverty, several criteria were considered to ensure the accurate representation of the constructs of interest. Firstly, CO2 emissions were chosen as a key indicator of environmental impact, reflecting the extent of greenhouse gas emissions and their contribution to climate change. Poverty, as a multidimensional concept, was operationalized using indicators such as income levels, access to basic services, and living standards, aiming to capture the socioeconomic dimensions of well-being. Renewable energy sources, specifically solar power and wind power, were included to assess their potential in reducing reliance on fossil fuels and mitigating environmental degradation. The circular economy, characterized by principles of resource efficiency and waste reduction, was selected to evaluate its role in sustainable development and resource conservation. Fossil fuel consumption was included as a contrasting variable to renewable energy, reflecting the dependence on non-renewable resources and their environmental implications. Per capita gross domestic product (GDP) served as a measure of economic development and prosperity, while trade openness reflected the degree of integration into the global economy and its implications for environmental and social outcomes. By considering these variables, the analysis aimed to provide a comprehensive understanding of the interplay between renewable energy, the circular economy, environmental sustainability, poverty reduction, and economic development in the contexts of China and the European Union.
In model (1), CO2E is the dependent variable, while the remaining variables are exogenous. In model (2), POV is the dependent variable, while the other variables are exogenous. The data used in this study were obtained from [1,43,44]
In the condition of existence of long-term cointegration, the ARDL model is written in the following form:
In this study, we use D to represent the first-difference operator. lnCO2E represents the logarithm of CO2 emissions, lnSP represents the logarithm of solar power, lnWP represents the logarithm of wind power, lnCE represents the logarithm of circular economy, lnFC represents the logarithm of fossil fuel consumption, lnGDP represents the logarithm of per capita gross domestic product, TO represents the logarithm of trade openness, and lnPOV represents the logarithm of poverty. The error correction dynamics in the model are denoted by γ, δ, ϵ, θ, ϑ, μ, π and τ. The long-run coefficients in the model are denoted byto while, represents the constants, p and q signify the optimal lags and is a white-noise disturbance term. The ARDL model is founded on the bounds test (F-statistic), which is used to verify the presence of a long-run relationship between the variables of interest. The F-statistic value indicates that the null hypothesis of non-cointegration is rejected at the 10 percent significance level. The null hypothesis (H0) is that there is no long-run relationship, while the alternative hypothesis (H1) is that a long-run relationship exists between the variables.
H0.
(no long-run relationship exists).
H1.
(a long-run relationship exists).
The cointegration test was carried out using the ARDL approach developed by [45] which follows the ARDL bounds testing approach to cointegration introduced by [46] and later refined by [45]. Alimi et al. [47] argued that the ARDL approach to cointegration provides more reliable results for small sample sizes, such as in our case, compared to traditional methods such as [48,49]. Another advantage of the ARDL bounds testing is that the unrestricted model of ECM determines appropriate lags that capture the data-generating process in a comprehensive manner, providing an overall structure for the measurements [50]. This technique avoids the need to classify variables as I(1) (integrated in order one) or I(0) (integrated at level) by using bands of critical values to determine whether the variables are stationary or non-stationary processes.
Unlike other cointegration methods, such as Johansen’s process, which require pre-testing for unit roots and assume that the underlying variables are of the same order of integration, the ARDL model allows for testing long-run relationships regardless of whether the variables are I(0) or I(1), or even marginally integrated. Therefore, prior unit root testing is unnecessary. Furthermore, traditional cointegration methods can suffer from the problems of endogeneity, whereas the ARDL method can account for both dependent and independent variables. As a result, estimates obtained from the ARDL method of cointegration analysis are unbiased and efficient and avoid issues that may arise from serial correlation and endogeneity.
It is worth noting that the ARDL method allows for flexible lag orders, whereas Johansen’s Vector Error Correction (VECM) does not. However, Pesaran et al. [46] have argued that appropriate adjustment of the orders of the ARDL model is sufficient to account for residual serial correlation and endogeneity.
Once the existence of cointegration among the variables is verified, we employ the VECM Granger causality methodology to determine the direction of causality between the variables. The VECM is a restricted version of Value at Risk (VAR), where the error correction term (ECT) represents a cointegration term that allows endogenous variables to be linked to the cointegration relationships while allowing for short-term dynamic adjustments. By using the VECM, it is possible to estimate short-term relationships, and the ECT provides an opportunity to verify the presence of long-term relationships.
The short-run causal relationships will be demonstrated using a vector autoregressive framework (VAR) as follows [51]:
The VECM model will be practiced conducting Granger-causality tests. The different equations of the VECM are modeled as follows:
where represents the constant, while γ, δ, ϵ, θ, ϑ, μ, π and denotethe parameters to be estimated. The error term represents the white noise. The ECT or the error correction term, indicates the long-run equilibrium relationship between the variables.
4. Results and Discussion
The first step in our study before examining the relationship between variables is to determine the stationarity of both variables (Table 1)to explain their order of integration. To do this, we used ADF and PP unit root tests with one and two structural breaks developed by [52]. The null hypothesis (H0) denotes the presence of a unit root. If H0 is rejected, our econometric study can proceed. The results in Table 2 show that each variable is stationary in first difference, which means that in this case, we can reject the null hypothesis. The break years correspond to significant political, social, and economic changes in Chinese history and the history of the European Union. The year 1978 represents a crucial turning point for the Chinese economy, as it marked the beginning of China’s “Reform and Opening Up” policy. This policy marked a shift away from the centrally planned economy of the Mao era towards a more market-oriented economy and laid the foundation for China’s rapid economic growth over the following decades. Some strategies have been taken by the Chinese government such as agricultural reform to increase agricultural productivity and to alleviate rural poverty, create special economic zones and finally develop foreign trade by liberalizing foreign trade policies, reducing trade barriers, and opening to foreign investment. Overall, 1978 represented a significant moment in the history of the Chinese economy, as it marked the beginning of a series of reforms that would transform China from a poor, isolated country into a major economic power. While there have been challenges and setbacks along the way, the legacy of the Reform and Opening Up policy continues to shape China’s economy and its role in the world today.

Table 1.
Variables summary.
Table 2.
Results of unit root tests.
For Chinese, 2014 was a significant year for the economy, as it marked a continuation of the country’s remarkable economic growth in recent decades, while also highlighting some of the challenges and risks that China faces as it seeks to maintain its momentum. Some of the key developments in the Chinese economy in 2014 include slowing growth: China’s economic growth slowed to 7.4 percent in 2014, marking the weakest expansion in 24 years. This slowdown reflected both cyclical factors, such as weak global demand and a cooling property market, as well as structural challenges, such as overcapacity in some sectors and an aging population. However, in 2014, the Chinese economy had a structural reform. In fact, to address these challenges, the Chinese government launched a series of structural reforms aimed at rebalancing the economy away from investment and exports and towards consumption and services. These reforms included efforts to reduce bureaucratic red tape, liberalize financial markets, and encourage private enterprise. The years 2019 and 2021 are two dates of recovery in global demand and supply due to the containment following the COVID-19 epidemic. The year 2008 represents a major turning point for the European economy, as it marked the beginning of the global financial crisis, which had far-reaching consequences for the region and the world. Some of the key developments in the European economy in 2008 and the years that followed include the banking crisis, the sovereign debt crisis and the Euro-zone crisis, including the lack of fiscal union and the uneven distribution of economic power among member states. However, 2020, 2021 and 2022 are years of global economic recession due toCOVID-19 epidemic.
In the second step of our study, we employ the bounds test (Table 3) to check for cointegration in the long run among variables. This test is based on the computation of the F-statistic and comparing it with critical values. The optimum lag is selected by minimizing the Akaike Information Criterion (AIC) and the Schwarz Criteria (SIC). The results of the bounds test indicate that the F-statistic exceeds the 10percent upper bound, indicating the presence of cointegration in the long run between the variables.
Table 3.
Bounds test for cointegration.
Null Hypothesis:
No long-run relationships exist.
In Table 4, we used the Breusch–Godfrey serial correlation Lagrange Multiplier (LM) test to identify the correlation of residuals. The results indicate that there is no serial correlation for residuals. The results of the Autoregressive Conditional Heteroskedasticity (ARCH)test show that the modelis free from heteroscedasticity and the normal distribution describes the deliveries of error terms.
Table 4.
Diagnostic test.
Moreover, we used the Cumulative Sum (CUSUM) and Cumulative Sum Square (CUSUMSQ) tests to validate the stability of the ARDL model. The results are shown in the form of figures, in which the curve should be through the critical bounds (Table 5). The curve located between the two limits shows that the two econometric models are stable over time.
Table 5.
CUSUM and QUSUMSQ tests.
After approval of the order of stationarity of the variables and confirmation of the existence of cointegration using bounds test results, we can now estimate the long- and short-run coefficients. The different results of ARDL long-run coefficients are situated in Table 6.
Table 6.
Long-run ARDL estimates.
The results of this study indicate that poverty [53], fossil consumption [54], gross domestic product [55], and trade openness [24] are significant factors contributing to increased CO2 emissions in both China and the European Union (EU). However, the impact of these factors differs significantly between the two regions. In China, poverty, fossil consumption, GDP, and TO are found to increase CO2 emissions by 4.153 percent, 15.893 percent, 5.979 percent, and 3.361 percent, respectively, which are much higher than the impact of these factors on CO2 emissions in the EU. In the EU, poverty, fossil consumption, GDP, and TO increase CO2 emissions by 0.546 percent, 1.011 percent, 2.939 percent, and 0.033 percent, respectively. These findings suggest that the impact of POV, FC, GDP, and TO on CO2 emissions is more significant in China than in the EU. This highlights the need for region-specific strategies to tackle carbon emissions, considering the unique socioeconomic and environmental factors that drive carbon emissions in each region.
The positive correlation between GDP and CO2 emissions confirms the existing knowledge that economic development often comes at the cost of environmental degradation, especially in the early stages of industrialization. This highlights the need for sustainable development strategies that prioritize clean energy and resource efficiency. The impact of trade openness (TO) on CO2 emissions is interesting. It suggests that increased trade can lead to higher emissions, possibly due to the movement of production processes to countries with less stringent environmental regulations. This challenges the idea that globalization inherently reduces emissions and calls for international cooperation on environmental standards. The finding that poverty contributes to CO2 emissions sheds light on a critical challenge. Low-income populations often rely on cheap, polluting energy sources like coal for basic needs. This creates a trap where poverty hinders investment in clean energy, perpetuating reliance on fossil fuels and hindering development.
The results suggest also, that in China, the implementation of wind power, solar power, and circular economy measures have been successful in reducing CO2 emissions. Specifically, wind power decreased CO2 emissions by 3.197 percent, solar power decreased CO2 emissions by 4.181 percent, and circular economy measures decreased CO2 emissions by 3.1 percent. In comparison, the European Union (EU) has not seen the same level of success in reducing CO2 emissions through these measures. Wind power decreased CO2 emissions by 2.939 percent, solar power only decreased CO2 emissions by 0.013 percent, and circular economy measures decreased CO2 emissions by 0.788 percent. This reinforces the existing body of knowledge that renewable energy sources like wind and solar are effective alternatives to fossil fuels. Their expansion displaces polluting sources, leading to a cleaner energy mix and demonstrably lower CO2 emissions. Also, this finding adds weight to the emerging understanding of the circular economy’s role in climate change mitigation. By reducing reliance on virgin materials through recycling, reuse, and repair, the circular economy lowers emissions associated with resource extraction and production processes.
These results suggest that there may be differences in the implementation or effectiveness of these measures between China and the EU, highlighting the need for further research and analysis to better understand these differences and identify ways to improve the effectiveness of these measures.
The results show that the impact of solar power, circular economy, fossil consumption, and CO2 emissions on poverty reduction varies significantly between China and the European Union (EU). In China, solar power had the highest impact on poverty reduction with a decrease in the poverty rate by 41.317 percent [56], followed by circular economy measures with a decline in the poverty rate by 3.035 percent [57]. Fossil consumption and CO2 emissions also have significant impacts on poverty reduction with decreases in the poverty rate, respectively, by 1.715 percent and 0.959 percent. However, wind power, gross domestic product, and trade openness had a slight negative impact on poverty reduction in China. In comparison, in the EU, CO2 emissions and fossil consumption have a positive impact on the poverty rate. These two variables led to an increase in the poverty rate, respectively, by 0.035 percent and 4.979 percent. On the other hand, wind power, solar power, circular economy measures, gross domestic product, and trade openness had a positive impact on poverty reduction in the EU, with circular economy measures having the highest impact with a decrease inthepoverty rate by 0.128 percent. These results highlight the need for region-specific policies and measures to tackle poverty and reduce the impacts of climate change. Renewable energy and circular economy play a vital role in poverty reduction. Solar power in China and circular economy measures in the EU demonstrate that focusing on sustainability can have a positive social impact.
The negative impact (of fossil fuels and CO2 emissions) in China and positive association in the EU highlight the complexities at play. In developing economies, fossil fuels might be crucial for initial economic growth, lifting some out of poverty. However, in developed regions, their long-term environmental consequences could worsen poverty through climate change impacts.
While this study sheds light on regional differences in factors affecting CO2 emissions and poverty reduction, some limitations need to be considered. Firstly, this study relates to existing research on poverty reduction impacts, which might not fully capture the complex social dynamics at play. Secondly, the reasons behind the varying effectiveness of renewable energy and circular economy measures between China and the EU are unclear. Further research is needed to explore these differences in policy implementation, infrastructure, and economic factors. An alternative explanation for the positive association between fossil fuels and poverty reduction in the EU could be due to specific industries or sectors relating on these fuels. Additionally, increased trade openness might be linked to knowledge or technology transfer that aids poverty reduction in developed economies. Overall, this study highlights the need for more nuanced analyzes and region-specific approaches that consider historical context, industrial structures, and ongoing sustainability efforts.
The Granger causality results (Table 7) show the existence of mixed relationships (unidirectional and bidirectional) between variables.
Table 7.
Results of Granger causality test.
The VECM Granger causality test gives mixed results of relationships (unidirectional, bidirectional) between variables. The asterisks (***, ** and *) indicate that the dependent variable cause the independent variable as indicated in Table 6.
The presence of long-term causal relationships is resolute by the errors correctionterm (ECT). When the coefficient at the same time is significant and negative, it indicates that there is at least a long-run relationship between the variables and that the endogenous variable has an essential role as an adjustment element once the model diverges from equilibrium. The results of Table 7, in specific the coefficients of the ECT, approve the existence of long-run relationships among the variables designated by the cointegration tests. Similarly, the results show that there is a co-movement of the variables.
The different relationships among variables are recapitulate as figures in Table 8. This table was used to simplify the direction causality relationships running from variable to another variable. The dependent variable in the first model (CO2E) was colored in red color; however, the dependent variable in the second model (POV) was colored in yellow color. The double-headed arrows indicate that there is a bidirectional causal relationship between the dependent variable and the explicative variable. While the single-headed arrow indicates that there is a unidirectional relationship running from the explicative variable to the dependent variable.
Table 8.
Convergent radial of different bidirectional relationships for CO2 emission and poverty variables.
5. Conclusions and Policy Implication
This work proposed a new technique to explore the role of renewable energies and circular economy in saving environmental and in reducing poverty in China and the European Union region during 1995–2022 periods. To that end, we used the multi-steps methodology starting with the stationarity test (to determine the order of integration of each variables), the bounds test (to verify the existence of long-run cointegration), Autoregressive Distributed lag (to determinate the coefficients of estimation in long run) and finishing by using the Vector Error Correction model (to detect the short run causality relationships among variables).
In addition, the result of bounds test confirms the presence of long-run cointegration relations which means that there is at least a long-run relationship among the series of variables. The VECM results show the existence of mixed relationships among variables (unidirectional and bidirectional causal relationships). The ARDL estimate results reveal that poverty, fossil consumption, gross domestic product, and trade openness are significant factors contributing to increased CO2 emissions in both China and the European Union. However, the impact of these factors differs significantly between the two regions, emphasizing the need for region-specific strategies to tackle carbon emissions. This study also highlights the effectiveness of wind power, solar power, and circular economy measures in reducing CO2 emissions in China, while the EU has not seen the same level of success in reducing CO2 emissions through these measures. Furthermore, this study shows that the impact of solar power, circular economy, fossil consumption, and CO2 emissions on poverty reduction varies significantly between China and the EU, further emphasizing the need for region-specific policies and measures to tackle poverty and reduce the impacts of climate change. These findings underscore the importance of understanding the unique socioeconomic and environmental factors that drive carbon emissions and poverty in each region to develop effective solutions for mitigating climate change and poverty.
The empirical results of this study provide valuable insights that can be linked to the theoretical framework and research questions, shedding light on the complex interplay between renewable energy, circular economy practices, environmental sustainability, and poverty reduction in China and the European Union (EU). Firstly, the findings confirm the presence of long-run cointegration relations among the variables, validating the theoretical expectation of interconnectedness between environmental and socioeconomic factors over time. This supports the premise that sustainable development requires addressing both environmental degradation and poverty in tandem. Furthermore, the identification of mixed relationships among variables, including both unidirectional and bidirectional causal relationships, aligns with the theoretical understanding that the dynamics between renewable energy, circular economy practices, and poverty are multifaceted and contextdependent.
The empirical evidence also underscores the significance of regional variations in influencing the effectiveness of policy interventions. The differential impacts of factors such as solar power, circular economy measures, and fossil fuel consumption on CO2 emissions and poverty reduction between China and the EU highlight the importance of tailoring strategies to the specific socioeconomic and environmental contexts of each region. This supports the theoretical notion that the success of sustainability initiatives is contingent upon understanding local conditions and implementing targeted measures accordingly.
Moreover, the implications of the findings extend beyond regional policy considerations to broader implications for global cooperation and knowledgesharing. The recommendation for policy makers in both regions to prioritize data-driven approaches and establish knowledge-sharing platforms reflects the recognition of the interconnectedness of global challenges such as climate change and poverty. This aligns with the theoretical framework emphasizing the importance of collaborative governance and collective action at the international level to address shared sustainability challenges effectively.
Policy makers in both regions should prioritize data-driven approaches. Understanding local economic structures and environmental vulnerabilities is crucial for crafting effective interventions. Based on the findings, China should prioritize scaling up investments in solar power and circular economy initiatives. The EU, on the other hand, should focus on enhancing the effectiveness of existing renewable energy and circular economy programs.
However, to accelerate progress, both regions should establish knowledge-sharing platforms to learn from each other’s experiences. Additionally, global cooperation is crucial for developing and disseminating best practices for tackling poverty and climate change.
By implementing these recommendations, policy makers can leverage the power of renewable energy and circular economy to create a more sustainable and equitable future for both China and the EU. This will not only mitigate climate change but also empower communities and lift people out of poverty.
The research emphasizes the importance of understanding regional variations. This knowledge is crucial for crafting effective policies that tackle poverty and address environmental vulnerability specific to each region (China vs. EU). It highlights the need for knowledge sharing platforms and global cooperation. By encouraging both regions to learn from each other’s experiences and develop best practices, the research promotes collaboration that can accelerate progress in tackling poverty and climate change.
In terms of limitations, the research does not explicitly explore the mechanisms through which renewable energy and circular economy reduce poverty. Future research could delve deeper into these mechanisms to provide a more comprehensive understanding of the causal relationships. The timeframe (1995–2022) might not fully capture the long-term impact on poverty reduction. Further research with a longer timeframe could strengthen the connection between these factors.
Aligning with the research objective of understanding the effectiveness of renewable energy and circular economy practices in reducing poverty and environmental damage, this study employed a comparative approach between China and the EU. The findings confirmed the initial hypothesis that there is a complex interplay between these factors.
Firstly, the results supported the theoretical framework of sustainable development by demonstrating long-run cointegration between poverty, CO2 emissions, and economic factors. This highlights the interconnectedness of environmental and socioeconomic issues, requiring a holistic approach to achieve sustainability. Secondly, this study identified both unidirectional and bidirectional causal relationships among the variables, reflecting the multifaceted nature of how renewable energy, circular economy, and poverty reduction interact—a key finding aligned with the research questions. Furthermore, the research emphasizes the importance of regional variations. China, for instance, saw a greater impact of solar power and circular economy measures on reducing CO2 emissions compared to the EU. This underscores the need for region-specific policies, as highlighted in the conclusion.
By highlighting these regional variations and the limitations of the current timeframe, this study paves the way for future research to delve deeper into the mechanisms at play and explore the long-term effects on poverty reduction. Overall, the research findings offer valuable insights for policy makers, supporting the call for data-driven, region-specific approaches, knowledge sharing platforms, and global cooperation to tackle poverty and climate change through renewable energy and circular economy practices.
This research offers critical insights for policy makers in China and the EU, urging them to adopt regionally specific strategies to combat climate change and poverty. This study recommends that China significantly increase investments in solar power and circular economy initiatives, proven effective in reducing CO2 emissions and potentially alleviating poverty. For the EU, the focus should be on enhancing existing renewable energy and circular economy programs through better implementation, resource allocation, or technological advancements. Looking beyond regional approaches, the research emphasizes the importance of global collaboration to address these shared challenges. Establishing knowledge-sharing platforms would enable China and the EU to learn from each other’s experiences with renewable energy, circular economy practices, and poverty reduction efforts. This collaboration, along with data-driven policymaking that leverages regional economic structures and environmental vulnerabilities, can lead to more effective global strategies. International cooperation is essential for developing and disseminating best practices to tackle global issues like climate change and poverty. This study significantly advances our understanding of the complex interplay between renewable energy, circular economy practices, and their impact on poverty and CO2 emissions. It highlights the crucial role of regional variations in designing sustainability policies and sheds light on the knowledge gap between China and the EU. By promoting knowledge sharing and collaboration, this research pave the way for faster progress in achieving sustainable development. This study also reinforces the theoretical framework of sustainable development by emphasizing the interconnectedness of environmental and socioeconomic factors. Future research can explore the mechanisms by which these practices reduce poverty and investigate the long-term impacts beyond the timeframe explored here.
6. Key Findings
- Regional disparity: The impact of economic and environmental factors on poverty and CO2 emissions differs significantly between China and the EU. Fossil fuel dependence and economic growth contribute to increased CO2 emissions in both regions, but with varying degrees of impact.
- Renewable energy and circular economy: Wind, solar power, and circular economy measures effectively reduce CO2 emissions in China, while their impact in the EU is less pronounced.
- Poverty reduction: The study reveals the multifaceted nature of poverty reduction. While solar power is a key driver in China, circular economy measures take center stage in the EU.
Author Contributions
Conceptualization, A.I.; Methodology, F.D.; Validation, F.D.; Formal analysis, A.I.; Resources, A.I. and A.A.S.; Data curation, A.I.; Writing—original draft, F.D.; Writing—review & editing, A.A.S. All authors have read and agreed to the published version of the manuscript.
Funding
This research was funded through the annual funding track by the Deanship of Scientific Research, vice presidency for graduate studies and scientific research, King Faisal University, Saudi Arabia [project no GrantA151].
Institutional Review Board Statement
Not applicable.
Informed Consent Statement
Not applicable.
Data Availability Statement
The data presented in this study are available on request from the corresponding author.
Conflicts of Interest
The authors declare no conflicts of interest.
References
- World Development Indicators Database; World Bank: Washington, DC, USA, 2023.
- Dvorak, J. European Union definition of poverty. SAGE Encycl. World Poverty 2015, 2, 528–529. [Google Scholar]
- Terrapon-Pfaff, J.; Dienst, C.; König, J.; Ortiz, W. A cross-sectional review: Impacts and sustainability of small-scale renewable energy projects in developing countries. Renew. Sustain. Energy Rev. 2014, 40, 1–10. [Google Scholar] [CrossRef]
- Diallo, A.; Moussa, R.K. The effects of solar home system on welfare in off-grid areas: Evidence from Côte d’Ivoire. Energy 2020, 194, 116835. [Google Scholar] [CrossRef]
- Masron, T.A.; Subramaniam, Y. Does poverty cause environmental degradation? Evidence from developing countries. J. Poverty 2019, 23, 44–64. [Google Scholar] [CrossRef]
- Tang, C.F.; Tey, N.P. Low fertility in Malaysia: Can it be explained? J. Popul. Res. 2017, 34, 101–118. [Google Scholar] [CrossRef]
- Shukla, P.R.; Skea, J.; Calvo Buendia, E.; Masson-Delmotte, V.; Pörtner, H.O.; Roberts, D.C.; Zhai, R.; Slade, R.; Connors, S.; van Diemen, S.; et al. IPCC, 2019: Climate Change and Land: An IPCC Special Report on Climate Change, Desertification, Land Degradation, Sustainable Land Management, Food Security, and Greenhouse Gas Fluxes in Terrestrial Ecosystems; IPCC: Geneva, Switzerland, 2019. [Google Scholar]
- Cárdenas, C.C.; Yúñez, A.I. Understanding the link between energy poverty and economic growth in Latin America. Contaduría Adm. 2023, 68, 175–198. [Google Scholar] [CrossRef]
- Lu, S.; Zhou, J.; Ren, J. Alleviating Energy Poverty through Renewable Energy Technology: An Investigation Using a Best-Worst Method-Based Quality Function Deployment Approach with Interval-Valued Intuitionistic Fuzzy Numbers. Int. J. Energy Res. 2023, 2023, 8358799. [Google Scholar] [CrossRef]
- Narine, K.; Mahabir, J.; Koylass, N.; Samaroo, N.; Singh-Gryzbon, S.; Baboolal, A.; Guo, M.; Ward, K. Climate smart process design for current and future methanol production. J. CO2 Util. 2021, 44, 101399. [Google Scholar] [CrossRef]
- Marques, A.C.; Fuinhas, J.A.; Pereira, D.A. Have fossil fuels been substituted by renewables? An empirical assessment for 10 European countries. Energy Policy 2018, 116, 257–265. [Google Scholar] [CrossRef]
- Banday, U.J.; Aneja, R. Renewable and non-renewable energy consumption, economic growth and carbon emission in BRICS: Evidence from bootstrap panel causality. Int. J. Energy Sect. Manag. 2020, 14, 248–260. [Google Scholar] [CrossRef]
- Dias, V.; Pochet, M.; Contino, F.; Jeanmart, H. Energy and economic costs of chemical storage. Front. Mech. Eng. 2020, 6, 21. [Google Scholar] [CrossRef]
- Musah, M.; Owusu-Akomeah, M.; Kumah, E.A.; Mensah, I.A.; Nyeadi, J.D.; Murshed, M.; Alfred, M. Green investments, financial development, and environmental quality in Ghana: Evidence from the novel dynamic ARDL simulations approach. Environ. Sci. Pollut. Res. 2022, 29, 31972–32001. [Google Scholar] [CrossRef] [PubMed]
- Busu, M.; Nedelcu, A.C. Analyzing the renewable energy and CO2 emission levels nexus at an EU level: A panel data regression approach. Processes 2021, 9, 130. [Google Scholar] [CrossRef]
- Chen, C.; Pinar, M.; Stengos, T. Renewable energy and CO2 emissions: New evidence with the panel threshold model. Renew. Energy 2022, 194, 117–128. [Google Scholar] [CrossRef]
- Jeon, H. CO2 emissions, renewable energy and economic growth in the US. Electr. J. 2022, 35, 107170. [Google Scholar] [CrossRef]
- Grodzicki, T.; Jankiewicz, M. The impact of renewable energy and urbanization on CO2 emissions in Europe–Spatio-temporal approach. Environ. Dev. 2022, 44, 100755. [Google Scholar] [CrossRef]
- Liang, T.; Zhang, Y.J.; Qiang, W. Does technological innovation benefit energy firms’ environmental performance? The moderating effect of government subsidies and media coverage. Technol. Forecast. Soc. Change 2022, 180, 121728. [Google Scholar] [CrossRef]
- Gyimah, J.; Yao, X.; Tachega, M.A.; Hayford, I.S.; Opoku-Mensah, E. Renewable energy consumption and economic growth: New evidence from Ghana. Energy 2022, 248, 123559. [Google Scholar] [CrossRef]
- Bie, Q.; Wang, S.; Qiang, W.; Ma, X.; Gu, Z.; Tian, N. Progress toward Sustainable Development Goals and interlinkages between them in Arctic countries. Heliyon 2023, 9, e13306. [Google Scholar] [CrossRef]
- Wang, Q.; Guo, J.; Li, R.; Jiang, X.T. Is nuclear power a cost-effective energy transition option? Comparative study on the impact of coal, oil, gas, renewable and nuclear power on economic growth and carbon emissions. Environ. Res. 2023, 221, 115290. [Google Scholar] [CrossRef]
- Wu, J.; Yang, C.; Chen, L. Examining the non-linear effects of monetary policy on carbon emissions. Energy Econ. 2024, 131, 107206. [Google Scholar] [CrossRef]
- Wu, R.; Ma, T.; Chen, D.; Zhang, W. International trade, CO2emissions, and re-examination of “pollution haven hypothesis” in China. Environ. Sci. Pollut. Res. 2022, 29, 4375–4389. [Google Scholar] [CrossRef] [PubMed]
- Cao, Q.; Feng, Z.; Yang, R.; Yang, C. Conflict and natural resource condition: An examination based on national power heterogeneity. Resour. Policy 2024, 89, 104549. [Google Scholar] [CrossRef]
- Breunig, R.; Majeed, O. Inequality, poverty and economic growth. Int. Econ. 2020, 161, 83–99. [Google Scholar] [CrossRef]
- Panjawa, J.L.; Triyanto, J. The Role of Human Development and Decentralization toward Poverty through Economic Growth. Gorontalo Dev. Rev. 2020, 3, 39–47. [Google Scholar] [CrossRef]
- Handoyo, F.; Hidayatina, A.; Purwanto, P. The effect of rural development on poverty gap, poverty severity and local economic growth in Indonesia. J. Bina Praja J. Home Aff. Gov. 2021, 13, 369–381. [Google Scholar] [CrossRef]
- Sumeitri, A.; Destiningsih, R. Analysis of Factors Affecting Poverty in Central Java 2016–2019. J. Manag. Account. Gen. Financ. Internatiomal Econ. Issues 2022, 1, 23–40. [Google Scholar]
- Khan, H.; Weili, L.; Khan, I.; Zhang, J. Exploring the nexus between energy consumption, income inequality and poverty, economic growth, and carbon dioxide emission: Evidence from two step system generalized method of moments. Environ. Sci. Pollut. Res. 2023, 30, 35996–36011. [Google Scholar] [CrossRef] [PubMed]
- Asongu, S.A.; Eita, J.H. The conditional influence of poverty, inequality, and severity of poverty on economic growth in Sub-Saharan Africa. J. Appl. Soc. Sci. 2023, 17, 372–384. [Google Scholar] [CrossRef]
- Zhu, Y.; Bashir, S.; Marie, M. Assessing the relationship between poverty and economic growth: Does sustainable development goal can be achieved? Environ. Sci. Pollut. Res. 2022, 29, 27613–27623. [Google Scholar] [CrossRef]
- Zaman, S.; Wang, Z.; Zaman, Q.U. Exploring the relationship between remittances received, education expenditures, energy use, income, poverty, and economic growth: Fresh empirical evidence in the context of selected remittances receiving countries. Environ. Sci. Pollut. Res. 2021, 28, 17865–17877. [Google Scholar] [CrossRef] [PubMed]
- Gallego-Schmid, A.; Chen, H.M.; Sharmina, M.; Mendoza, J.M.F. Links between circular economy and climate change mitigation in the built environment. J. Clean. Prod. 2020, 260, 121115. [Google Scholar] [CrossRef]
- Mathur, A.; Singh KD, P. Climate Change and the Circular Economy: Analysis of Policy and Individual Behavior in the Indian Ecosystem. In Examining the Intersection of Circular Economy, Forestry, and International Trade; IGI Global: Hershey, PA, USA, 2021; pp. 28–46. [Google Scholar]
- Lange, J.P. Towards circular carbo-chemicals–the metamorphosis of petrochemicals. Energy Environ. Sci. 2021, 14, 4358–4376. [Google Scholar] [CrossRef]
- Khanna, M.; Gusmerotti, N.M.; Frey, M. The relevance of the circular economy for climate change: An exploration through the theory of change approach. Sustainability 2022, 14, 3991. [Google Scholar] [CrossRef]
- Romero-Perdomo, F.; Carvajalino-Umaña, J.D.; Moreno-Gallego, J.L.; Ardila, N.; González-Curbelo, M.Á. Research trends on climate change and circular economy from a knowledge mapping perspective. Sustainability 2022, 14, 521. [Google Scholar] [CrossRef]
- Bellezoni, R.A.; Adeogun, A.P.; Paes, M.X.; de Oliveira JA, P. Tackling climate change through circular economy in cities. J. Clean. Prod. 2022, 381, 135126. [Google Scholar] [CrossRef]
- Ghobadi, M.; Sepasgozar, S.M. Circular economy strategies in modern timber construction as a potential response to climate change. J. Build. Eng. 2023, 77, 107229. [Google Scholar] [CrossRef]
- Kotseva-Tikova, M.; Dvorak, J. Climate Policy and Plans for Recovery in Bulgaria and Lithuania. Rom. J. Eur. Aff. 2022, 22, 79–99. [Google Scholar] [CrossRef]
- Derouez, F.; Ifa, A. Sustainable Food Security: Balancing Desalination, Climate Change, and Population Growth in Five Arab Countries Using ARDL and VECM. Sustainability 2024, 16, 2302. [Google Scholar] [CrossRef]
- The Eurostat-European Commission. 2023. Available online: https://ec.europa.eu/eurostat (accessed on 7 January 2024).
- The National Bureau of Statistics of China. 2023. Available online: https://data.stats.gov.cn/english/easyquery.htm?cn=C01 (accessed on 7 January 2024).
- Pesaran, M.H.; Shin, Y.; Smith, R.J. Bounds testing approaches to the analysis of level relationships. J. Appl. Econom. 2001, 16, 289–326. [Google Scholar] [CrossRef]
- Pesaran, M.H.; Shin, Y.; Smith, R.P. Pooled mean group estimation of dynamic heterogeneous panels. J. Am. Stat. Assoc. 1999, 94, 621–634. [Google Scholar] [CrossRef]
- Alimi, R.S. ARDL bounds testing approach to Cointegration: A re-examination of augmented fisher hypothesis in an open economy. Asian J. Econ. Model. 2014, 2, 103–114. [Google Scholar] [CrossRef]
- Johansen, S. Estimation and hypothesis testing of cointegration vectors in Gaussian vector autoregressive models. Econom. J. Econom. Soc. 1991, 59, 1551–1580. [Google Scholar] [CrossRef]
- Johansen, S.; Juselius, K. Maximum likelihood estimation and inference on cointegration--with applications to the demand for money. Oxf. Bull. Econ. Stat. 1990, 52, 169–210. [Google Scholar] [CrossRef]
- Laurenceson, J.; Chai, J.C. Financial Reform and Economic Development in China; Edward Elgar Publishing: Cheltenham, UK, 2003. [Google Scholar]
- Narayan, P.K.; Smyth, R. What determines migration flows from low-income to high-income countries? An empirical investigation of Fiji–Us migration 1972–2001. Contemp. Econ. Policy 2006, 24, 332–342. [Google Scholar] [CrossRef]
- Lee, J.; Strazicich, M.C. Minimum Lagrange multiplier unit root test with two structural breaks. Rev. Econ. Stat. 2003, 85, 1082–1089. [Google Scholar] [CrossRef]
- Kyayesimira, J.; Florence, M. Health concerns and use of biomass energy in households: Voices of women from rural communities in Western Uganda. Energy Sustain. Soc. 2021, 11, 42. [Google Scholar] [CrossRef]
- Etokakpan, M.U.; Solarin, S.A.; Yorucu, V.; Bekun, F.V.; Sarkodie, S.A. Modeling natural gas consumption, capital formation, globalization, CO2 emissions and economic growth nexus in Malaysia: Fresh evidence from combined cointegration and causality analysis. Energy Strategy Rev. 2020, 31, 100526. [Google Scholar] [CrossRef]
- Mujtaba, A.; Jena, P.K.; Mukhopadhyay, D. Determinants of CO2 emissions in upper middle-income group countries: An empirical investigation. Environ. Sci. Pollut. Res. 2020, 27, 37745–37759. [Google Scholar] [CrossRef]
- Cantarero, M.M.V. Of renewable energy, energy democracy, and sustainable development: A roadmap to accelerate the energy transition in developing countries. Energy Res. Soc. Sci. 2020, 70, 101716. [Google Scholar] [CrossRef]
- Schröder, P.; Lemille, A.; Desmond, P. Making the circular economy work for human development. Resour. Conserv. Recycl. 2020, 156, 104686. [Google Scholar] [CrossRef]
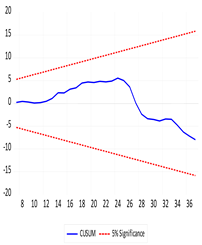
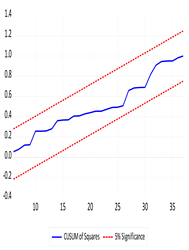
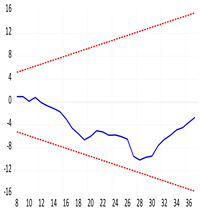

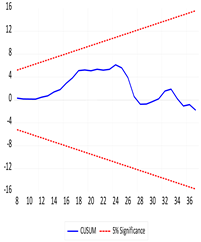
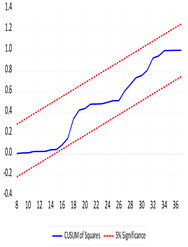
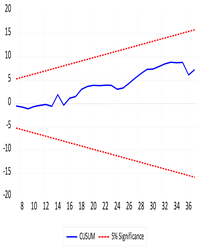
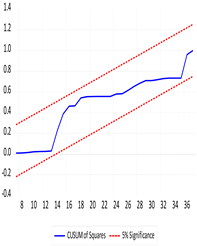
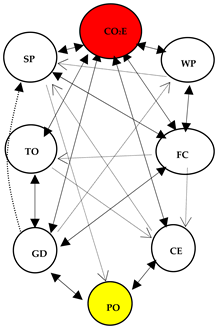
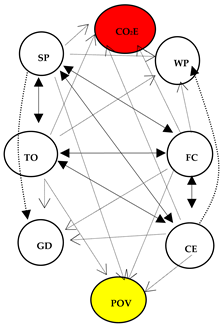
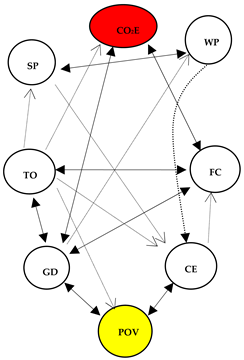
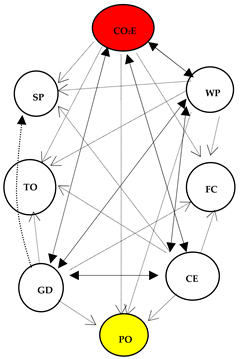


Disclaimer/Publisher’s Note: The statements, opinions and data contained in all publications are solely those of the individual author(s) and contributor(s) and not of MDPI and/or the editor(s). MDPI and/or the editor(s) disclaim responsibility for any injury to people or property resulting from any ideas, methods, instructions or products referred to in the content. |
© 2024 by the authors. Licensee MDPI, Basel, Switzerland. This article is an open access article distributed under the terms and conditions of the Creative Commons Attribution (CC BY) license (https://creativecommons.org/licenses/by/4.0/).