


Potential of Modified Reduced Tillage with Cover/Green Manure Crop for Climate Change Mitigation in a Smallholder Rainfed Farming System


 , ,
, ,  and
and
Abstract
1. Introduction
2. Materials and Methods
2.1. Site, Treatments, and Experimental Design
2.2. GHG Measurements and Calculations
2.3. GHG Data Analysis
2.4. Statistical Analysis
3. Results
3.1. Soil Moisture Content and Temperature
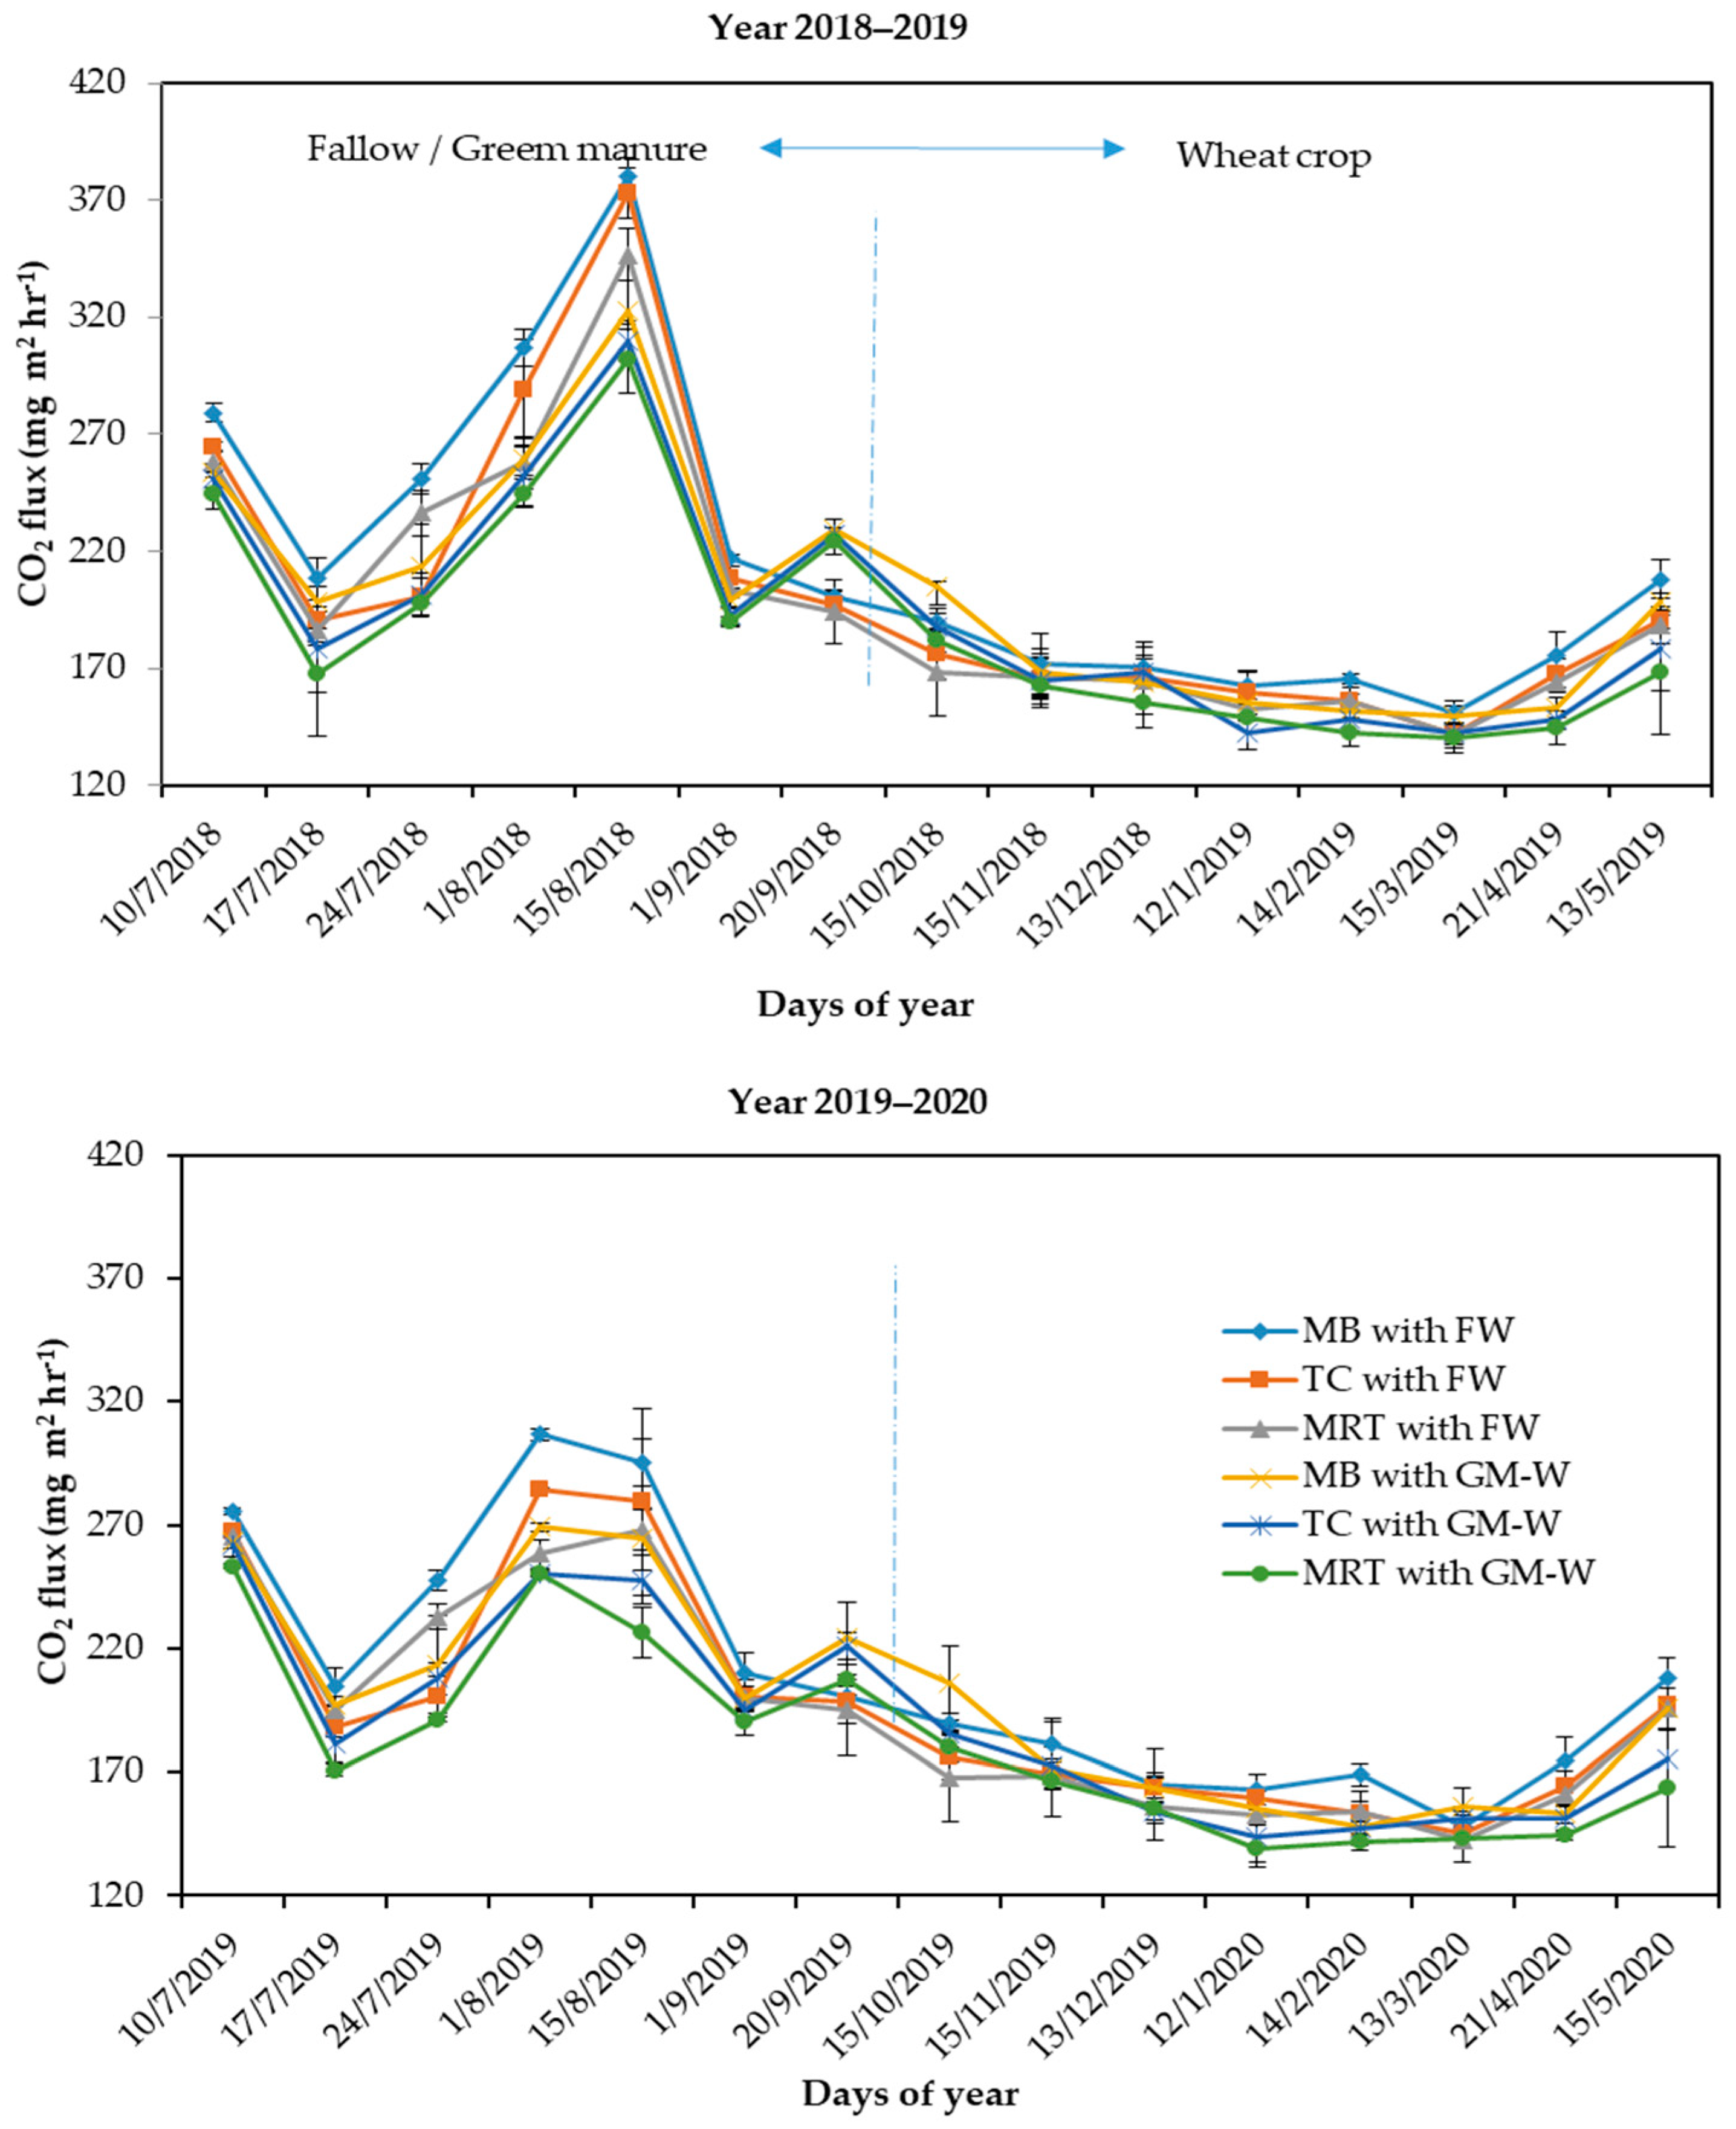
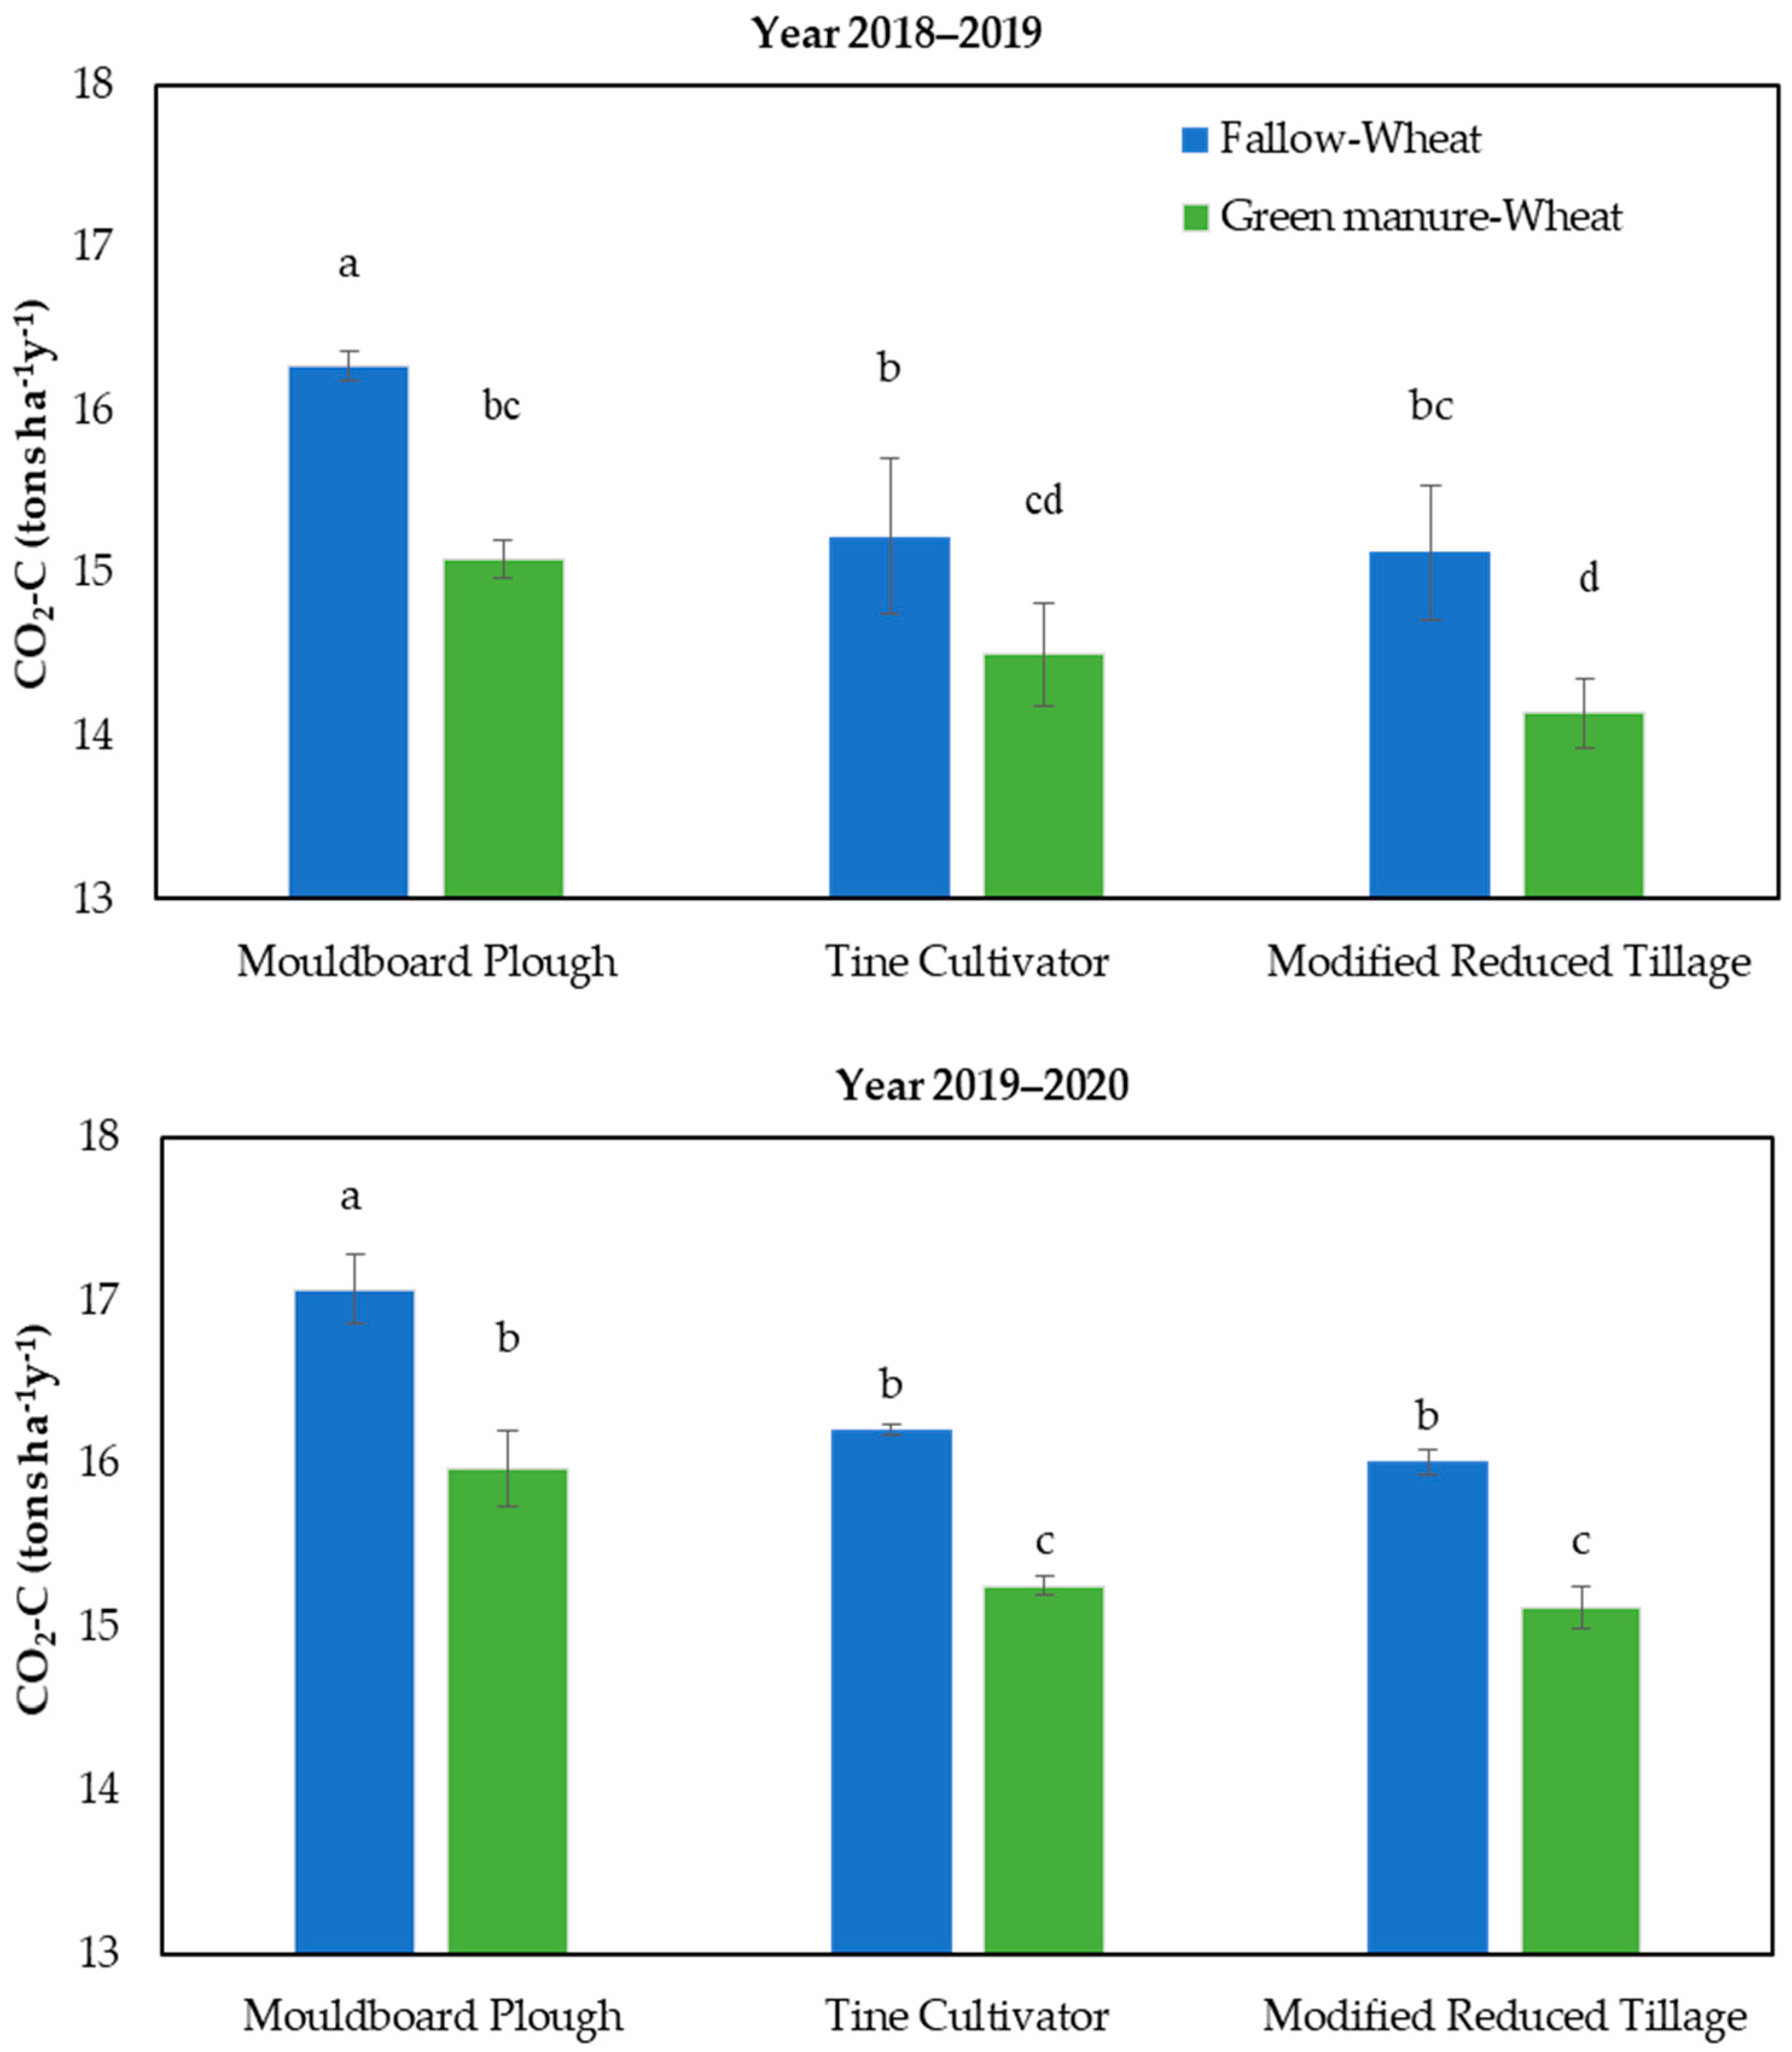
3.2. CO2 Flux
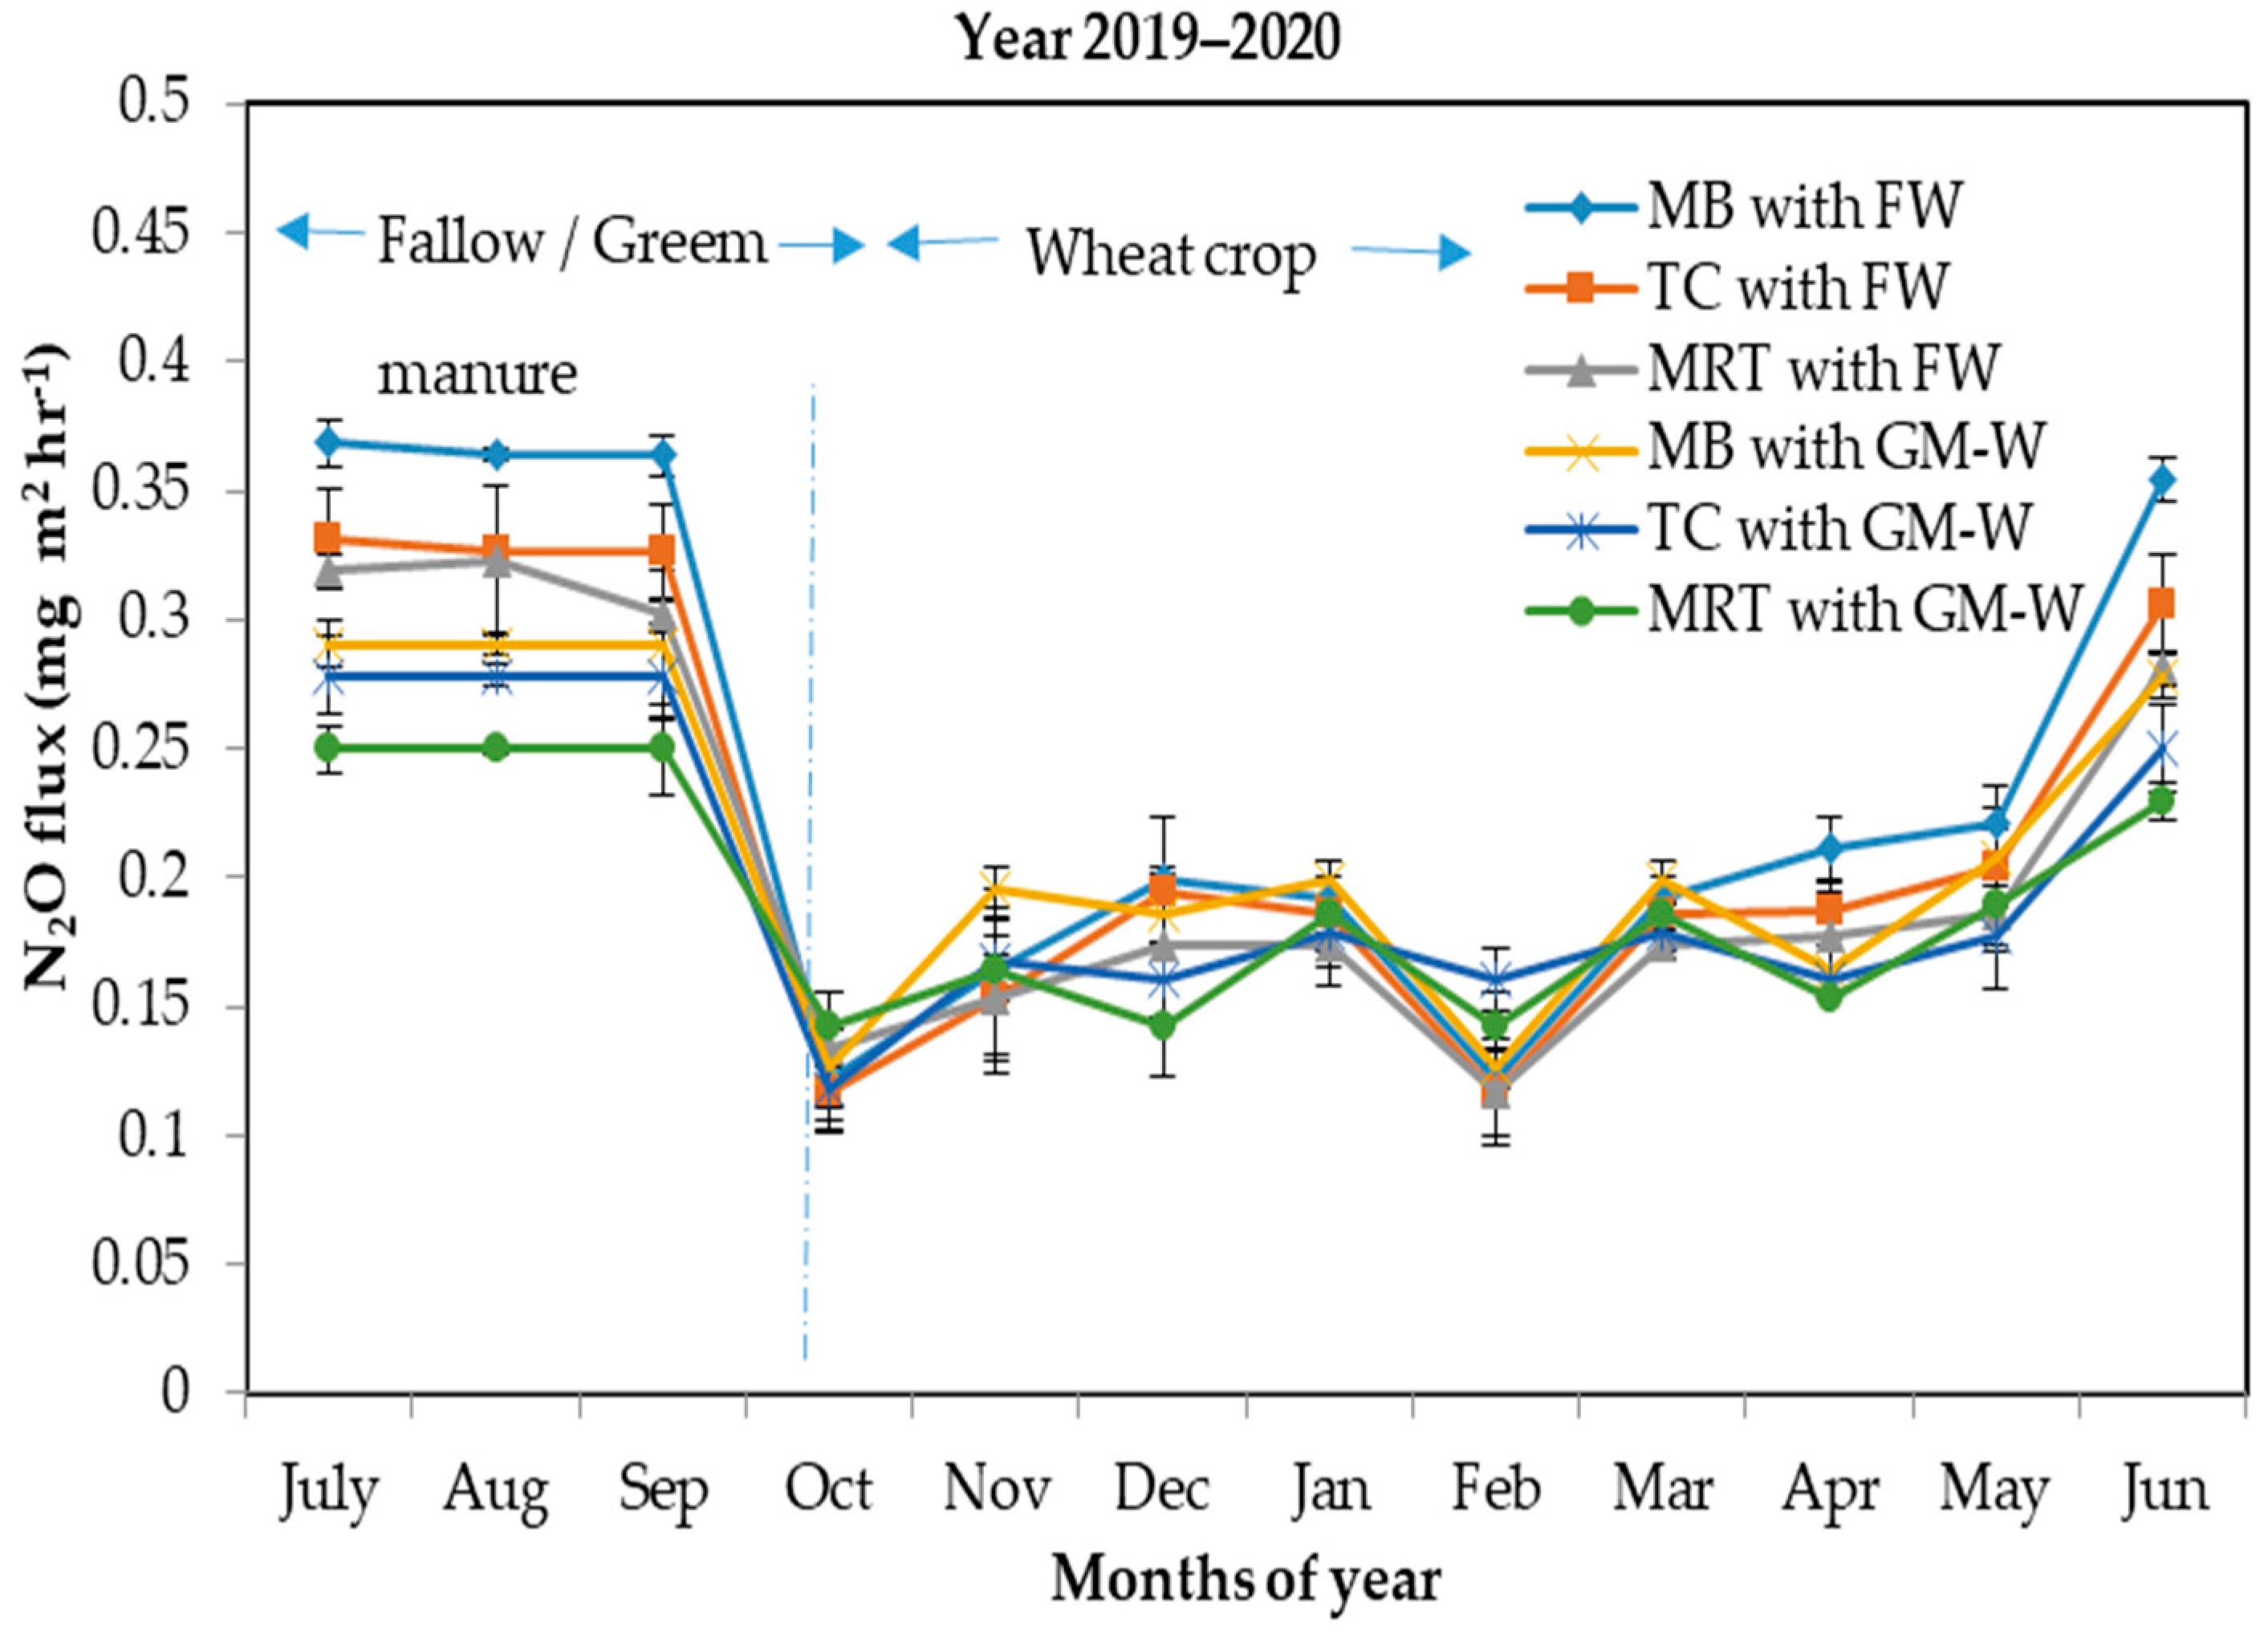
3.3. N2O Fluxes
3.4. Net Ecosystem Exchange (NEE), Global Warming Potential (GWP), and Greenhouse Gas Intensity (GHGI)
4. Discussion
4.1. Soil Moisture and Soil Temperature Affected by Different Tillage Practices and Crop Rotations
4.2. Effect of Tillage Practices and Crop Rotations on CO2 Emission
4.3. Impact of Tillage Practices and Crop Rotations on N2O Emissions
4.4. Net Ecosystem Exchange (NEE), Global Warming Potential (GWP), and Greenhouse Gas Intensity (GHGI) Influenced by Tillage Practices and Cropping Sequence
5. Conclusions
Author Contributions
Funding
Institutional Review Board Statement
Informed Consent Statement
Data Availability Statement
Acknowledgments
Conflicts of Interest
References
- Montzka, S.A.; Dlugokencky, E.J.; Butler, J.H. Non-CO2 greenhouse gases and climate change. Nature 2011, 476, 43–50. [Google Scholar] [CrossRef]
- Shakoor, A.; Shahbaz, M.; Farooq, T.H.; Sahar, N.E.; Shahzad, S.M.; Altaf, M.M.; Ashraf, M. A Global Meta-Analysis of Greenhouse Gases Emission and Crop Yield under No-Tillage as Compared to Conventional Tillage. Sci. Total Environ. 2021, 750, 142299. [Google Scholar] [CrossRef] [PubMed]
- IPCC. Climate Change Mitigation of Climate Change: Working Group I Contribution to the Fourth Assessment Report of the IPCC; Cambridge University Press: Cambridge, UK, 2014. [Google Scholar]
- EAT. Greenhouse Gas Emissions from Agriculture in the EU. Factsheet 1. 2015. Available online: http://www.europarl.europa.eu/RegData/etudes/BRIE/2015/571327/EPRS_BRI(2015)571327_EN.pdf (accessed on 2 July 2017).
- Philippe, F.-X.; Nicks, B. Review on greenhouse gas emissions from pig houses: Production of carbon dioxide, methane and nitrous oxide by animals and manure. Agric. Ecosyst. Environ. 2014, 199, 10–25. [Google Scholar] [CrossRef]
- Liu, T.Q.; Li, S.H.; Guo, L.G.; Cao, C.G.; Li, C.F.; Zhai, Z.B.; Ke, H.J. Advantages of nitrogen fertilizer deep placement in greenhouse gas emissions and net ecosystem economic benefits from no-tillage paddy fields. J. Clean. Prod. 2020, 263, 121322. [Google Scholar] [CrossRef]
- Tong, L.S.; Xiao, H.B.; Xu, K.; Zhan, Y.M.; Shi, Z.H. Stoichiometric Regulations of Soil Respiration and Its Temperature Sensitivity under Erosion and Deposition Conditions. Agric. Ecosyst. Environ. 2021, 319, 107507. [Google Scholar] [CrossRef]
- Zhou, L.M.; Jin, S.L.; Liu, C.A.; Xiong, Y.C.; Si, J.T.; Li, X.G.; Gan, Y.T.; Li, F.M. Ridge-Furrow and Plastic-Mulching Tillage Enhances Maize–Soil Interactions: Opportunities and Challenges in a Semiarid Agroecosystem. Field Crops Res. 2012, 126, 181–188. [Google Scholar] [CrossRef]
- Houghton, R.A. Balancing the Global Carbon Budget. Annu. Rev. Earth Planet. Sci. 2007, 35, 313–347. [Google Scholar] [CrossRef]
- Ren, W.; Banger, K.; Tao, B.; Yang, J.; Huang, Y.; Tian, H. Global pattern and change of cropland soil organic carbon during 1901–2010: Roles of climate, atmospheric chemistry, land use and management. Geogr. Sustain. 2020, 1, 59–69. [Google Scholar] [CrossRef]
- Murphy, B.W.; Sparrow, L.A.; Salmon, S.U.; Abbott, T.S.; Raison, R.J.; Downie, A.L. Organic carbon stocks in soils of New South Wales, Australia. Soil Res. 2007, 45, 255–272. [Google Scholar] [CrossRef]
- Gong, Y.; Li, P.; Sakagami, N.; Komatsuzaki, M. No-tillage with rye cover crop can reduce net global warming potential and yield-scaled global warming potential in the long-term organic soybean field. Soil Tillage Res. 2021, 205, 104747. [Google Scholar] [CrossRef]
- Shcherbak, I.; Millar, N.; Robertson, G.P. Global meta-analysis of the nonlinear response of soil nitrous oxide (N2O) emissions to fertilizer nitrogen. Proc. Natl. Acad. Sci. USA 2014, 111, 9199–9204. [Google Scholar] [CrossRef] [PubMed]
- Smith, P.; Reay, D.; Smith, J. Agricultural methane emissions and the potential for mitigation. Philos. Trans. R. Soc. A 2021, 379, 20200451. [Google Scholar] [CrossRef] [PubMed]
- Guenet, B.; Gabrielle, B.; Chenu, C.; Arrouays, D.; Balesdent, J.; Bernoux, M.; Zhou, F. Can N2O Emissions Offset the Benefits from Soil Organic Carbon Storage? Glob. Change Biol. 2021, 27, 237–256. [Google Scholar] [CrossRef] [PubMed]
- Dossou-Yovo, E.R.; Brüggemann, N.; Jesse, N.; Huat, J.; Ago, E.E.; Agbossou, E.K. Reducing soil CO2 emission and improving upland rice yield with no-tillage, straw mulch and nitrogen fertilization in northern Benin. Soil Tillage Res. 2016, 156, 44–53. [Google Scholar] [CrossRef]
- Madarász, B.; Jakab, G.; Szalai, Z.; Juhos, K.; Kotroczó, Z.; Tóth, A.; Ladányi, M. Long-Term Effects of Conservation Tillage on Soil Erosion in Central Europe: A Random Forest-Based Approach. Soil Tillage Res. 2021, 209, 104959. [Google Scholar] [CrossRef]
- Wang, Z.; Li, Y.; Li, T.; Zhao, D.; Liao, Y. Conservation Tillage Decreases Selection Pressure on Community Assembly in the Rhizosphere of Arbuscular Mycorrhizal Fungi. Sci. Total Environ. 2020, 710, 136326. [Google Scholar] [CrossRef] [PubMed]
- Kumar, V.; Saharawat, Y.S.; Gathala, M.K.; Jat, A.S.; Singh, S.K.; Chaudhary, N.; Jat, M.L. Effect of different tillage and seeding methods on energy use efficiency and productivity of wheat in the Indo-Gangetic Plains. Field Crops Res. 2013, 142, 1–8. [Google Scholar] [CrossRef]
- Fan, J.; Luo, R.; Liu, D.; Chen, Z.; Luo, J.; Boland, N.; Ding, W. Stover retention rather than no-till decreases the global warming potential of rainfed continuous maize cropland. Field Crops Res. 2018, 219, 14–23. [Google Scholar] [CrossRef]
- Xu, J.; Han, H.; Ning, T.; Li, Z.; Lal, R. Long-term effects of tillage and straw management on soil organic carbon, crop yield, and yield stability in a wheat-maize system. Field Crops Res. 2019, 233, 33–40. [Google Scholar] [CrossRef]
- Khan, M.A.; Mahmood, K.; Ahmad, M. Agricultural Land Use in the Pothwar Plateau. Pak. J. Agric. Res. 2004, 17, 131–138. [Google Scholar]
- Li, F.M.; Wang, J.; Xu, J.Z.; Xu, H.L.; Ma, L. Mulching Improves Yield and Water-Use Efficiency of Potato Cropping in China. Field Crops Res. 2013, 83, 297–311. [Google Scholar] [CrossRef]
- Zhang, S.; Li, Q.; Zhang, X.; Wei, K.; Chen, L. Effect of Plastic Mulch on Soil Water, Temperature and Degradation of Phenolic Acids in Salvia miltiorrhiza Bunge. Sci. Hortic. 2016, 204, 15–22. [Google Scholar] [CrossRef]
- Chen, X.; Stewart, P.S. Biofilm Removal Caused by Chemical Treatments. Water Res. 2007, 41, 965–974. [Google Scholar] [CrossRef] [PubMed]
- Kasirajan, S.; Ngouajio, M. Polyethylene and Biodegradable Mulches for Agricultural Applications: A Review. Agron. Sustain. Dev. 2012, 32, 501–529. [Google Scholar] [CrossRef]
- Stewart, P.S.; Franklin, M.J. Physiological Heterogeneity in Biofilms. Nat. Rev. Microbiol. 2008, 6, 199–210. [Google Scholar] [CrossRef]
- Lal, R. Sequestering carbon in soils of arid ecosystems. Land Degrad. Dev. 2009, 20, 441–454. [Google Scholar] [CrossRef]
- Sharif, M.; Ijaz, S.S.; Ali, S.; Ansar, M.; Hassan, A. Prediction of Tillage Operation Strategies for Dryland Wheat Production in a Degraded Loess Soil. Arch. Agron. Soil Sci. 2017, 63, 1137–1149. [Google Scholar] [CrossRef]
- ur Rehman, S.; Ijaz, S.S.; Raza, M.A.; Din, A.M.U.; Khan, K.S.; Fatima, S.; Ansar, M. Soil Organic Carbon Sequestration and Modeling under Conservation Tillage and Cropping Systems in a Rainfed Agriculture. Eur. J. Agron. 2023, 147, 126840. [Google Scholar] [CrossRef]
- Sharif, M.; Ijaz, S.S.; Ali, S.; Ansar, M.; Hassan, A. Buildup of Soil Organic Carbon and Stable Aggregates under Conservation Tillage in Loess Dryland Soil. J. Biodivers. Environ. Sci. 2015, 6, 446–453. [Google Scholar]
- Wraith, J.M.; Robinson, D.A.; Jones, S.B.; Long, D.S. Spatially Characterizing Apparent Electrical Conductivity and Water Content of Surface Soils with Time Domain Reflectometry. Comput. Electron. Agric. 2005, 46, 239–261. [Google Scholar] [CrossRef]
- Gomes, J.; Bayer, C.; de Souza Costa, F.; de Cássia Oiccolo, M.; Znatta, J.A.; Vieira, C.B.; Six, J. Soil nitrous oxide emissions in long-term cover crops-based rotations under subtropical climate. Soil Tillage Res. 2009, 106, 36–44. [Google Scholar] [CrossRef]
- Zhang, A.; Cui, L.; Pan, G.; Li, L.; Hussain, Q.; Zhang, X.; Zheng, J.; Crowley, D. Effect of biochar amendment on yield and methane and nitrous oxide emissions from a rice paddy from Tai Lake Plain, China. Agric. Ecosyst. Environ. 2010, 139, 469–475. [Google Scholar] [CrossRef]
- Huang, Y.; Ren, W.; Wang, L.; Hui, D.; Grove, J.H.; Yang, X.; Goff, B. Greenhouse gas emissions and crop yield in no-tillage systems: A meta-analysis. Agric. Ecosyst. Environ. 2018, 268, 144–153. [Google Scholar] [CrossRef]
- Zheng, X.; Xie, B.; Liu, C.; Zhou, Z.; Yao, Z.; Wang, Y.; Wang, Y.; Yang, L.; Zhu, J.; Huang, Y.; et al. Quantifying net ecosystem carbon dioxide exchange of a short-plant cropland with intermittent chamber measurements. Glob. Biogeochem. 2008, 22, 3. [Google Scholar] [CrossRef]
- Osaki, M.; Shinano, T.; Tadano, T. Carbon-nitrogen interaction in field crop production. Soil Sci. Plant Nutr. 1992, 38, 553–564. [Google Scholar] [CrossRef]
- Steel, R.G.D.; Torrie, J.H.; Dicky, D.A. Principles and Procedures of Statistics, A Biometrical Approach, 3rd ed.; McGraw Hill, Inc. Book Co.: New York, NY, USA, 1997; pp. 352–358. [Google Scholar]
- Makki, E.K.; El-amin Mohamed, A. Tillage implements performance and effect on some soil physical properties. AMA Agric. Mech. Asia Afr. Lat. Am. 2008, 39, 9. [Google Scholar]
- Laddha, K.C.; Totawat, K.L. Effects of deep tillage under rainfed agriculture on production of sorghum (Sorghum biocolor L. Moench) intercropped with green gram (Vigna radiata L. Wilczek) in western India. Soil Tillage Res. 1997; 43, 241–250. [Google Scholar] [CrossRef]
- Das, T.K.; Nath, C.P.; Das, S.; Biswas, S.; Bhattacharyya, R.; Sudhishri, S.; Chaudhari, S.K. Conservation Agriculture in rice-mustard cropping system for five years: Impacts on crop productivity, profitability, water-use efficiency, and soil properties. Field Crops Res. 2020; 250, 107781. [Google Scholar] [CrossRef]
- Hillel, D. Introduction to Environmental Soil Physics; Elsevier: Amsterdam, The Netherlands, 2003. [Google Scholar]
- Lichet, M.A.; Al-Kaisi, M. Strip-tillage effect on seedbed soil temperature and other soil physical properties. Soil Tillage Res. 2005, 80, 233–249. [Google Scholar] [CrossRef]
- Six, J.; Ogle, S.; Breidt, F.J.; Conant, R.T.; Mosier, A.R.; Paustian, K. The potential to mitigate global warming with no-tillage management is only realized when practice is in the long term. Glob. Change Biol. 2004, 10, 155–160. [Google Scholar] [CrossRef]
- Lal, R. Soil carbon sequestration impacts on global climate change and food security. Science 2004, 304, 1623–1627. [Google Scholar] [CrossRef]
- Reicosky, D.C.; Archer, D.W. Moldboard plow tillage depth and short-term carbon dioxide release. Soil Tillage Res. 2007, 94, 109–121. [Google Scholar] [CrossRef]
- Davidson, E.A.; Janssens, I.A. Temperature sensitivity of soil carbon decomposition and feedbacks to climate change. Nature 2006, 440, 165–173. [Google Scholar] [CrossRef]
- Smith, P.; Martino, D.; Cai, Z.; Gwary, D.; Janzen, H.; Kumar, P.; Smith, J. Greenhouse gas mitigation in agriculture. Philos. Trans. R. Soc. B Biol. Sci. 2008, 363, 789–813. [Google Scholar] [CrossRef]
- Post, W.M.; Kwon, K.C. Soil carbon sequestration and land-use change: Processes and potential. Glob. Change Biol. 2000, 6, 317–327. [Google Scholar] [CrossRef]
- Parkin, T.B.; Kaspar, T.C. Nitrous oxide emissions from corn-soybean systems in the Midwest. J. Environ. Qual. 2006, 35, 1496–1506. [Google Scholar] [CrossRef]
- Conant, R.T.; Paustian, K.; Elliott, E.T. Grassland management and conversion into grassland: Effects on soil carbon. Ecol. Appl. 2011, 11, 343–355. [Google Scholar] [CrossRef]
- Chatskikh, D.; Olesen, J.E. Soil tillage enhanced CO2 and N2O emissions from loamy sand soil under spring barley. Soil Tillage Res. 2007, 97, 5–18. [Google Scholar] [CrossRef]
- Oorts, K.; Merckx, R.; Gréhan, E.; Labreuche, J.; Nicolardot, B. Determinants of annual fluxes of CO2 and N2O in long-term no-tillage and conventional tillage systems in northern France. Soil Tillage Res. 2007, 95, 133–148. [Google Scholar] [CrossRef]
- Beare, M.H.; Gregorich, E.G.; St-Georges, P. Compaction effects on CO2 and N2O production during drying and rewetting of soil. Soil Biol. Biochem. 2009, 41, 611–621. [Google Scholar] [CrossRef]
- Butterbach-Bahl, K.; Baggs, E.M.; Dannenmann, M.; Kiese, R.; Zechmeister-Boltenstern, S. Nitrous oxide emissions from soils: How well do we understand the processes and their controls? Philos. Trans. R. Soc. B Biol. Sci. 2013, 368, 20130122. [Google Scholar] [CrossRef] [PubMed]
- Venterea, R.T.; Burger, M.; Spokas, K.A. Nitrogen oxide and methane emissions under varying tillage and fertilizer management. J. Environ. Qual. 2005, 34, 1467–1477. [Google Scholar] [CrossRef] [PubMed]
- Bouwman, A.F.; Boumans, L.J.M.; Batjes, N.H. Emissions of N2O and NO from fertilized fields: Summary of available measurement data. Glob. Biogeochem. Cycles 2002, 16, 6-1–6-13. [Google Scholar] [CrossRef]
- Mutegi, J.K.; Munkholm, L.J.; Petersen, B.M.; Hansen, E.M.; Petersen, S.O. Nitrous oxide emissions and controls as influenced by tillage and crop residue management strategy. Soil Biol. Biochem. 2010, 42, 1701–1711. [Google Scholar] [CrossRef]
- Li, Y.; Moinet, G.Y.; Clough, T.J.; Whitehead, D. Organic matter contributions to nitrous oxide emissions following nitrate addition are not proportional to substrate-induced soil carbon priming. Sci. Total Environ. 2022, 851, 158274. [Google Scholar] [CrossRef]
- Rastogi, M.; Singh, S.; Pathak, H. Emission of carbon dioxide from soil. Curr. Sci. 2002, 82, 510–517. [Google Scholar]
- Schmidt, M.W.; Torn, M.S.; Abiven, S.; Dittmar, T.; Guggenberger, G.; Janssens, I.A.; Kleber, M.; Kögel-Knabner, I.; Lehmann, J.; Manning, D.A. Persistence of soil organic matter as an ecosystem property. Nature 2011, 478, 49–56. [Google Scholar] [CrossRef]
- Azooz, R.; Lowery, B.; Daniel, T.; Arshad, M. Impact of tillage and residue management on soil heat flux. Agric. For. Meteorol. 1997, 84, 207–222. [Google Scholar] [CrossRef]
- Beyaert, R.P.; Schott, J.W.; White, P.H. Tillage effects on corn production in a coarse-textured soil in southern Ontario. Agron. J. 2002, 94, 767–774. [Google Scholar] [CrossRef]
- Wan, S.; Hui, D.; Wallace, L.; Luo, Y. Direct and indirect effects of experimental warming on ecosystem carbon processes in a tallgrass prairie. Glob. Biogeochem. Cycles 2005, 19, 9–13. [Google Scholar] [CrossRef]
- Ussiri, D.A.; Lal, R. Long-term tillage effects on soil carbon storage and carbon dioxide emissions in continuous corn cropping system from an alfisol in Ohio. Soil Tillage Res. 2009, 104, 39–47. [Google Scholar] [CrossRef]
- Lv, J.; Yin, X.; Dorich, C.; Olave, R.; Wang, X.; Kou, C.; Song, X. Net field global warming potential and greenhouse gas intensity in typical arid cropping systems of China: A 3-year field measurement from long-term fertilizer experiments. Soil Tillage Res. 2021, 212, 105053. [Google Scholar] [CrossRef]
- Mosier, A.R.; Halvorson, A.D.; Reule, C.A.; Liu, X.J. Net global warming potential and greenhouse gas intensity in irrigated cropping systems in northeastern Colorado. J. Environ. Qual. 2006, 35, 1584–1598. [Google Scholar] [CrossRef] [PubMed]


| Tillage Systems | Crop Rotations | Summer Season | Winter Season | Annual | |
|---|---|---|---|---|---|
| NEE | NEE | NEE | |||
| Mg ha−1 | |||||
| Year 2018–2019 | MB | FW | 9.28 A | 3.35 A | 12.63 A |
| GW | 2.93 C | 2.08 A | 5.01 C | ||
| TC | FW | 8.62 B | 1.91 A | 10.53 B | |
| GW | 2.36 D | 2.95 A | 5.31 C | ||
| MRT | FW | 8.54 B | 2.25 A | 10.79 B | |
| GW | 1.93 D | 2.53 A | 4.46 C | ||
| Year 2019–2020 | MB | FW | 8.44 A | 3.49 A | 11.93 A |
| GW | 2.14 B | 2.42 A | 4.56 B | ||
| TC | FW | 7.90 A | 2.24 A | 10.24 A | |
| GW | 1.58 B | 2.66 A | 4.24 B | ||
| MRT | FW | 7.66 A | 2.65 A | 10.31 A | |
| GW | 1.23 B | 4.00 A | 3.88 B | ||
| Tillage Systems | Crop Rotations | GWP t C ha−1 year−1 | GHGI t C ha−1 year−1 |
|---|---|---|---|
| Moldboard Plough | Fallow–Wheat | 93.90 A | 31.44 A |
| Green manure–Wheat | 89.94 AB | 28.95 BC | |
| Tine Cultivator | Fallow–Wheat | 88.58 BC | 29.32 AB |
| Green manure–Wheat | 83.10 BCD | 25.14 CD | |
| Modified Reduced Tillage | Fallow–Wheat | 84.38 CD | 25.64 C |
| Green manure–Wheat | 77.65 D | 22.79 D |
Disclaimer/Publisher’s Note: The statements, opinions and data contained in all publications are solely those of the individual author(s) and contributor(s) and not of MDPI and/or the editor(s). MDPI and/or the editor(s) disclaim responsibility for any injury to people or property resulting from any ideas, methods, instructions or products referred to in the content. |
© 2024 by the authors. Licensee MDPI, Basel, Switzerland. This article is an open access article distributed under the terms and conditions of the Creative Commons Attribution (CC BY) license (https://creativecommons.org/licenses/by/4.0/).
Share and Cite
Javed, N.; Ijaz, S.S.; Hussain, Q.; Ansar, M.; Alrefaei, A.F.; Almutairi, B.O.; Zaman, W.; Yousra, M. Potential of Modified Reduced Tillage with Cover/Green Manure Crop for Climate Change Mitigation in a Smallholder Rainfed Farming System. Sustainability 2024, 16, 4781. https://doi.org/10.3390/su16114781
Javed N, Ijaz SS, Hussain Q, Ansar M, Alrefaei AF, Almutairi BO, Zaman W, Yousra M. Potential of Modified Reduced Tillage with Cover/Green Manure Crop for Climate Change Mitigation in a Smallholder Rainfed Farming System. Sustainability. 2024; 16(11):4781. https://doi.org/10.3390/su16114781
Chicago/Turabian StyleJaved, Nabeeha, Shahzada Sohail Ijaz, Qaiser Hussain, Muhammad Ansar, Abdulwahed Fahad Alrefaei, Bader O. Almutairi, Wajid Zaman, and Munazza Yousra. 2024. "Potential of Modified Reduced Tillage with Cover/Green Manure Crop for Climate Change Mitigation in a Smallholder Rainfed Farming System" Sustainability 16, no. 11: 4781. https://doi.org/10.3390/su16114781
APA StyleJaved, N., Ijaz, S. S., Hussain, Q., Ansar, M., Alrefaei, A. F., Almutairi, B. O., Zaman, W., & Yousra, M. (2024). Potential of Modified Reduced Tillage with Cover/Green Manure Crop for Climate Change Mitigation in a Smallholder Rainfed Farming System. Sustainability, 16(11), 4781. https://doi.org/10.3390/su16114781