Abstract
Libya is facing a serious challenge in its sustainable development because of its complete dependence on traditional fuels in meeting its growing energy demand. On the other hand, more intensive energy utilization accommodating multiple energy resources, including renewables, has gained considerable attention. This article is motivated by the obvious need for research on this topic due to the shortage of applications concerning the prospects of the hybridization of energy systems for electric power generation in Libya. The 283 MW single-cycle gas turbine operating at the Sarir power plant located in the Libyan desert is considered a case study for a proposed Integrated Solar Combined Cycle (ISCC) system. By utilizing the common infrastructure of a gas-fired power plant and concentrating solar power (CSP) technology, a triple hybrid system is modeled using the EES programming tool. The triple hybrid system consists of (i) a closed Brayton cycle (BC), (ii) a Rankine cycle (RC), which uses heat derived from a parabolic collector field in addition to the waste heat of the BC, and (iii) an organic Rankine cycle (ORC), which is involved in recovering waste heat from the RC. A thermodynamic analysis of the developed triple combined power plant shows that the global power output ranges between 416 MW (in December) and a maximum of 452.9 MW, which was obtained in July. The highest overall system efficiency of 44.3% was achieved in December at a pressure ratio of 12 and 20% of steam fraction in the RC. The monthly capital investment cost for the ISCC facility varies between 52.59 USD/MWh and 58.19 USD/MWh. From an environmental perspective, the ISCC facility can achieve a carbon footprint of up to 319 kg/MWh on a monthly basis compared to 589 kg/MWh for the base BC plant, which represents a reduction of up to 46%. This study could stimulate decision makers to adopt ISCC power plants in Libya and in other developing oil-producing countries.
1. Background and Motivation
Energy security, economic growth, social responsibility, and the protection of the environment are the essential pillars of sustainable development [1]. Unfortunately, the current actions taken in Libya are associated with threats to its energy security and economic development. The sustainability of electrical energy systems in Libya is indeed not secure. The total installed electric power capacity in 2008 amounted to 6300 MW, which mostly came from oil-fueled steam turbines in addition to a handful of gas-fired plants. Later on, some turbines were converted to gas turbines to increase the amount of oil available for export [2]. As of 2023, natural gas-fueled power plants were dominating, supplying nearly 60% of the electrical energy need. Prior to the political unrest in 2011, the electrical power system performed well, indicating that a comfortable buffer was available between capacity and demand [3,4]. Nevertheless, as a result of growing electrical demand, aging systems, and inadequate routine overhauls, in addition to massive destruction in the electrical infrastructure, power production has been consistently below electrical demand, resulting in regular outages and blackouts [5]. This is evident from an official recent governmental energy report, as tabulated in Table 1, and it is the current living reality of Libyan citizens. Peak electrical load has increased excessively in the past two decades, from 2500 MW in 2000 to approximately 8235 MW in 2023. Moreover, peak electrical energy demand is anticipated to reach 12 GW by 2028 and 20 GW by 2035 [6]. At present, Libya imports the energy deficit from Tunisia and Egypt to alleviate the problem.

Table 1.
Electrical energy data in Libya between 2017 and 2021.
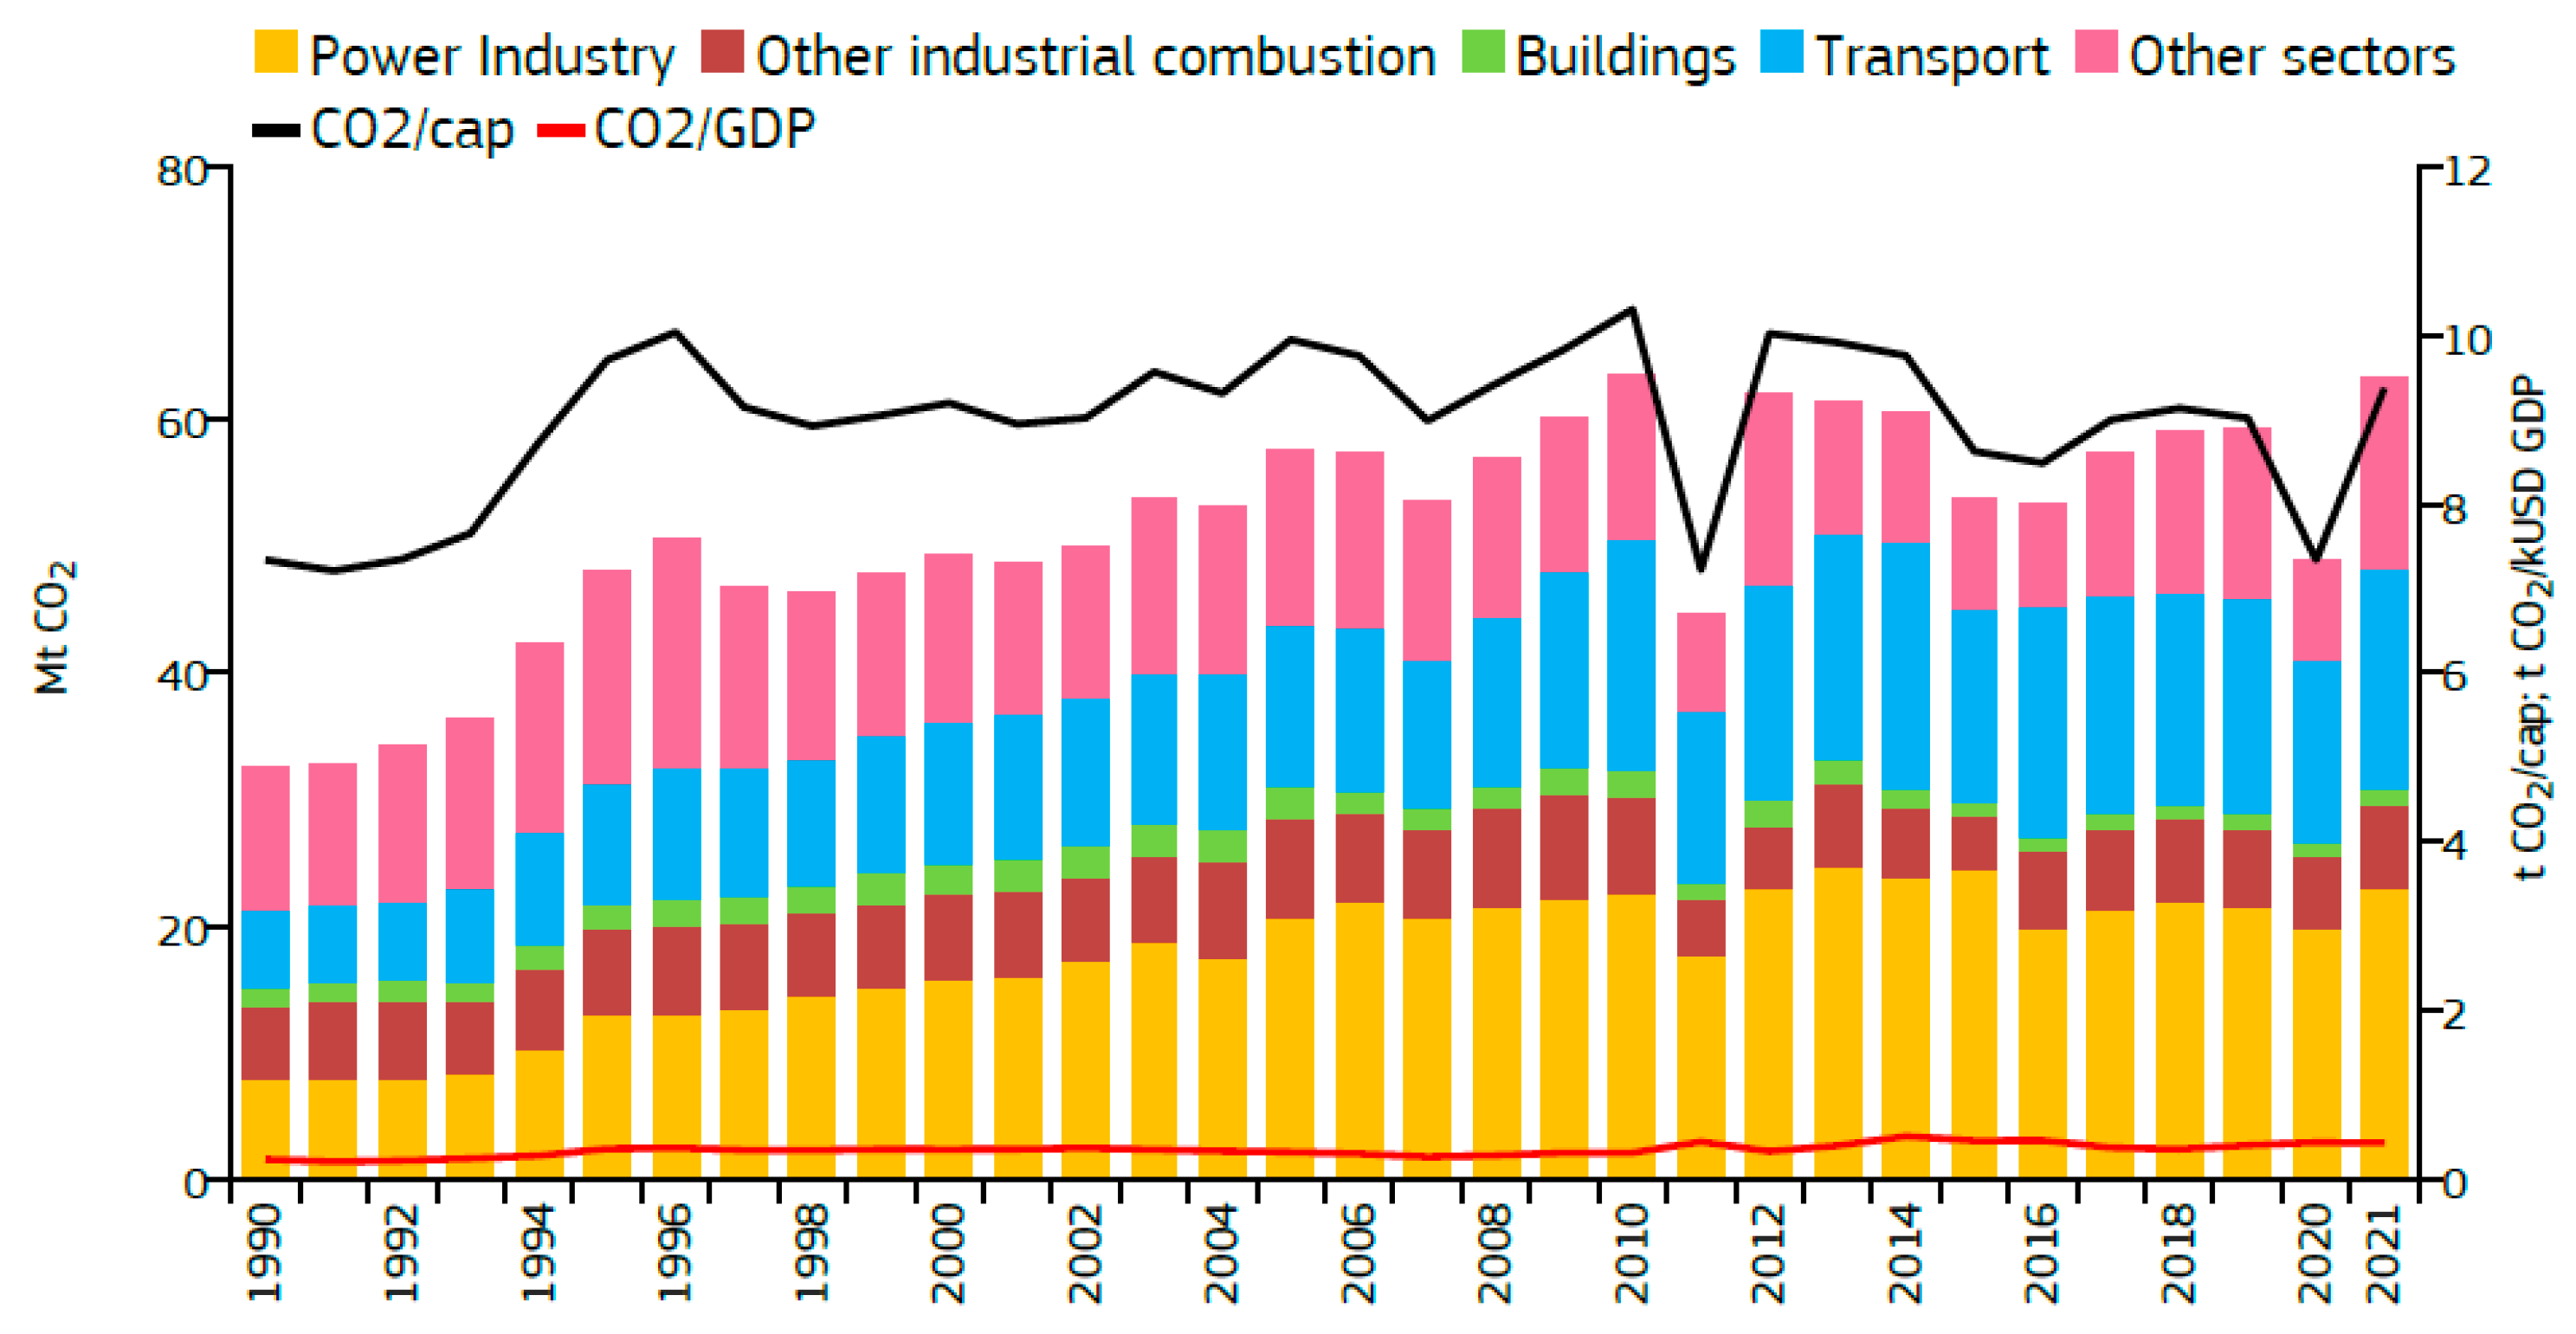
On the other hand, Libya is a member of the OPEC; with 48 billion barrels and 1.5 trillion m3 of oil, this North African nation holds the largest and fifth largest proven oil and gas reserves in Africa, respectively [7]. Nevertheless, these reserves only hold enough resources to last approximately 77 and 100 years, based on the regular production levels of 1.2 M barrel/day, before they run out. As the production of electrical power in Libya is entirely dependent on fossil fuels, this situation has severe consequences on sustainability. In addition, the primary contributor of greenhouse gas (GHG) emissions is carbon dioxide (CO2), with 90% of its stake stemming from traditional fuel combustion [8]. CO2 emissions and other poisonous emissions have a grave impact on the environment, including many deleterious alterations to the global climate. CO2 emissions in Libya reached around 63 Mt in 2021 compared to 27 Mt of total CO2 emissions in 1980. This is greater than the contributions of some developed industrial countries, such as Sweden (38.9 Mt) and Switzerland (35 Mt). Between 1990 and 2021, the CO2 arising from the Libyan power industry increased by 188% [9]. Figure 1 shows the CO2 emissions contributed by different sectors in Libya.
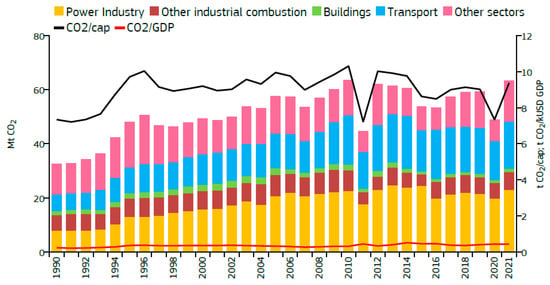
Figure 1.
Fossil CO2 emissions based on sector in Libya.
From an economic perspective, as Libya exclusively relies on depletable fuels, with fossil fuels accounting for more than 60% of the GDP [10], the country is facing existential challenges to diversify its income sources. In contrast to fossil energy sources, renewable energy (RE) holds the key to offer a sustainable solution to the energy crisis, in addition to becoming an innovation-driven economy, with a resilient carbon footprint to face climate change [11]. Evidence from numerous countries has proven that RE sources, such as wind, solar, hydro, and biofuel energy, have contributed immensely to the sustainability of energy systems with remarkable environmental and socioeconomic benefits [12]. The share of RE sources in Libya’s primary energy supply is incomparable with other developing countries despite the intention for development being positive. The 2011 political uprising and ensuing internal conflicts have impeded its ambitious 2007 national RE plan of having 2200 MW of renewables by 2025 [13].
This paper is one of the first works investigating the utilization of multiple energy sources, including RE, in existing gas-fueled power stations in Libya with the aim of resolving the energy shortage problem in the country and sustainably meeting its future energy needs. The scope of this study involves exploring the use of hybrid energy systems for electricity generation at the Sarir power facility, specifically combining existing gas-fired power infrastructure with CSP technology. An energy, exergy, exergoeconomic, and environmental analysis, abbreviated as a 4E analysis, is carried out in this work. The proposed hybrid approach maximizes the energy production of the gas power stations while minimizing the reliance on conventional fuels. To the best of our knowledge, so far, no one has analyzed the possibility of integrating an ISCC into the Libyan energy system; hence, the viability of hybrid solar–gas power facilities has also not been studied. This work could stimulate other developing countries that share a similar climate and geopolitical disposition to Libya. This paper starts with a brief review of major RE sources available in Libya. The hybridization potential of various energy sources, including renewables, is then discussed, followed by the design and modeling of a 485 MW hybrid CSP–gas power plant to be installed at Sarir, in the center of Libya. A performance analysis of the designed hybrid power units follows, and finally, conclusions and recommendations are presented.
2. Potential of RE Resources in Libya
The Mediterranean state is home to vast RE resources. In Libya, the General Electric Company of Libya (GECOL) is responsible for the generation, transmission, and distribution of electricity. In order to sustainably fulfill the growing electricity demand, the Renewable Energy Authority of Libya (REAoL) was established in 2007 with a strategic aim to bring the share of RE in electricity generation to 10% by 2025 [13].
As it is located on the global sun belt, the solar energy incident onto a horizontal plane ranges between 5.4 kWh/m2/day and 7 kWh/m2/day throughout Libya [14]. The global annual solar energy incident onto a horizontal plane of 1 m2 exceeds 2400 kWh over a major part of the country [3]. Besides solar PV, CSP technology is also a sustainable and low-carbon energy resource. This technology does not emit GHGs in its standalone configuration. Although solar PV-based electricity is currently cheaper, CSP technology excels in other aspects, such as solar-to-electricity efficiency, investment costs for storage (lower), and broader hybridization options [15].
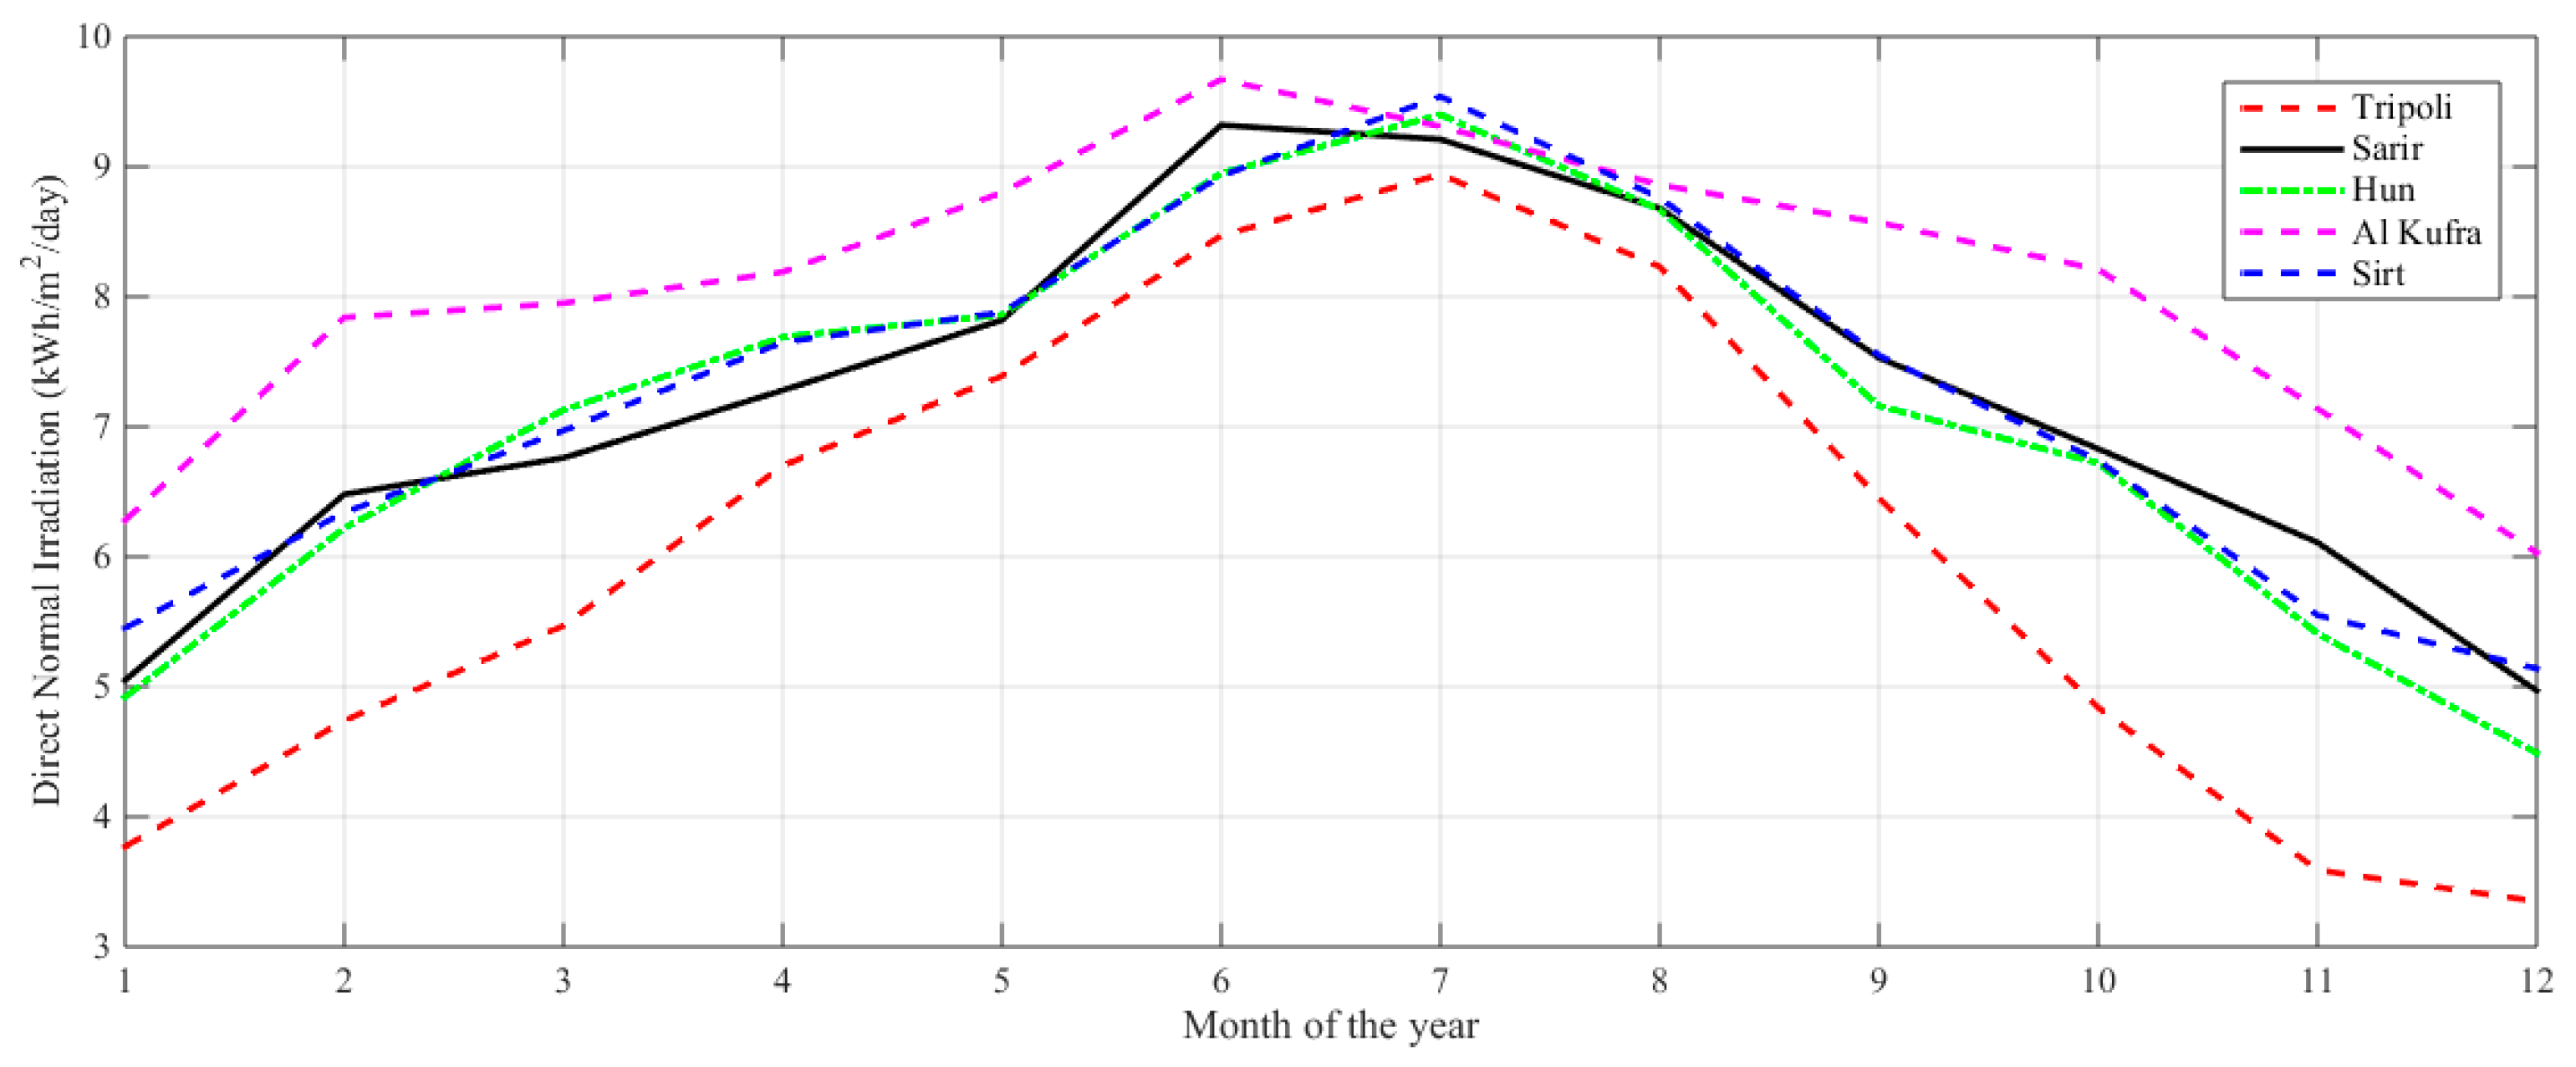
Site preference for CSP adoption mainly depends on the locational assessment of solar resources. Within the geographical boundaries of Libya, there are multiple choices of potential sites with a direct normal irradiance (DNI) of up to 2900 kWh/m2/yr. Figure 2 shows the long-term average monthly DNIs at six different locations around the country, extracted from [16]. In this research, the Sarir area (28.22° N, 19.13° E) in the middle of Libya was selected as a study site for the proposed hybrid CSP plant because it hosts an operational gas power facility. The selected area receives an annual average direct normal irradiance of 7.17 kWh/m2/day.
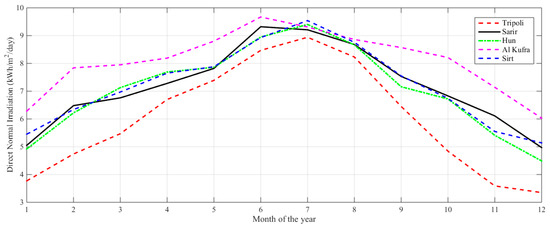
Figure 2.
The direct normal irradiation for a number of selected locations in Libya.
Due to the political instability over the past decade, the contribution of RE technologies in Libya has been trivial in satisfying the basic energy requirements. Optimistically, in December 2023, the Libyan government issued the modified National Strategy for Renewable Energy and Energy Efficiency 2023–2035 that would hopefully bring the contribution of renewable energies to 20% in the total energy mix. According to the modified RE plan, 4000 MW of renewables is to be installed throughout Libya. Table 2 summarizes the strategic targets of RE in Libya, the potential of each technology, and preferred locations [17]. Since the strategic plan overlooked the hybrid applications of energy systems, one of the motivations behind this article is shedding light on the importance and applicability of hybridization technology. As far as Libya is concerned, hybridization can first commence with existing gas-fired power plants to ultimately reach full RE hybridization.

Table 2.
RE strategy and potential in Libya.
3. Hybrid Power Generation
The development of a power generation source with higher efficiency and lower costs has been a cumbersome job in the power industry. Currently, gas turbines in a combined cycle configuration (CCGT), i.e., Brayton cycles in series with Rankine cycles, offer the highest possible conversion efficiency of all of today’s fossil-fired power plants. However, the integration of multiple generators of different technologies has been attracting a good deal of interest [18,19]. In addition to its cost competitiveness and greater overall efficiency, the hybridization of two or more energy sources offers a higher capacity factor compared to single-source power supplies [20,21]. According to the literature, CSP technology is among the most prioritized technologies to be hybridized with different fossil and renewable fuels [22,23].
3.1. CSP–Fossil Hybridization
Stand-alone CSP (SACSP) plants experience weak dispatchability due to the intermittent nature of solar energy. This coherent characteristic necessitates the use of thermal energy storage (TES) systems [24]. In order for an SACSP to be more reliably dispatchable, a TES capacity in the range of 4 to 10 days is required, accounting for any period of extended cloud cover, even for locations with a good solar resource [25]. However, it has been reported that increasing the TES beyond three hours significantly increases the capital cost of a CSP facility. Therefore, to provide a firm and economic power supply, an optimized hybrid system involving fossil fuels with a robust control mechanism handling the transient operational modes is introduced [26].
Based on the type of fossil fuels, a CSP can be hybridized with coal and natural gas [27]. Solar heat can be incorporated into a coal power plant in various components, such as solar-aided boiler feedwater [28] and air pre-heating [29], solar steam generation (direct and indirect via heat exchange) for a typical RC [30], solar-assisted solvent regeneration in after-combustion CO2 capture [31], and a solar-augmented coal gasification combined cycle [32]. The maximum instantaneous solar fraction in the solar–coal power plant ranges between 6% and 30% with a maximum solar-to-electricity efficiency of up to 40% [33]. While coal offers robust reliability and cost effectiveness, the solar heat provided by the CSP reduces the overall CO2 emissions of the hybrid power plant. Nevertheless, most currently operational coal-fired power plants worldwide are reaching the end of their service lives [34]. Furthermore, Libya does not have any coal reserves to date.
On the other hand, the hybridization of CSP with natural gas offers several advantages, including the abundance of natural gas, high energy density, and much lower emissions due to the lower carbon-to-hydrogen ratio than those of other fossil fuels. Moreover, gas turbines have operational flexibility for power dispatchability. Hybridization can be accomplished in several ways, such as through solar-assisted gas turbines [35], steam injection gas turbines (STIGT) [36], solar steam turbines, an Integrated Solar Combined Cycle (ISCC) [37], and solar methane steam reforming (MSR) [33].
In solar-aided gas turbines, CSP is used for air heating in a gas turbine. Solar heat is typically added to the cycle post-compression and pre-combustion, i.e., a pressurized air solar receiver is used to heat pre-combustion air. Meanwhile, the fueled combustion chamber assures that the required high operating temperatures for the system are obtained regardless of the amount of instantaneous solar radiation [38]. Because gas turbines operate at significantly higher temperatures (typically > 1000 °C) to achieve adequate cycle efficiency, either a central tower or a parabolic dish is used as a solar receiver to provide temperatures of over 800 °C. A high solar share is obtainable in such a hybrid system, especially during the peak sunlight hours of the day [39,40]. The Solugas project near Seville, Spain is the first megawatt-scale hybrid solarized gas power facility which has been effectively operational since 2012. While the solar heat collection medium, pressurized air, is heated to up to 800 °C in the solar receiver, gas combustion is used to further increase the air temperature up to 1150 °C at a nominal operating pressure of 9 bars [41].
In an STIGT, the heat input of the turbine is augmented with steam that is typically generated by heat exchanged with the turbine’s exhaust in an HRSG (heat recovery steam generator). Steam injection into the combustion chamber provides additional power and reduces NOx pollutants. In addition to being an economically feasible option, the efficiency of this modified gas turbine is comparable to, or even better than, other available commercial technologies [42]. On the other hand, solar thermal energy can alternatively be utilized to generate steam using CSP. This retrofitted gas turbine cycle is promising in the sense that it requires lower temperature conditions as the supplemental steam can be injected close to the steam’s saturation temperature, i.e., 200–300 °C [43]. Thus, linear Fresnel and parabolic trough technologies are appropriate to accomplish steam generation objectives. Moreover, solar STIGT technology could also be used together with solar steam turbines in a CC configuration for greater exploitation [28]. However, one disadvantage of the involvement of solar heat in an STIGT as a steam generator is that the cycle still relies on fuel combustion to heat the gas, making the solar share relatively low (~30%). In addition, the technology is largely unexploited and still under development [43,44].
Previous studies demonstrate that the use of steam turbines, utilizing parabolic trough technology in a hybrid system, is more predominant [45]. Typically, solar steam turbines are built in standalone operation mode and, therefore, require a fuel source as a backup to add flexibility and reliability to the system. The auxiliary boiler can be supplied by any combustible fossil fuel source. These plants are also called hybrid CSP-Rankine cycles because they operate on an RC basis with a heat exchanger [46]. In such hybrid plants, the solar share varies with the seasonal variation in solar input; however, TES can be involved to increase the solar contribution [47]. With the inherent limitation of RC in terms of efficiency, more research and development has been devoted to the ISCC concept.
ISCC plants use natural gas to fuel BC gas turbines along with recovered waste heat in an HRSG to run a steam cycle, with solar heat often being integrated into the bottoming steam cycle [48]. Both linear and central receivers can be used to obtain a wide range of solar collection heat, yet most of the ISCC power systems in operation today use PTC (parabolic) technology. When compared to standalone CSP technology, the ISCC configuration reduces solar electricity costs by 35–40% [49] and can provide a significant solar share, resulting in substantial fuel savings [50]. Behar et al. [51] reported that ISCC systems using parabolic troughs and direct steam generation (DSG ISCC) technology outperform those with HTF technology (HTF ISCC). They also stated that DSG ISCC systems have greater thermal efficiency, a 3% lower levelized energy cost, and 2.5% less GHG emissions.
One of the demonstrated technologies used for producing hydrogen is methane steam reforming [52]. Using appropriate catalysts (most commonly nickel-based catalysts), under operating conditions of 800–1000 °C and 14–20 bars, methane (natural gas) reacts with steam to produce syngas, i.e., hydrogen-rich gas [52]. However, this process is associated with excessive CO2 emissions. On the other hand, CSP technology can be harnessed as a high-temperature heat source in the steam reforming of methane for cleaner hydrogen production. The use of solar heat can avoid up to 35 to 40% of the CO2 emissions derived from conventional MSR process based on fossil fuels [53]. In [54], a “low-temperature” pilot solar steam reformer of methane for hydrogen production operating at a maximum temperature of 550 °C was designed and experimentally validated. In another recent development, utilizing the full spectrum of sunlight, Sui et al. proposed a thermochemical and electrochemical hybrid model comprising a solar thermal MSR and PV-sourced water electrolysis for low-carbon hydrogen production. The proposed route yields more than 4% hydrogen and saves 3.8% of fossil fuels compared to a separate conventional MSR and PV-electrolysis-based system [55].
Theoretically and practically, there has been a consensus that integrating solar energy together with fossil fuels in hybrid configurations has several benefits, including higher energy and exergy efficiencies [56], higher annual electricity generation [57], lower emissions and a levelized cost of energy due to shared components and the absence of thermal storage [58], and a maximum operation of power plants during intermittent solar irradiance conditions [59]. Moreover, this method has a broader application, especially when hybridized with a gas-fired CHP plant [60]. Several hybrid power plants, mostly of the ISCC type, have recently been established around the world. Table 3 lists the fossil-fueled ISCC power plants available worldwide.

Table 3.
Hybrid CSP–fossil power plants around the world.
3.2. Hybridization of CSP with Other RE Sources
Contrarily, pairing CSP plants with other renewables has the greatest potential in decelerating climate change and providing a sustainable energy alternative. For instance, the hybridization of CSP plants with biomass and biofuel is a well-accepted, flexible solution that has a similar configuration to CSP–natural gas hybridization [68]. This type of hybridization allows electric power to be produced in a fully renewable manner and at a comparatively low cost [69]. The installation cost of a CSP–biomass plant can be up to 50% lower than that of a standalone CSP with an identical power output [70]. Combustible biomass can be used to raise steam temperatures produced from a parabolic trough system to a superheated steam, thereby increasing system efficiency. Solar thermal and biofuel hybrids in district energy systems can effectively utilize low-grade heat using an ORC, which may include district waste heat recovery [71]. A study conducted by Peterseim et al. [72] concluded that using biomass to superheat steam is feasible in regions with moderate biomass resources as it would provide higher conversion efficiencies and a lower cost compared to installing small-scale standalone biomass plants. An optimization study considering different CSP plants and biomass configurations revealed that the highest energy efficiency (33.2%) was obtained for the configuration that uses a solar tower (for direct steam generation) combined with biomass gasification, whereas a linear Fresnel CSP system in conjunction with a fluidized bed biomass boiler offers the best economic combination [73].
Generally, geothermal heat tends to be of a lower grade that requires an organic working fluid that vaporizes at a lower temperature by gaining heat from geothermal brine through a heat exchange [74]. Hybridization with CSP can increase the efficiency and capacity factor and overcome a number of challenges encountered by standalone geothermal plants [75]. For instance, as the ambient temperature increases with the progress of the day, the hourly output of a standalone geothermal plant decreases. Nevertheless, CSP involvement can handle this issue as its output increases with a rise in the ambient temperature, and an annual energy output of more than 70% could be attained [76]. Basically, CSP technology can be incorporated into a geothermal plant both in the preheating and superheating configurations [77]. In addition to electrical power production, the two synergetic renewable sources can be incorporated into a multi-generational cascaded network in district energy systems so as to provide industrial heating, space heating/cooling, and fresh water [78].
CSP–biomass and CSP–geothermal systems, together with CSP PV, are all considered highly renewable hybrids that have a minimum negligible impact on the environment. Interest in compiled CSP PV systems has increased in the past decade, which was driven by the maturity of the two technologies. In [79], the authors classified this type of hybridization into two main categories, namely compact PV CSP technology and non-compact technology. The former is further classified into PV topping, spectral beam splitting (SBS), and combined SBS and PV topping. The non-compact CSP PV hybrid system is classified into flat PV CSP and concentrated PV CSP systems. Research into different aspects of CSP PV integrated power systems has been extensively carried out, including research on different kinds of optical concentrators, thermal receivers, solar cells, and thermodynamic cycles [79]. The hybrid CSP-PV system, as compared to PV alone and CSP alone, offers better dispatchability due to its complementary characteristics, a lower cost, and higher generated efficiency [80]. Hybrid PV CSP technology, when equipped with thermal storage, is an effective and economic power supply for isolated microgrids [81]. Moris et al. investigated the cost-effectiveness of different options of energy systems (including gas stations) for Chile’s 2040 decarbonization plan and found that the hybrid PV CSP power system with 13 h of thermal storage is the best economic adaptation [82]. An optimal sizing among a combination of PV/CSP/wind hybrids accompanied with battery and thermal energy storage systems, under the premise of ensuring power supply to an autonomous load at a minimum energy cost, was developed in [83]. The study indicated that with an electrical load of 50 MW, an LCOE of USD 0.18 per kilowatt hour is achievable for a continuous power supply.
Due to the different infrastructures between the two technologies, CSP technology can be hybridized with wind power systems at the grid level. For an independent power supply, such combinations require battery storage for wind farms and thermal storage for solar thermal facilities [84]. There is a consensus that pairing a CSP plant with a wind power plant could improve the dispatchability of the wind power and reduce any wind curtailment since solar and wind usually do not peak concurrently [85]. From a storage perspective, any excess wind power can be converted into heat through an electric heater and stored in the thermal storage unit of the solar thermal power facility [86]. Bundling the CSP with wind, particularly in the Northern African region, can offer an optimal load curve balance and a successful business model both for optimal domestic use and to export electricity to Europe [87]. Table 4 presents the currently operational RE hybrid power generation systems around the world.

Table 4.
Hybrid CSP-RE power plants around the world.
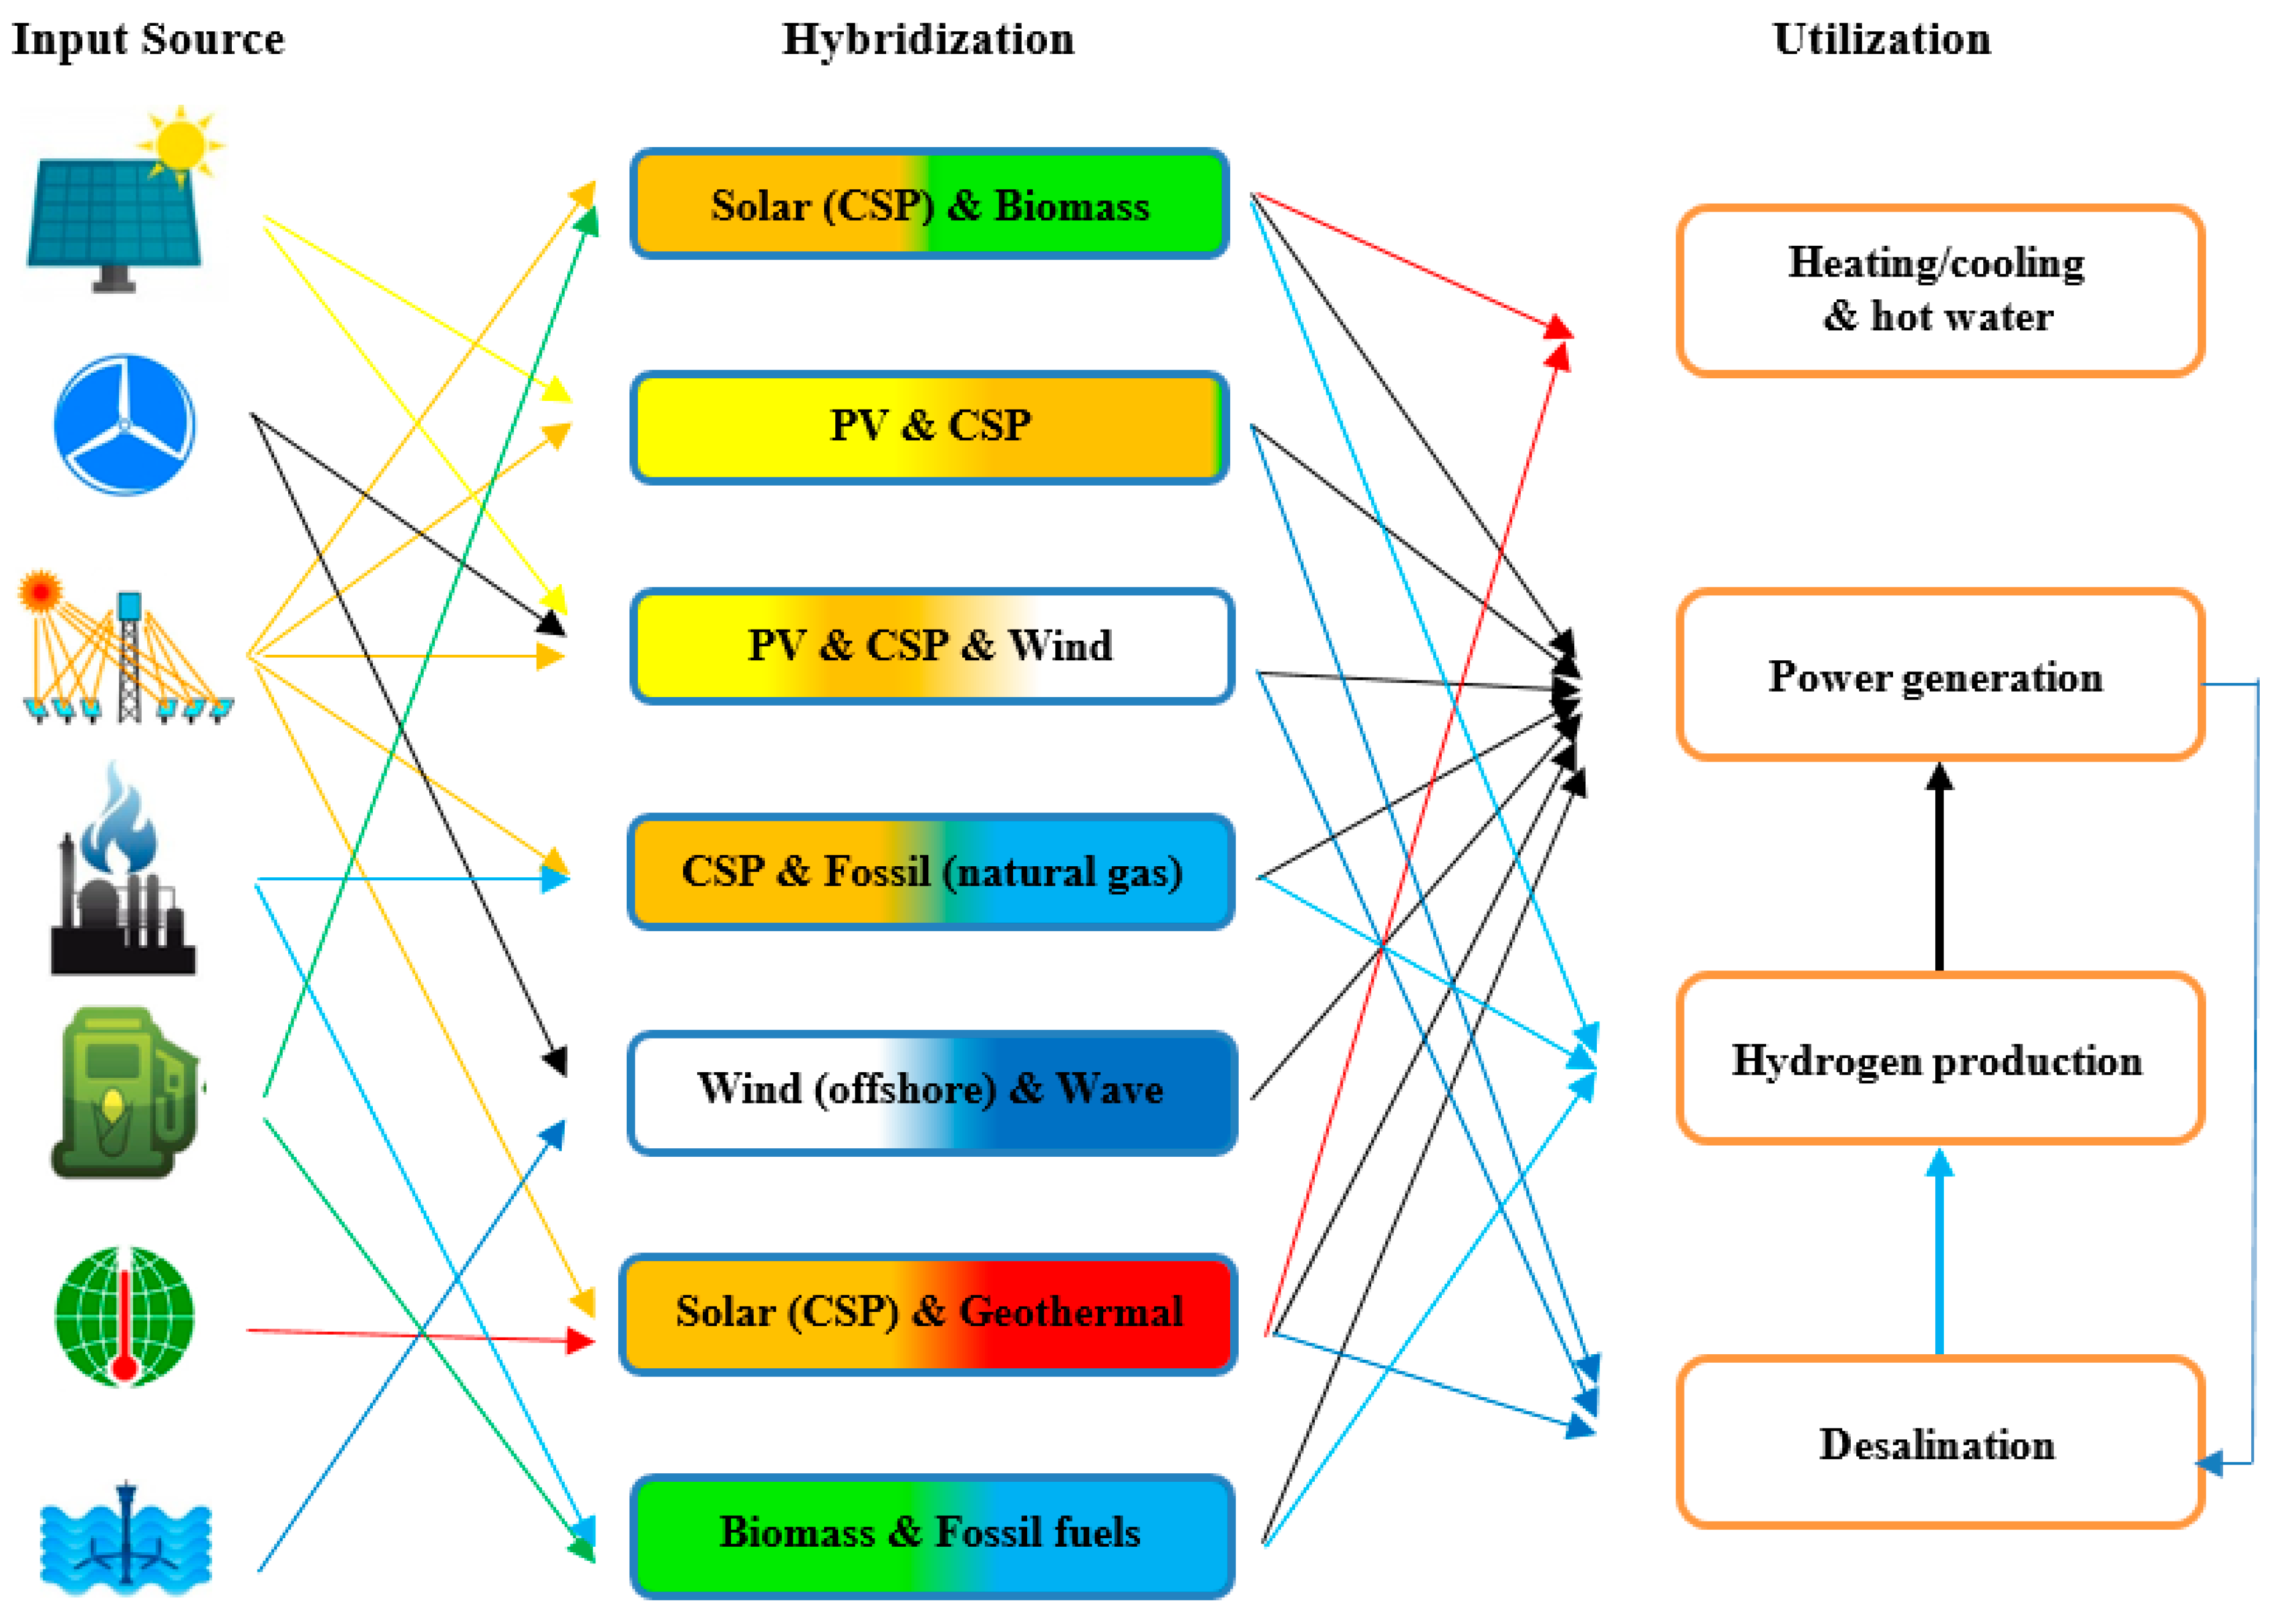
Several factors affect the pairing strategy of CSP with various energy systems. This differs according to the plant’s characteristics and performance metrics, such as specific investment, cost effectiveness, solar share, energy and exergy efficiency, solar-to-electricity efficiency, and the capacity factor [46]. The route towards RE-based hybridization and its utilization in Libya is demonstrated in Figure 3. In order to simultaneously meet the energy demands for electricity, cooling/heating, transportation, and desalination, the multi-generation/poly-generation system is applied.
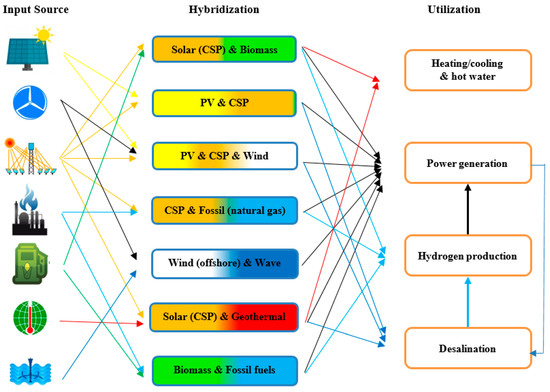
Figure 3.
Utilization prospect of hybrid energy sources in Libya.
This article proposes a new integrated system that combines solar thermal energy with an existing gas-fueled power plant to meet Libya’s current electric energy demand and future energy challenge. This research employs economic and thermodynamic analyses of an integrated system based on the first and second principles of thermodynamics to assess its performance and observe its thermodynamic behavior under various operating conditions.
4. Model Description and Methodology
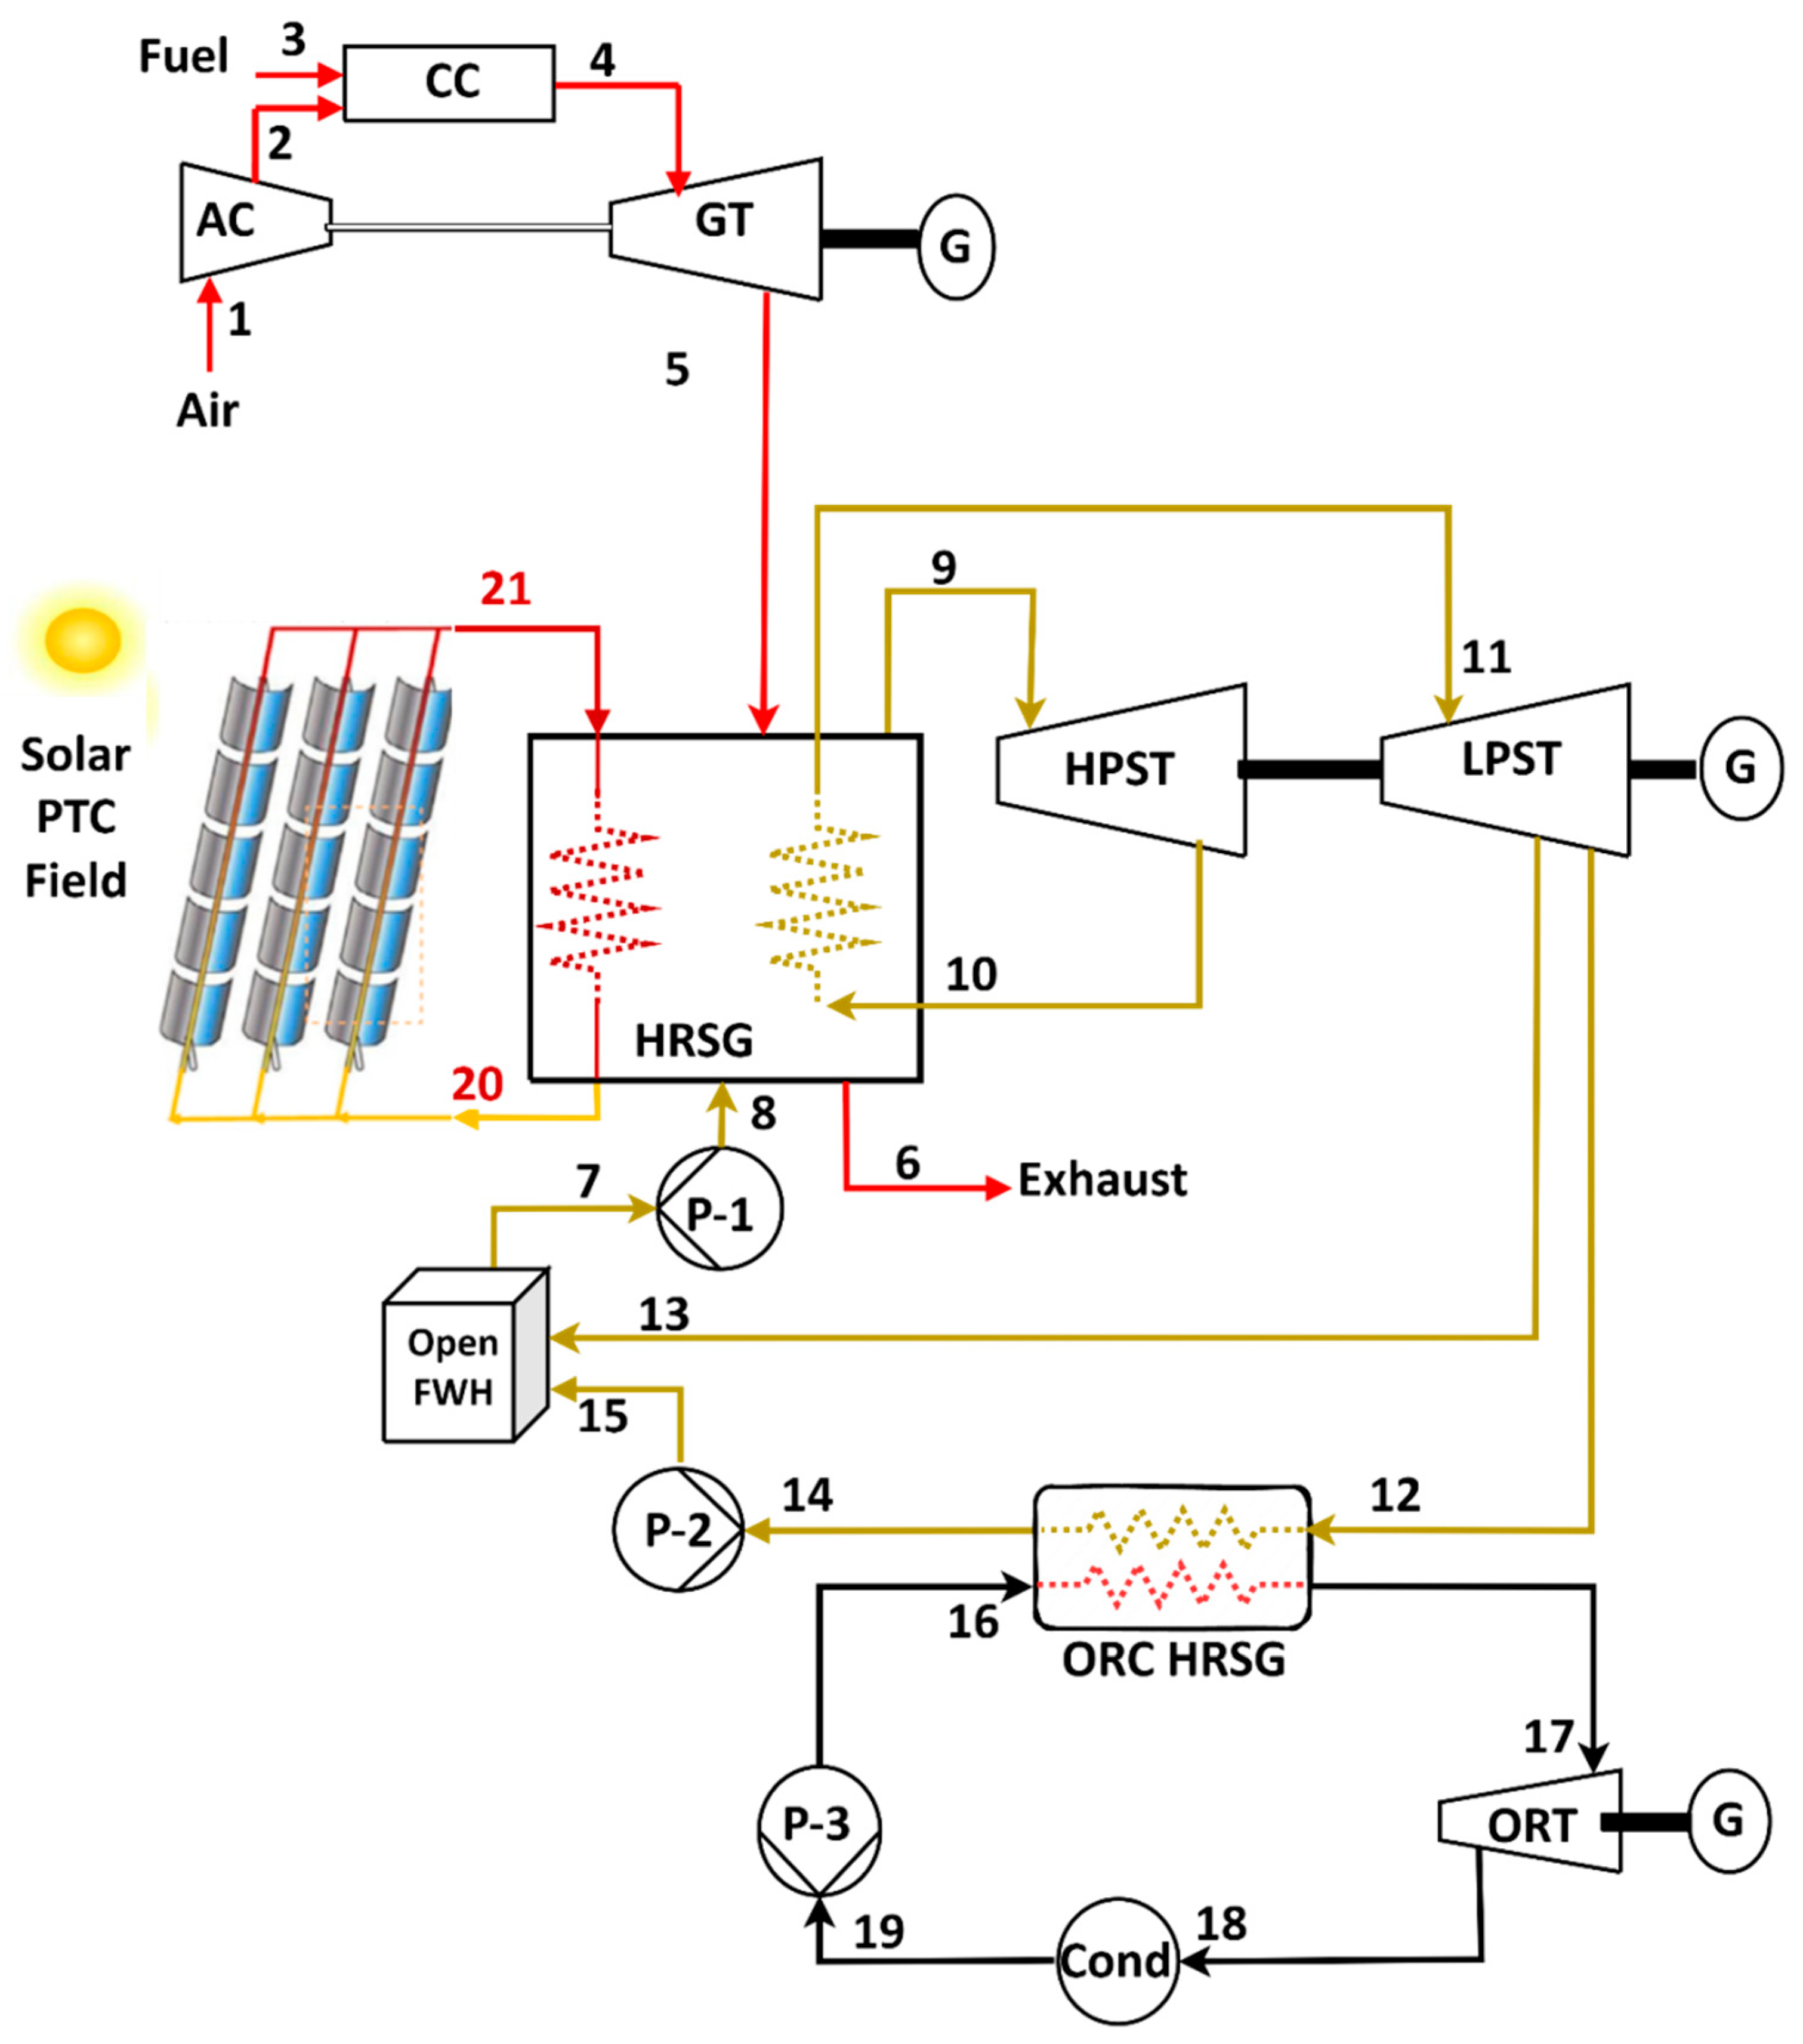
Based on the hybridization profile depicted in Figure 3, a simplified configuration of the proposed hybrid CSP–gas power plant, integrating triple units, is presented in Figure 4. The ISCC system consists of a gas turbine (GT) cycle with natural gas fuel, a Rankine cycle attached to the solar domain, and an ORC. The Brayton cycle components include an air compressor (AC), a combustion chamber (CC), and a GT. The ambient air flows through the AC (red arrow), thereby raising its pressure and temperature (process 1–2). The highly pressurized air, along with the natural gas, is mixed and burned in the CC to produce exhaust gases at a high temperature (state 4). The resultant exhaust gases then expand into the GT to the atmospheric pressure, thereby generating mechanical work (process 4–5). The mechanical work produced in the GT is transformed into electrical energy by a generator attached to the GT. The exhaust gases exiting the turbine increase the steam temperature in the heat recovery steam generator (HRSG) (process 5–6).
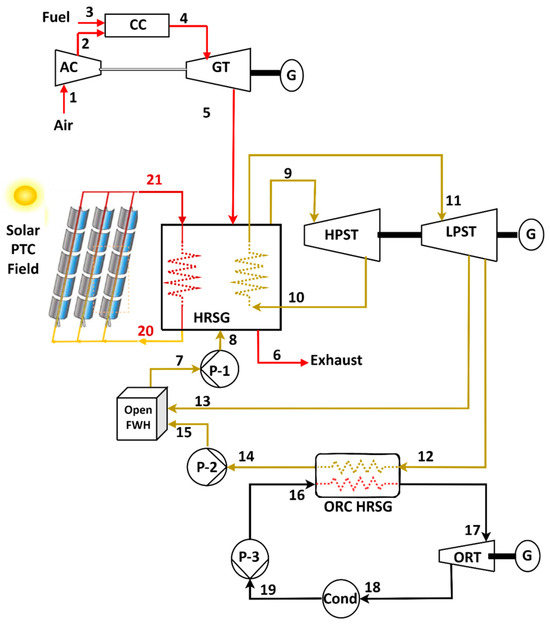
Figure 4.
A schematic diagram of the proposed triple combined system.
The RC encompasses six components: a high-pressure steam turbine (HPST), an HRSG, a low-pressure steam turbine (LPST), an open feedwater heater (FWH), a condenser, and two pumps (yellow arrows). The water is pumped and compressed to the operating pressure of the HRSG (process 7–8). The pressurized water enters the HRSG and is heated by the solar heat stream and combustion gases leaving the GT; hence, a high-temperature steam emerges (process 8–9). Similarly, the superheated steam at state 9 expands into the HPST to an intermediate pressure, thus delivering work (process 9–10). The exhaust steam is then sent back to the HRSG, where it is reheated to the inlet temperature of the HPST (process 10–11). While some steam is extracted and routed to the open FWH, the remaining part continues to expand to the ORC HRSG. The HRSG is also linked to the parabolic solar collectors to increase the amount of steam generated, and hence, the power produced by the system. Therminol vp-1 was used as a working fluid in the PTC field due to its advantage for high-performance heat transfer, its ability to tolerate harsh conditions, and its safety and environmentally friendly quality.
On the bottoming side, the organic power cycle consists of four main components, namely the ORC HRSG, a turbine (ORT), a condenser (ORC condenser), and a pump. In the ORC HRSG, the temperature of an organic working fluid (R245fa) rises, turning into vapor (process 16–17), and eventually driving the ORT to deliver mechanical work (process 17–18). The organic working fluid leaving the ORT as a low-pressure vapor is condensed through the ORC condenser to become the form of a saturated liquid (process 18–19). The pump directs the organic fluid leaving the condenser to the ORC HRSG to complete the cycle (process 19–16). Thermodynamic and thermo-economic assessments are based on the following assumptions:
- The system’s steady-state operating conditions are considered.
- Kinetic and potential energies are not considered.
- The compressor, pump, and turbines operate in an adiabatic process.
- Isentropic efficiency is considered for turbines, pumps, and compressors.
- There is no heat dissipation or pressure loss in heat exchangers and pipes.
The proposed ISCC power system was simulated by using the EES software (V11.867.), and 531 thermodynamic equations representing the three integrated systems were compiled and programmed. The mass flow rates of water and the organic fluid were calculated under different weather and operating conditions by solving the equations simultaneously. The operating parameters of the triple hybrid ISCC system [89,90] are tabulated in Table 5, while the atmospheric properties at the inlet of the air compressor are presented in Table 6.

Table 5.
The operating parameters of the triple hybrid ISCC system.

Table 6.
Atmospheric properties at the inlet of the air compressor.
As a result, the net powers of the BC, RC, and ORC are obtained for various weather and operating conditions. The general expression of mass and energy balances for each component can be formulated as follows:
where in and out are the input and output of the component, respectively. The exergy balance of each part that is used to obtain exergy destruction is as follows:
where and represent the exergy rate associated with the transmission of heat and work; and symbolize the exergy flow rate at the entrance and exit; and is the exergy destruction rate. Table 7 summarizes the mathematical modeling for the proposed system. The overall efficiency of the triple combined system is calculated as follows [91,92]:
where is the fuel mass flow rate, indicates the lower heating value of fuel, and is the isentropic efficiency of the CC. The produced by the integrated system can be estimated from [93] as follows:
where is the work output in the Brayton cycle, expresses the work output in the Rankine cycle, and is the work output in the ORC. The quantity of heat supplied to the HRSG from the solar field is calculated from [94] as follows:

Table 7.
The mass and energy balances for the triple hybrid ISCC system.
In Equation (6), is the efficiency of the parabolic trough collector, is the area of the solar field, and DNI is the direct normal irradiance at Sarir (28.22° N, 19.13° E) for the month of interest. The work output in the Brayton cycle is estimated as follows:
where is the work output in the GT, and is the work consumed by the AC. The work output in the Rankine cycle is expressed as follows:
where and are the delivered work in the HPST and LPST, respectively, and and are the work consumed by the pumps. The work output in the ORC is given by the following:
where is the work output in the ORT, and is the work consumed by the ORC pump. The thermal efficiency of the Brayton cycle is calculated as follows [95]:
The thermal efficiency of the Rankine cycle is expressed as follows:
Finally, the thermal efficiency of the ORC is given as follows:
4.1. Economic Model
The capital cost of each component is modified to a cost rate as follows [96,97,98,99]:
where is the purchase cost of the equipment in US dollars, φ is the maintenance factor (1.06), N is the number of operating hours of the system in a year (7446 h), and CRF is the abbreviation of the Capital Recovery Factor, which is formulated as follows:
where i is the interest rate (considered to be 8%), and n is the system’s lifetime (assumed to be 20 years). Table 8 summarizes the mathematical model for the economics of the proposed system. The referred table provides the necessary functions for determining Żk for each part of the system. The overall cost of investment can be determined as follows:

Table 8.
Economic inputs for the model [99,100,101].
The levelized energy cost, which is the average cost per unit of energy, is expressed as follows:
4.2. Environmental Model
Human activities release CO2 into the atmosphere, and this amount is quantified by the CO2 emission rate (). This statistic is crucial when considering climate change since higher CO2 levels are associated with warmer temperatures. The value can be calculated using the following equation [102]:
5. Validation
The performance evaluation of the BC model was verified using the standard data for the Siemens gas turbine (SGT5-PAC 4000F) installed at the Sarir power plant; three such units with 283 MW have been operational since 2010 and are connected to the Libyan national grid through 220 kV transmission lines. The Sarir power plant receives fuel from the Fareg gas field located 187 km northwest of the plant. Table 9 and Table 10 present, respectively, the actual operating conditions carried out in the validation model and the numerical results of the two models. As can be noticed in Table 10, the performance of the programmed BC model is very close to that of the theoretical one.

Table 9.
The operating conditions for the SGT5-PAC 4000F.

Table 10.
Validation of the Brayton cycle model.
The validity of the developed BC model is further confirmed with a 6200 kW rated turbine [103], and the results are reported in Table 11. In addition, the validation was extended to the Rankine cycle; the developed model was compared to its counterpart presented in [104]. The evaluation was carried out in terms of the power and efficiency, and eventually, the mean percentage error. Table 12 and Table 13 exhibit the operating conditions implemented in the validation model and the acquired numerical results, respectively. The attained results demonstrate the reliability of the presented model compared to the outcome published in the literature.

Table 11.
A comparison between the EES code and the model in the literature for 6200 kW GT.

Table 12.
The operating conditions for the regenerative Rankine cycle model.

Table 13.
A comparison between the EES code and the model in the literature for the 55.24 MW regenerative Rankine cycle model.
6. Simulation Results and Discussion
The integration of CSP into natural gas-fueled combined cycle power plants is currently the most successful hybrid solution because of its operational flexibility, reasonable cost, and the considerable improvements in efficiency.
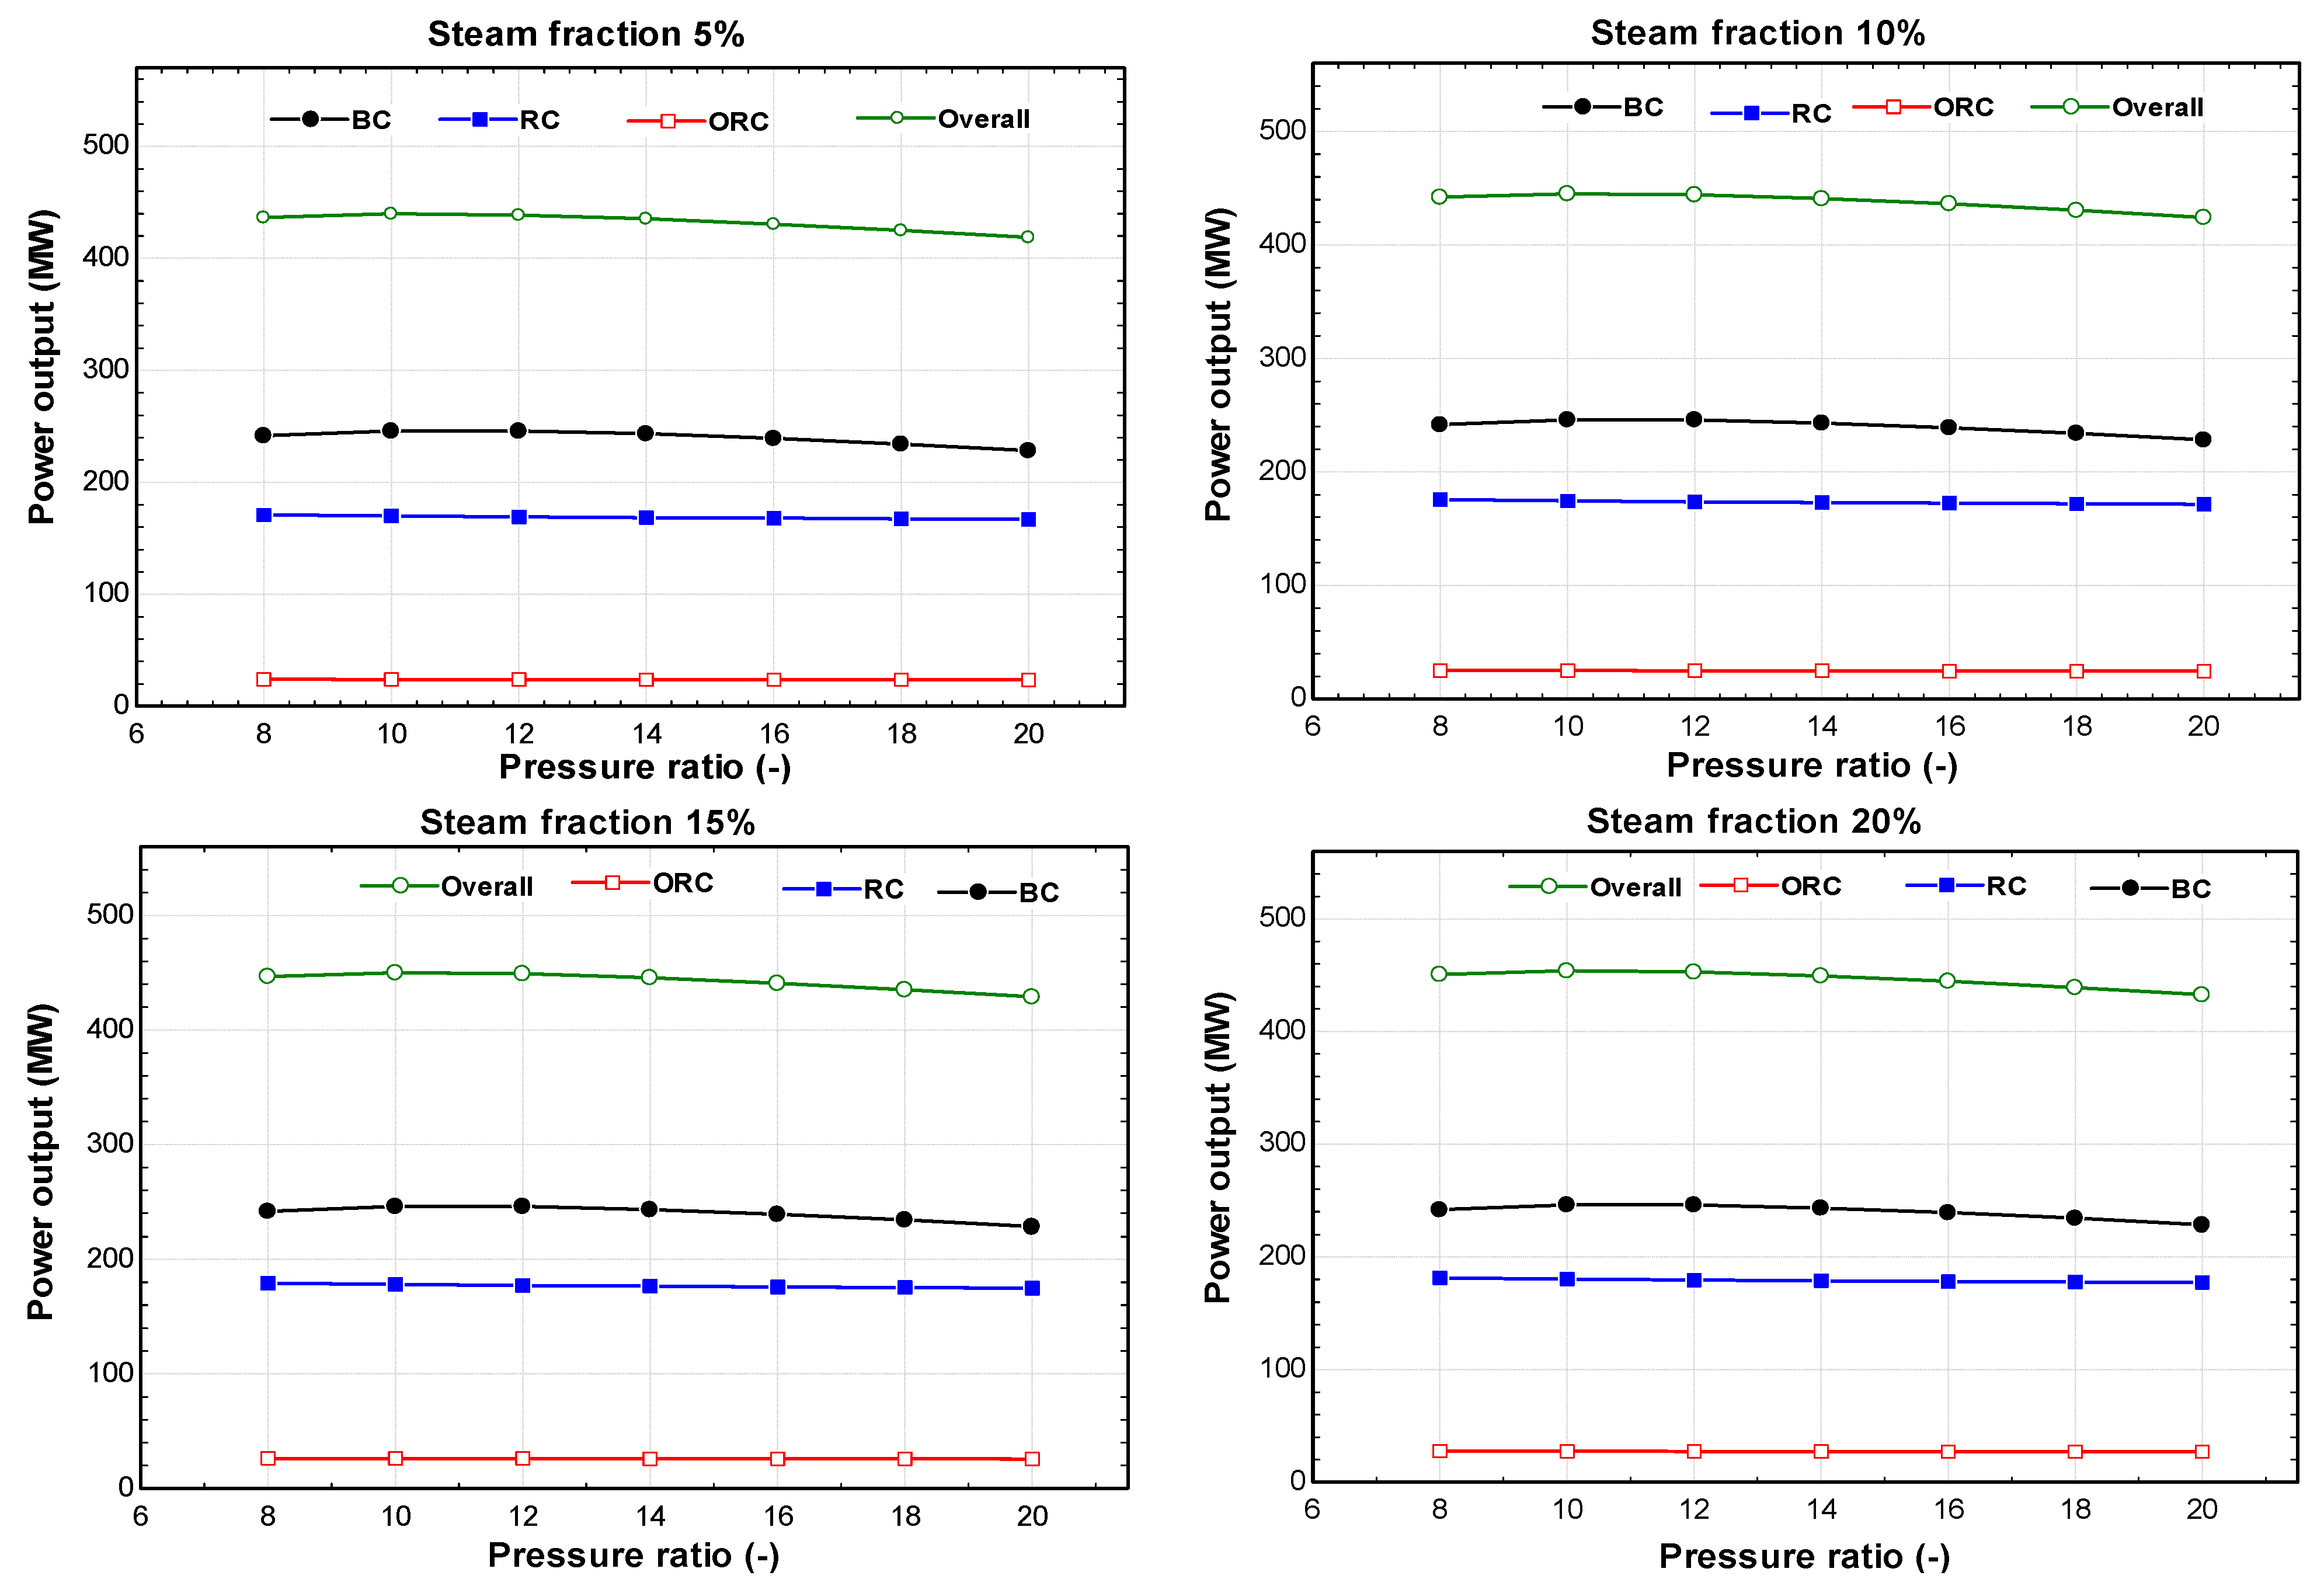
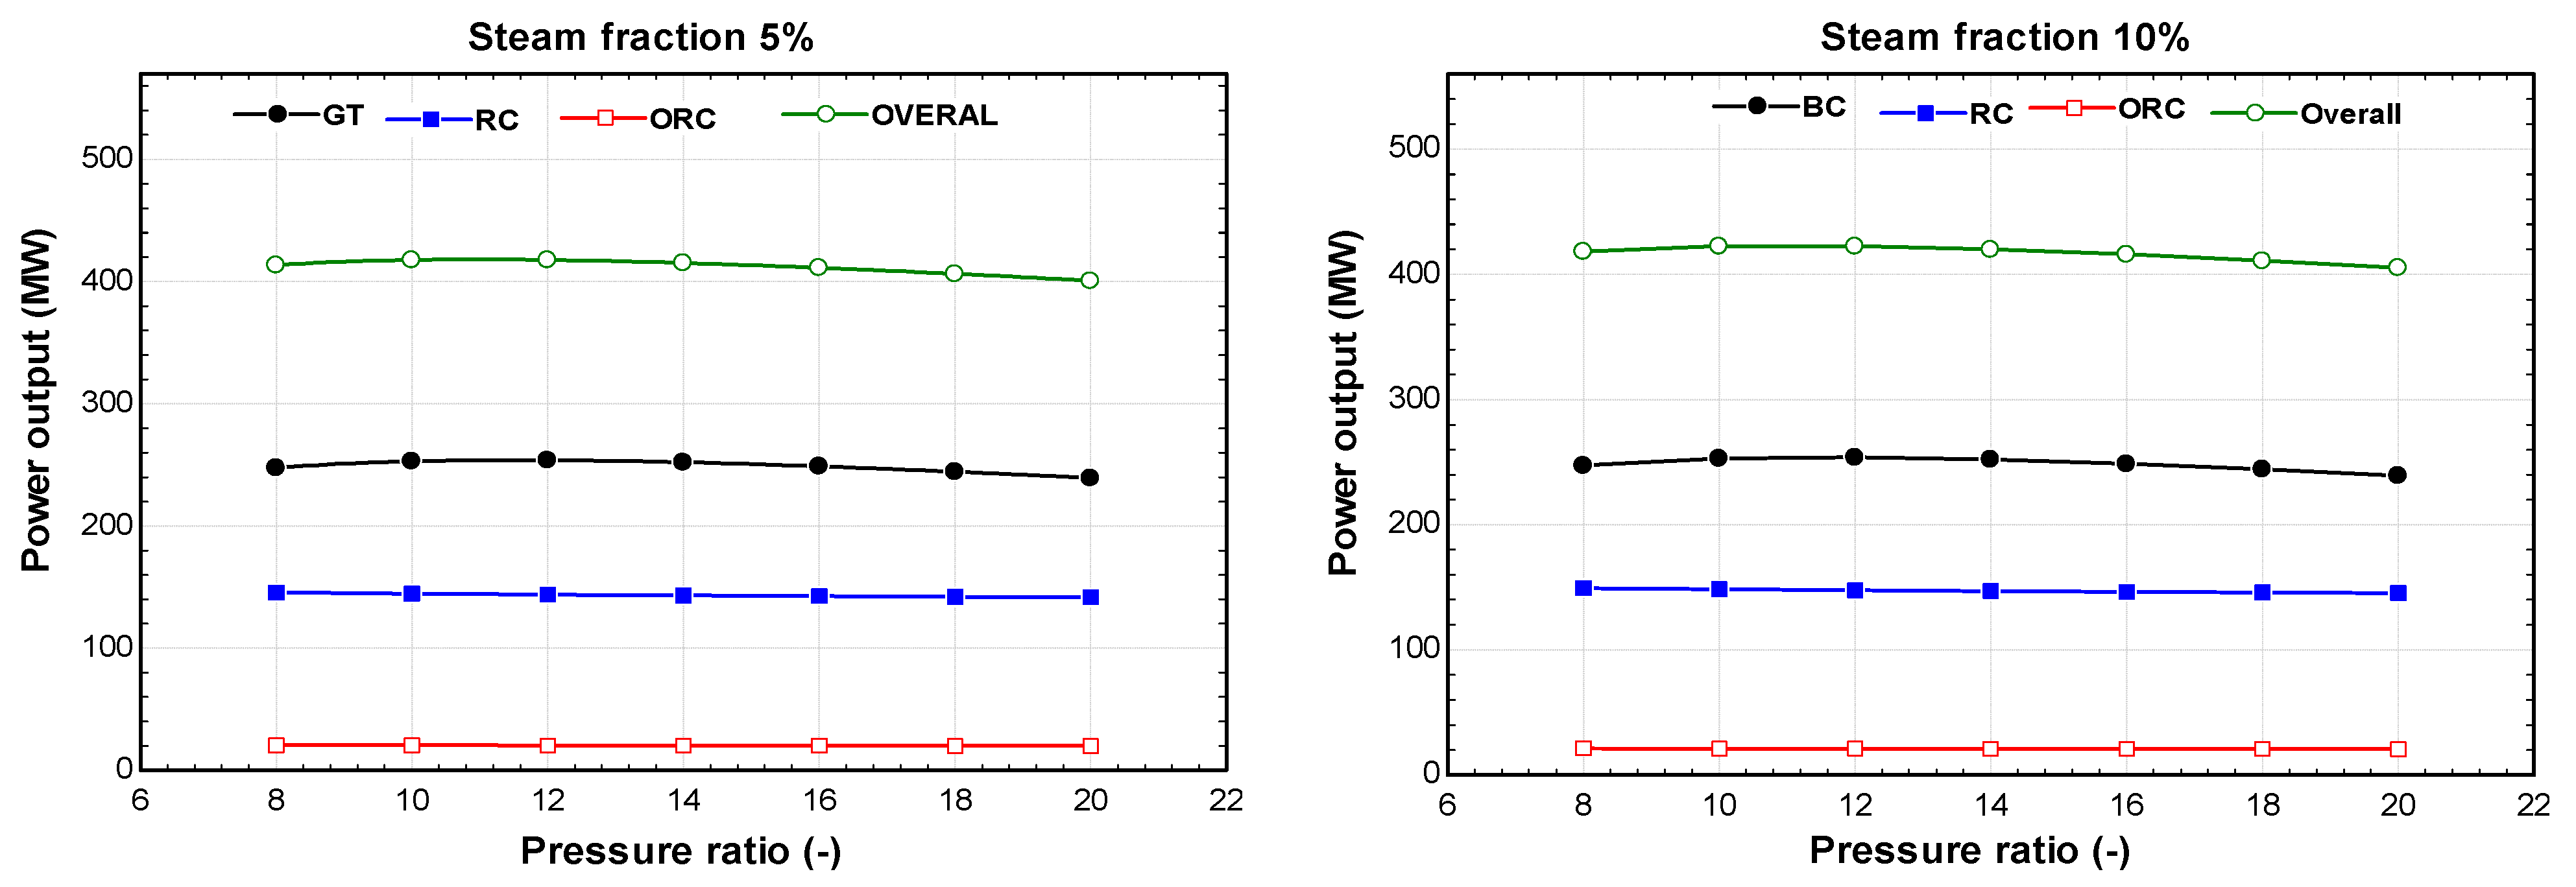
The megawatt power outputs of the BC, RC, ORC, and overall power yield for June with the variations in the BC pressure ratio and steam fractions are presented in Figure 5. The overall power output from the triple combined system is highly dependent on the pressure ratio of the BC. The results indicate that the overall power output increases with an increase in the pressure ratio until it reaches a maximum point and then starts to decline. As the BC pressure ratio increases, the compressed air temperature also increases, leading to an improvement in the combustion process of the natural gas and an increase in the turbine inlet temperature. Eventually, greater GT power is produced. Meanwhile, a large part of the power produced by the GT is consumed by the AC at a higher pressure ratio. Moreover, at a higher pressure ratio, the temperature of the exhaust gases at the exit of the GT decreases, leading to a reduction in the energy available for steam generation in the HRSG; hence, the power is produced by the steam turbine and the ORC turbine.
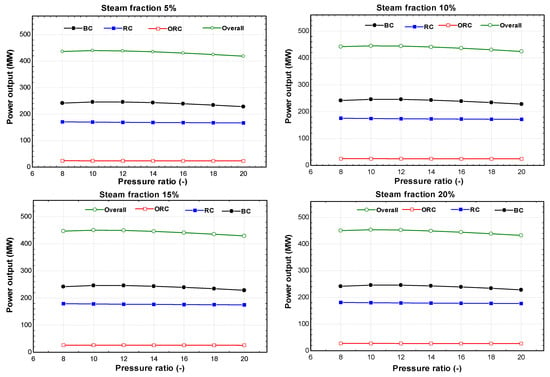
Figure 5.
Variations in power output in June.
The maximum power output is obtained at a pressure ratio of 10 and a steam fraction of 20%. This corresponds to 453.9 MW, of which 54.15% is derived from the BC, 39.8% is derived from the RC, and 6.05% is derived from the ORC.
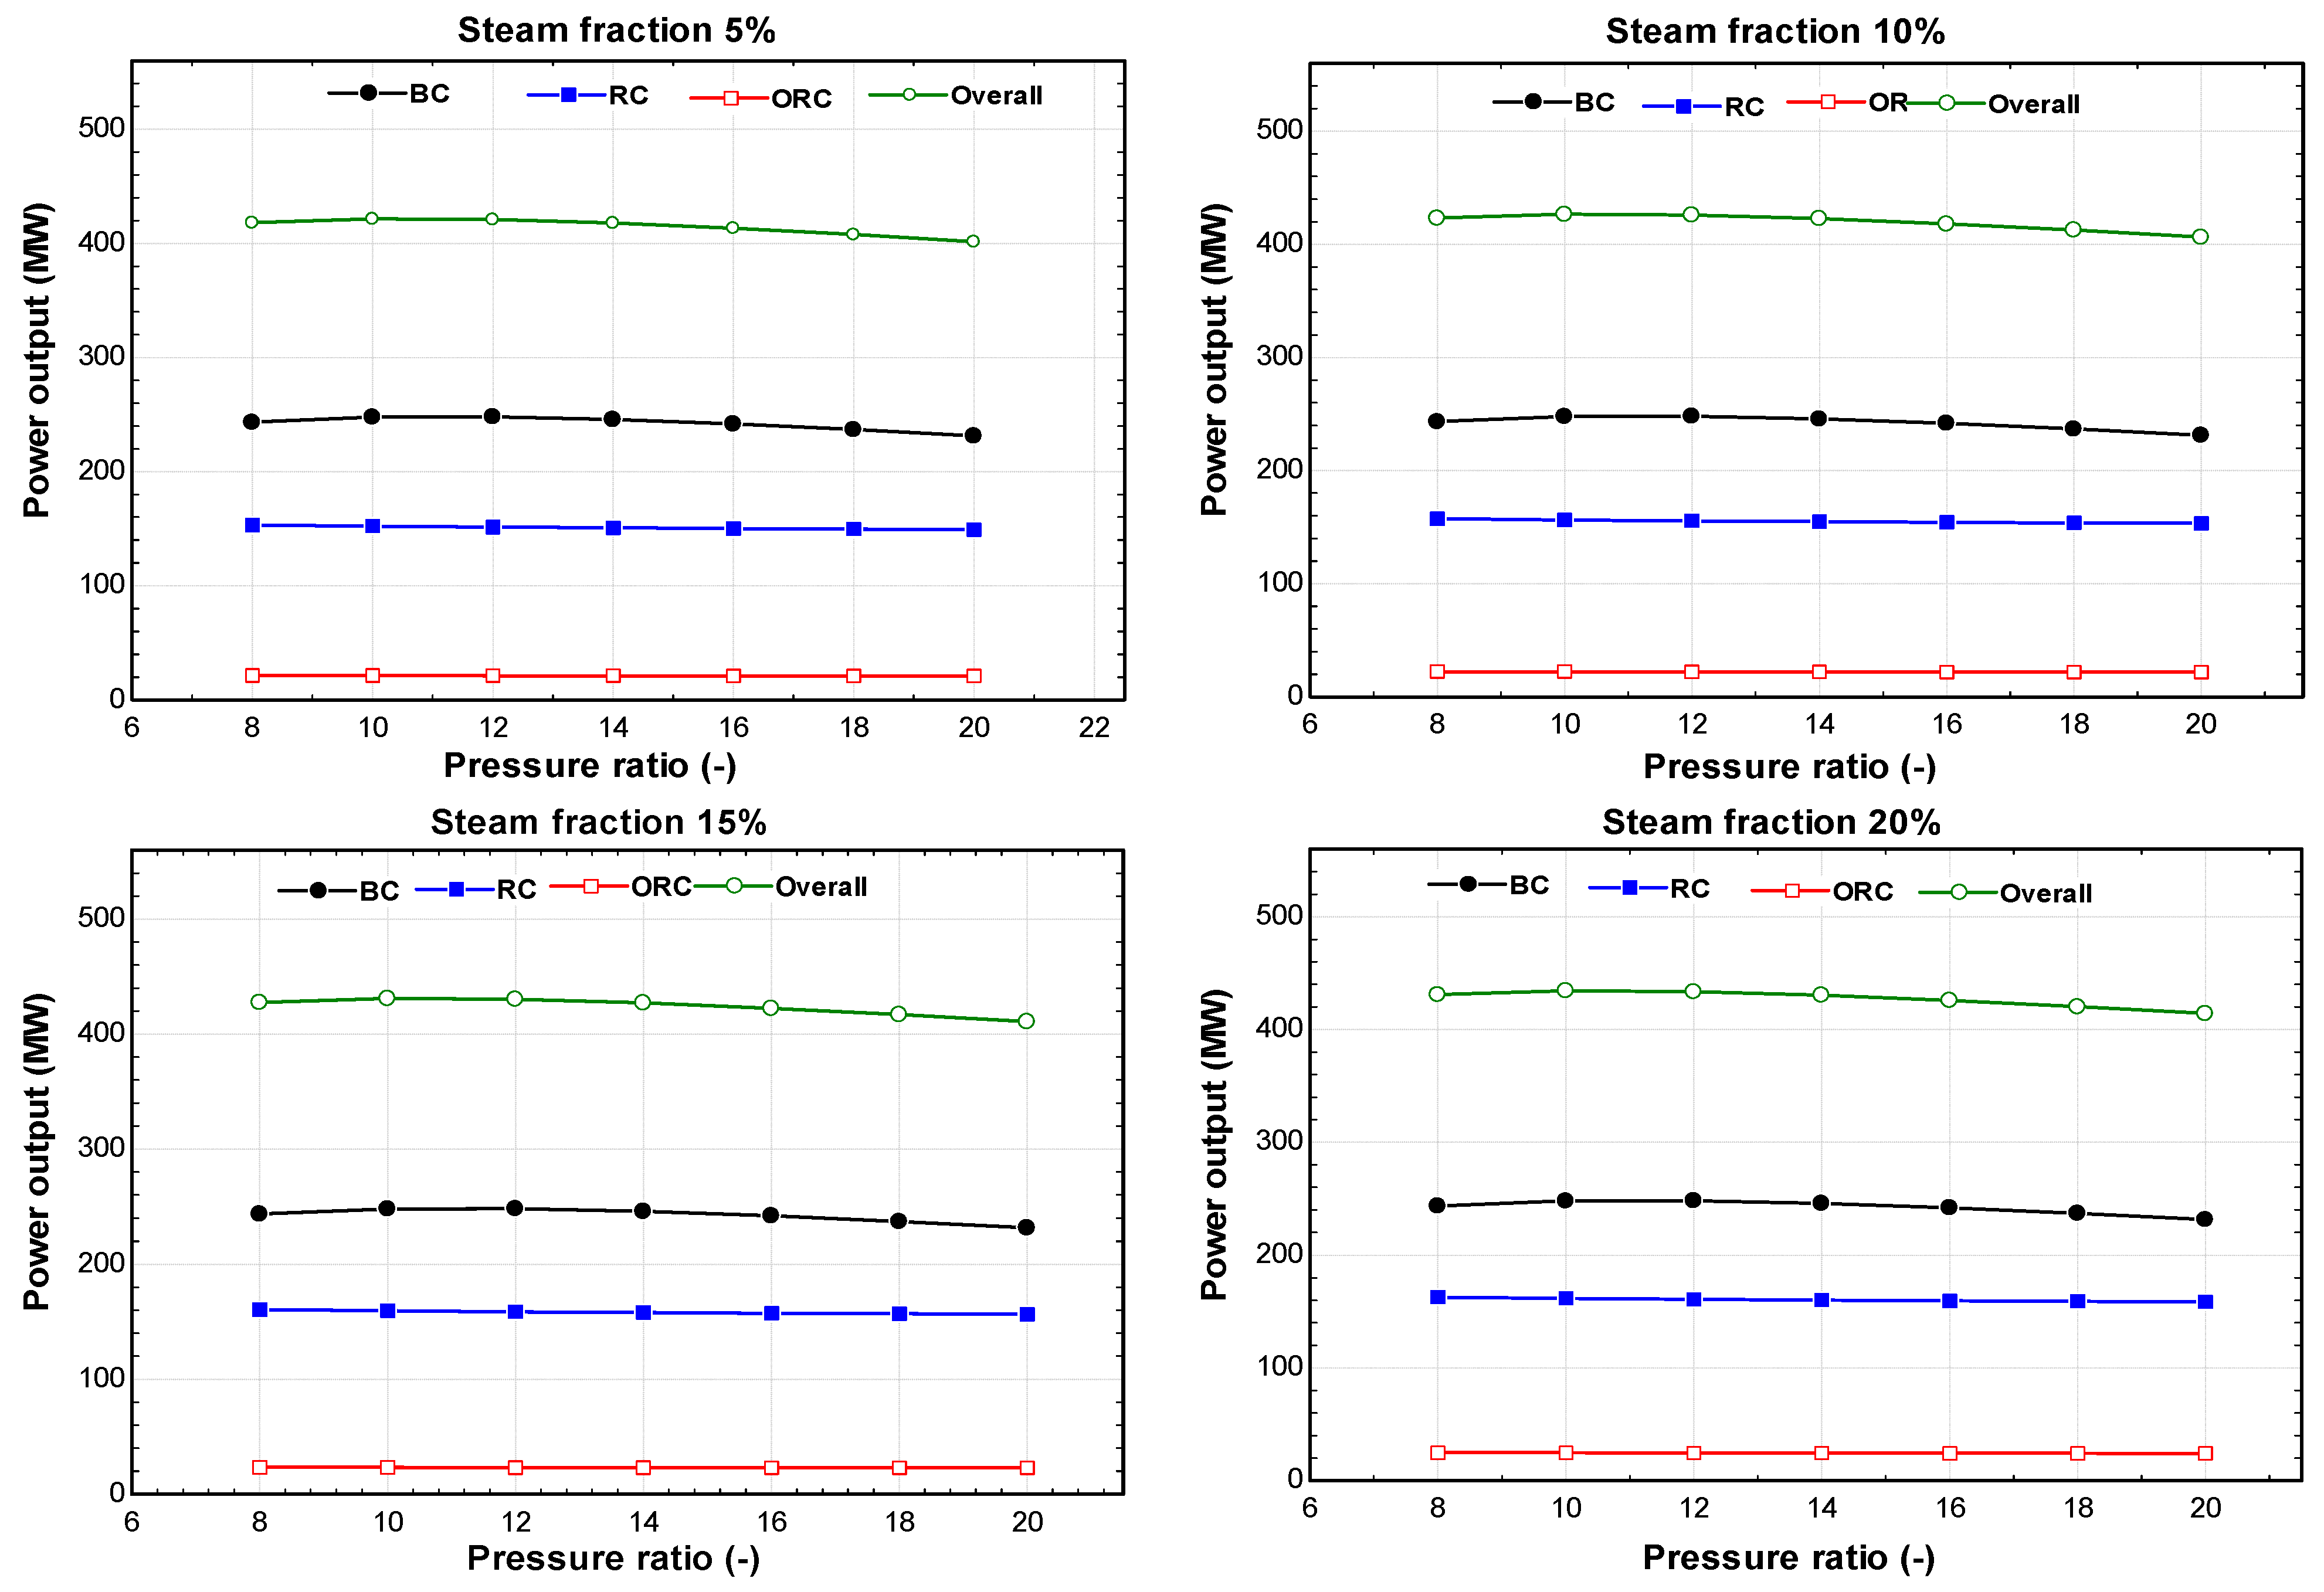
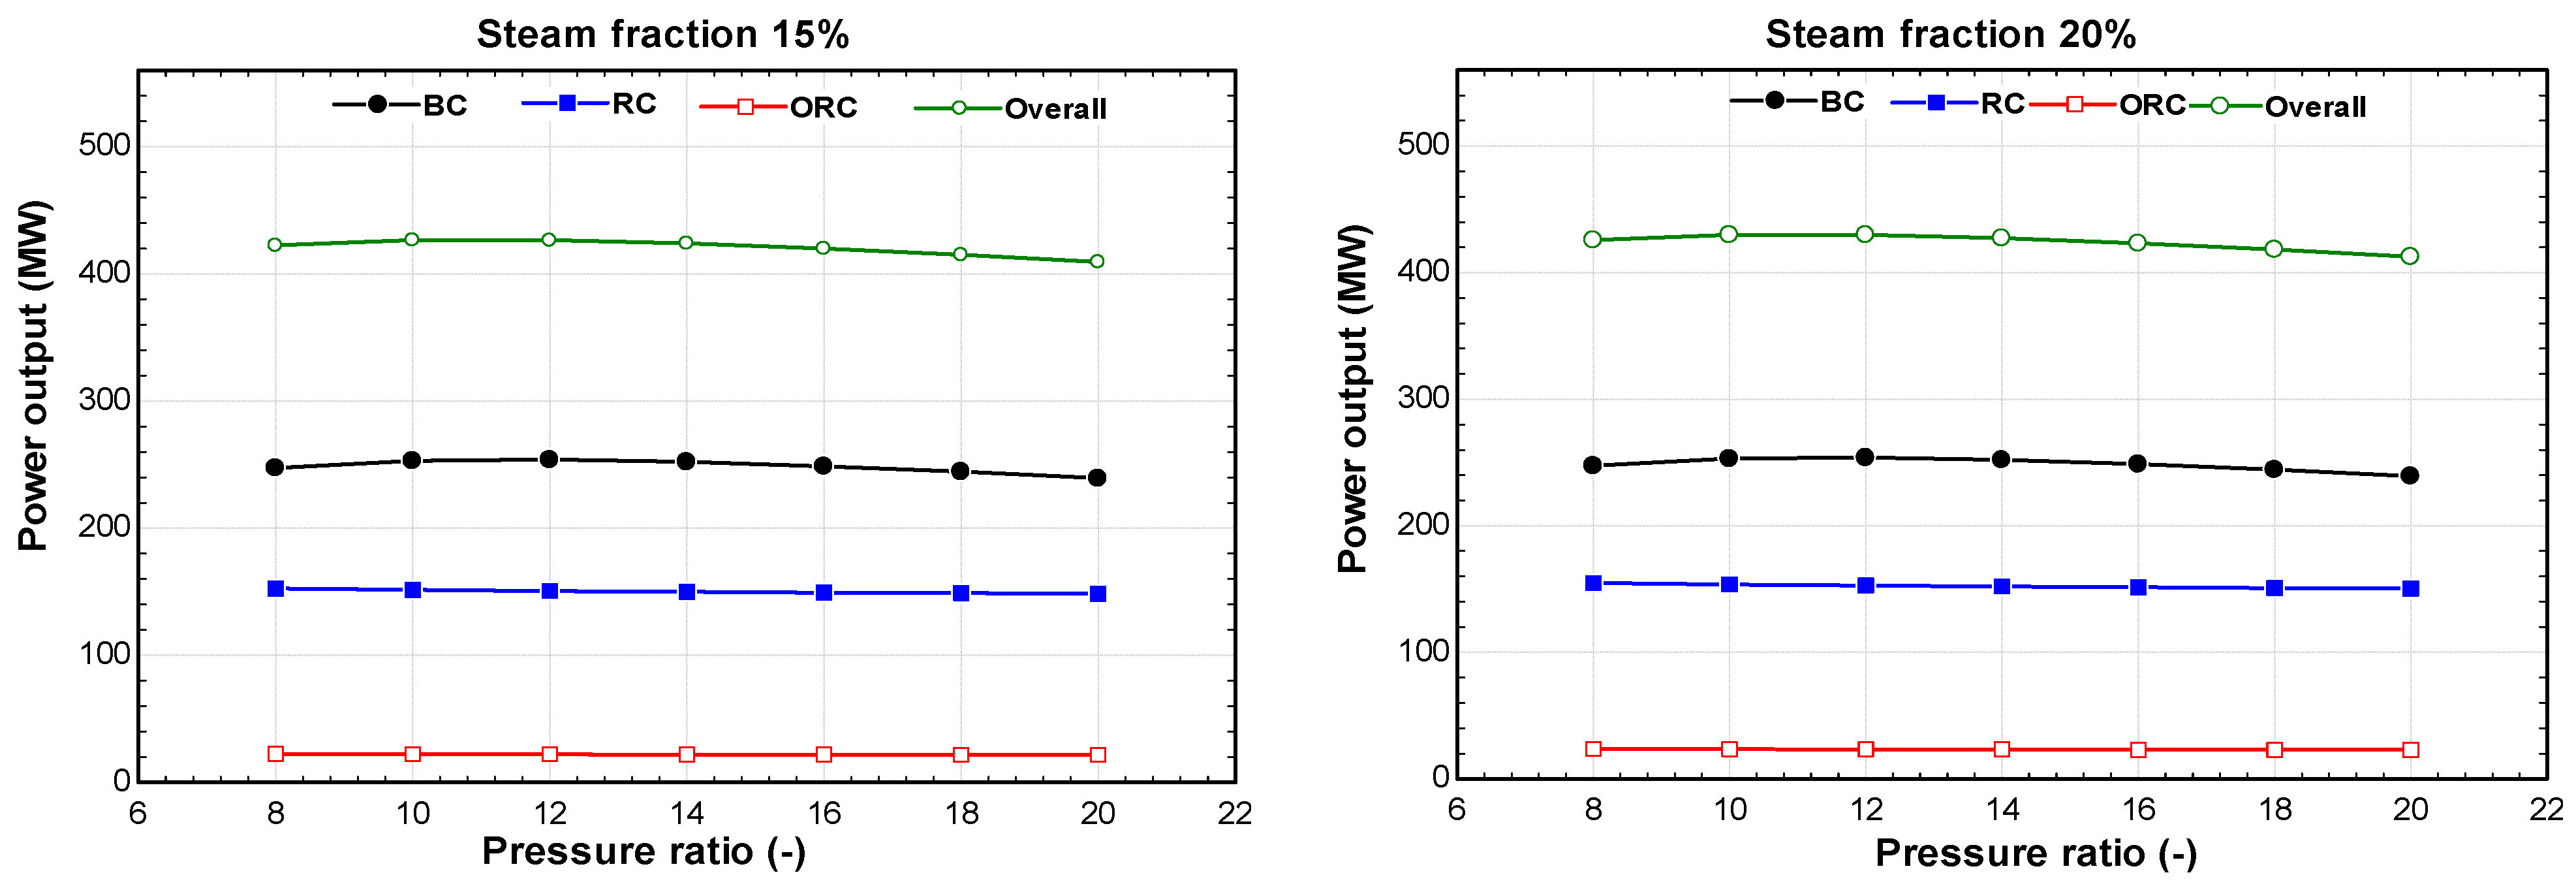
The power outputs from the three integrated power units at different pressure ratios and steam fractions are also obtained for September. The graphs are shown in Figure 6. It is obvious that the trend of the power output from the three integrated systems and the overall power resemble those of June. However, the amount of power produced varies due to the variation in the incident solar energy. The highest power output is obtained at a pressure ratio of 10 in the BC and maximum steam fraction in the RC. In September, a maximum overall power output of 434.4 MW was generated, of which 57.07% was supplied by the BC, 37.24% was generated from the RC, and 5.7% was extracted from the ORC. The performance results also show that as the RC steam fractions increases from 5% to 20%, the overall power yield from the triple combined system increases from 421.5 MW to 434.4 MW.
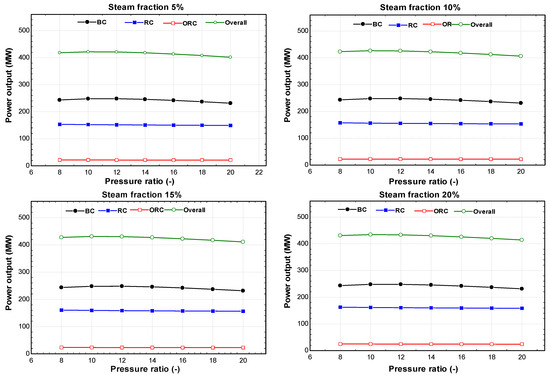
Figure 6.
Variations in power output in September.
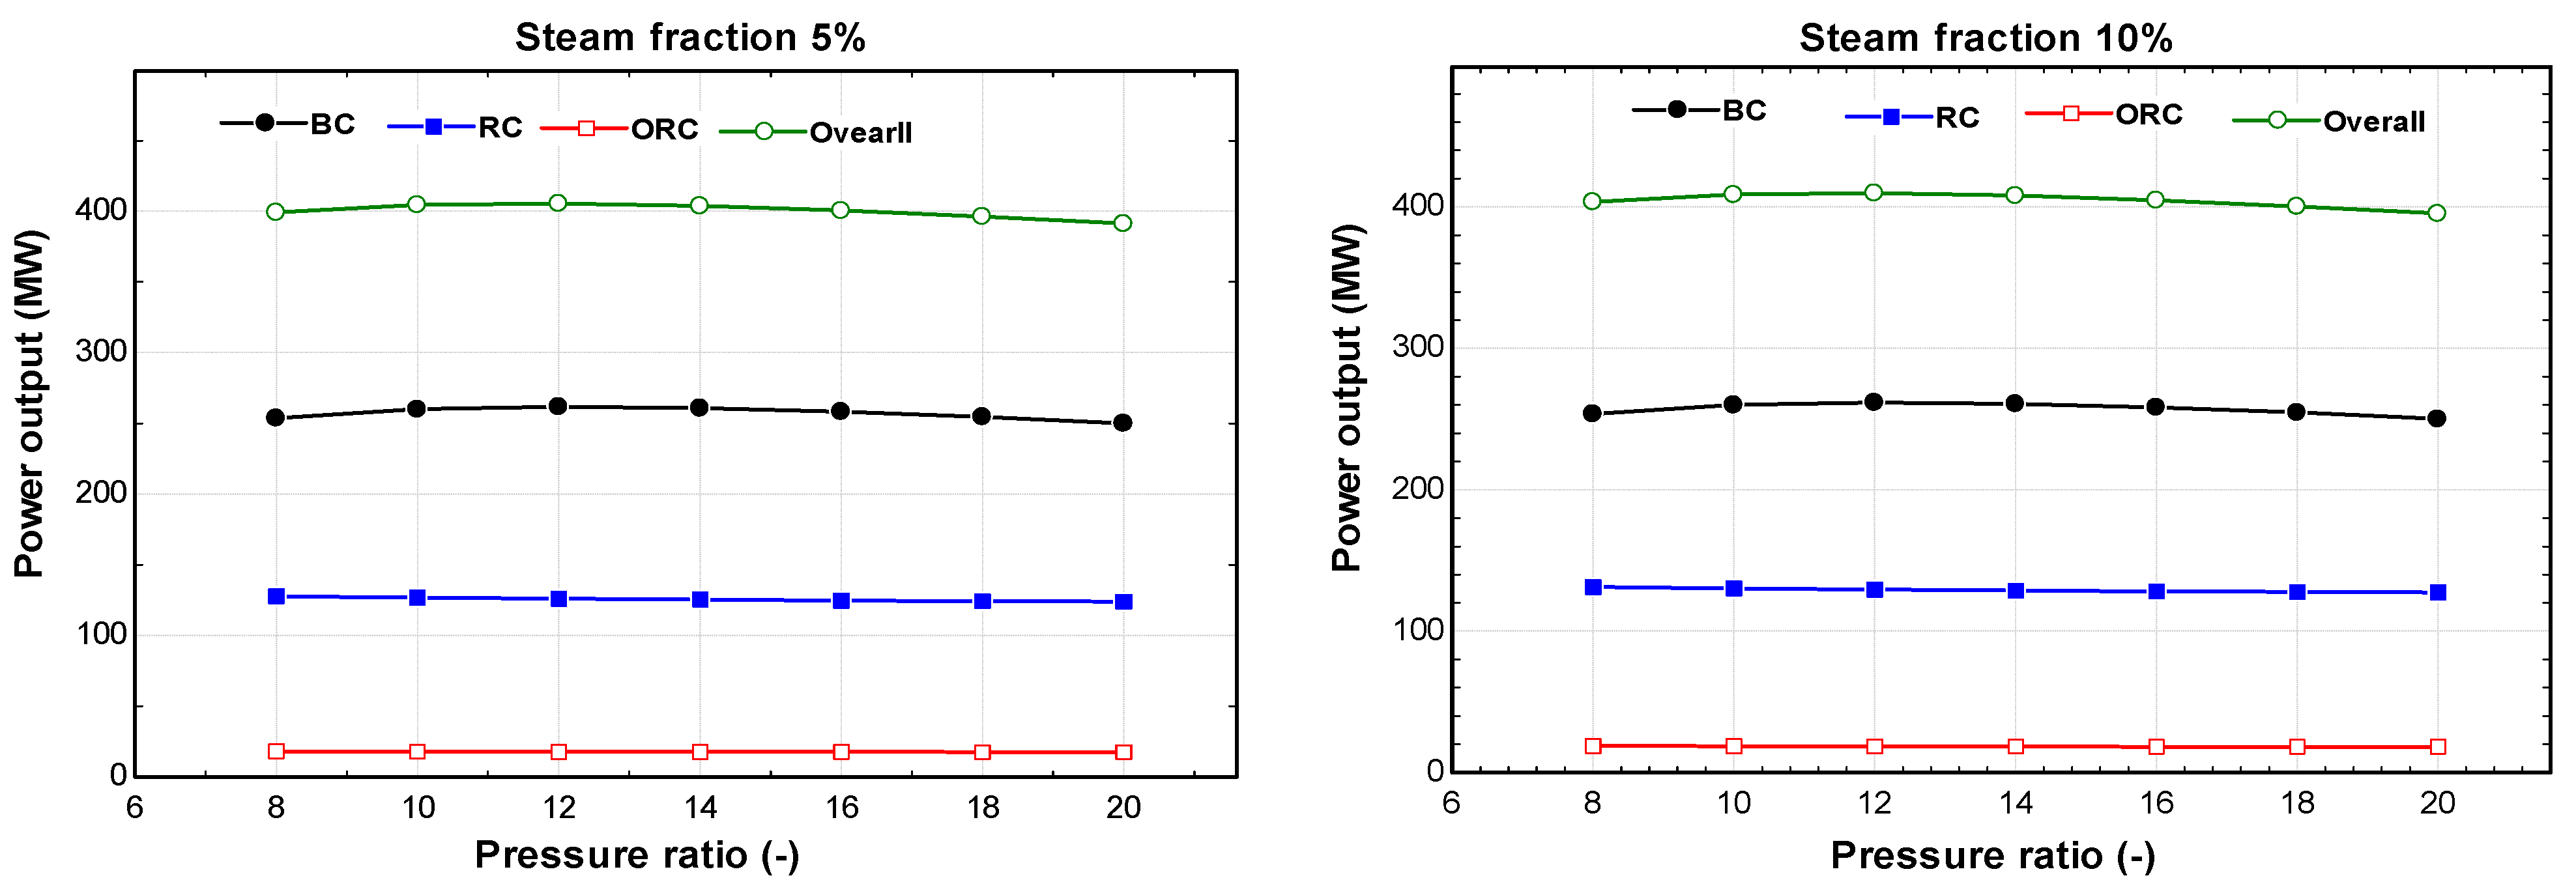
The power output of the hybrid system was also obtained during the winter, and the results are illustrated in Figure 7. The graphical depictions reveal that the power produced from the three systems separately and the overall power of the triple combined system follow the same pattern compared to the performance during the other seasons. However, the amount of power produced is at a minimum mainly due to the amount of solar energy received in December. The overall power output of the triple combined system is 416 MW, which was extracted at a pressure ratio of 12 and a steam fraction of 20%. While 62.9% of the maximum power was extracted from the BC, the RC and the ORC contributed 32.19% and 4.91%, respectively. It was also found that with an increment from 5% to 20% in steam fractions in the RC, the overall power output improved from 405.4 MW to 416 MW.
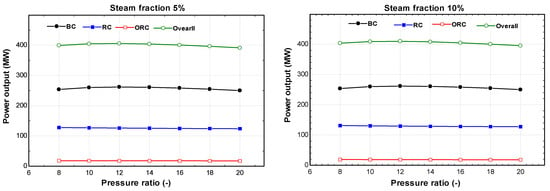
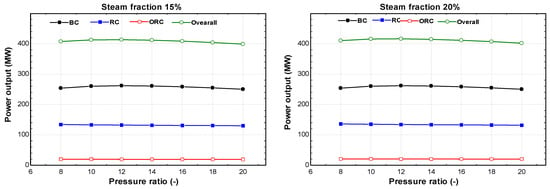
Figure 7.
Variations in power output in December.
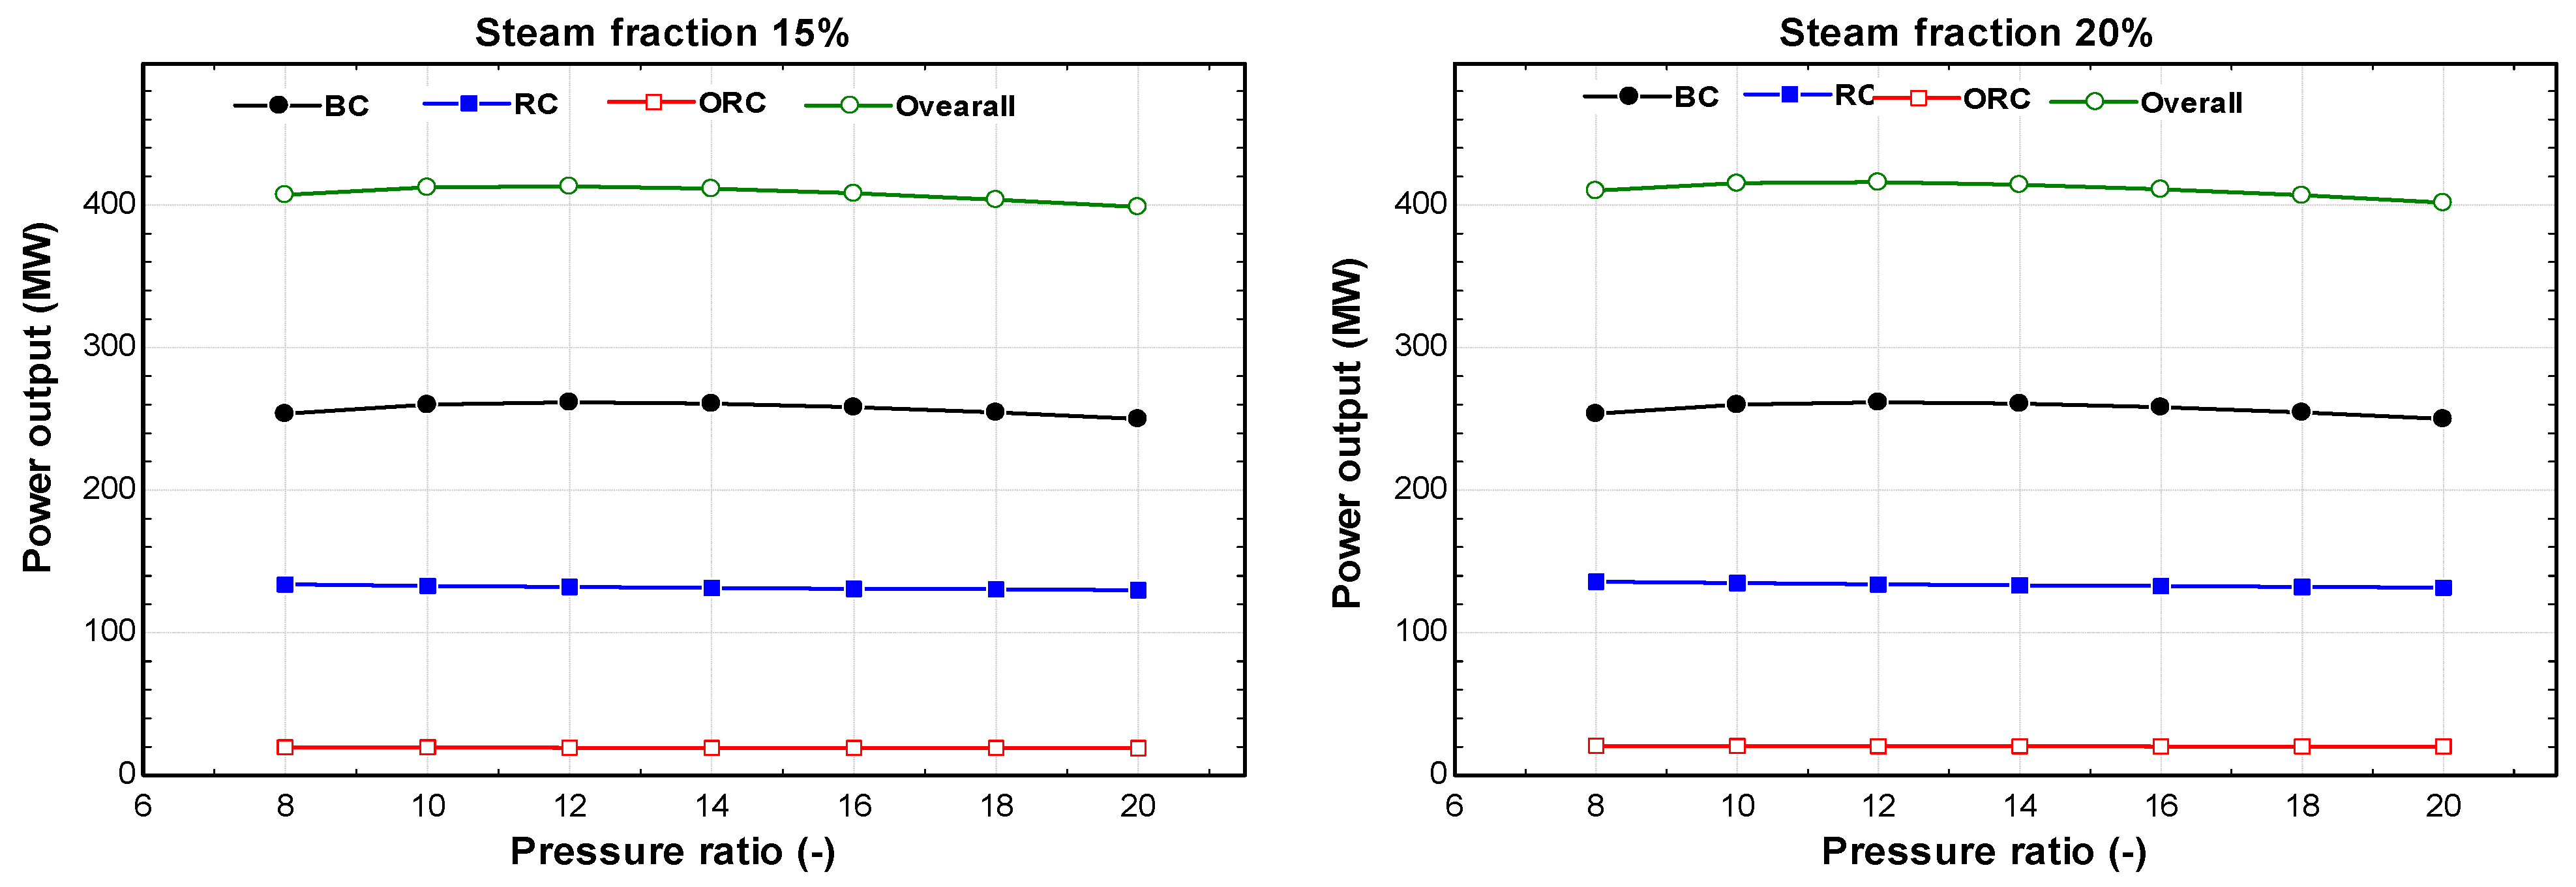
Similarly, Figure 8 show the variations in the BC, RC, and ORC power outputs and the overall power yield during March at different pressure ratios and steam fractions. It is clear that the BC power output and the overall power production increase as the BC pressure ratio increases (to a certain value), but then they begin to recede with a further increase in the pressure ratio. On the other hand, the power output of the steam turbine and ORC turbine drops due to a reduction in the amount of steam generated in the HRSG. With the increase in the pressure ratio of the BC from 8 to 20, the temperature of the air leaving the compressor increases. As a result, the combustion process of the natural gas in the CC is improved, and a higher turbine inlet temperature is obtained; hence, a greater GT power output is achieved. In all conditions of steam fractions in the RC, the increase in the BC pressure ratio improves the overall system power output. Likewise, the topmost power produced is guaranteed at a pressure ratio of 10 and a steam fraction of 20%. The greatest value of overall power output from the triple combined system amounts to 429.9 MW, which is distributed among the BC, the RC, and the ORC at 58.83%, 35.73%, and 5.44%, respectively.
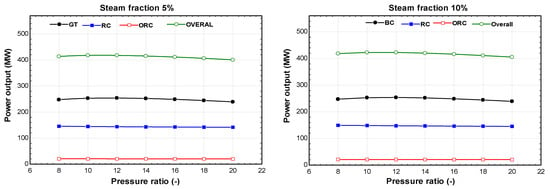
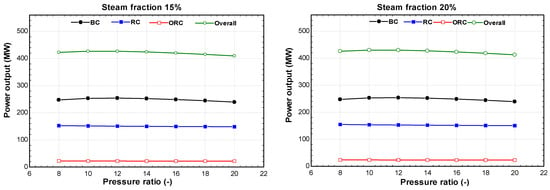
Figure 8.
Variations in power output in March.
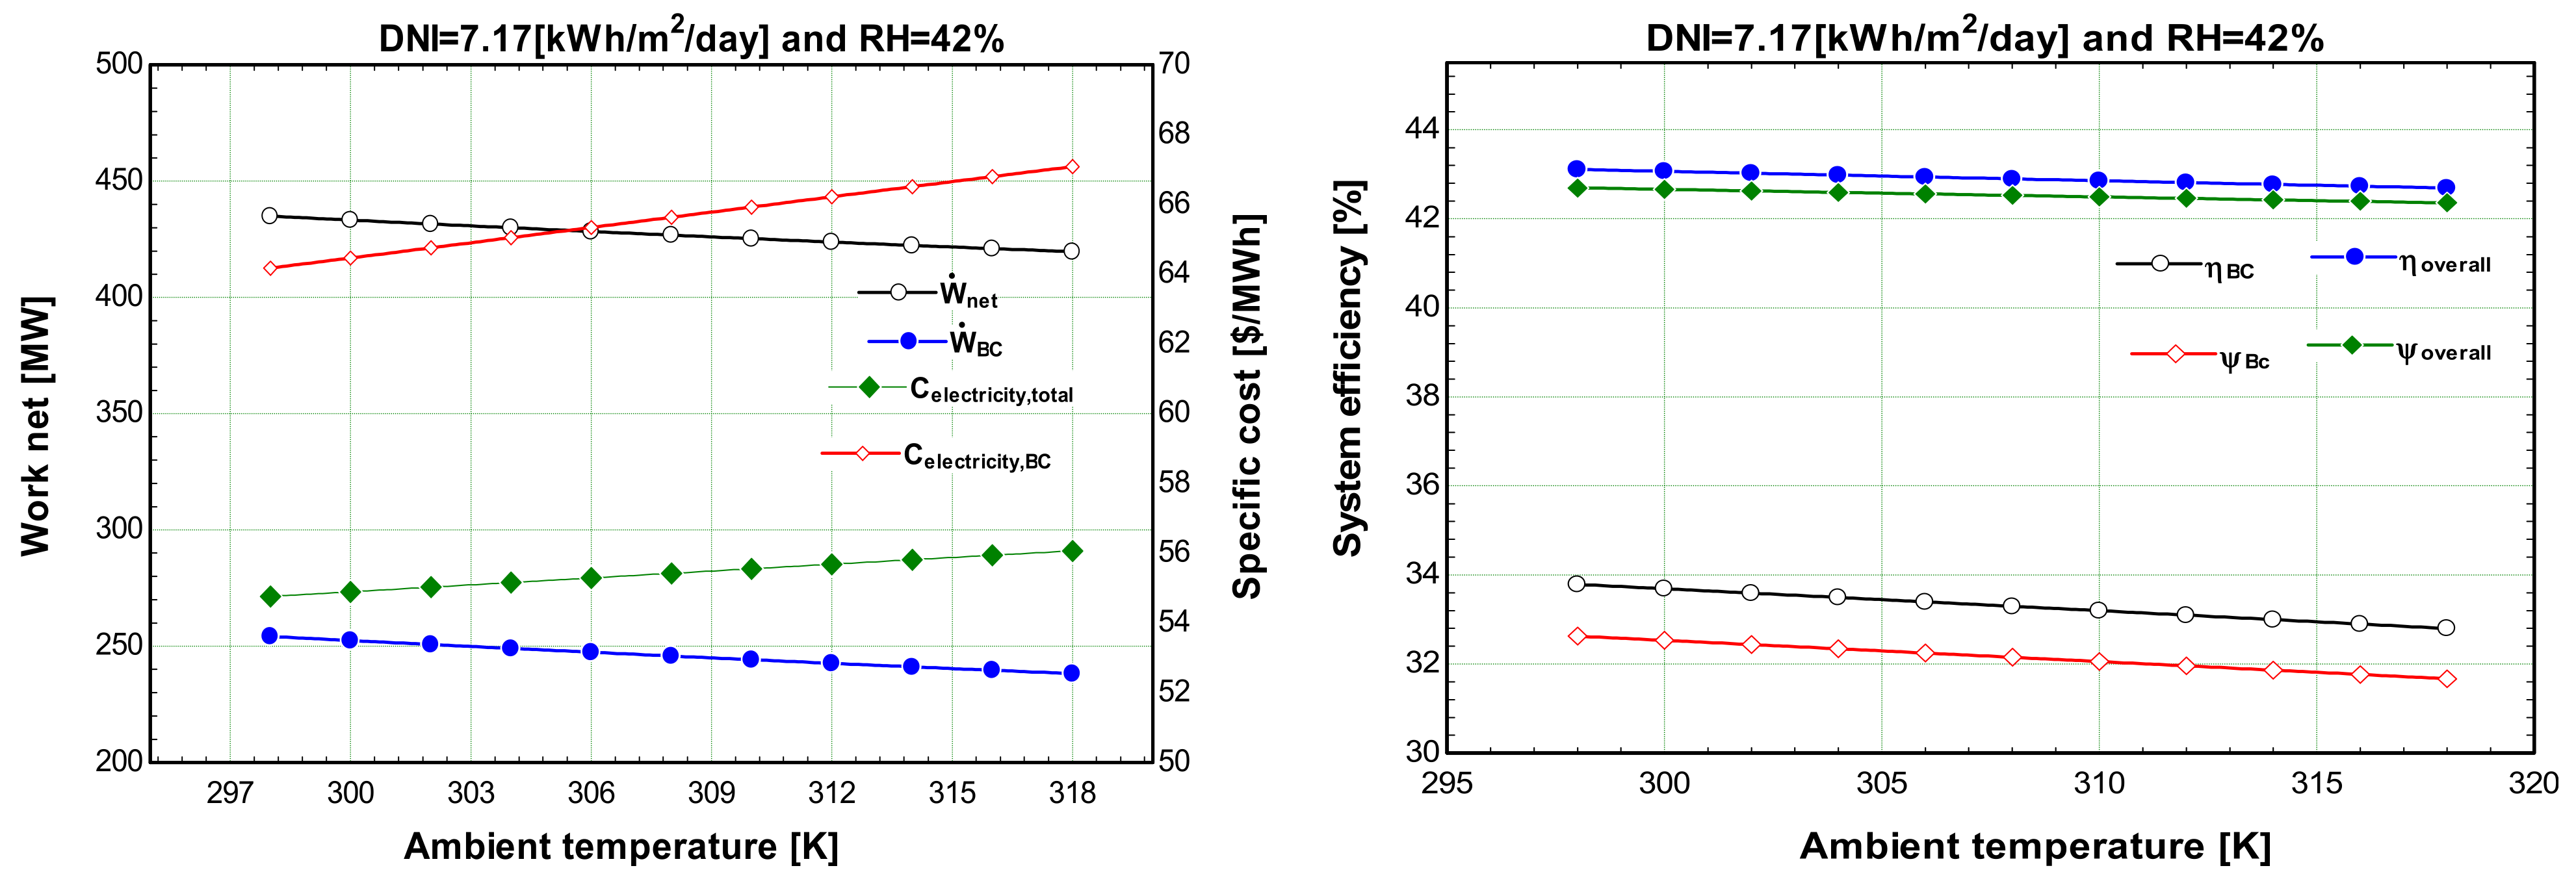
Figure 9 illustrates the impact of ambient temperature on the performance and cost of the BC and compound ISCC systems. The results indicate that as ambient temperature rises, both systems experience decreases in power output and overall efficiency. This occurs because higher ambient temperatures increase the enthalpy and reduce the density of the air entering the compressor, leading to higher power consumption. Consequently, the increased power consumption by compressors lowers the power output and overall efficiencies, increasing operational costs, as shown in Figure 9.
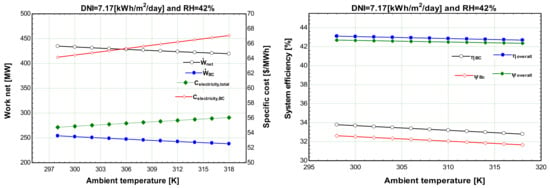
Figure 9.
Variations in power output, specific cost, and overall efficiencies with respect to ambient temperature.
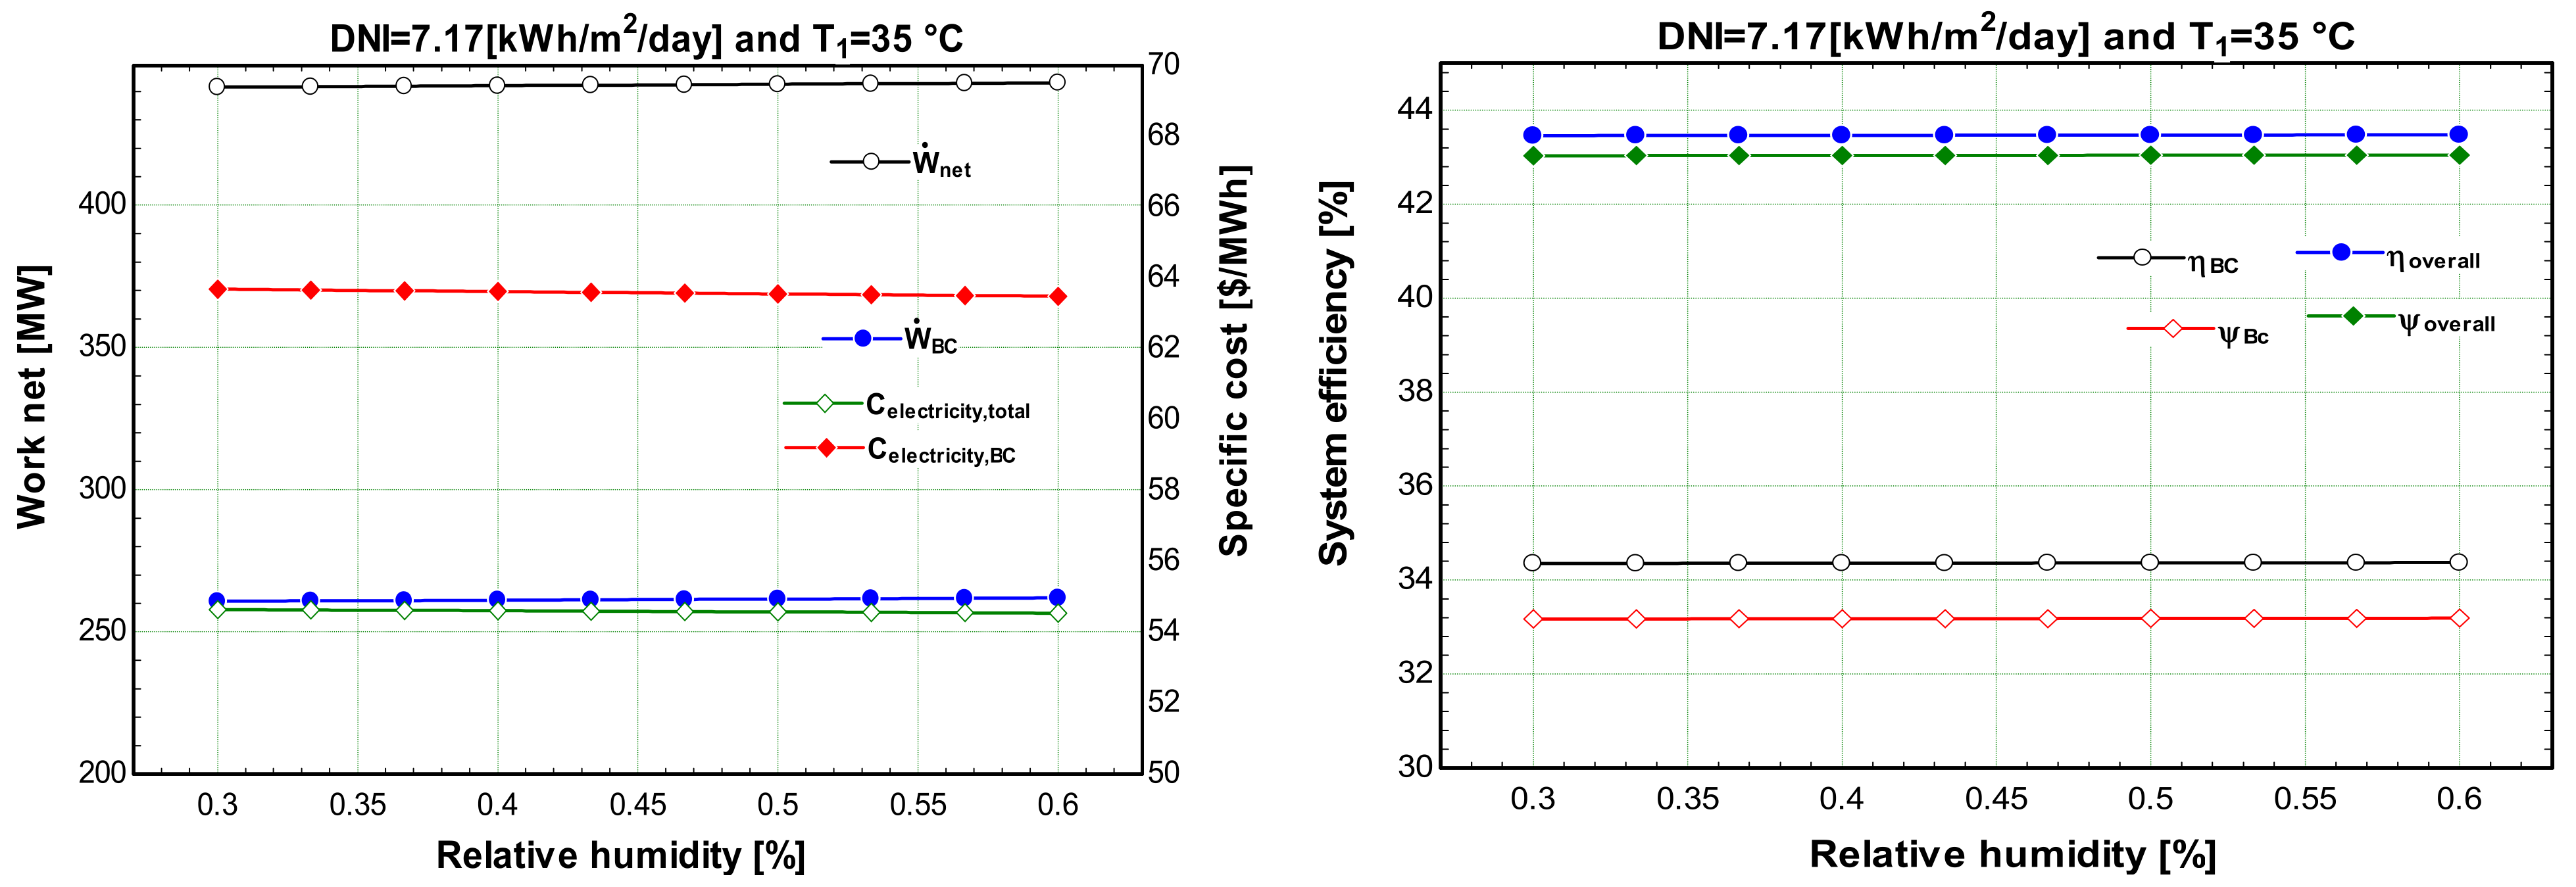
Figure 10 describes the impact of the relative humidity of the intake air on the power outputs, overall efficiencies, and costs of the BC and ISCC systems. According to the findings, increasing the relative humidity of the intake air has a trivial effect on power generation and overall efficiency. As the relative humidity rises, the amount of water vapor in the air rises, causing the air compressor to exert greater work in order to compress the humid air, thereby increasing its power consumption.
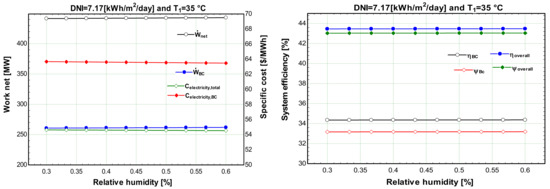
Figure 10.
Variations in power outputs, specific costs, and overall efficiencies with respect to relative humidity.
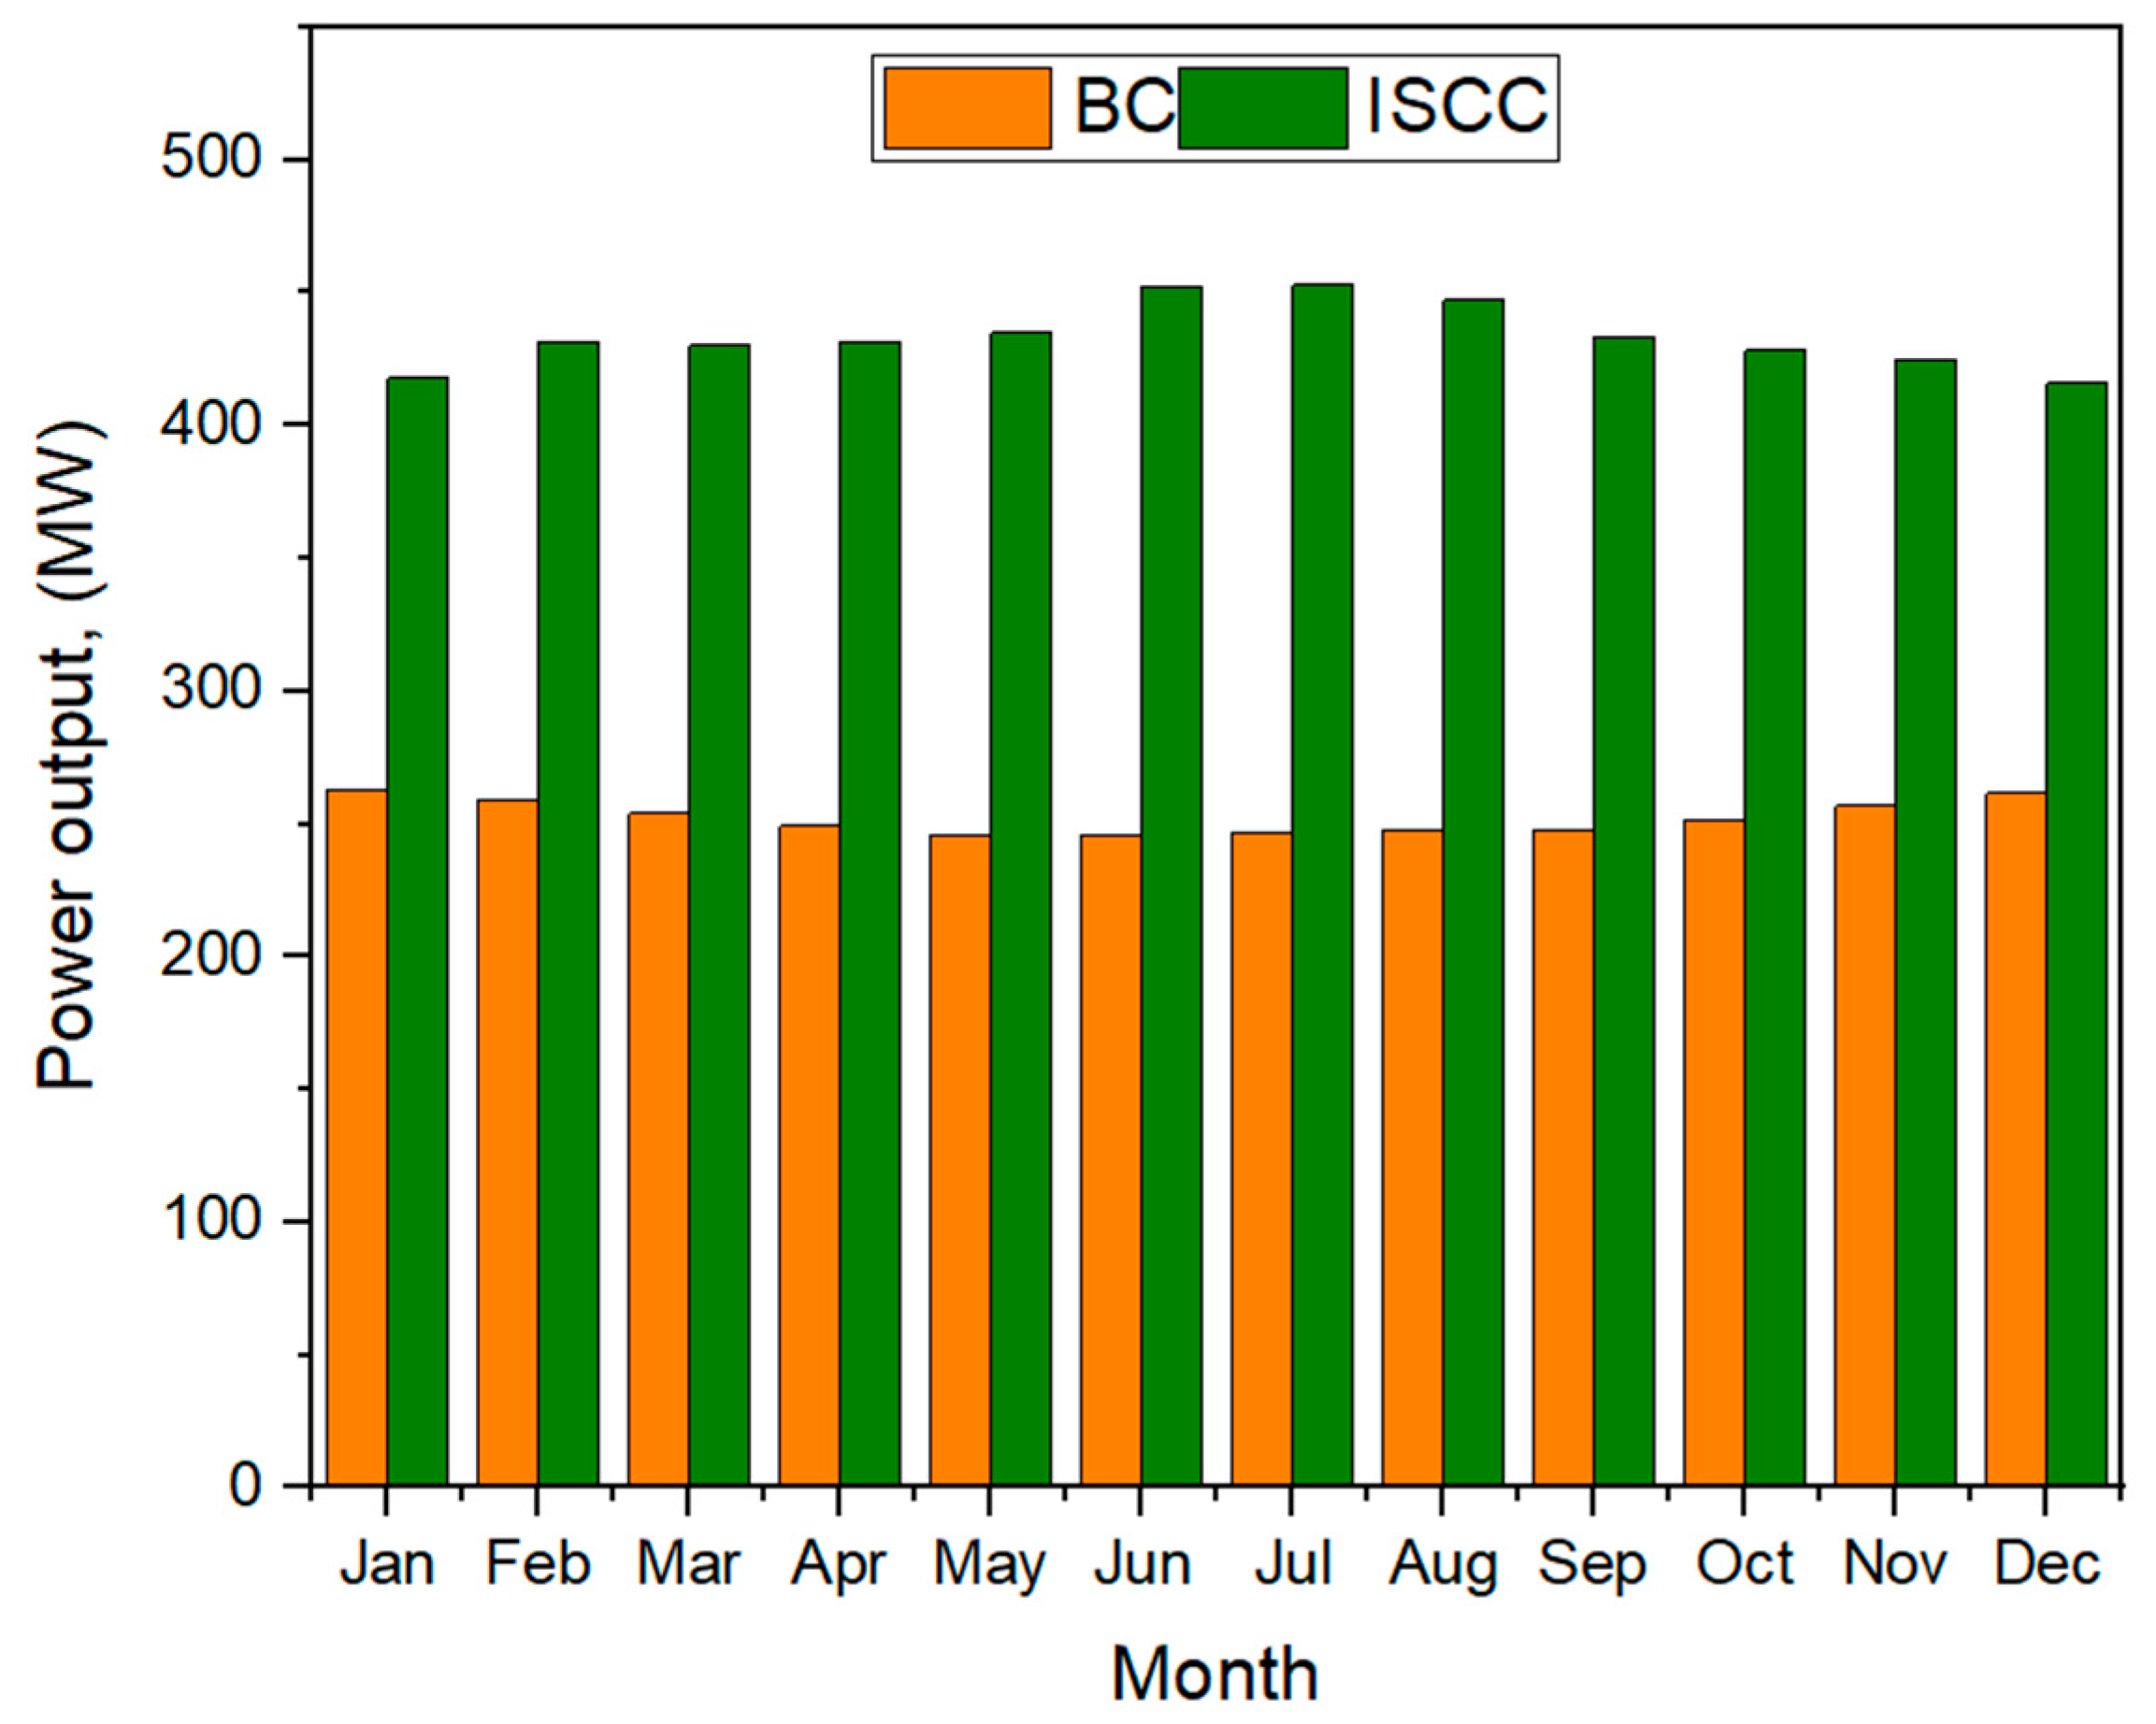
Figure 11 presents the monthly variation in power produced by the BC and the ISCC at a pressure ratio of 12 and a steam fraction of 20%. The analysis demonstrates that the BC power output improves at a lower ambient temperatures. The highest BC power output of 262.6 MW was achieved in January, while the lowest BC power output of 245.5 MW was generated in June. The results also reveal that the ISCC productivity maximizes in the summer due to the higher amount of DNI. The highest ISCC power output of 452.9 MW was attained in July.
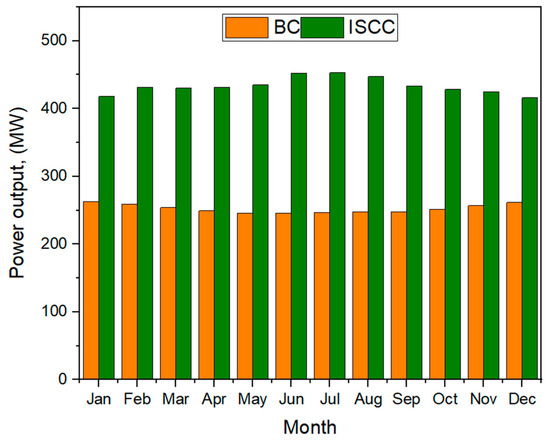
Figure 11.
The monthly power production values from the BC and ISCC.
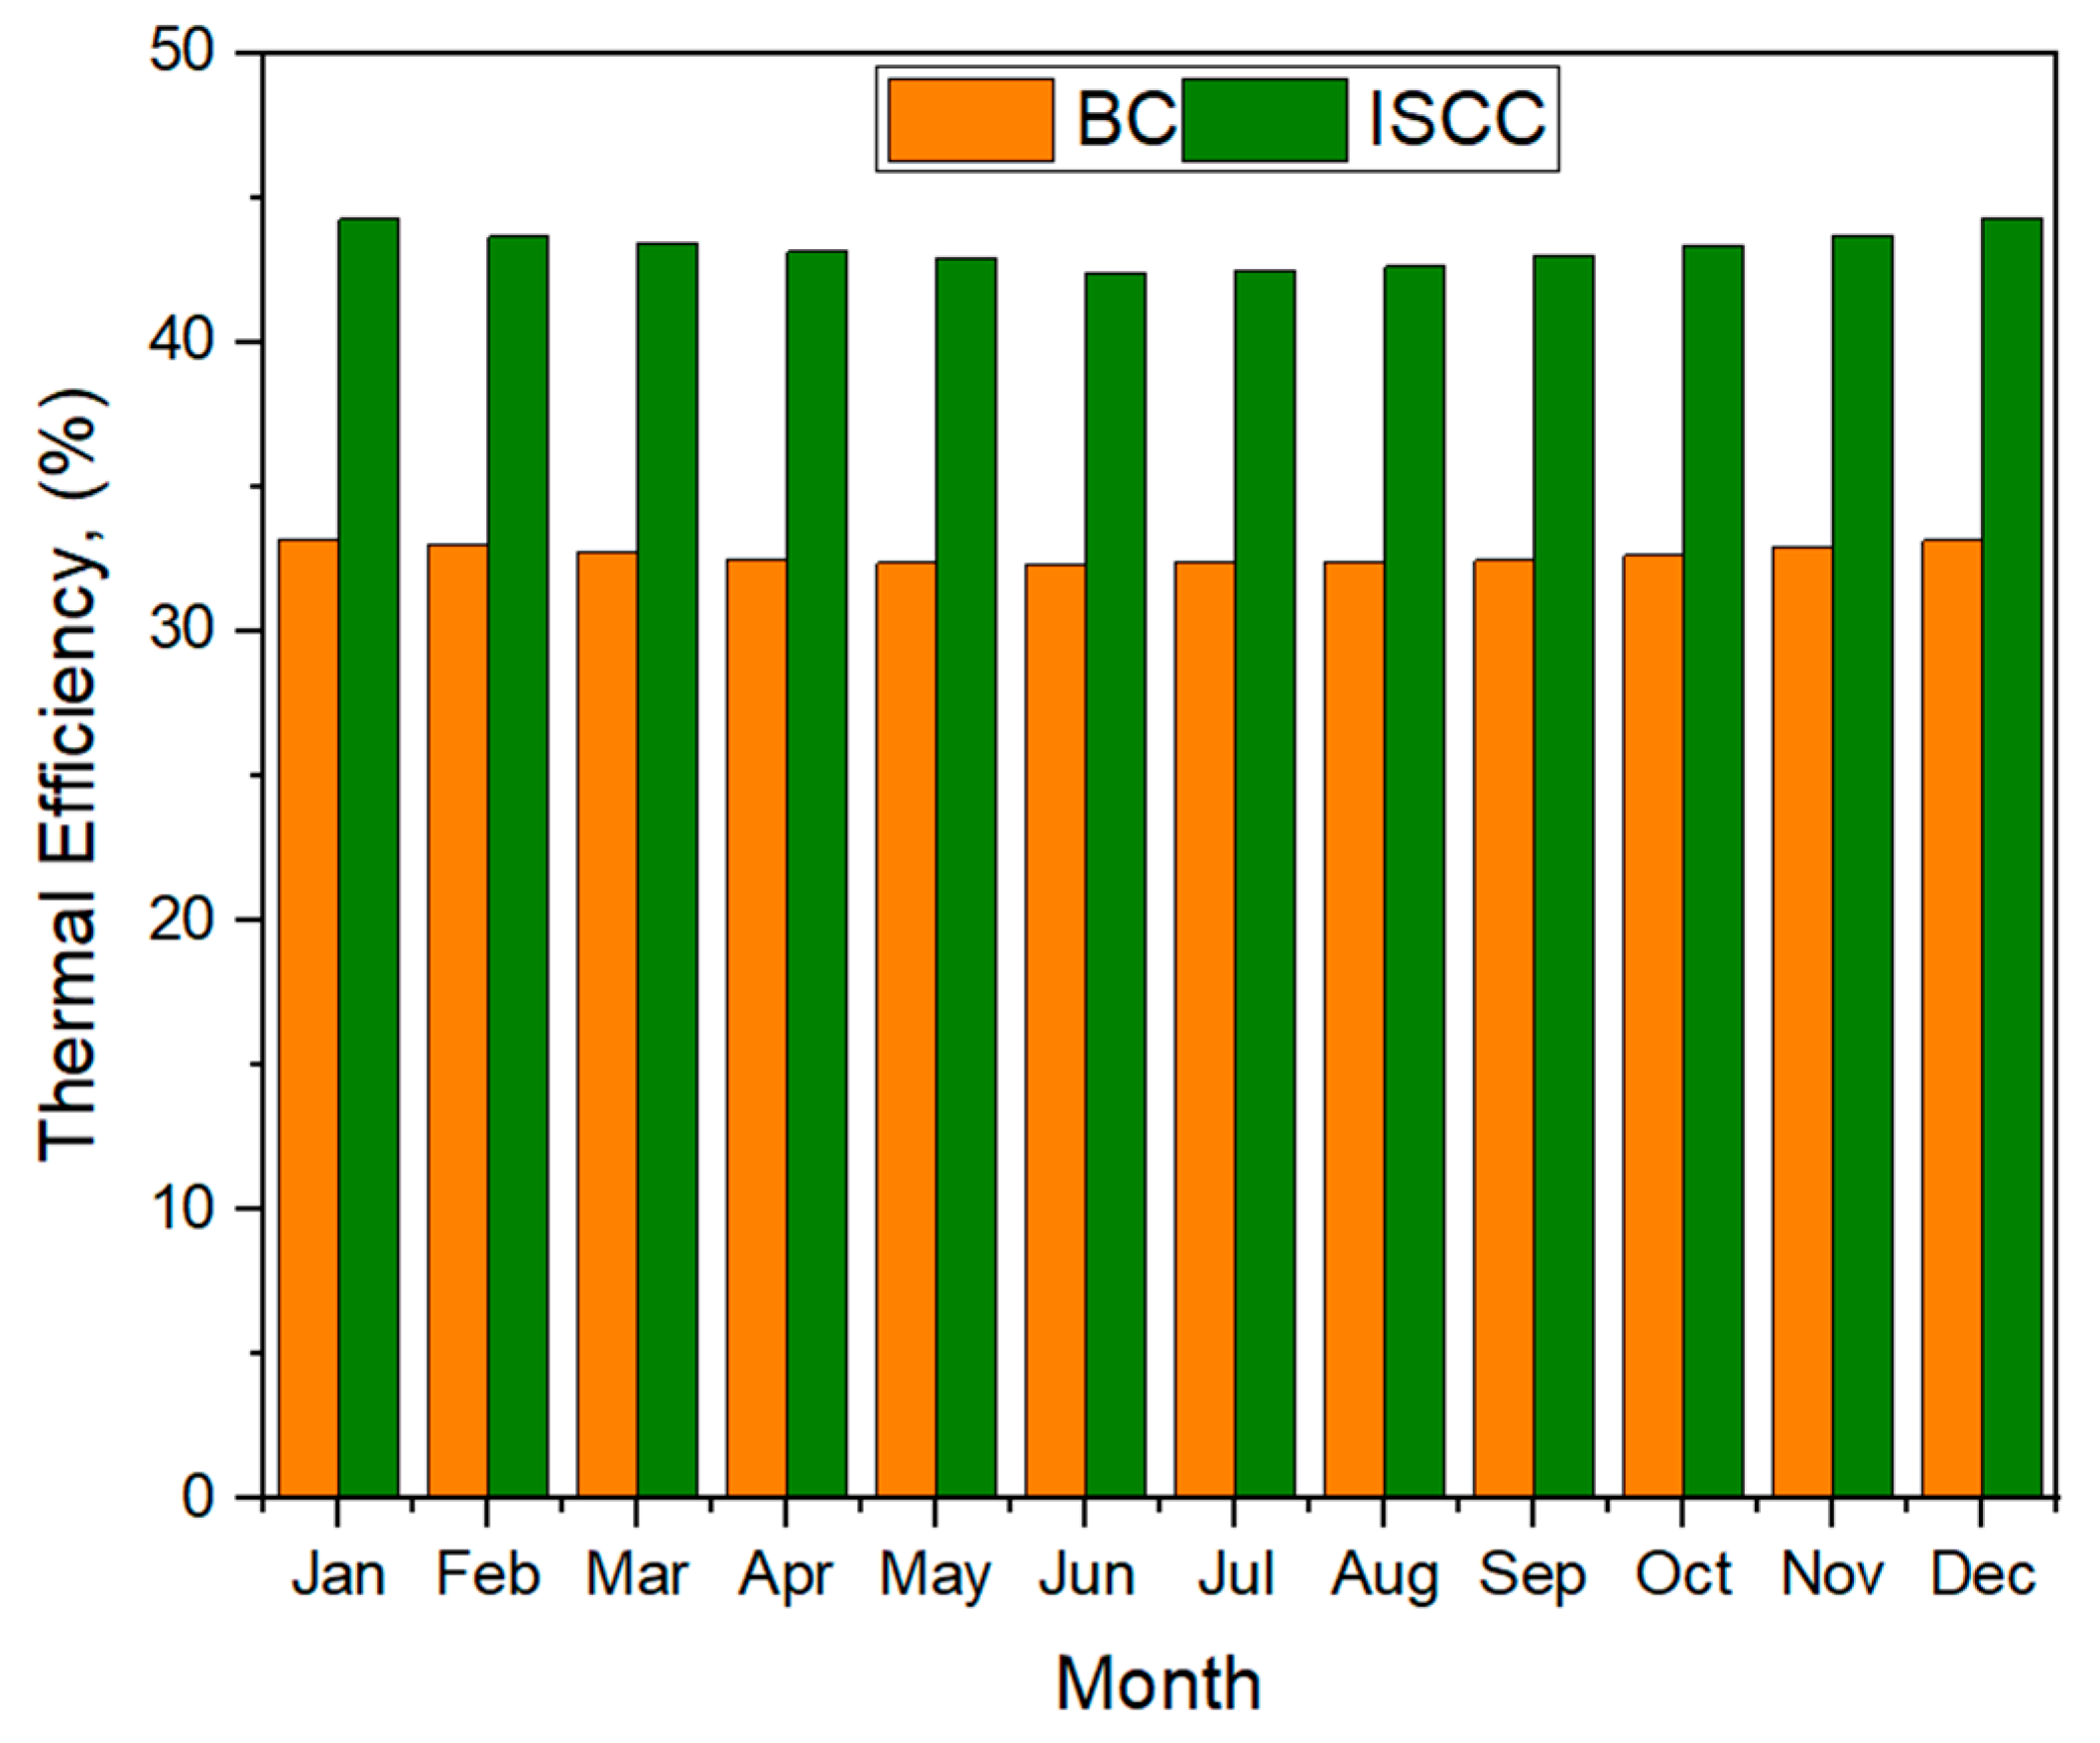
The monthly variation in thermal efficiency for the BC and the ISCC at a pressure ratio of 12 and a 20% steam fraction is depicted in Figure 12. It was found that December has the maximum overall thermal efficiency (44.3%), while June has the lowest thermal efficiency (42.42%). Similarly, the thermal efficiency for the BC is the highest in December (33.18%) and the lowest in June (32.35%).
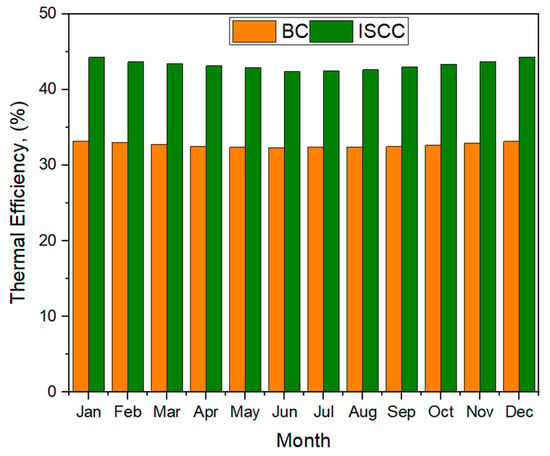
Figure 12.
The monthly thermal efficiency for the BC and the integrated system.
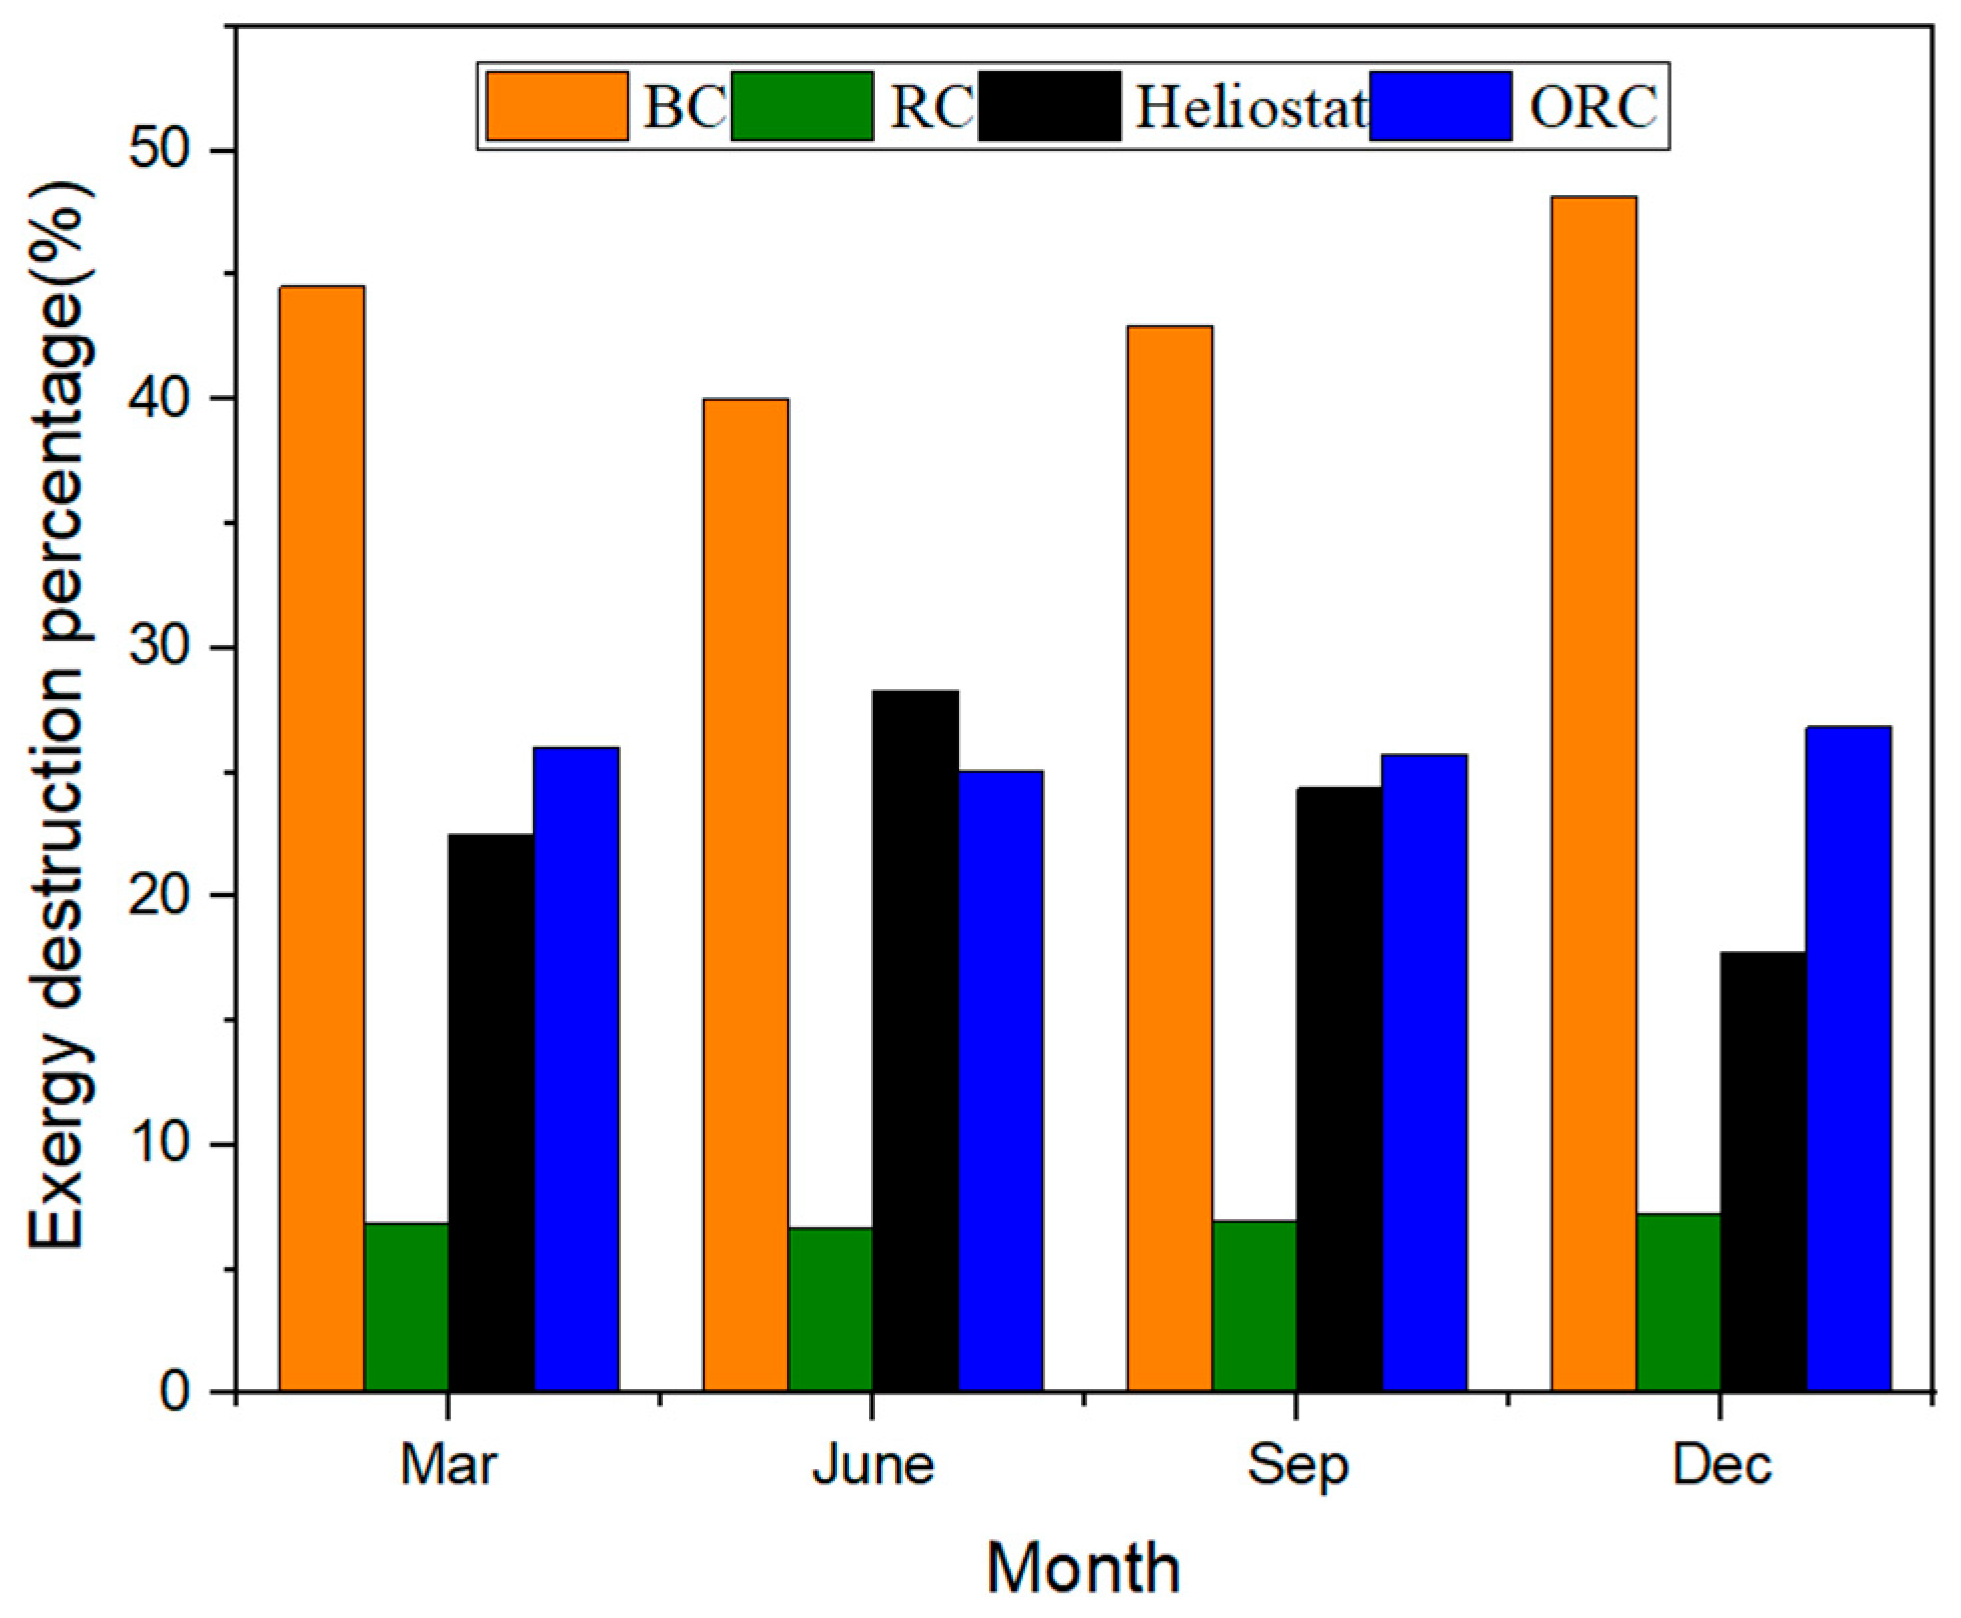
Figure 13 shows the monthly exergy destruction contributed by each cycle. It is obvious that the highest percentage of exergy destruction is associated with the BC. The chemical reaction in the combustion chamber is responsible for the majority of exergy destruction in the BC, comprising 48.16% of the total amount in December. Due to high heat transfer rates to the surroundings, the ORC condenser represents the second-highest seasonal exergy destruction levels (except for summer). It can clearly be observed that the exergy destruction of the solar collector is affected by the DNI, which increases in the summer and decreases in the winter. The exergy loss in the solar collector can be attributed to the irreversible heat transfer between the sun and the collector and within the collector. The solar collector makes up 28.8% of the total amount of exergy destruction in June.
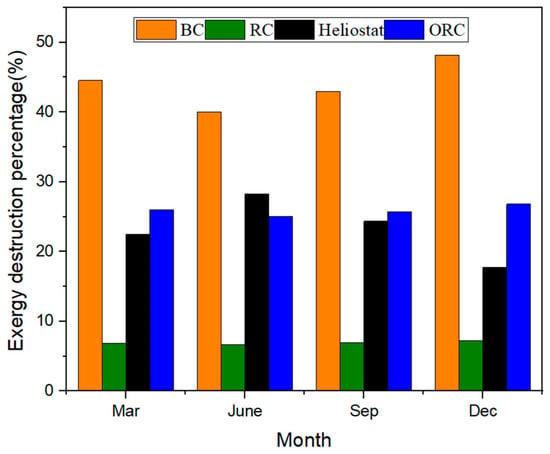
Figure 13.
Exergy destruction for each cycle per month.
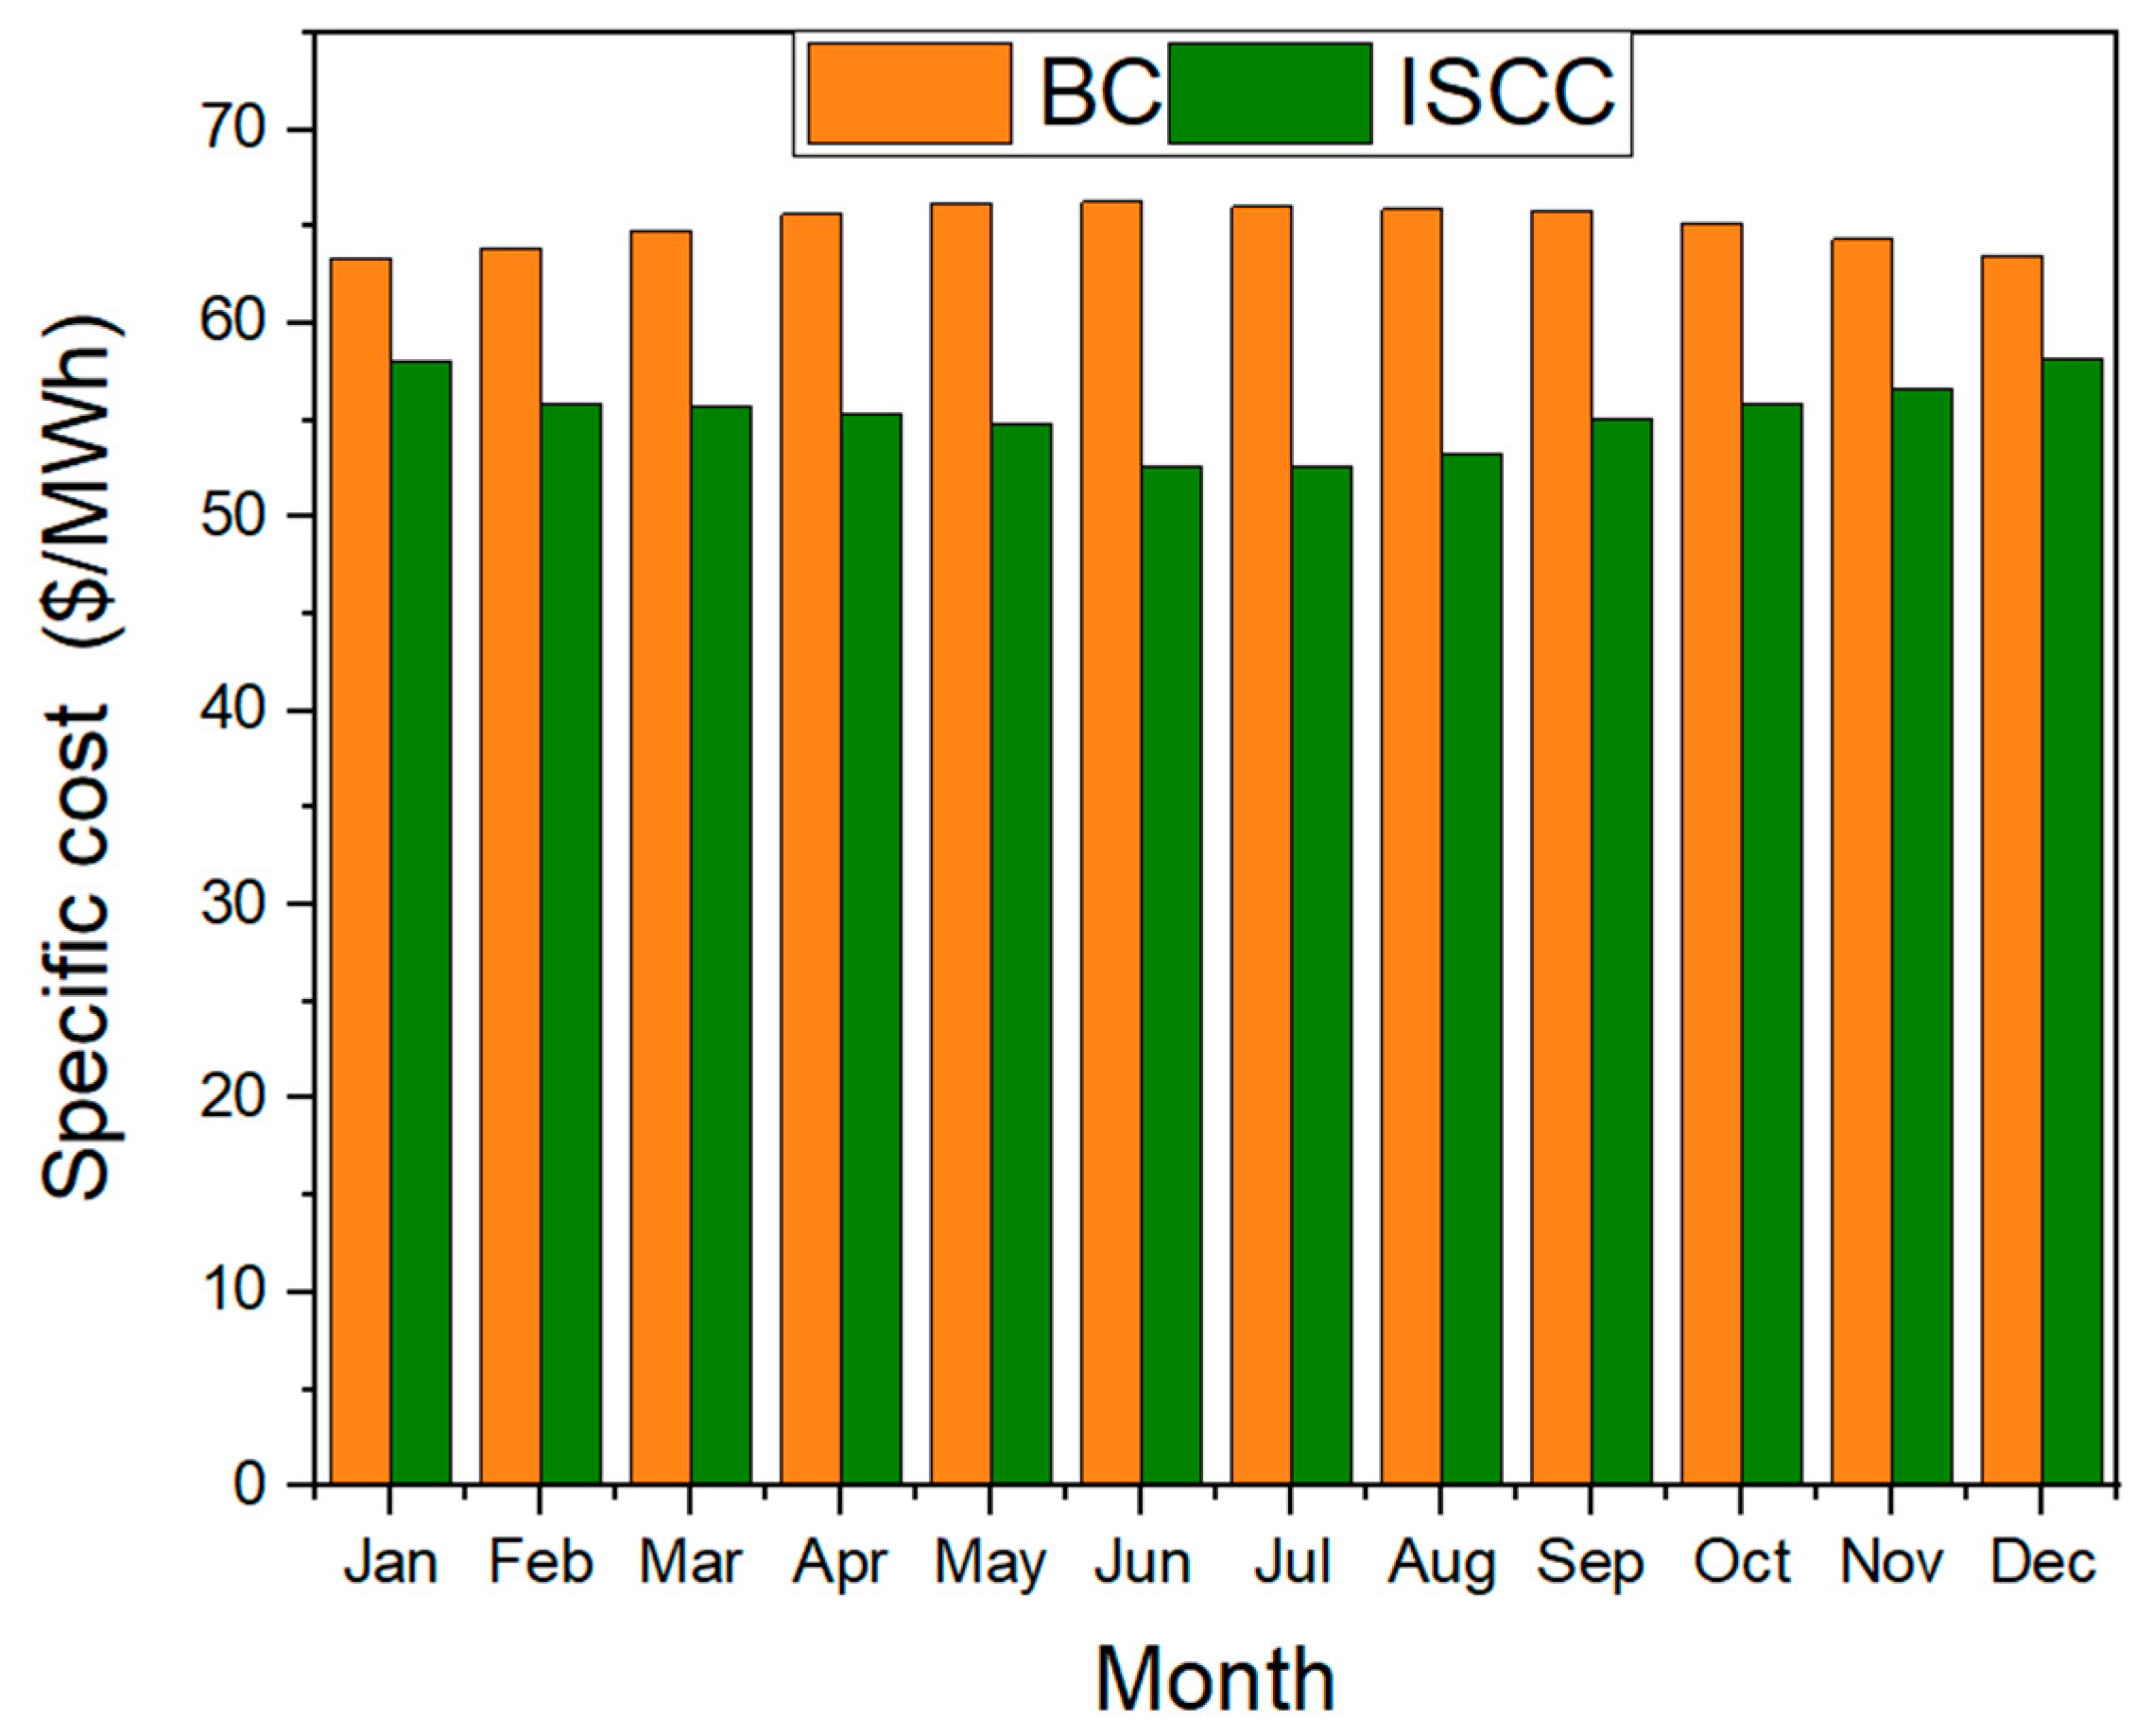
From an economic perspective, the capital investment cost on a monthly basis for both the BC and the ISCC at a pressure ratio of 12 and a 20% steam fraction is given in Figure 14. It is clear in the figure that the variations in the operating conditions have little effect on the thermo-economic performance of the ISCC. The capital investment cost of the BC model is higher than that of the triple integrated model. The capital investment cost for the triple integrated model varies between 52.59 and 58.19 USD/MWh, whereas it ranges between 63.38 and 66.27 USD/MWh for the BC model. These figures conform to those reported by Bakos and Parsa [105] in the sense that their ISCC cost ranged between 45 and 57 EUR/MWh.
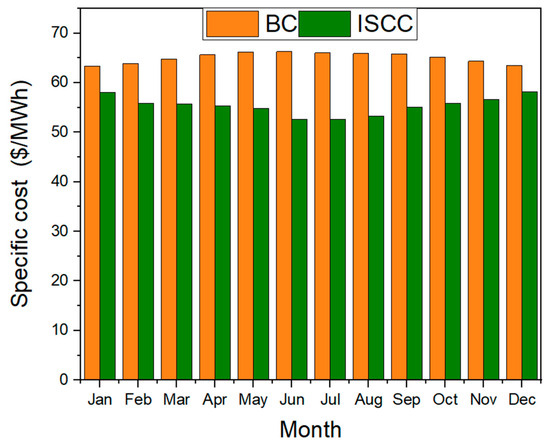
Figure 14.
The capital investment costs for the BC and ISCC per month.
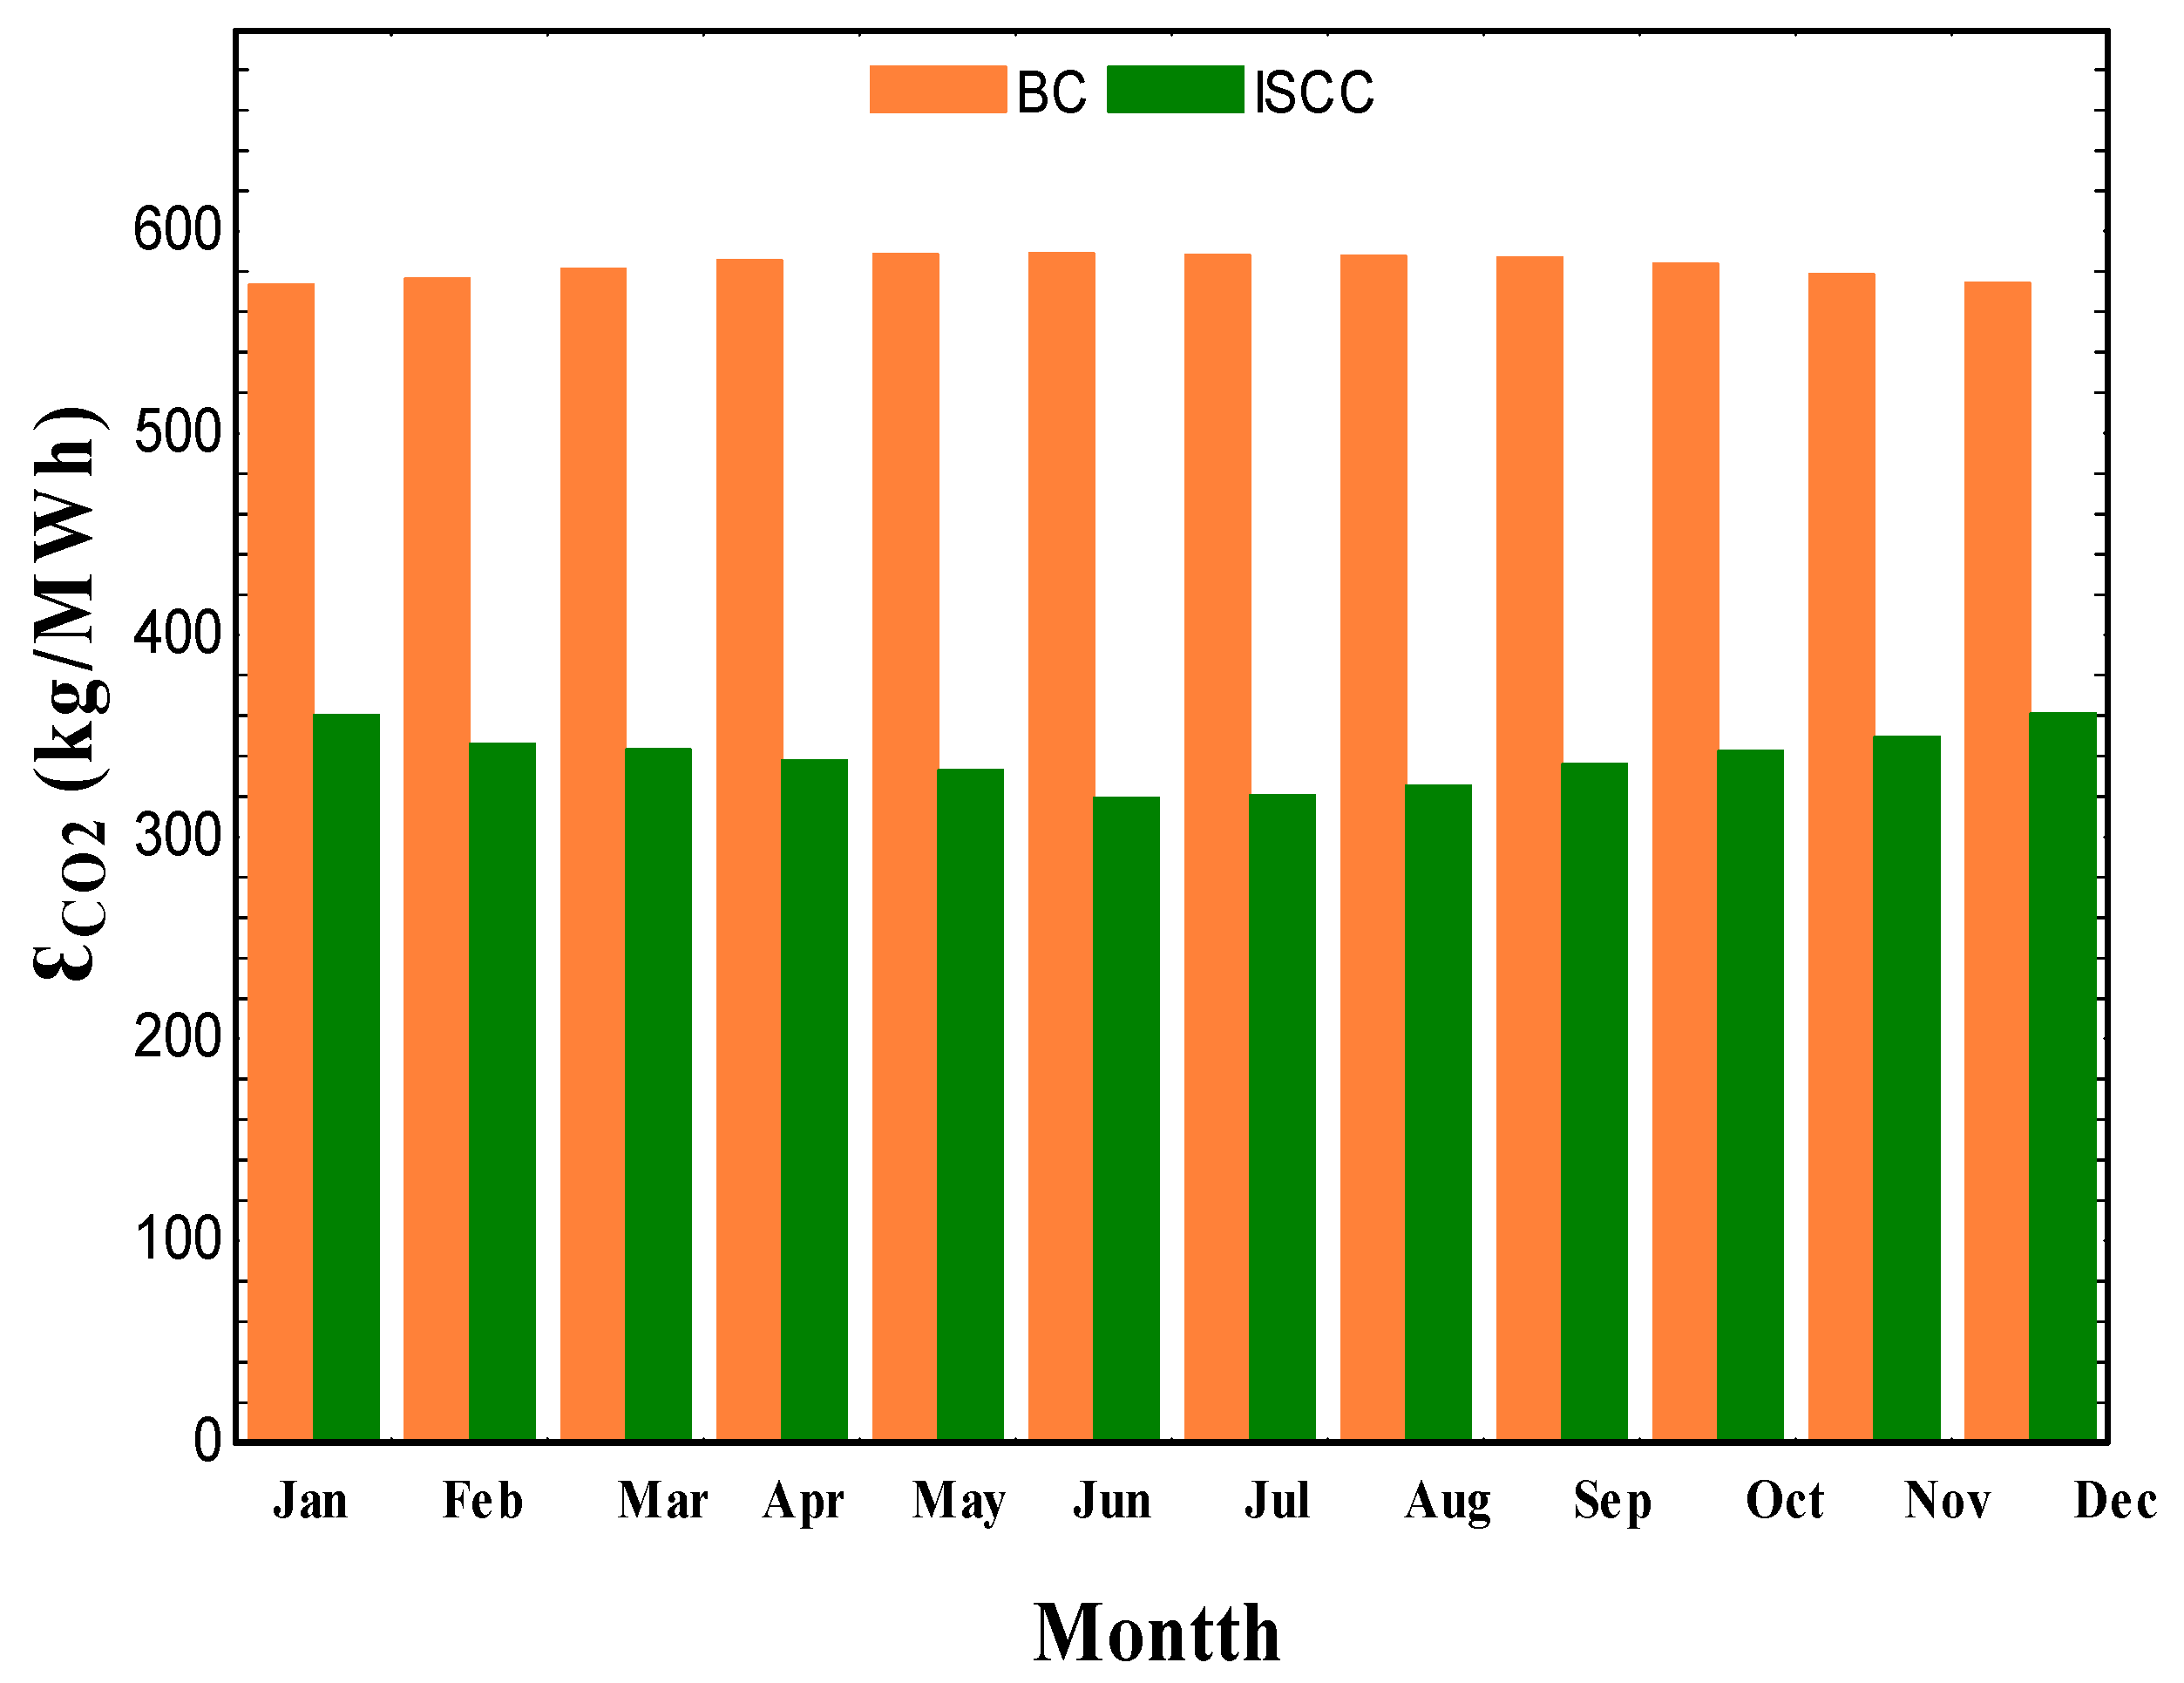
Figure 15 illustrates the monthly mitigation of environmental impacts induced by the Brayton cycle and the ISCC system at a pressure ratio of 12 and a steam fraction of 20%. When comparing the two systems, it is evident that the greatest carbon emission level for the Brayton cycle was 589 kg/MWh in June, yet it decreased to 319.4 kg/MWh for the ISCC. Similarly, in January, the carbon emissions for the Brayton cycle amounted to 573.4 kg/MWh and reduced to 360.3 kg/MWh for the ISCC system. These findings highlight the significant reduction in the environmental carbon footprint that is achievable with the ISCC facility.
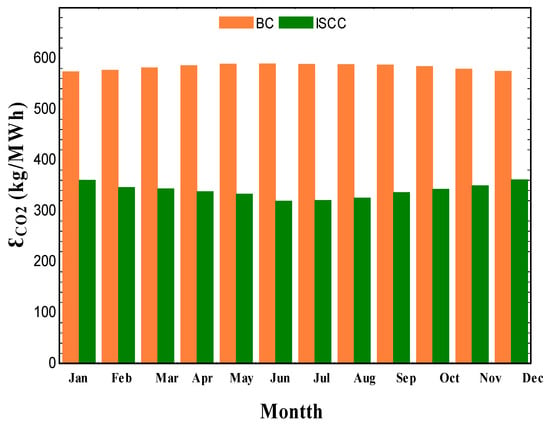
Figure 15.
The monthly levels of carbon footprint for the BC and the developed ISCC system.
Table 14 presents the node properties for the triple combined system (as shown in Figure 4) in June. The characteristics are applied at a fraction of steam of 20% and a pressure ratio of 12 for the Brayton cycle.

Table 14.
The properties of the nodes for the proposed ISCC system in June.
7. Conclusions and Future Work
RE systems may be made far more efficient and cost-effective by hybridizing them with traditional energy sources. Several criteria, including the potential of RE resources, the local climate, and the availability and cost of conventional energy sources, determine the best hybridization choice for a certain RE system. This paper analyzes the potential and effectiveness of integrating RE sources into existing gas-fueled power plants. The integration of CSP technology into the Siemens SGT5 PAC 4000F turbine at the Sarir gas power plant located in the Libyan desert, as a synergistic system, was proposed. The designed ISCC power plant comprises three combined cycles, i.e., BC, RC, and ORC, producing electrical energy simultaneously. A 4E analysis of the compound power system was carried out using the EES programming tool with an elapsed run time of 0.2 s. The 4E analysis of the triple integrated power plant concludes the following:
- The monthly overall power production is dependent on the BC pressure ratio change. It was found that the overall power output is proportionally related to the pressure ratio (up to a certain amount) but then starts to decline afterwards.
- The triple integrated model raises the plant capacity from 245.8 MW to 452.7 MW in June at a cycle pressure ratio of 12 and a 20% steam fraction in the steam Rankine cycle. The overall efficiency of the triple power generation system increased to 42.42% in June instead of 33.5% (for the single-cycle GT).
- The increment in the fraction of extracted steam yields an increase in the overall system efficiency as well as an increase in the power produced under the examined working conditions.
- The power production of the Rankine cycle is proportionally related to the fraction of steam extracted under all considered operating conditions.
- The triple integrated model raises the plant capacity from 261.7 MW to 416 MW in December when steam fractions in the steam Rankine cycle increase from 5% to 20%.
- The highest power output of 452.9 MW was achieved in July due to the higher amount of DNI.
- The DNI affects the exergy destruction percentage of the solar collector, which increases in the summer and decreases in the winter. The solar collector comprises approximately 29% of the total amount in June.
- The capital investment cost for the BC model is higher than that of the triple integrated model. The capital investment cost for the triple integrated model varies between 52.59 and 58.19 USD/MWh, whereas it ranges between 63.38 and 66.18 USD/MWh for the BC model.
- The ISCC system is ecosystem friendly. Carbon mitigation for the ISCC can reach up to 46% compared to the base Brayton cycle unit.
One important advantage of CSP systems is that they can be fairly and easily incorporated with other combustible fuel generation units, especially for oil-producing countries, so that existing power facilities used for traditional power generation can be qualified to be more sustainable energy sources. However, the penetration of CSP technology into the Libyan gas power industry needs further technical, economical, and environmental assessments. This solution needs to be compared to other solutions, such as gas-only systems, solar-only systems, or solar–heat storage alternatives, which represent an open area of research for the future.
Author Contributions
Conceptualization, A.A. and M.A.; methodology, all authors.; software, M.A.; validation, all authors; formal analysis, all authors; investigation, A.A. and M.A.; resources, all authors; data curation, all authors; writing—original draft preparation, A.A. and M.A.; writing—review and editing, all authors; visualization, all authors; supervision, all authors; project administration, F.A. All authors have read and agreed to the published version of the manuscript.
Funding
This research received no external funding.
Institutional Review Board Statement
Not applicable.
Informed Consent Statement
Not applicable.
Data Availability Statement
The data are available upon request.
Acknowledgments
We would like to thank the University of Reading and the Hashemite University (Renewable Energy Center) for their support and for funding this article.
Conflicts of Interest
The authors declare no conflicts of interest.
Nomenclature and Abbreviations
| area of solar field (m2) | |
| Ɛ | emission (kg/MWh) |
| exergy rate (kJ) | |
| exergy destruction rate (kJ) | |
| h | specific enthalpy (kJ kg−1) |
| fuel’s mass flow rate (kg s−1) | |
| heat transfer rate (kW) | |
| power (kW) | |
| capital cost, USD/MJ | |
| efficiency | |
| maintenance factor | |
| i | interest rate |
| DNI | direct normal irradiance of sun |
| AC | air compressor |
| BC | Brayton cycle |
| CC | combustion chamber |
| Con | condenser |
| CRF | capital recovery factor |
| GT | gas turbine |
| HRSG | heat recovery steam generation |
| HPST | high-pressure steam turbine |
| ISCC | integrated solar combined cycle |
| fuel’s lower heating value | |
| LPST | low-pressure steam turbine |
| N | number of operating hours |
| ORC | organic Rankine cycle |
| ORT | organic Rankine cycle turbine |
| P | pump |
| PTC | parabolic trough collector |
| RC | Rankine cycle |
| RE | renewable energy |
| ST | steam turbine |
| k | equipment |
| LEC | levelized energy cost |
| Pr | pressure ratio |
| log mean temperature difference |
References
- Yu, C.; Yu, J.; Gao, D. Smart Cities and Greener Futures: Evidence from a Quasi-Natural Experiment in China’s Smart City Construction. Sustainability 2024, 16, 929. [Google Scholar] [CrossRef]
- Maka, A.O.M.; Salem, S.; Mehmood, M. Solar photovoltaic (PV) applications in Libya: Challenges, potential, opportunities and future perspectives. Clean. Eng. Technol. 2021, 5, 100267. [Google Scholar] [CrossRef]
- Almaktar, M.; Elbreki, A.M.; Shaaban, M. Revitalizing operational reliability of the electrical energy system in Libya: Feasibility analysis of solar generation in local communities. J. Clean. Prod. 2021, 279, 123647. [Google Scholar] [CrossRef] [PubMed]
- Eshtabvi, S.; Aburwais, M.; Elayeb, M.; Abozaea, M.; Shetwan, M. Rooftop PV systems as a solution to the electrical power shortage in Libya. In Proceedings of the 13th Mediterranean Conference on Power Generation, Transmission, Distribution and Energy Conversion (MEDPOWER 2022), Valletta, Malta, 7–9 November 2022; pp. 441–447. [Google Scholar]
- Almaktar, M.; Shaaban, M. Prospects of renewable energy as a non-rivalry energy alternative in Libya. Renew. Sustain. Energy Rev. 2021, 143, 110852. [Google Scholar] [CrossRef]
- Ehtiwesh, A.; Kultu, C.; Su, Y.; Riffat, S. Modelling and performance evaluation of a direct steam generation solar power system coupled with steam accumulator to meet electricity demands for a hospital under typical climate conditions in Libya. Renew. Energy 2023, 206, 795–807. [Google Scholar] [CrossRef]
- Africa Energy Outlook 2019; International Energy Agency (IEA): Paris, France, 2019; pp. 1–288.
- United State Environmental Protection Agency (USEPA). Future Climate Change. [Online]. Available online: https://www.epa.gov/climatechange-science (accessed on 18 April 2024).
- Crippa, M.; Guizzardi, D.; Banja, M.; Solazzo, E.; Muntean, M.; Schaaf, E.; Pagani, F.; Monforti-Ferrario, F.; Olivier, J.G.J.; Quadrelli, R.; et al. Fossil CO2 and GHG Emissions of all World Countries; 2022 Report Publications; Office of the EU: Brussels, Belgium, 2022. [Google Scholar] [CrossRef]
- Bindra, R.H.; Soul, F.; Jabu, S.D.; Allawafi, A.; Belashher, A.M. Potentials and Prospects of Renewables in Libya. In Progress in Clean Energy; Springer: Berlin/Heidelberg, Germany, 2015; Volume 2. [Google Scholar] [CrossRef]
- Rajab, Z.; Almaktar, M.; Al-naily, N.; Mohamed, F.A.; Technology, E. Modeling approach to evaluate wind turbine performance: Case study for a single wind turbine of 1.65 MW in Dernah Libya. In Proceedings of the 2017 8th International Renewable Energy Congress (IREC), Amman, Jordan, 21–23 March 2017; pp. 9–13. [Google Scholar]
- Aliyu, A.K.; Modu, B.; Tan, C.W. A review of renewable energy development in Africa: A focus in South Africa, Egypt and Nigeria. Renew. Sustain. Energy Rev. 2018, 81, 2502–2518. [Google Scholar] [CrossRef]
- REAoL. National Plan for Developing the Renewable Energy in Libya (2013–2025), Renewable Energy Authority of Libya. no. September 2012, pp. 1–36. 2012. Available online: https://faolex.fao.org/docs/pdf/lib217399E.pdf (accessed on 18 April 2024).
- Mohamed, A.M.A.; Al-Habaibeh, A.; Abdo, H. An investigation into the current utilisation and prospective of renewable energy resources and technologies in Libya. Renew. Energy 2013, 50, 732–740. [Google Scholar] [CrossRef]
- Musi, R.; Grange, B.; Sgouridis, S.; Guedez, R.; Armstrong, P.; Slocum, A.; Calvet, N. Techno-economic analysis of concentrated solar power plants in terms of levelized cost of electricity. AIP Conf. Proc. 2017, 1850, 160018. [Google Scholar] [CrossRef]
- Portal, N.O.D. Prediction Of Worldwide Energy Resources (POWER). [Online]. Available online: https://data.nasa.gov/Earth-Science/Prediction-Of-Worldwide-Energy-Resources-POWER-/wn3p-qsan (accessed on 18 April 2024).
- Almaktar, M.; Albreki, A.M.; Mohamed, F.A.; Yahya, K.; Hussein, T. Performance evaluation of different solar photovoltaic technologies in Libya. In Proceedings of the 2020 11th International Renewable Energy Congress (IREC), Hammamet, Tunisia, 29–31 October 2020; pp. 2–6. [Google Scholar] [CrossRef]
- Abbasi, K.R.; Shahbaz, M.; Zhang, J.; Irfan, M.; Alvarado, R. Analyze the environmental sustainability factors of China: The role of fossil fuel energy and renewable energy. Renew. Energy 2022, 187, 390–402. [Google Scholar] [CrossRef]
- Soares, J.; Oliveira, A.C. Numerical simulation of a hybrid concentrated solar power/biomass mini power plant. Appl. Therm. Eng. 2017, 111, 1378–1386. [Google Scholar] [CrossRef]
- Abd El-Aziz, R.M. Renewable power source energy consumption by hybrid machine learning model. Alex. Eng. J. 2022, 61, 9447–9455. [Google Scholar] [CrossRef]
- Qin, J.; Hu, E.; Li, X. Solar aided power generation: A review. Energy Built Environ. 2020, 1, 11–26. [Google Scholar] [CrossRef]
- Overland, I.; Juraev, J.; Vakulchuk, R. Are renewable energy resources more evenly distributed than fossil fuels? Renew. Energy 2022, 200, 379–386. [Google Scholar] [CrossRef]
- Stein, W.H.; Buck, R. Advanced power cycles for concentrated solar power. Sol. Energy 2017, 152, 91–105. [Google Scholar] [CrossRef]
- Chavan, S.; Rudrapati, R.; Manickam, S. A comprehensive review on current advances of thermal energy storage and its applications. Alex. Eng. J. 2022, 61, 5455–5463. [Google Scholar] [CrossRef]
- David, V.; Borri, E.; Zsembinszki, G.; Cabeza, L.F. Thermal energy storage co-benefits in building applications transferred from a renewable energy perspective. J. Energy Storage 2023, 58, 106344. [Google Scholar] [CrossRef]
- Rashid, K.; Mohammadi, K.; Powell, K. Dynamic simulation and techno-economic analysis of a concentrated solar power (CSP) plant hybridized with both thermal energy storage and natural gas. J. Clean. Prod. 2020, 248, 119193. [Google Scholar] [CrossRef]
- Hern, C.; Felbol, C.; Teresa, M.; Ibarra, M. Theoretical technical—economic comparison of hybrid energy for gas and solar concentration plants in the Region of Antofagasta Chile. Sustain. Energy Technol. Assess. 2023, 55, 102979. [Google Scholar] [CrossRef]
- Zhai, R.; Liu, H.; Li, C.; Zhao, M.; Yang, Y. Analysis of a solar-aided coal-fired power generation system based on thermo-economic structural theory. Energy 2016, 102, 375–387. [Google Scholar] [CrossRef]
- Prosin, T.; Pryor, T.; Creagh, C.; Amsbeck, L.; Buck, R. Hybrid Solar and Coal-fired Steam Power Plant with Air Preheating Using a Centrifugal Solid Particle Receiver. Energy Procedia 2015, 69, 1371–1381. [Google Scholar] [CrossRef]
- Libby, C.; Golden, J.; Bedilion, R.; Turchi, C. Assessment of direct steam generation technologies for solar thermal augmented steam cycle applications. Energy Procedia 2014, 49, 1420–1428. [Google Scholar] [CrossRef]
- Parvareh, F.; Sharma, M.; Qadir, A.; Milani, D.; Khalilpour, R.; Chiesa, M.; Abbas, A. Integration of solar energy in coal-fired power plants retrofitted with carbon capture: A review. Renew. Sustain. Energy Rev. 2014, 38, 1029–1044. [Google Scholar] [CrossRef]
- Shrivastava, A.; Prabu, V. Tr fossil power generationhermodynamic analysis of solar energy integrated underground coal gasification in the context of cleane. Energy Convers. Manag. 2016, 110, 67–77. [Google Scholar] [CrossRef]
- Powell, K.M.; Rashid, K.; Ellingwood, K.; Tuttle, J.; Iverson, B.D. Hybrid concentrated solar thermal power systems: A review. Renew. Sustain. Energy Rev. 2017, 80, 215–237. [Google Scholar] [CrossRef]
- Kayadelen, H.K.; Ust, Y.; Bashan, V. Thermodynamic performance analysis of state of the art gas turbine cycles with inter-stage turbine reheat and steam injection. Energy 2021, 222, 119981. [Google Scholar] [CrossRef]
- Ahmadi, M.H.; Nazari, M.A.; Ghasempour, R.; Pourfayaz, F.; Rahimzadeh, M.; Ming, T. A review on solar-assisted gas turbines. Energy Sci. Eng. 2018, 6, 658–674. [Google Scholar] [CrossRef]
- Livshits, M.; Kribus, A. Solar hybrid steam injection gas turbine (STIG) cycle. Sol. Energy 2012, 86, 190–199. [Google Scholar] [CrossRef]
- Kelly, B.; Herrmann, U.; Hale, M.J. Optimization studies for integrated solar combined cycle systems. In Proceedings of the International Solar Energy Conference, Washington, DC, USA, 21–25 April 2001; pp. 393–398. [Google Scholar] [CrossRef]
- Semprini, S.; Sánchez, D.; De Pascale, A. Performance analysis of a micro gas turbine and solar dish integrated system under different solar-only and hybrid operating conditions. Sol. Energy 2016, 132, 279–293. [Google Scholar] [CrossRef]
- Mokheimer, E.M.A.; Dabwan, Y.N.; Habib, M.A. Optimal integration of solar energy with fossil fuel gas turbine cogeneration plants using three different CSP technologies in Saudi Arabia. Appl. Energy 2017, 185, 1268–1280. [Google Scholar] [CrossRef]
- Aichmayer, L.; Spelling, J.; Laumert, B. Thermoeconomic Analysis of a Solar Dish Micro Gas-turbine Combined-cycle Power Plant. Energy Procedia 2015, 69, 1089–1099. [Google Scholar] [CrossRef]
- Quero, M.; Korzynietz, R.; Ebert, M.; Jiménez, A.A.; Del Río, A.; Solugas, J.A.B. Operation experience of the first solar hybrid gas turbine system at MW scale. Energy Procedia 2014, 49, 1820–1830. [Google Scholar] [CrossRef]
- Sarkar, J.; Bhattacharyya, S. Application of graphene and graphene-based materials in clean energy-related devices Minghui. Arch. Thermodyn. 2012, 33, 23–40. [Google Scholar]
- Kalathakis, C.; Aretakis, N.; Roumeliotis, I.; Alexiou, A.; Mathioudakis, K. Assessment of Solar Gas Turbine Hybridization Schemes. J. Eng. Gas Turbines Power 2017, 139, 061701. [Google Scholar] [CrossRef]
- He, Y.; Zheng, S.; Xiao, G. Solar hybrid steam-injected gas turbine system with novel heat and water recovery. J. Clean. Prod. 2020, 276, 124268. [Google Scholar] [CrossRef]
- Baharoon, D.A.; Rahman, H.A.; Omar, W.Z.W.; Fadhl, S.O. Historical development of concentrating solar power technologies to generate clean electricity efficiently—A review. Renew. Sustain. Energy Rev. 2015, 41, 996–1027. [Google Scholar] [CrossRef]
- Pramanik, S.; Ravikrishna, R.V. A review of concentrated solar power hybrid technologies. Appl. Therm. Eng. 2017, 127, 602–637. [Google Scholar] [CrossRef]
- Edgar, T.F.; Powell, K.M. Energy intensification using thermal storage. Curr. Opin. Chem. Eng. 2015, 9, 83–88. [Google Scholar] [CrossRef]
- Botamede, B.B.; Saviano, L.O. Thermodynamic analysis of concentrated solar energy layouts integrated with combined power system. Appl. Therm. Eng. 2023, 229, 120618. [Google Scholar] [CrossRef]
- Alqahtani, B.J.; Patiño-Echeverri, D. Integrated Solar Combined Cycle Power Plants: Paving the way for thermal solar. Appl. Energy 2016, 169, 927–936. [Google Scholar] [CrossRef]
- Zhu, G.; Neises, T.; Turchi, C.; Bedilion, R. Thermodynamic evaluation of solar integration into a natural gas combined cycle power plant. Renew. Energy 2015, 74, 815–824. [Google Scholar] [CrossRef]
- Behar, O.; Khellaf, A.; Mohammedi, K.; Ait-Kaci, S. A review of integrated solar combined cycle system (ISCCS) with a parabolic trough technology. Renew. Sustain. Energy Rev. 2014, 39, 223–250. [Google Scholar] [CrossRef]
- Iulianelli, A.; Liguori, S.; Wilcox, J.; Basile, A. Advances on methane steam reforming to produce hydrogen through membrane reactors technology: A review. Catal. Rev.-Sci. Eng. 2016, 58, 1–35. [Google Scholar] [CrossRef]
- EShagdar, S.; Lougou, B.G.; Shuai, Y.; Ganbold, E.; Chinonso, O.P.; Tan, H. Process analysis of solar steam reforming of methane for producing low-carbon hydrogen. RSC Adv. 2020, 10, 12582–12597. [Google Scholar] [CrossRef] [PubMed]
- Giaconia, A.; Iaquaniello, G.; Caputo, G.; Morico, B.; Salladini, A.; Turchetti, L.; Monteleone, G.; Giannini, A.; Palo, E. Experimental validation of a pilot membrane reactor for hydrogen production by solar steam reforming of methane at maximum 550 °C using molten salts as heat transfer fluid. Int. J. Hydrogen Energy 2020, 45, 33088–33101. [Google Scholar] [CrossRef]
- Sui, J.; Chen, Z.; Wang, C.; Wang, Y.; Liu, J.; Li, W. Efficient hydrogen production from solar energy and fossil fuel via water-electrolysis and methane-steam-reforming hybridization. Appl. Energy 2020, 276, 115409. [Google Scholar] [CrossRef]
- Khan, J.; Arsalan, M.H. Solar power technologies for sustainable electricity generation—A review. Renew. Sustain. Energy Rev. 2016, 55, 414–425. [Google Scholar] [CrossRef]
- Rashid, K.; Safdarnejad, S.M.; Ellingwood, K.; Powell, K.M. Techno-economic evaluation of different hybridization schemes for a solar thermal/gas power plant. Energy 2019, 181, 91–106. [Google Scholar] [CrossRef]
- Cavallaro, F.; Zavadskas, E.K.; Streimikiene, D. Concentrated solar power (CSP) hybridized systems. Ranking based on an intuitionistic fuzzy multi-criteria algorithm. J. Clean. Prod. 2018, 179, 407–416. [Google Scholar] [CrossRef]
- Zhao, Y.; Hong, H.; Jin, H. Evaluation criteria for enhanced solar-coal hybrid power plant performance. Appl. Therm. Eng. 2014, 73, 577–587. [Google Scholar] [CrossRef]
- Li, X.; Gui, D.; Zhao, Z.; Li, X.; Wu, X.; Hua, Y.; Guo, P.; Zhong, H. Operation optimization of electrical-heating integrated energy system based on concentrating solar power plant hybridized with combined heat and power plant. J. Clean. Prod. 2021, 289, 125712. [Google Scholar] [CrossRef]
- MacKenzie, K.; Bowers, R.; Wacker, D.; Drever, R.; Jyoti, A.; Kearney, D. City of Medicine Hat concentrating solar thermal demonstration project, Alberta, Canada. Energy Procedia 2014, 49, 1792–1799. [Google Scholar] [CrossRef]
- NREL. Concentrating Solar Power Projects. [Online]. Available online: https://solarpaces.nrel.gov/ (accessed on 18 April 2024).
- Mohammadi, K.; Khorasanizadeh, H. The potential and deployment viability of concentrated solar power (CSP) in Iran. Energy Strateg. Rev. 2019, 24, 358–369. [Google Scholar] [CrossRef]
- Abdelhafidi, N.; Bachari, N.E.I.; Abdelhafidi, Z.; Cheknane, A.; Mokhnache, A.; Castro, L. Modeling of integrated solar combined cycle power plant (ISCC) of Hassi R’mel, Algeria. Int. J. Energy Sect. Manag. 2020, 14, 505–526. [Google Scholar] [CrossRef]
- Temraz, A.; Rashad, A.; Elweteedy, A.; Elshazly, K. Thermal Analysis of the Iscc Power Plant in Kuraymat, Egypt. In Proceedings of the International Conference on Applied Mechanics and Mechanical Engineering, Cairo, Egypt, 3–5 April 2018; Volume 18, pp. 1–15. [Google Scholar] [CrossRef]
- Ortiz, C.; Chacartegui, R.; Valverde, J.M.; Carro, A.; Tejada, C.; Valverde, J. Increasing the solar share in combined cycles through thermochemical energy storage. Energy Convers. Manag. 2021, 229, 113730. [Google Scholar] [CrossRef]
- Elmorsy, L.; Morosuk, T.; Tsatsaronis, G. Exergy-based analysis and optimization of an integrated solar combined-cycle power plant. Entropy 2020, 22, 655. [Google Scholar] [CrossRef]
- Mohaghegh, M.R.; Heidari, M.; Tasnim, S.; Dutta, A.; Mahmud, S. Latest advances on hybrid solar–biomass power plants. Energy Sources Part A Recovery Util. Environ. Eff. 2021, 1–24. [Google Scholar] [CrossRef]
- Soria, R.; Portugal-Pereira, J.; Szklo, A.; Milani, R.; Schaeffer, R. Hybrid concentrated solar power (CSP)-biomass plants in a semiarid region: A strategy for CSP deployment in Brazil. Energy Policy 2015, 86, 57–72. [Google Scholar] [CrossRef]
- Peterseim, J.H.; White, S.; Tadros, A.; Hellwig, U. Concentrating solar power hybrid plants—Enabling cost effective synergies. Renew. Energy 2014, 67, 178–185. [Google Scholar] [CrossRef]
- Sterrer, R.; Schidler, S.; Schwandt, O.; Franz, P.; Hammerschmid, A. Theoretical analysis of the combination of CSP with a biomass CHP-plant using ORC-technology in Central Europe. Energy Procedia 2014, 49, 1218–1227. [Google Scholar] [CrossRef]
- Peterseim, J.H.; Tadros, A.; Hellwig, U.; White, S. Increasing the efficiency of parabolic trough plants using thermal oil through external superheating with biomass. Energy Convers. Manag. 2014, 77, 784–793. [Google Scholar] [CrossRef]
- Peterseim, J.H.; Hellwig, U.; Tadros, A.; White, S. Hybridisation optimization of concentrating solar thermal and biomass power generation facilities. Sol. Energy 2014, 99, 203–214. [Google Scholar] [CrossRef]
- Moya, D.; Aldás, C.; Kaparaju, P. Geothermal energy: Power plant technology and direct heat applications. Renew. Sustain. Energy Rev. 2018, 94, 889–901. [Google Scholar] [CrossRef]
- Cardemil, J.M.; Cortés, F.; Díaz, A.; Escobar, R. Thermodynamic evaluation of solar-geothermal hybrid power plants in northern Chile. Energy Convers. Manag. 2016, 123, 348–361. [Google Scholar] [CrossRef]
- Zhou, C.; Doroodchi, E.; Moghtaderi, B. An in-depth assessment of hybrid solar-geothermal power generation. Energy Convers. Manag. 2013, 74, 88–101. [Google Scholar] [CrossRef]
- Calise, F.; Cappiello, F.L.; Dentice d’Accadia, M.; Vicidomini, M. Energy and economic analysis of a small hybrid solar-geothermal trigeneration system: A dynamic approach. Energy 2020, 208, 118295. [Google Scholar] [CrossRef]
- Musharavati, F.; Khanmohammadi, S.; Pakseresht, A. A novel multi-generation energy system based on geothermal energy source: Thermo-economic evaluation and optimization. Energy Convers. Manag. 2021, 230, 113829. [Google Scholar] [CrossRef]
- Ju, X.; Xu, C.; Hu, Y.; Han, X.; Wei, G.; Du, X. A review on the development of photovoltaic/concentrated solar power (PV-CSP) hybrid systems. Sol. Energy Mater. Sol. Cells 2017, 161, 305–327. [Google Scholar] [CrossRef]
- Bousselamti, L.; Cherkaoui, M. Modelling and Assessing the Performance of Hybrid PV-CSP Plants in Morocco: A Parametric Study. Int. J. Photoenergy 2019, 2019, 5783927. [Google Scholar] [CrossRef]
- Aguilar-Jiménez, J.; Velázquez, N.; Acuña, A.; Cota, R.; González, E.; González, L.; López, R.; Islas, S. Techno-economic analysis of a hybrid PV-CSP system with thermal energy storage applied to isolated microgrids. Sol. Energy 2018, 174, 55–65. [Google Scholar] [CrossRef]
- Moris, C.H.; Guevara, M.T.C.; Salmon, A.; Lorca, A. Comparison between concentrated solar power and gas-based generation in terms of economic and flexibility-related aspects in chile. Energies 2021, 14, 1063. [Google Scholar] [CrossRef]
- Chennaif, M.; Zahboune, H.; Elhafyani, M.; Zouggar, S. Electric System Cascade Extended Analysis for optimal sizing of an autonomous hybrid CSP/PV/wind system with Battery Energy Storage System and thermal energy storage. Energy 2021, 227, 120444. [Google Scholar] [CrossRef]
- Petrakopoulou, F.; Robinson, A.; Loizidou, M. Simulation and evaluation of a hybrid concentrating-solar and wind power plant for energy autonomy on islands. Renew. Energy 2016, 96, 863–871. [Google Scholar] [CrossRef]
- Santos-Alamillos, F.J.; Pozo-Vázquez, D.; Ruiz-Arias, J.A.; Von Bremen, L.; Tovar-Pescador, J. Combining wind farms with concentrating solar plants to provide stable renewable power. Renew. Energy 2015, 76, 539–550. [Google Scholar] [CrossRef]
- Yang, Y.; Guo, S.; Liu, D.; Li, R.; Chu, Y. Operation optimization strategy for wind-concentrated solar power hybrid power generation system. Energy Convers. Manag. 2018, 160, 243–250. [Google Scholar] [CrossRef]
- Kost, C.; Pfluger, B.; Eichhammer, W.; Ragwitz, M. Fruitful symbiosis: Why an export bundled with wind energy is the most feasible option for North African concentrated solar power. Energy Policy 2011, 39, 7136–7145. [Google Scholar] [CrossRef]
- Dimarzio, G.; Angelini, L.; Price, W.; Chin, C.; Harris, S. The Stillwater Triple Hybrid Power Plant: Integrating Geothermal, Solar Photovoltaic and Solar Thermal Power Generation. In Proceedings of the World Geotherm Congress, Melbourne, Australia, 19–25 April 2015; pp. 1–5. [Google Scholar]
- Arabkoohsar, A. Combined steam based high-temperature heat and power storage with an Organic Rankine Cycle, an efficient mechanical electricity storage technology. J. Clean. Prod. 2020, 247, 119098. [Google Scholar] [CrossRef]
- Belgasim, B.; Aldali, Y.; Abdunnabi, M.J.R.; Hashem, G.; Hossin, K. The potential of concentrating solar power (CSP) for electricity generation in Libya. Renew. Sustain. Energy Rev. 2018, 90, 1–15. [Google Scholar] [CrossRef]
- Shaaban, S. Analysis of an integrated solar combined cycle with steam and organic Rankine cycles as bottoming cycles. Energy Convers. Manag. 2016, 126, 1003–1012. [Google Scholar] [CrossRef]
- Anvari, S.; Khalilarya, S.; Zare, V. Exergoeconomic and environmental analysis of a novel configuration of solar-biomass hybrid power generation system. Energy 2018, 165, 776–789. [Google Scholar] [CrossRef]
- Zhang, Q.; Ogren, R.M.; Kong, S.C. Thermo-economic analysis and multi-objective optimization of a novel waste heat recovery system with a transcritical CO2 cycle for offshore gas turbine application. Energy Convers. Manag. 2018, 172, 212–227. [Google Scholar] [CrossRef]
- Ardeh, E.A.-A.; Loni, R.; Najafi, G.; Ghobadian, B.; Bellos, E.; Wen, D. Exergy and economic assessments of solar organic Rankine cycle system with linear V-Shape cavity. Energy Convers. Manag. 2019, 199, 111997. [Google Scholar] [CrossRef]
- Akroot, A.; Namli, L. Performance assessment of an electrolyte-supported and anode-supported planar solid oxide fuel cells hybrid system. J. Ther. Eng. 2021, 7, 1921–1935. [Google Scholar] [CrossRef]
- Wang, S.; Zhang, L.; Liu, C.; Liu, Z.; Lan, S.; Li, Q.; Wang, X. Techno-economic-environmental evaluation of a combined cooling heating and power system for gas turbine waste heat recovery. Energy 2021, 231, 120956. [Google Scholar] [CrossRef]
- Nami, H.; Mahmoudi, S.M.S.; Nemati, A. Exergy, economic and environmental impact assessment and optimization of a novel cogeneration system including a gas turbine, a supercritical CO2 and an organic Rankine cycle (GT-HRSG/SCO2). Appl. Therm. Eng. 2017, 110, 1315–1330. [Google Scholar] [CrossRef]
- Luo, X.; Hu, J.; Zhao, J.; Zhang, B.; Chen, Y.; Mo, S. Improved exergoeconomic analysis of a retrofitted natural gas-based cogeneration system. Energy 2014, 72, 459–475. [Google Scholar] [CrossRef]
- Baghernejad, A.; Yaghoubi, M. Exergoeconomic analysis and optimization of an Integrated Solar Combined Cycle System (ISCCS) using genetic algorithm. Energy Convers. Manag. 2011, 52, 2193–2203. [Google Scholar] [CrossRef]
- Cavalcanti, E.J.C. Exergoeconomic and exergoenvironmental analyses of an integrated solar combined cycle system. Renew. Sustain. Energy Rev. 2017, 67, 507–519. [Google Scholar] [CrossRef]
- Köse, Ö.; Koç, Y.; Yağlı, H. Energy, exergy, economy and environmental (4E) analysis and optimization of single, dual and triple configurations of the power systems: Rankine Cycle/Kalina Cycle, driven by a gas turbine. Energy Convers. Manag. 2021, 227, 113604. [Google Scholar] [CrossRef]
- Ahmadi, P.; Almasi, A.; Shahriyari, M.; Dincer, I. Multi-objective optimization of a combined heat and power (CHP) system for heating purpose in a paper mill using evolutionary algorithm. Int. J. Energy Res. 2012, 36, 46–63. [Google Scholar] [CrossRef]
- Koç, Y.; Yağlı, H.; Kalay, I. Energy, Exergy, and Parametric Analysis of Simple and Recuperative Organic Rankine Cycles Using a Gas Turbine—Based Combined Cycle. J. Energy Eng. 2020, 146, 04020041. [Google Scholar] [CrossRef]
- Sachdeva, J.; Singh, O. Thermodynamic analysis of solar powered triple combined Brayton, Rankine and organic Rankine cycle for carbon free power. Renew. Energy 2019, 139, 765–780. [Google Scholar] [CrossRef]
- Bakos, G.C.; Parsa, D. Technoeconomic assessment of an integrated solar combined cycle power plant in Greece using line-focus parabolic trough collectors. Renew. Energy 2013, 60, 598–603. [Google Scholar] [CrossRef]
Disclaimer/Publisher’s Note: The statements, opinions and data contained in all publications are solely those of the individual author(s) and contributor(s) and not of MDPI and/or the editor(s). MDPI and/or the editor(s) disclaim responsibility for any injury to people or property resulting from any ideas, methods, instructions or products referred to in the content. |
© 2024 by the authors. Licensee MDPI, Basel, Switzerland. This article is an open access article distributed under the terms and conditions of the Creative Commons Attribution (CC BY) license (https://creativecommons.org/licenses/by/4.0/).

