Abstract
To ensure the sustainable development of energy supply, there is a continuous increase in demand for deep coal mining, making safe and efficient extraction a crucial area of research. However, with the increasing depth, rising ground temperatures pose new challenges for safe and sustainable mining operations. Among these challenges, coal and gas outburst dynamic hazards stand out as significant issues. Therefore, it is necessary to assess the impact of temperature variations on coal and gas outburst disaster prevention and control. To investigate this effect, we conducted an analysis based on outburst-triggering mechanisms and adsorption–desorption processes. Temperature was considered as the primary controlled variable, while gas expansion energy served as the criterion for assessing outburst hazards. Kilometer-deep coal samples were selected for measurement, focusing on indicators such as Langmuir adsorption constants (a,b), gas content (Q), gas pressure (P) and drilling cutting desorption indices (K1, Δh2). The results indicate that, under the same gas pressure, there is a slight decreasing trend in gas expansion energy with increasing temperature, although the overall change is minimal. Hence, the sole influence of temperature on the gas’s ability to perform work during outbursts is limited. Temperature exerts varying degrees of influence on gas parameters such as gas content and drill cutting desorption indices. The fluctuation amplitudes of these indicators range from large to small in the following order: Δh2 > ΔP > Q > K1 > P. Additionally, their correlation with gas expansion energy decreases in the following order: P > Q > Δh2 > K1 > ΔP. Thus, the influence of temperature on the indicators used in various prediction methods exhibits inconsistency, emphasizing the importance of considering temperature effects on predicted values. Gas pressure emerges as the optimal indicator for outburst determination, while gas content and drill cutting desorption indices are preferable as predictive indicators. These results will provide valuable references for the sustainable and safe development, risk assessment and prediction of deep coal mining.
1. Introduction
In the context of global energy transformation and the urgent need to achieve “carbon peaking and carbon neutrality” goals, China’s energy landscape has experienced profound changes in alignment with sustainable development principles [1]. In 2023, China’s raw coal production reached 4.71 billion tons, representing a 3.4% increase. Meanwhile, the fatality rate per million tons of coal mines stood at 0.094, marking a 23.7% increase compared to the previous year [2]. Projections from the Chinese Academy of Engineering indicate that China will still require an additional 4 billion tons of coal production capacity by 2030 [3]. Over the past five years, China has closed 5500 coal mines, resulting in a notable enhancement in the quality of coal supply. Concurrently, the scale of individual coal mines has escalated from an annual output of 350,000 tons to 1.1 million tons, with over 85% of coal consumption having largely achieved clean, efficient utilization and ultra-low emissions [4,5]. Despite the persistent robust demand for coal, shallow resources are progressively depleting, necessitating an increase in mining depth [6].
Approximately 53% of China’s proven coal resources lie at depths exceeding one kilometer, with approximately 30% of current coal production sourced from deep mining [7]. It is projected that 70% of the nation’s coal resources will necessitate deep mining in the future [8,9]. Deep coal mining primarily occurs within depth ranges of hundreds of meters to several kilometers underground, posing increasingly complex environmental conditions and demanding higher technological and equipment standards [10].
Deep mining faces multiple challenges including high temperatures, pressures, gas concentrations, and ground stresses, which not only elevate operational difficulty but also pose severe threats to worker safety [11]. To address these challenges, China has introduced the “Deep Earth” national science and technology strategy, which focuses on advanced research and development for coal resources located beyond extreme mining depths [12]. However, despite progress in research on deep coal mining, numerous challenges and issues persist. Key concerns include further improving mining efficiency and safety, reducing extraction costs, and achieving safe and efficient operations.
Coal exhibits adsorption and desorption characteristics, which are influenced by various factors, with temperature being a significant one [13]. Generally, adsorption is an exothermic process, while desorption is endothermic [14]. Therefore, temperature changes directly affect coal’s ability to adsorb and desorb gases such as methane. Research indicates that as temperature increases, the adsorption capacity of coal for gases such as methane weakens, resulting in reduced adsorption and accelerated desorption rates [15]. Elevated temperature decreases the viscosity of gas molecules, facilitating their escape from the coal surface [16]. Conversely, when temperature decreases, coal’s adsorption capacity for gases increases while desorption rates slow down [17]. This pattern holds universally in the adsorption–desorption processes of coal.
Moreover, temperature also affects the kinetics of coal adsorption–desorption processes. At different temperatures, both the adsorption–desorption rates and equilibrium adsorption capacities of coal vary [18]. The impact of temperature on gas parameters in deep coal seams varies. Studies show that under the same gas content conditions, increasing temperature leads to higher gas pressure; under the same gas pressure conditions, increasing temperature reduces gas content [5]. However, under the same gas pressure conditions, increasing temperature reduces gas adsorption capacity, which is a negative effect, while it increases gas desorption rates, which is a positive effect [5,13]. Therefore, certain indicators used for assessing the outburst risk of coal seams based on gas desorption may be subject to unpredictable influences. Parameters such as gas pressure, gas content, and drilling cutting desorption indices are all affected by temperature, thus their corresponding critical values for outburst will also change.
Therefore, it is necessary to study the variation law of prominent gas parameters under the influence of temperature, and investigate the stability of predictive indicators. Coal and gas outburst is a typical dynamic phenomenon of large-scale coal and gas ejection under the action of gas and stress [6,12]. The high-energy gas expansion released after coal exposure is the main driving force for coal and gas ejection, and the magnitude of its energy directly determines the size of the outburst [19]. This paper takes the release expansion energy of coal seam gas as the indicator to evaluate the magnitude of outburst hazard, evaluates the reliability and stability of various predictive indicators, and has certain guiding significance and engineering practice reference value for the determination and prediction of outburst hazards under deep high-temperature conditions.
2. Theory
2.1. Coal Seam Outburst Mechanism Model
The outburst process is characterized by the rapid release of energy in the pre-exposure stage of coal, with a substantial amount of highly pressurized compressed gas, predominantly methane, being released, directly influencing the outburst progression [15]. The gas volume responsible for the work carried out during the outburst process correlates with the gas pressure and gas content within the coal seam, with a certain association with the degree of coal fragmentation [20]. Following the rupture and exposure of the coal body containing high-pressure gas, the gas pressure decreases, leading to the rapid release of high-pressure free and adsorbed gas within the coal body [21]. After a reduction in gas pressure, adsorbed gas continues to desorb, releasing a large volume of gas into the mining space [22]. This process occurs very briefly, almost instantaneously, and is illustrated in Figure 1 depicting the outburst process and the dynamics of gas desorption. Despite a significant amount of gas continuing to be released after the coal body is ejected, its contribution to the outburst process is nearly negligible and can be disregarded.

Figure 1.
Schematic diagram of coal mass state during outburst process.
Consequently, the release of high-energy state gas pressure and gas volume during the outburst process should be considered as important parameters in the study of outburst mechanisms and prediction. Gas temperature determines the kinetic energy of gas molecules, with greater kinetic energy resulting in stronger diffusion capability [20,23]. Therefore, temperature directly influences the occurrence and development of outbursts, and the significant impact of high temperatures on the outburst risk and the accuracy of prediction indicators cannot be overlooked.
2.2. Basis of Outburst Dynamic Theory
From an energy perspective, the necessary condition for the occurrence of outbursts is to ensure that the energy of gas and the potential energy of the strata stress is greater than the energy required for coal fragmentation and movement [24], as shown by the following equation:
where W represents the gas expansion energy, kJ/t.
- Wt represents the elasticity energy of coal and rock, kJ/t.
- Wp represents the fragmentation energy of coal, kJ/t.
- Wy represents the movement energy of coal, kJ/t.
From the perspective of the development mechanism of outbursts, the elastic energy generated by the strata stress primarily acts on coal fragmentation, creating numerous fractures to provide pathways for gas release, serving as the triggering condition for outburst occurrence [25,26]. The internal energy of gas mainly contributes to further fragmentation and transportation of coal, serving as a prerequisite for the occurrence and development of outbursts [27,28]. Research indicates that the internal energy of gas exceeds the elastic energy of coal by one to two orders of magnitude [29]. Therefore, the internal energy of gas is the main energy source for outbursts. Combined with the energy equation, when the internal energy of gas exceeds the energy required for coal movement, coal gas flow is formed, leading to the destructive effects of outbursts. Hence,
Only high-energy state gas participates in outbursts [24,30]. From the perspective of coal transportation, the simplified equation for outbursts can be expressed as follows [24]:
where P0—the atmospheric pressure, Mpa;
- V0—the volume of gas involved in the outburst (under P0 condition), m3;
- T0—the ambient temperature, °C;
- γ—the adiabatic index, γ = 1.31;
- P—the gas pressure of the outburst coal seam, Mpa;
- L—the distance of movement of the center of gravity of the ejected coal, m;
- m—the mass of the ejected coal, t;
- g—the acceleration due to gravity, m/s2;
- β—the angle between the roadway and the horizontal plane, °;
- k—the friction coefficient.
According to the gas state equation (Equation (5)),
- n—the amount of substance of the gas, mol;
- R—the ideal gas constant, 8.314 J/(mol·K);
- T—the temperature of the coal seam, °C.
Then, Equation (3) can be represented as follows:
From the theoretical analysis above, it is evident that coal and gas outbursts occur due to the expansion of high-pressure gas within the coal body and the pressure of the gas, leading to the ejection of coal and gas streams. According to Equations (2) and (6), the magnitude of gas pressure and expansion energy play a direct role in predicting outbursts, making them preferable choices for critical value selection schemes. As the mining depth increases, strata stress, gas pressure, and stratum temperature all continuously rise, thereby increasing the risk of outbursts and amplifying the potential for outburst disasters [4]. Correspondingly, predictive indicators will also undergo responsive changes. From Equation (6), it is also apparent that, under certain coal seam gas pressure conditions, both the coal seam temperature and the underground atmospheric environment temperature have a close relationship with the energy magnitude during the outburst process. Therefore, it is necessary to study the influence of temperature and other factors on relevant parameters associated with outbursts.
3. Samples and Methods
3.1. Coal Seam Conditions
Zhuji East Mine is located in Panji District, Huainan, Anhui Province, with surface elevation ranging from +22.4 to +23.4 m. The mining area is a fully concealed coal-bearing region, predominantly comprising coal-bearing strata from the Carboniferous and Permian periods. The total thickness of the coal seam is 28.58 m, encompassing 28 individual coal seams. Among them, Coal Seam 11 is situated at elevations ranging from −350 to −1000 m, with an average thickness of 1.32 m and gas content varying from 0 to 13.50 m3/t, posing a risk of outbursts. Coal Seam 11 is classified as gas coal, with a moisture content of 1.49%, ash content of 9.5%, and volatile matter content of 32.57%. The majority of Coal Seam 11 is distributed between −920 and −940 m, with an average stratum temperature of 43.7 °C, categorized as a secondary high-temperature zone, necessitating active cooling measures. High temperatures not only pose significant risks to occupational health but also have implications for gas disaster prevention and control. Fresh coal samples are selected from underground working faces, screened into different particle sizes, and sealed for experimental testing.
3.2. Testing
As temperature primarily affects coal in terms of gas adsorption and desorption, referencing the current “Regulations for the Prevention and Control of Coal and Gas Outbursts” [14], the main indicators used for outburst identification and prediction are selected for investigation in this study. These indicators include coal adsorption constants (a, b values), gas content (Q), gas pressure (P), drilling cuttings desorption indices (K1 and Δh2), initial gas emission velocity (ΔP), and gas expansion energy index (Wp) [24,31]. Considering the actual temperature fluctuation range underground, experimental temperatures are selected within the range of 10–50 °C, with a temperature gradient of 10 °C. The adsorption constants a and b values are calculated based on Langmuir adsorption theory under the condition of a limit adsorption pressure of 10.0 MPa at different high temperatures after adsorption equilibrium experiments. The desorption index of gas is measured using an MD-2-type gas desorption instrument. The K1 index of drill cuttings refers to the gas desorption rate curve of 1–3 mm coal particles exposed for a certain period (5 min), with units of cm3·g−1·min−0.5. The Δh2 index represents the pressure formed in a closed space by the gas desorption volume of 10 g of coal particles with a diameter of 1–3 mm at the third minute, with units in Pa. The initial gas emission rate (∆P) refers to the pressure difference formed in a 28 cm3 space by the gas released during the 45–60 s and 0–10 s time intervals after equilibrium adsorption of gas by coal particles with a diameter of 0.2–0.25 mm under atmospheric pressure, represented by the height of a mercury column in units of mmHg. The measuring instrument model is WFC-2. The gas content value is the amount of gas adsorbed in coal under different temperature conditions at an adsorption equilibrium pressure of 1.0 MPa, with units in cm3·g−1. The gas expansion energy shows a good linear relationship with gas pressure; thus, the slope of the linear curve, denoted as W1, reflects the magnitude of the prominent danger, with units in mJ·g−1. The values of each predictive index are obtained through testing under laboratory conditions at temperatures ranging from 10 to 50 °C, followed by analysis and research.
4. Analysis and Discussion of Results
4.1. Data Analysis of Gas Parameters Affected by Temperature
The measured values of various gas parameter indicators at different temperatures obtained through experiments are presented in Table 1. From the experimental results, it is evident that each gas parameter is influenced by temperature variation, exhibiting different trends. The impact of temperature on various prediction index parameters varies due to differences in measurement methods and tested physical quantities. Therefore, it is difficult to provide a unified explanation. Below, detailed explanations are provided for the influence of temperature on each prediction index.

Table 1.
Measured values of various gas parameter indicators at different temperatures.
The adsorption constant a value represents the maximum adsorption capacity of coal particles, also understood as the maximum adsorption content, with temperature-induced changes reflected in the b value. From the experimental results, it is observed that with increasing temperature, both a and b values decrease, showing a good power function relationship with temperature, as shown in Figure 2. The influence of temperature on the b value is significant, resulting in a 46% decrease, while the a value decreases by 25%. The impact of temperature is primarily manifested in the variation in the b value, while the effect on the a value is relatively minor. The a value represents the limit adsorption capacity, and with increasing temperature, the activation energy of gas molecules increases, making it easier for them to escape the action of coal molecules, thereby reducing the limit adsorption capacity [32]. The b value indicates the rate of gas adsorption by the coal sample and serves as the slope of the initial segment of the isothermal adsorption curve [27]. A higher b value indicates a faster rate of curve ascent. b is related to the characteristics of the adsorbent, adsorbate, and temperature, and its numerical value is the reciprocal of the Langmuir pressure. Its physical significance is the pressure corresponding to half the Langmuir volume when coal adsorbs methane. As temperature increases, the b value decreases, indicating a smaller corresponding pressure and faster attainment of equilibrium adsorption.

Figure 2.
Graph showing the variation in coal adsorption constant a value (a) and b value (b) with temperature.
The drilling cutting desorption indices involve selecting coal particles with a diameter of 1–3 mm, subjecting them to a specific pressure for adsorption equilibrium, and then exposing them to atmospheric pressure conditions to measure the pressure generated by the gas desorption rate or desorbed gas volume over a certain period starting from the initial measurement time t0 [22]. Among these indices, K1 represents the slope of the gas desorption curve measured within 5 min after exposure for 1 min, with units of cm3·g−1·min−0.5, while Δh2 represents the pressure difference produced by the gas released during the 2 min of gas desorption after exposure for 3 min, with units of Pa [31]. From the experimental test results (Figure 3), it is evident that the increase in temperature accelerates the desorption rate, resulting in an increase in drilling cutting desorption indices. In high-temperature environments, the amount of gas desorbed significantly increases, leading to a linear increase in the desorption indices. Therefore, under the same adsorption equilibrium pressure, the predicted values obtained under high-temperature conditions will be larger.

Figure 3.
Graph of drill cutting desorption index variation with temperature.
The initial gas release velocity is measured as the difference between the gas release volume from coal after 45–60 s of gas adsorption and the gas release volume within 0–10 s under atmospheric pressure conditions, expressed in millimeters of mercury column [33]. It represents the rate of gas release from coal.
From the experimental results, it is evident that ΔP exhibits a trend of initially increasing and then decreasing with temperature (Figure 4). Since the adsorption pressure of coal particles is relatively low, being at atmospheric pressure, it directly relates to the difference in gas release volume at different time intervals and is related to both gas adsorption and desorption quantities. Under low-temperature conditions, although the adsorption quantity is high, the desorption pressure difference is small due to the pressure being at atmospheric levels, resulting in a small desorption volume and consequently a small pressure difference. Conversely, under high-temperature conditions, the desorption rate is high, with a large amount of gas being rapidly released within the first 10 s. However, the adsorption quantity decreases, leading to insufficient desorption volume in the later stages and thus a smaller pressure difference. Therefore, there exists an optimal temperature point where both the adsorption and desorption quantities are maximized. The relationship between the measured values and temperature conforms to a parabolic shape opening downwards.

Figure 4.
Graph of the relationship between initial gas desorption velocity of coal and temperature.
Gas content, as a fundamental parameter of coal seam gas, has been widely utilized in recent years for outburst identification and prediction tasks [34]. Similar to the influence of temperature on the adsorption constant a value, high temperatures inhibit adsorption. Under the same adsorption equilibrium pressure (1.0 MPa), the gas content decreases by 34.40% (Figure 5). It is evident that if the outburst critical value is fixed based on gas pressure, significant variations in gas content may lead to considerable predictive errors.
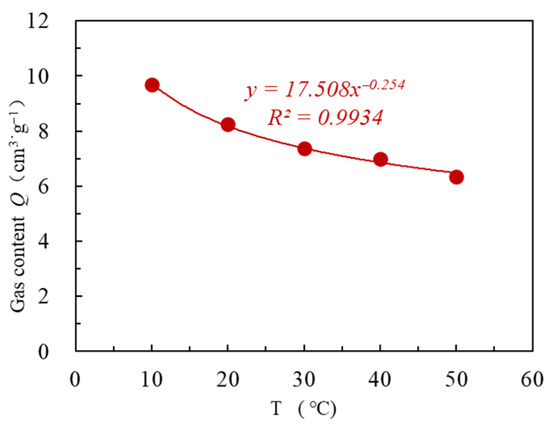
Figure 5.
Graph of the relationship between methane content and temperature.
Under conditions of adsorption equilibrium pressure at 1.0 MPa, the data for gas expansion energy remained relatively stable (Figure 6), exhibiting a slight decreasing trend, with a variation of 4.93% observed between the measurements at the lowest and highest temperature points. The increase in temperature led to an increase in the desorption rate, but it also resulted in a decrease in the total amount of gas adsorbed by the coal mass. Consequently, the overall gas volume involved in a high-pressure release after coal exposure slightly decreased, leading to a slight reduction in the overall gas expansion energy. From the perspective of gas expansion energy, it can be inferred that high-temperature conditions have a relatively minor impact on outbursts. Under the same pressure, high temperatures slightly reduce the risk of outbursts, but they have a more significant influence on related gas parameter indicators.
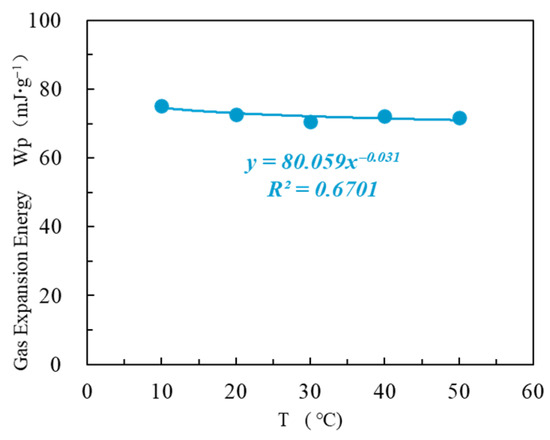
Figure 6.
Relationship between gas expansion energy and temperature.
4.2. Discussion
The measurement results indicate that temperature has a significant impact on the predictive outcomes. There are contradictory trends and conclusions regarding the influence of different gas parameters under varying temperatures. Therefore, it is necessary to investigate the effects of different temperatures on predictive indicators and the variation in critical values. The key issue is how to determine the risk of outbursts and the magnitude of critical values.
From the perspective of the mechanism and development process of coal and gas outbursts, the main sources of energy triggering and ejecting coal mass are the elastic energy of the surrounding rock mass and the gas expansion energy [24]. Among them, gas expansion energy is the primary driving force behind the occurrence of outbursts, playing a crucial role in the ejection of coal mass and the gas dynamic phenomenon [35]. Numerous studies have shown that outbursts occur when coal mass fractures under the combined action of ground stress and gas, and then, propelled by gas expansion energy, form a coal–gas flow ejected into the underground working space [11,19]. From the perspective of energy conservation, the energy required to eject a unit mass of coal is determined, making the size of gas expansion energy crucial in determining the occurrence and scale of outbursts [29]. In recent years, research on gas expansion energy has garnered significant attention, with the proposal and use of critical values providing new insights for related studies [7,36]. By measuring the initial expansion energy of released gas (IEERG) of high-energy states and combining it with extensive experimental research, a critical value for outbursts of 42.98 mJ/g has been determined [24]. Previous studies have shown that due to the good linear relationship between gas pressure and expansion energy, specific critical gas pressures can be derived at particular temperatures [19]. Subsequently, predictive indicator values obtained under critical gas pressure conditions can be regarded as critical values for evaluating the occurrence of outbursts (Figure 7). Based on this condition, corresponding critical values for gas parameters obtained from gas parameter measurements are shown in Table 2. It can be observed that the values of various gas outburst parameters exhibit different changes. Among them, the gas pressure values show minimal variation, while others show varying degrees of decrease and increase.
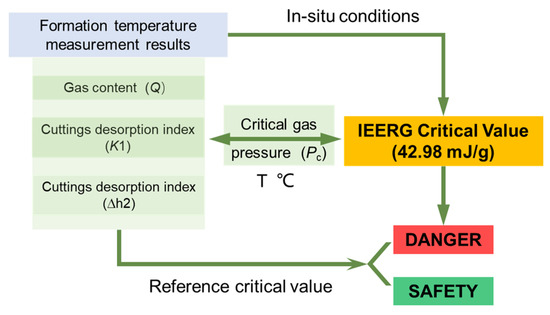
Figure 7.
Flowchart of critical value calculation process for various prediction indicators.
Table 2.
Corresponding critical values of gas outburst risk prediction under critical conditions based on expansion energy.
Therefore, to assess the fluctuation magnitude of gas outburst parameter critical values under the influence of temperature, and to judge the stability and sensitivity of the data results based on the characteristic impact of temperature on the measured results, we employ data deviation (Equation (7)) and Pearson correlation (Equation (8)) as comprehensive evaluation indicators. Coal deviation is the deviation relative to the mean value of the parameters, and cumulative deviation is the sum of the absolute values of each deviation. The results are shown in Table 3. From the results, it can be observed that the trend of cumulative deviation from smallest to largest is P < K1 < Q < ΔP < Δh2. At the critical state of outburst, the fluctuation in gas pressure value is minimal, indicating that gas pressure and its critical value have a better advantage in determining outburst risk. However, due to the longer measurement period for gas pressure, research on rapid gas pressure measurement or inversion methods will be beneficial for outburst prediction.
where
Table 3.
Deviation of gas parameters from their mean values under different temperature conditions.
- N represents the number of data points;
- denotes the i-th data point;
- signifies the mean of the data;
- represents the deviation of the data.
The cumulative deviation is calculated as the absolute deviation using the following equation: .
The Pearson correlation coefficient between two sets of data can be computed using the following formula:
The formula consists of , which represent the means of the two sets of data, respectively.
The cumulative deviation reflects the variation within the data itself, while the Pearson correlation coefficient always ranges from −1 to 1, with the numerical result indicating the relationship between the two variables, as shown in Table 4. A positive value suggests a positive correlation between the two variables, a negative value indicates a negative correlation, and a value of zero implies no correlation, suggesting the possibility of a more complex relationship. The absolute value of the Pearson correlation coefficient ranges from 1.0 with intervals of 0.2, representing extremely strong, strong, moderate, weak, and extremely weak correlations, respectively. From the data results, the correlation between gas pressure and expansion energy is the strongest, followed by P > Q > Δh2 > K1 > ΔP, with the gas desorption initial velocity showing the weakest correlation with expansion energy, indicating a weak correlation (Table 5).
Table 4.
Evaluation reference table of Pearson correlation value.
Table 5.
The correlation between critical values of various outburst prediction parameters and dilatancy energy.
Therefore, based on the measurement data, the expansion energy is not significantly affected by temperature, with a slight trend of decrease. The deviation in expansion energy under the highest and lowest temperature conditions is within 5%. Gas pressure has the closest correlation with expansion energy, making it the optimal indicator for evaluating the risk of outbursts on-site. Additionally, the drill cutting desorption index K1 is not significantly affected by temperature fluctuations, and gas content also has a strong correlation with expansion energy. Therefore, considering the practical application on-site as well as the sensitivity and correlation of various parameters, the drill cutting desorption index K1 value and gas content index Q are the optimal indicators for predicting the risk of outbursts. The results of relevant experimental research still need to be tested and verified in the field of engineering practice, and future research must be carried out.
5. Conclusions
This article focuses on the issue of predicting the risk of coal and gas outburst under the influence of high geothermal temperatures encountered during the sustainable development of deep coal mining. It selects and studies the variation patterns of relevant outburst risk prediction methods influenced by temperature. Based on the expansion energy as the criterion for judging the degree of outstanding risk, the stability and outstanding correlation of the critical values of various parameters were compared and analyzed. The main conclusions are as follows:
- (1)
- Temperature directly affects the adsorption and desorption process of coal, thereby influencing the measurement results of relevant parameters for predicting the risk of outbursts. Under the same adsorption equilibrium pressure, the influence of temperature on gas expansion energy is relatively small, with a deviation of 4.9% under the maximum and minimum temperature conditions. This indicates that the outburst process is not significantly affected by temperature alone, while relevant outburst gas prediction parameters are affected to varying degrees, which in turn affects the accuracy and critical values of predictions.
- (2)
- The correlation between various gas parameters and expansion energy is ranked from highest to lowest as follows: P > Q > Δh2 > K1 > ΔP. Gas pressure is less affected by temperature among many gas outburst prediction parameters, and has the strongest correlation with expansion energy, making it the preferred indicator for identifying the risk of outburst. The performance of gas content and gas desorption indicators is ranked second in terms of correlation and numerical stability with expansion energy, but have certain advantages compared to gas pressure testing, allowing for rapid measurement. Therefore, they can be used as preferred indicators in outburst risk prediction.
Author Contributions
Conceptualization, J.Z. (Juan Zheng) and D.Y. (Dingding Yang); methodology, D.Y. (Duoduo Yang) and S.W.; software, S.W.; formal analysis, Y.X. and Y.F.; investigation, D.Y. (Dingding Yang) and J.Z. (Juan Zheng); resources, K.W. and S.C.; data curation, D.Y. (Duoduo Yang); original draft preparation, D.Y. (Duoduo Yang) and J.Z. (Jinqian Zeng); writing—review and editing, D.Y. (Duoduo Yang); visualization, S.W.; supervision of funding acquisition, D.Y. (Dingding Yang). All authors have read and agreed to the published version of the manuscript.
Funding
This work was supported by the National College Students’ Innovation and Entrepreneurship Training Program (202110340019) and Zhejiang Provincial Natural Science Foundation of China (Grant No. LQ20E040004).
Institutional Review Board Statement
Not applicable.
Informed Consent Statement
Not applicable.
Data Availability Statement
The data presented in this study are available on request from the corresponding author.
Conflicts of Interest
Authors Kangming Wang and Si Chen were employed by the company Huaihe Energy Holding Group Co., Ltd. The remaining authors declare that the research was conducted in the absence of any commercial or financial re-lationships that could be construed as a potential conflict of interest.
References
- Wang, F.; Cao, J.; Zhang, Y.; Aviso, K.B.; Tan, R.R.; Li, Z.; Jia, X. Safety risk assessment of the large-scale carbon capture, utilization, and storage demonstration project in Dongying, China. J. Clean. Prod. 2023, 414, 137699. [Google Scholar] [CrossRef]
- Qiao, Y.; Wang, G. Recent Status of Production, Administration Policies, and Low-Carbon Technology Development of China’s Steel Industry. Metals 2024, 14, 480. [Google Scholar] [CrossRef]
- Zhang, C.; Wang, E.; Li, B.; Kong, X.; Xu, J.; Peng, S.; Chen, Y. Laboratory experiments of CO2-enhanced coalbed methane recovery considering CO2 sequestration in a coal seam. Energy 2023, 262, 125473. [Google Scholar] [CrossRef]
- Fang, S.; Zhu, H.; Yang, D.; Yu, J.; Wang, J.; Hu, L. Microscopic investigation of the effect of uniaxial stress on the structure of pore-fissure system and methane adsorption in lean coal. Energy 2024, 288, 129837. [Google Scholar] [CrossRef]
- Yang, D.; Peng, K.; Zheng, Y.; Chen, Y.; Zheng, J.; Wang, M.; Chen, S. Study on the characteristics of coal and gas outburst hazard under the influence of high formation temperature in deep mines. Energy 2023, 268, 126645. [Google Scholar] [CrossRef]
- Zhang, M.; Cao, X.; Li, B.; Zhou, A. Quantitative study on the role of desorption gas on coal-gas outbursts: Energy contribution and dynamic characteristics. Process Saf. Environ. Prot. 2023, 171, 437–446. [Google Scholar] [CrossRef]
- Wang, C.; Cheng, Y. Role of coal deformation energy in coal and gas outburst: A review. Fuel 2023, 332, 126019. [Google Scholar] [CrossRef]
- Lu, S.; Li, M.; Ma, Y.; Wang, S.; Zhao, W. Permeability changes in mining-damaged coal: A review of mathematical models. J. Nat. Gas Sci. Eng. 2022, 106, 104739. [Google Scholar] [CrossRef]
- Yuan, L. Strategic thinking of simultaneous exploitation of coal and gas in deep mining. J. China Coal Soc. 2016, 41, 1–6. [Google Scholar] [CrossRef]
- Lyu, J.; Li, S.; Pan, Y.; Tang, Z. Promoting Sustainable Coal Mining: Investigating Multifractal Characteristics of Induced Charge Signals in Coal Damage and Failure Process. Sustainability 2024, 16, 3127. [Google Scholar] [CrossRef]
- Lei, Y.; Cheng, Y.; Wang, L.; Ren, T.; Tu, Q. Mechanisms of Coal and Gas Outburst Experiments: Implications for the Energy Principle of Natural Outbursts. Rock Mech. Rock Eng. 2022, 56, 363–377. [Google Scholar] [CrossRef]
- Zhang, X.; Tang, J.; Pan, Y.; Yu, H. Experimental study on intensity and energy evolution of deep coal and gas outburst. Fuel 2022, 324, 124484. [Google Scholar] [CrossRef]
- Zhu, C.-j.; Ren, J.; Wan, J.; Lin, B.-q.; Yang, K.; Li, Y. Methane adsorption on coals with different coal rank under elevated temperature and pressure. Fuel 2019, 254, 115686. [Google Scholar] [CrossRef]
- Wang, W.; Wang, H.; Zhang, B.; Wang, S.; Xing, W. Coal and gas outburst prediction model based on extension theory and its application. Process Saf. Environ. Prot. 2021, 154, 329–337. [Google Scholar] [CrossRef]
- Wang, K.; Ren, H.; Wang, Z.; Wei, J. Temperature-pressure coupling effect on gas desorption characteristics in coal during low-variable temperature process. J. Pet. Sci. Eng. 2022, 211, 110104. [Google Scholar] [CrossRef]
- Li, X.; Wang, C.; Chen, Y.; Li, H. Influence of temperature on gas desorption characterization in the whole process from coals and its application analysis on outburst risk prediction. Fuel 2022, 321, 124021. [Google Scholar] [CrossRef]
- Guo, L.; Yu, Q.; Jiang, C.; Wang, K. Testing Study on the variation of coal temperature during the process of coal and gas outburst. Chin. J. Rock Mech. Eng. 2005, 19, 366–368. [Google Scholar]
- An, F.; Jia, H.; Yao, F. Effect of stress, concentration and temperature on gas diffusion coefficient of coal measured through a direct method and its model application. Fuel 2022, 312, 122991. [Google Scholar] [CrossRef]
- Yang, D.; Chen, Y.; Tang, J.; Li, X.; Jiang, C.; Wang, C.; Zhang, C. Experimental research into the relationship between initial gas release and coal-gas outbursts. J. Nat. Gas Sci. Eng. 2018, 50, 157–165. [Google Scholar] [CrossRef]
- Xu, J.; Cheng, L.; Zhou, B.; Peng, S.; Yang, X.; Yang, W. Experimental study of gas concentration and its thermal behavior in coal and gas outburst. Arab. J. Geosci. 2021, 14, 1935. [Google Scholar] [CrossRef]
- Zhang, C.; Wang, Y.; Wang, E.; Zhou, X.; Wang, P.; Zeng, W. Influence of coal seam gas pressure on the propagation mechanism of outburst two-phase flow in visual roadway. Fuel 2022, 322, 124296. [Google Scholar] [CrossRef]
- Wang, L.; Lu, Z.; Chen, D.-P.; Liu, Q.-Q.; Chu, P.; Shu, L.-Y.; Ullah, B.; Wen, Z.-J. Safe strategy for coal and gas outburst prevention in deep-and-thick coal seams using a soft rock protective layer mining. Saf. Sci. 2020, 129, 104800. [Google Scholar] [CrossRef]
- Xu, L.; Jiang, C. Initial desorption characterization of methane and carbon dioxide in coal and its influence on coal and gas outburst risk. Fuel 2017, 203, 700–706. [Google Scholar] [CrossRef]
- Jiang, C.; Xu, L.; Li, X.; Tang, J.; Chen, Y.; Tian, S.; Liu, H. Identification Model and Indicator of Outburst-Prone Coal Seams. Rock Mech. Rock Eng. 2014, 48, 409–415. [Google Scholar] [CrossRef]
- He, M. Conception system and evalutation indexes for deep engineering. Chin. J. Rock Mech. Eng. 2005, 24, 2854–2858. [Google Scholar]
- Yin, S.; Li, Z.; Wang, E.; Niu, Y.; Tian, H.; Li, X.; Li, H.; Yang, C. The infrared thermal effect of coal failure with different impact types and its relationship with bursting liability. Infrared Phys. Technol. 2024, 138, 105263. [Google Scholar] [CrossRef]
- Zhao, W.; Cheng, Y.; Jiang, H.; Wang, H.; Li, W. Modeling and experiments for transient diffusion coefficients in the desorption of methane through coal powders. Int. J. Heat Mass Transf. 2017, 110, 845–854. [Google Scholar] [CrossRef]
- Wang, G.; Ren, T.; Qi, Q.; Lin, J.; Liu, Q.; Zhang, J. Determining the diffusion coefficient of gas diffusion in coal: Development of numerical solution. Fuel 2017, 196, 47–58. [Google Scholar] [CrossRef]
- Shu, L.; Wang, K.; Liu, Z.; Zhao, W.; Zhu, N.; Lei, Y. A novel physical model of coal and gas outbursts mechanism: Insights into the process and initiation criterion of outbursts. Fuel 2022, 323, 124305. [Google Scholar] [CrossRef]
- Chen, Y.; Yang, D.; Tang, J.; Li, X.; Jiang, C. Determination method of initial gas desorption law of coal based on flow characteristics of convergent nozzle. J. Loss Prev. Process Ind. 2018, 54, 222–228. [Google Scholar] [CrossRef]
- SACMS. Rules for the Prevention and Control of Coal and Gas Outburst; Coal Industry Press: Beijing, China, 2019. [Google Scholar]
- Zhao, H.; Wu, T.; Firoozabadi, A. High pressure sorption of various hydrocarbons and carbon dioxide in Kimmeridge Blackstone and isolated kerogen. Fuel 2018, 224, 412–423. [Google Scholar] [CrossRef]
- Tang, J.; Jiang, C.; Chen, Y.; Li, X.; Wang, G.; Yang, D. Line prediction technology for forecasting coal and gas outbursts during coal roadway tunneling. J. Nat. Gas Sci. Eng. 2016, 34, 412–418. [Google Scholar] [CrossRef]
- CICT. Determine Method of Methane Adsorption Capacity in Coal; Ministry of Coal Industry of the People’s Republic of China: Beijing, China, 1998. [Google Scholar]
- Lama, R.D.; Bodziony, J. Management of outburst in underground coal minies. Int. J. Coal Geol. 1998, 35, 83–115. [Google Scholar] [CrossRef]
- Wang, C.; Xu, X.; Zhang, Y.; Arif, M.; Wang, Q.; Iglauer, S. Experimental and numerical investigation on the dynamic damage behavior of gas-bearing coal. Geomech. Geophys. Geo-Energy Geo-Resour. 2022, 8, 49. [Google Scholar] [CrossRef]
Disclaimer/Publisher’s Note: The statements, opinions and data contained in all publications are solely those of the individual author(s) and contributor(s) and not of MDPI and/or the editor(s). MDPI and/or the editor(s) disclaim responsibility for any injury to people or property resulting from any ideas, methods, instructions or products referred to in the content. |
© 2024 by the authors. Licensee MDPI, Basel, Switzerland. This article is an open access article distributed under the terms and conditions of the Creative Commons Attribution (CC BY) license (https://creativecommons.org/licenses/by/4.0/).