Abstract
The significance of sustainable mobility transition projects extends beyond borders. Transportation, particularly passenger vehicles, is a crucial sector in achieving sustainability. Therefore, prioritizing sustainable green mobility has led to the inclusion of alternative solutions, with a focus on accelerating the shift towards electric vehicle (EV) technologies and implementing a ban on the sale of new petrol and diesel cars in all European countries by 2035. Italy has been making progress in this area as the country seeks to address environmental concerns, reduce emissions, and promote sustainable transportation. However, compared to other European countries in 2024, Italy still has a long way to go to achieve a sustainable market share. In this regard, this article aims to address several questions related to the promotion and scaling up of the electric mobility transition project in Italy, taking into account the current situation. Specifically, it seeks to identify internal and external factors associated with this technology ecosystem, along with their relative importance. To conduct this study, a strengths, weaknesses, opportunities, and threats (SWOT) analysis was conducted to identify the factors, which was followed by the analytical hierarchy process (AHP) methodology to determine their priority and importance. A total of 8 internal factors and 14 external factors were analyzed, and their overall priority was determined. This study reveals that it is crucial to capitalize on the opportunities and strengths related to technology ecosystems while effectively mitigating the threats and technological limitations in order to scale up technology adoption. In particular, strengths S1 and S3 were given the highest overall priority scores, suggesting that they are the most important factors to leverage for the successful adoption of the technology. These prioritized factors and subfactors are crucial for expediting the transition process and can influence consumers’ decisions. However, without a substantial increase in consumer understanding and knowledge of these technologies, public education campaigns will be necessary. The significance of this study is paramount, and its results can contribute to the continuous enhancement in the formulation of practical plans and regulations to promote sustainable transportation, taking into account the identified factors.
1. Introduction
The transportation sector within the European Union (EU) is a considerable contributor to greenhouse gas emissions. To meet the target of achieving climate neutrality and sustainable development goals by 2030, the sector should undergo electrification, and electric vehicle (EV) technologies present a promising solution. These vehicles have several advantages over traditional internal combustion engine vehicles (ICEVs) [1].
Certainly, there are unique characteristics to consider for different types of electric technology. For instance, pure electric vehicles (EVs), also called Battery Electric Vehicles (BEVs), Hybrid Electric Vehicles (HEVs), Plug-in Hybrid Electric Vehicles (PHEVs), and Fuel Cell Electric Vehicles (FCEVs), each have their own advantages and disadvantages compared to ICEVs, also known as conventional vehicles (CVs). Electric vehicle technologies are eco-friendly as they produce no/lower exhaust emissions, contribute to cleaner air, and are cost-effective in the long run due to their lower total cost of ownership (TCO) and reduced maintenance needs compared to CVs [2]. The advantages and disadvantages of each type of technology are described as follows:
- BEVs operate solely on electricity, offering the advantage of zero tailpipe emissions and superior energy efficiency compared to CVs. They typically have lower total operating costs due to cheaper electricity rates and reduced maintenance needs, as they have fewer moving parts than CVs. However, range anxiety remains a concern for many potential buyers, although advancements in battery technology are continuously extending the driving range (e.g., BMW i4, around 600 km). While charging times can be longer compared to refueling a gasoline car, the growing network of fast-charging stations is mitigating this issue. Overall, BEVs represent a significant step towards sustainable transportation, providing an environmentally friendly alternative with ongoing improvements in technology and infrastructure [3,4].
- HEVs integrate a conventional internal combustion engine (ICE) with an electric propulsion system, with the goal of improving fuel efficiency and reducing emissions compared to CVs (e.g., Peugeot 508 RXH HYbrid4, electric range around 70 km). By utilizing regenerative braking and the electric motor during low-speed driving, HEVs can significantly reduce fuel consumption and emissions. However, this dual powertrain system adds complexity and potential maintenance challenges. The initial purchase cost is typically higher than that of traditional ICE vehicles due to the advanced technology and additional components involved. Despite these drawbacks, HEVs offer a practical compromise for consumers seeking better fuel economy and lower environmental impact without the range limitations associated with BEVs. Unlike BEVs, HEVs do not require plugging in, making them a potentially attractive permanent solution if targeted marketing strategies and buying or retrofitting policies are implemented as soon as possible to accelerate the transition project [3,4].
- PHEVs offer the advantage of operating on both electric power and gasoline, allowing drivers to enjoy the benefits of electric driving while maintaining the extended range provided by a gasoline engine (e.g., Mercedes-Benz GLE 350 de PHEV, electric range around 100 km). Unlike HEVs, PHEVs can be charged externally, allowing for a significant portion of daily driving to be carried out on electricity alone. This decreases fuel usage and harmful emissions. Nevertheless, they come with higher upfront purchase costs due to larger batteries and more complex systems. Furthermore, PHEVs require access to charging infrastructure, which can be a limitation in regions with fewer charging stations. In spite of these challenges, PHEVs offer a flexible solution for those looking to minimize their carbon footprint without compromising range and convenience [3,4].
- FCEVs use hydrogen to generate electricity through a chemical process involving a fuel cell, providing a clean and efficient alternative to CVs (e.g., Toyota Mirai, electric range around 650 km). FCEVs offer the advantage of zero tailpipe emissions, thus contributing significantly to reducing CO2 emissions. They also provide a driving range comparable to CVs and can be refueled in a matter of minutes, addressing the range anxiety and long charging times associated with BEVs [5]. However, the adoption of FCEVs is currently hindered by the limited availability of hydrogen refueling infrastructure and the high costs associated with producing and storing hydrogen. Additionally, the technology and production processes for FCEVs are still in the early stages of development, making these vehicles more expensive than other options. Despite these challenges, FCEVs hold promise for the future of sustainable transportation, particularly in applications requiring longer ranges and faster refueling times. Undeniably, these new energy technologies possess immense potential for promoting a sustainable future for transportation. The adoption of these technologies will lead to a decrease in the reliance on fossil fuels and an increase in the utilization of environmentally friendly alternatives, while also ensuring a sustainable and responsible production and charging process.
Currently, the electric market share is steadily growing across European countries. In January 2024, BEVs accounted for a 10.9% share of the market, an increase from 9.5% in January 2023. Furthermore, HEVs captured nearly 30% of the market, reinforcing their position as the second most preferred option among vehicle buyers in the EU. In contrast, the market share of petrol and diesel cars dropped to almost 50% in January 2024, down from 54% the previous year [6].
Nevertheless, the transition process and market share of sustainable mobility vary across countries. It can change rapidly, owing to shifts in government policies, citizen preferences, and technological advancements. Furthermore, different countries may have varying adoption rates owing to factors such as infrastructure development, financial incentives, and local regulations. In contrast to other European nations, Italy’s sales of electric technology for automobiles appear to be lagging, indicating a less rapid progression towards electrification.
The aim of this research is to investigate the current situation of the electric sustainable passenger vehicle market in Italy, as well as to understand the circumstances and identify the factors that influence project success. In this regard, the present article aims to address several questions related to the promotion and scaling up of electric technology transition projects. Specifically, it seeks to identify the strengths, weaknesses, opportunities, and threats associated with these projects, as well as their relative importance. To achieve this, strengths–weaknesses–opportunities–threats (SWOT) analysis and the analytical hierarchy process (AHP) were utilized as decision-making tools. The methodology used in this study is illustrated in Figure 1.

Figure 1.
Methodology adopted in this study (authors’ elaboration).
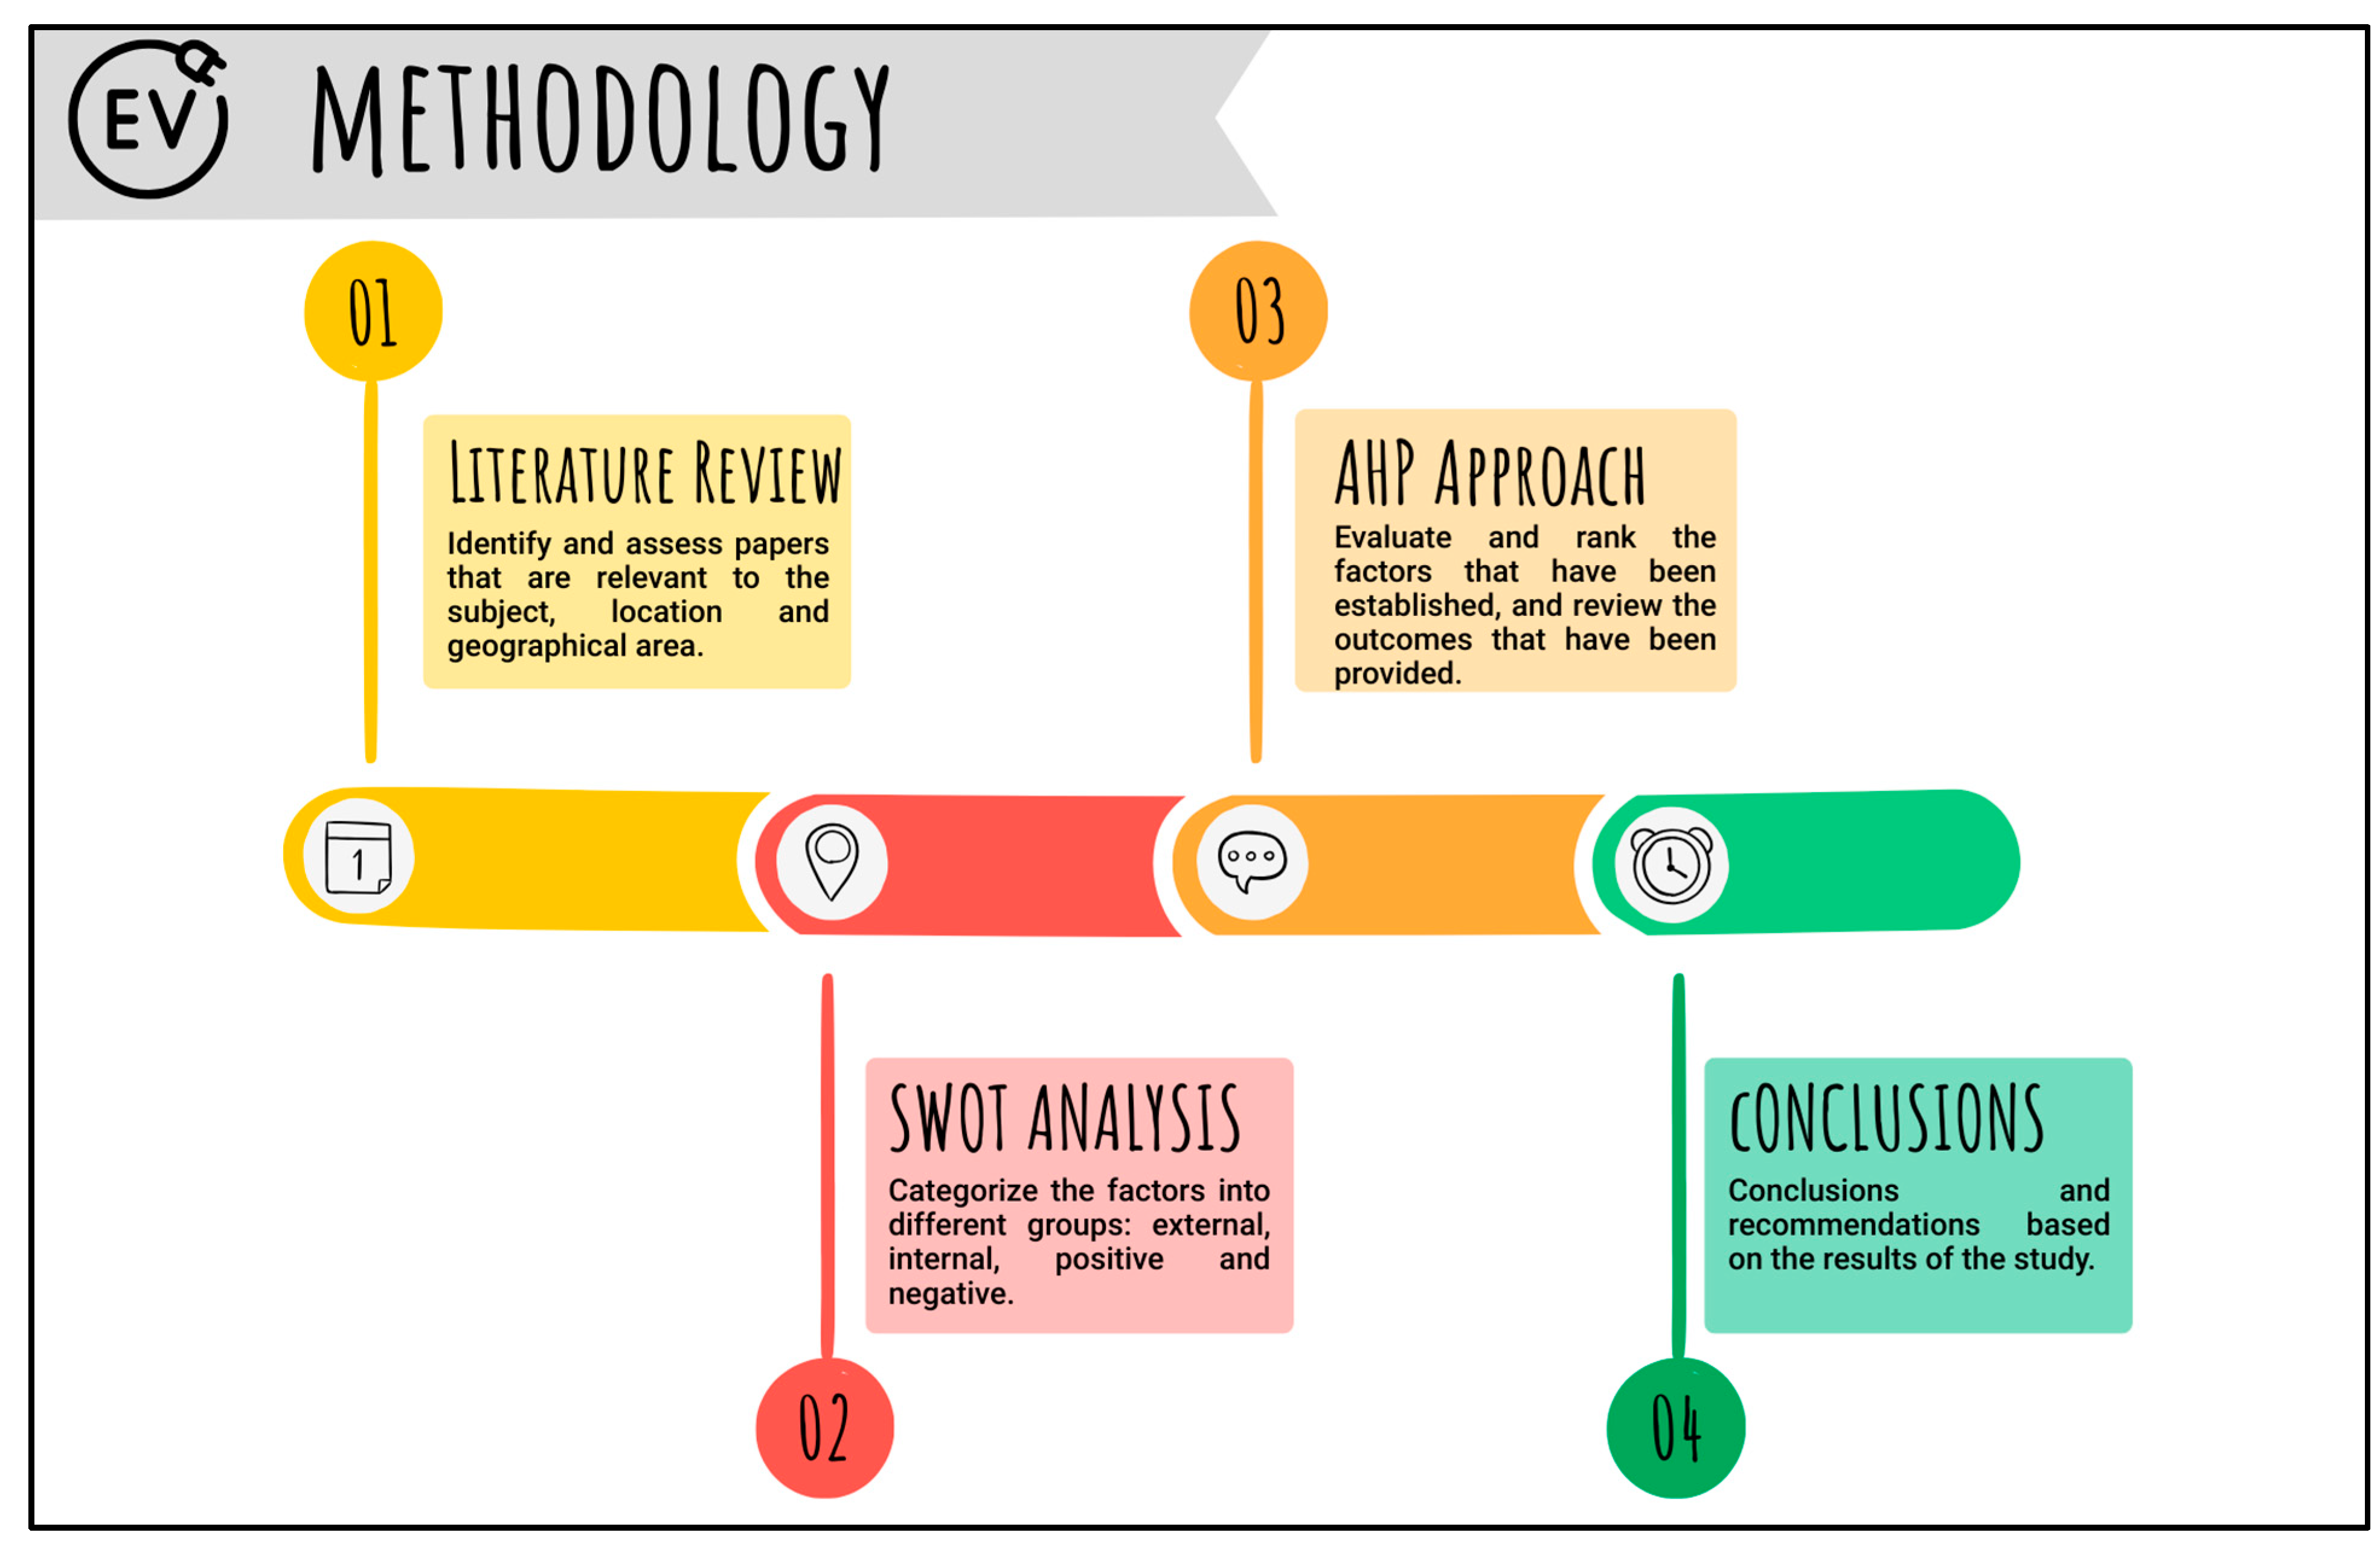
The structure of this paper is as follows: Section 2, “Literature review”, provides a comprehensive review of recent research on the topic. In Section 3, “SWOT analysis: Barriers and opportunities”, a detailed SWOT analysis is presented, highlighting the challenges and potential associated with the topic. Section 4, “AHP approach”, involves evaluating and ranking the factors that have been identified and reviewing the outcomes that have been provided. Finally, Section 5, “Conclusions”, presents the conclusions drawn from the study based on the findings. A detailed explanation of each part is provided in the following sections.
2. Review
2.1. Closer Look at the Current Situation
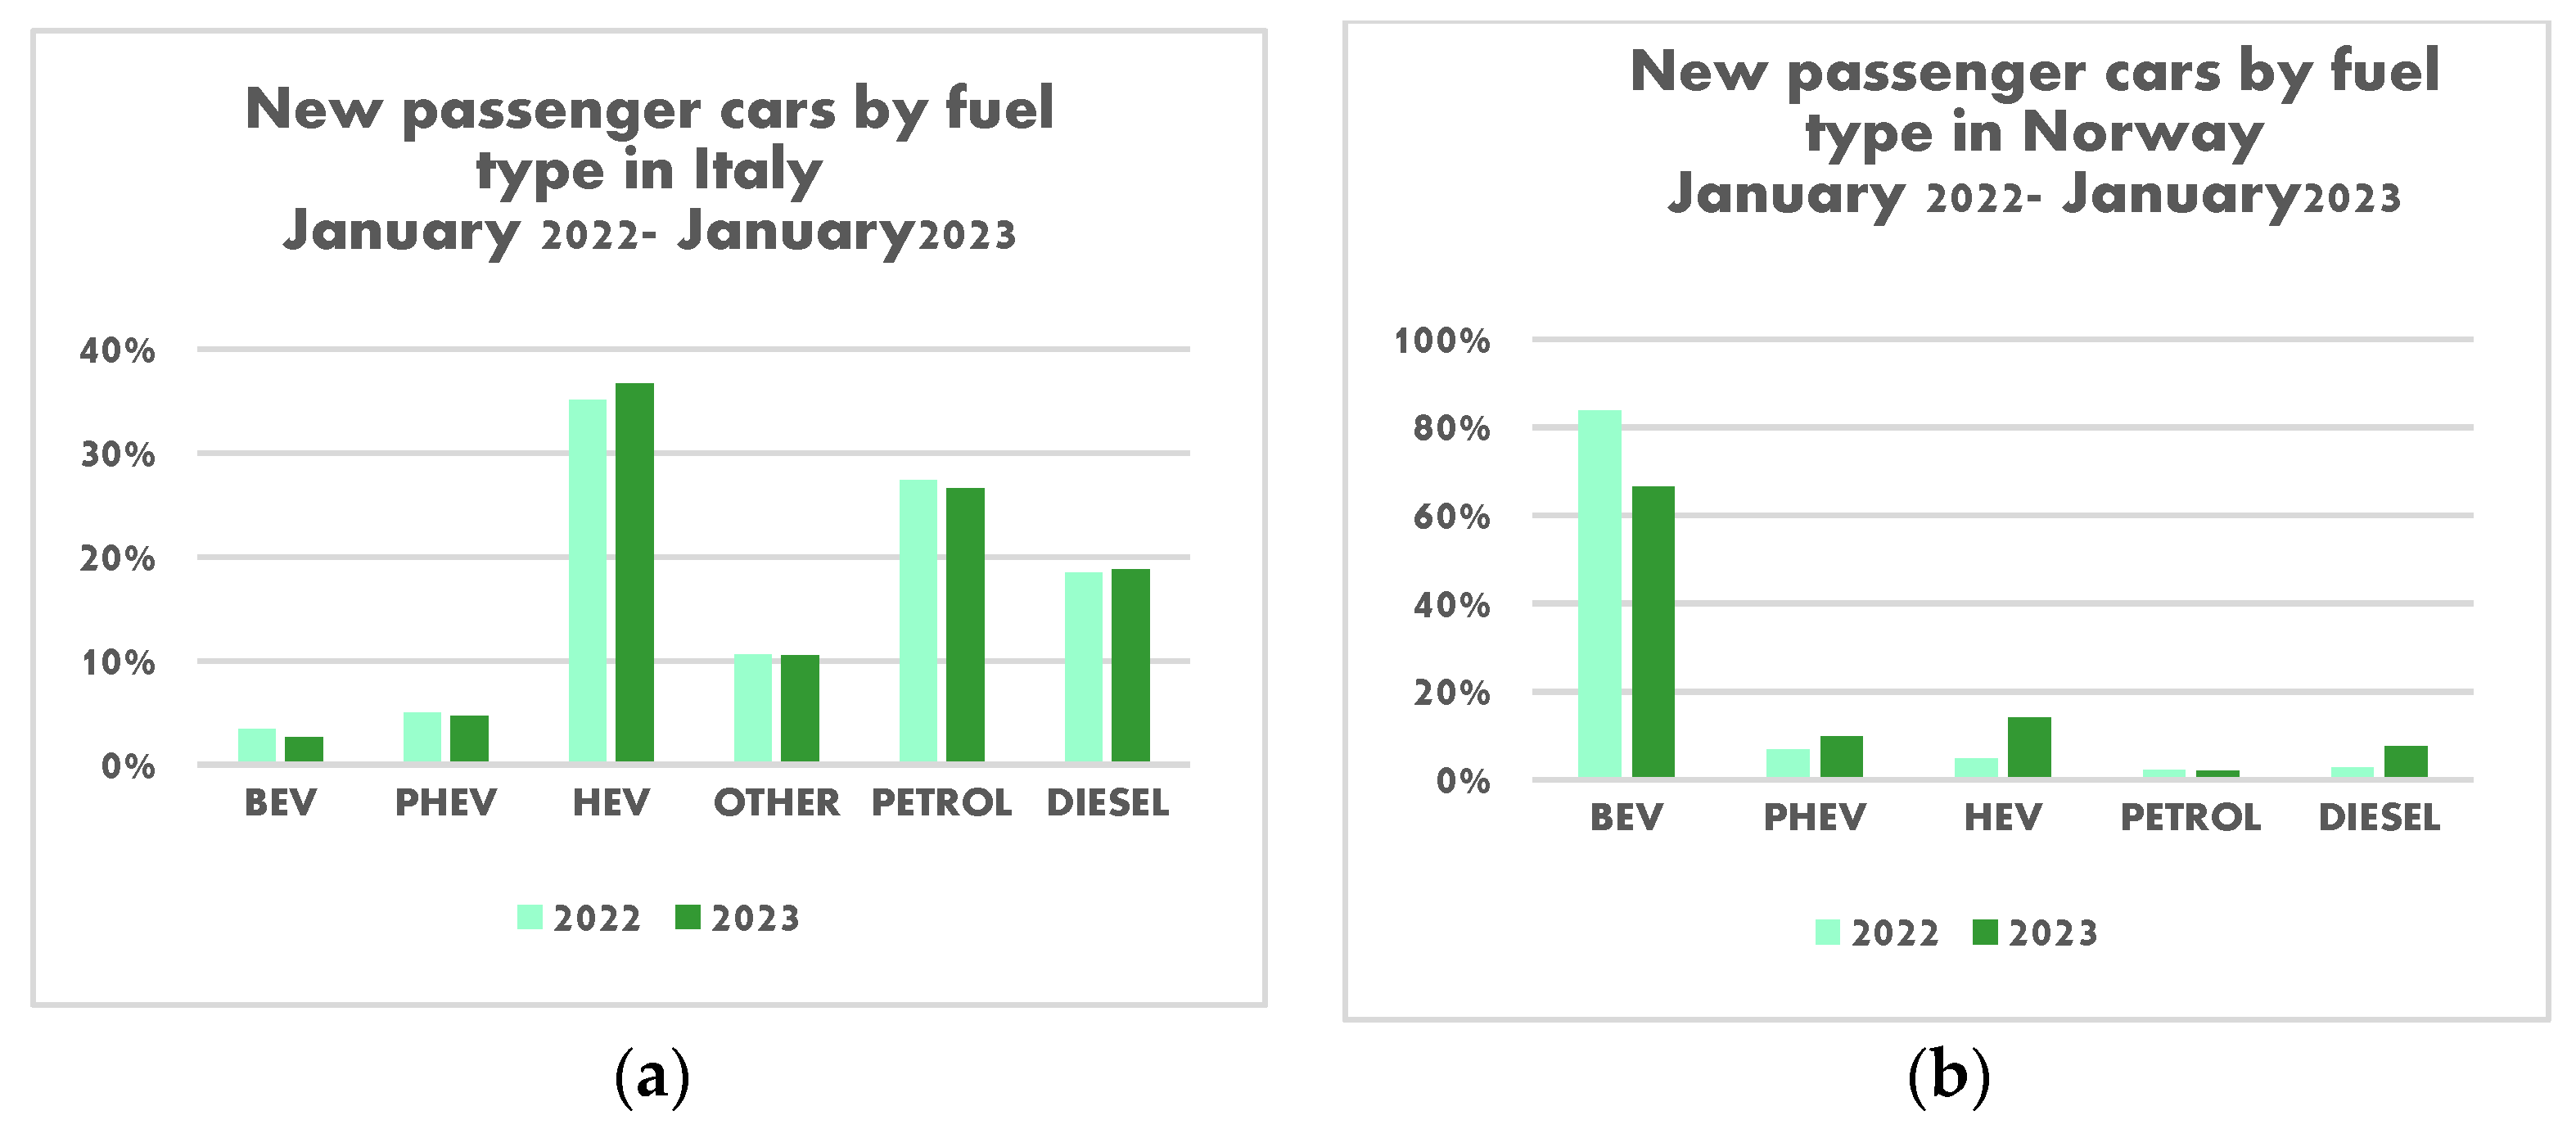
The sustainable Italian urban transport sector, particularly the passenger sector, is growing at a modest pace. The market share of electric vehicles in Italy exhibited a substantial increase from 0.01% in 2010 to 9% in 2022, with the percentage reaching approximately 13% as of 2023 (see Figure 2) [7]. Despite this progress, Italy still places a greater emphasis on ICVs compared to other European countries. As demonstrated in Figure 3, new passenger vehicles in Italy are primarily powered by fossil fuels (a), whereas in Norway, a greater proportion of new passenger vehicles are electrified (b) [8].
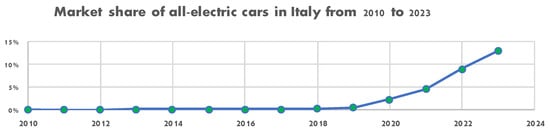
Figure 2.
Market share of all-electric cars in Italy from 2010 to 2023.
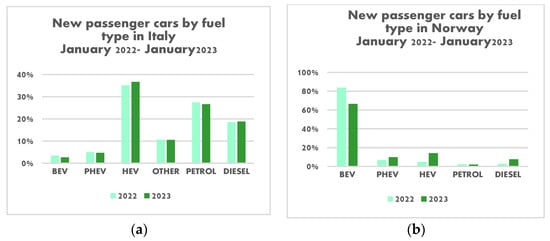
Figure 3.
New passenger cars by fuel type from January 2022 to January 2023: (a) Italy and (b) Norway.
It is noteworthy that Norway has transformed into a sustainable market with a high percentage of new energy vehicle technologies, in comparison to Italy (see Figure 3). This achievement can primarily be attributed to the judicious policies and subsidies implemented by the Norwegian government to promote the adoption of these technologies. How did Norway accomplish this objective? In 2017, the country pledged to phase out the sale of petrol and diesel vehicles by 2025.
In addition, the government waived the purchase tax and sales tax for new EVs, and EV owners were relieved of paying road taxes. Instead, they had to pay a discounted rate for tolls and ferry fares. Additionally, the government has directed significant resources towards the advancement of charging infrastructure, with a particular focus on the construction of fast charging stations.
The upcoming subsection presents a comprehensive analysis of the obstacles to the adoption of sustainable electricity in Italy, based on a thorough review of the relevant literature.
2.2. Recent Research Studies
The transition to sustainable green alternatives in the passenger transport sector is a complex topic that necessitates cooperation and innovative strategizing among multiple stakeholders, as well as consumers’ willingness to pay for new technology. Furthermore, the success of this transition demands a joint effort from all pertinent parties involved.
Italy is also facing the challenge of transitioning to sustainable technology, but like other European and non-European countries, it still encounters various obstacles that impeded its acceleration until 2023. To address this issue, it is essential to assess the problem and provide solutions and recommendations for policymakers to expedite the transition process. In this regard, we have conducted a systematic review of the literature on recent papers on sustainable and electric mobility in Italy from 2019 to 2023. Most of the papers were published in peer-reviewed journals. These studies have explored the topic from diverse perspectives, including technical, social, environmental, and political, through various surveys and analysis studies.
For example, the authors in [9] concentrated on the Italian context and evaluated the background, technology, and drivers’ perspectives towards EVs. They stressed the necessity of further research and development investments to improve EV performance and highlighted the significance of cost as a factor affecting EV purchasing decisions among Italian participants. The investigation also accentuated the significance of public incentives to promote the widespread market deployment of EVs.
Furthermore, the authors in [10] investigated the barriers to wider sustainable vehicle diffusion in Italy by conducting a survey on a representative sample of the Italian population. They examined and rated the obstacles to sustainable vehicle adoption, combined them through principal component analysis, and carried out a cluster analysis. To grasp the impact of socioeconomic factors on sustainable vehicle adoption, they evaluated the respondents’ characteristics. They suggested improvements to overcome financial barriers, such as strengthening incentives at the national and local levels and introducing more affordable EVs to the market. Additionally, the authors emphasized the need for investments in fast-charging stations and new regulations for multi-household dwellings to address charging-related barriers. They highlighted the significance of reliable and comprehensive information to enhance awareness of the technological and environmental advantages and disadvantages of EVs.
The researchers in [11] conducted an extensive literature review and a survey-based empirical investigation to identify the drivers and barriers for the adoption of sustainable vehicles in Italy. The objective of their study was to examine the shortage of research on the factors motivating and impeding the adoption of EVs in Italy as a whole, by offering an extensive analysis of the country’s situation from the viewpoints of both individual users and businesses. The authors also considered the barriers and drivers of new technology adoption and provided recommendations for policymakers and automakers to support the demand for EVs and develop an adequate recharging network. They focused on different vehicle segments, including EV owners and non-owners, and analyzed the views of companies regarding their fleet adoption of EVs.
In addition, the authors in reference [12] conducted a comprehensive survey of approximately 900 respondents to assess the relative importance of drivers of and barriers to the widespread diffusion of new energy vehicles in Italy. They investigated the preference structure of Italian drivers as EVs entered the market. They presented a stated choice experiment and discrete choice modeling framework to analyze data collected from a sample of 996 Italian drivers. They compared their findings with those of previous Italian and international studies and provided policy implications for car manufacturers and policymakers. They concluded that the lack of innovation in the type and number of attributes considered is an advantage, as it allows for the investigation of the evolution of the preference structure of Italian drivers as EVs penetrate the market. They suggested that car manufacturers might use the findings to choose which EV segment to target and which pricing strategy to adopt, while policymakers might use them to forecast the effectiveness of financial and technological policies on EV uptake.
Therefore, in [13], the authors discussed the current state of e-mobility in Italy, with a focus on hybrid technology due to its popularity among consumers because of cost and range anxiety. They investigated the feasibility of a hydrogen-based charging infrastructure in various cities in Italy and proposed using fuel cell cars as a solution to environmental concerns. They analyzed the readiness of various communities, including Como, Pordenone, Trento, Turin, Varese, Milan, Bergamo, and Bologna, to adopt hydrogen-powered technology.
Moreover, others in [14] presented an analysis and prediction of the EV scenario in Italy using machine learning. The focus of this study was to explore the impact of EVs on the automotive and electricity markets, and to propose a novel application of machine learning methods to estimate factors that could affect the distribution of EVs in Italy. They confirmed that factors such as purchase price and fuel economy have a strong influence on the purchase decisions of sustainable cars in Italy. They also found that the driving range of an EV is a major factor for purchase, but also a limiting factor due to consumer preferences. The authors provided a comprehensive overview of the dataset used and the machine learning approaches employed in the study, and concluded with future perspectives on the EV scenario in Italy.
The researchers in reference [15] conducted an energy and critical examination of the shift from fossil-powered train tracks to entirely electric traction in Italy’s transportation sector. They estimated the amount of additional electricity required in Italy by 2050 to support this transition, considering the electricity consumption of purely electric vehicles and the production of green hydrogen for fuel cell vehicles. The authors noted that in 2050, the excess electricity needed compared to current production in Italy is anticipated to be +27.6%. This value increases to +40.0% if the entire private car fleet consists of pure electric vehicles and to +100.6% if the entire fleet is composed of fuel cell vehicles powered by green hydrogen. The researchers stressed the importance of decarbonizing electricity generation as the initial step before fully electrifying the car fleet in order to address CO2 emissions from electricity production.
The transition to sustainable electric automobiles has a paramount impact on a nation’s image and its dedication to attaining sustainable development goals. Italy, a popular tourist destination, is at the commencement of electric mobility, but is gradually gaining traction. Through continued investments in infrastructure and the promotion of electric mobility via policies and incentives, the country is projected to witness a rise in EV adoption and a decline in carbon emissions. This aligns with the country’s commitment to environmental sustainability and the preservation of its breathtaking natural environment. To expedite this effort, the country introduced the “Green Mobility” initiative, which aimed to accelerate the transition to eco-friendly technology [16].
As a result, several researchers have shown interest in the transition projects in specific regions in Italy such as South Tyrol as a touristic place. For example, in [17], the authors examined the potential of electric mobility to promote sustainability in tourism destinations located in remote areas. They investigated tourists’ attitudes towards sustainable transport solutions, particularly electrification, and identified the barriers to adopting sustainable vehicles at the destination scale. They focused on the untapped potential of shared and private e-mobility in the tourism sector in remote areas, with a specific focus on EVs. To gather data, an online survey was conducted targeting tourists who visited South Tyrol, a region in the North of Italy, and their sociodemographic characteristics, holiday activities, and mobility patterns were analyzed. The authors highlighted the opportunity for the region to act as a pilot region for fostering e-mobility in the tourism sector and integrating it into a sustainable mobility system. Additionally, they collected documentary and secondary data to understand the current status and future development of sustainable mobility offerings, including the charging infrastructure. The authors in [18] explored the connection between environmental concerns and sustainable mobility in South Tyrol, using survey data to examine the attitudes and behaviors of both EV users and non-users in the region. They discovered that while environmental concern is a critical element in promoting sustainable mobility, it is not sufficient on its own. Other factors such as convenience, cost, and social norms also play a role. The authors recommend that policymakers and transportation providers should offer incentives beyond subsidies, like free parking and improvements in charging infrastructure, to encourage more people to adopt sustainable transportation modes. The authors’ findings provide valuable insights into the design of policies that are more effective in promoting sustainable mobility, but they caution that the results are specific to the local conditions and policies of South Tyrol, and may need to be adapted for other regions.
In their study, the authors in [19] explored the potential for a collective shift towards EV adoption and evaluated the effectiveness of behaviorally informed strategies in promoting such adoption. They proposed that governments could employ strategies that simplify the decision-making process and leverage the power of social influence. The study tested the impact of two behaviorally informed interventions: norm-based and salience. The results showed that both interventions had a positive effect on EV adoption intention, with norm-based interventions having a more significant impact. Overall, the authors suggest that behaviorally informed strategies that leverage social influence may be effective in promoting widespread EV adoption. In addition, the researchers in [20] delved into the capacity of EVs to lessen emissions and promote sustainability in cross-border Alpine regions. They utilized a multi-disciplinary approach, including social practices and transport social sciences, to explore the factors that influence the adoption of EVs in these areas. They centered on BEVs and PHEVs as the most alluring technological alternatives to conventionally fueled vehicles. The study uncovered that attitudes towards EVs diverge between residents and tourists in these areas, and policy recommendations are necessary to encourage the use of EVs in cross-border alpine regions. The investigators proposed that promoting EVs in the tourism sector could be an effective means of fostering economic competitiveness and cutting emissions in these areas.
The research studies that were analyzed in this section pinpointed various factors that are directly relevant to the sustainable adoption of EV technologies. Through our review of references in Italy in general and South Tyrol in particular, we singled out and classified these factors into different categories using the SWOT analysis method, which is presented in the following section.
3. Opportunities and Barriers: SWOT Analysis
3.1. Definition
Based on the previous subsection’s comprehensive literature review and government communications, as well as regional regulations, multiple factors that impact the current state of Italy’s road transport sector, particularly in South Tyrol, were identified. To analyze these factors, the SWOT analysis method was employed [21,22].
The SWOT method is a valuable tool for improving environmental and market-related decision-making processes. It entails evaluating internal factors, such as strengths (S) and weaknesses (W), as well as external factors, such as opportunities (O) and threats (T). This helps in identifying priorities, changes, and risks, ultimately leading to a suitable strategy for the topic under consideration. The strengths of EV technology are its positive internal differentiators compared to conventional technology. However, its weaknesses are internal negative factors that should be addressed to avoid impacting its strengths. Opportunities are external positive factors that can promote market diffusion, while threats are external negative factors that can impede it.
The analysis helped to identify the different external and internal elements that impact the current situation of Italy in general, and in South Tyrol in particular, which are summarized in Figure 4.
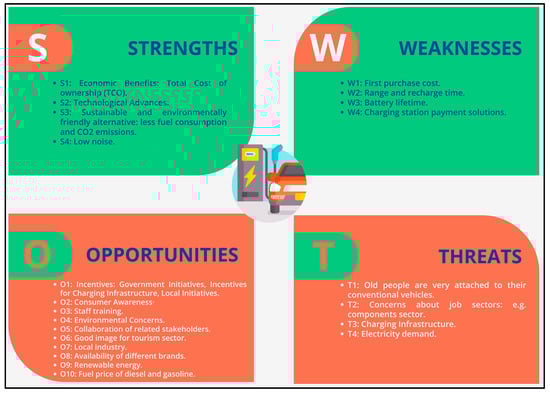
Figure 4.
SWOT analysis (authors’ elaboration).
Each point is well developed, as shown in the following subsections.
3.2. Internal Factors
- Strengths:
- S1: Economic Benefits: In comparison to conventional technologies, EVs boast a conspicuous advantage with regard to the total cost of ownership (TCO). This encompasses all aspects of ownership, including fuel and/or electricity prices, insurance, maintenance, taxes, and the like, which may vary depending on the particular policies and driving conditions of each country. Nonetheless, the TCO is a crucial factor in consumer choices, the adoption of eco-friendly technologies, and the market segment’s overall expansion.
- S2: Technological Advances: Developments in EV technologies, such as enhancements in battery capacity and charging speed, will render EVs a more feasible option for Italian consumers in the near future.
- S3: Sustainable and environmentally friendly alternative: The new energy technologies are capable of significantly reducing fuel consumption and CO2 emissions, while also ensuring a sustainable road transportation system [23]. With their completely green recharging route using renewable energy sources, this technology eliminates harmful emissions from start to finish, providing a zero-emission solution for the future.
- S4: Low noise: the new electric technologies are a good alternative for avoiding or reducing noise pollution, especially in urban areas.
- Weaknesses:
- W1: First purchase cost: This presents a considerable challenge. Although the Italian government has attempted to encourage the acquisition of electric vehicles through financial incentives and bonuses, it appears that more measures are necessary to foster their adoption.
- W2: Range and recharge time: There is growing concern among individuals regarding the provision of suitable infrastructure for charging electric vehicles, as well as the time required for recharging the battery, which gives rise to concerns about range and charging time.
- W3: Battery lifetime: Lithium batteries for EV technology can account for up to 45% of the total cost of an electric vehicle, leading to concerns regarding warranty duration, replacement expenses, and the like. However, the battery’s lifespan is also influenced by several factors, including the charging level (between 20% and 80%) and environmental conditions.
- W4: Charging station payment solution: The ease of use of the mobility solution is of paramount importance to accommodate individuals of all ages, and it is imperative to establish multiple payment options, including cash, cards, and digital applications.
3.3. External Factors
- Opportunities:
- O1: Government initiatives to buy an EV—“Ecobonus”: The Italian government has implemented various policies and incentives to promote new energy mobility. These include subsidies for EV purchases, reduced road taxes for EV owners, and incentives for the development of the EV charging infrastructure. In 2023, Italians will have the opportunity to choose from a diverse selection of EVs thanks to different EV incentives, which provide financial assistance ranging from EUR 2000 to EUR 7500. These incentives will be categorized based on the type of vehicle, as follows (see Table 1):
 Table 1. Incentives for buying electric vehicle technologies in Italy.
For individuals earning more than EUR 30,000 per year, the granting of subsidies for EVs and PHEVs is as follows: those who scrap their old car can receive up to EUR 5000 for electric vehicles and EUR 4000 for PHEVs with CO2 emissions of up to 60 g/km. Those who do not scrap their old car can receive up to EUR 3000 for EVs and EUR 2000 for PHEVs with CO2 emissions of up to 60 g/km.
In most Italian regions, both BEVs and PHEVs are exempt from paying an annual ownership tax for five years from the registration date. After this five-year period, they (PHEVs) are exempt from paying an annual ownership tax for five years from the registration date. After this five-year period, they benefit from a 75% reduction in the equivalent tax rate for most petrol vehicles. Additionally, the government has provided financial incentives for the installation of private charging stations, encouraging homeowners to charge EVs. Charging an EV in Italy typically costs approximately EUR 0.141 per kilowatt hour, but costs can vary depending on the charging speed and location. Private personnel and companies can deduct 50% of the acquisition and installation costs of charging points from their taxes (max. EUR 3000, spread over 10 equal annual installments). Furthermore, cities and municipalities in Italy are implementing local initiatives to promote electric mobility, including allowing EVs to access restricted areas in urban centers. For example, some cities in Italy offer further incentives for hybrid or electric cars, such as free parking in urban areas and free circulation in limited circulation areas (ZTL zones).
- O2: Consumer Awareness: With increasing awareness of the importance of sustainable mobility and its advantages, Italian consumers are becoming more receptive to the idea of using sustainable vehicles for personal transportation. This is particularly true of young, educated individuals who are more likely to purchase or switch to sustainable alternatives.
- O3: Government initiatives for employment and staff training: One of the suggested measures for reducing the impact on employment is the allocation of an annual fund of EUR one billion for eight years. This fund would be utilized to provide financial incentives for workforce training in various automobile manufacturing industries. Another alternative would be to direct affected workers towards other manufacturing sectors, to facilitate a smooth transition and maintain their contribution to the economy.
- O4: Environmental Concerns: Italy, similar to various other nations, is growing increasingly concerned with regard to the quality of the air and environmental effects. EVs are a desirable choice due to the fact that they produce zero emissions at the tailpipe, making them a suitable option in urban areas with pollution issues.
- O5: Collaboration of related stakeholders: In the South Tyrol region, there exists a strong spirit of cooperation between the government, local municipalities, and non-profit organizations, such as the “Green Mobility” initiative. This initiative is overseen by the STA—Strutture Trasporto Alto/Adige SpA/Südtiroler Transportstrukturen AG and aims to transform South Tyrol into a benchmark for sustainable alpine mobility.
- O6: Good image for the tourism sector: South Tyrol is a destination renowned for its tourism industry and for nature and sustainability, and the incorporation of electric mobility presents a chance to sustain the image of this sector in southern Tyrol, Italy.
- O7: Local industry: Italy boasts a diverse array of automotive brands, several of which are actively working to transition their production processes to electric vehicles (EVs) and other alternative energy vehicles, such as TAZZARI EV and Aehra. This presents a highly favorable opportunity for obtaining a local brand at competitive prices.
- O8: Availability of different brands: As previously discoursed, Italy boasts a flourishing automotive production industry encompassing diverse brand offerings. Consequently, it can be expected that consumers will maintain their allegiance to their preferred make, or opt for electric propulsion systems, despite the evolution of the manufacturing process.
- O9: Renewable Energy: South Tyrol is engaged in research and innovation initiatives focused on enhancing renewable energy technologies. The region works in partnership with academic and research institutions to increase the effectiveness and ecological soundness of renewable energy systems [20].
- O10: Fuel prices: It is currently noted that fuel prices in Italy are substantially high, with an average of EUR 1.85 per liter. This may present an opportunity for individuals to transition to electric technology and recharge their vehicles, which typically costs EUR 0.141 per kilowatt-hour.
- Threats:
- T1: Older people are very attached to their conventional vehicles: It has been noted that there is a prevalent trend, not solely confined to Italy, but extending to various regions globally, wherein older individuals tend to exhibit a stronger affinity towards conventional vehicles as compared to younger generations [24].
- T2: Concern about the job sector: Italy’s significant contribution to the automotive industry has garnered apprehension among the workforce, given the potential for job displacement.
- T3: Charging Infrastructure: Italy has been making efforts to enhance its charging infrastructure, with both public and private charging stations becoming more accessible. However, despite these improvements, there is still a considerable amount of work to be carried out, as evidenced by the disparity between the number of public charging points per 100,000 citizens in Italy and other European countries in 2022, as depicted in Figure 5.
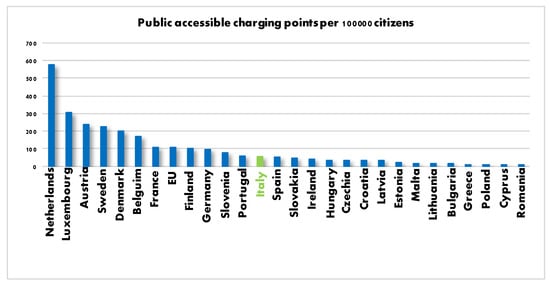 Figure 5. Public charging points per 100,000 citizens in 2022.
Numerous hotels and accommodations now offer EV charging facilities for guests, with the majority of them being Type 2 AC connectors. This development has made it more convenient for guests to utilize EVs during their stay, thereby enhancing the travel and tourism experience. The South Tyrol 652 Charging Station has been set up in various private and public places. However, only 4% of these charging stations were found to be in use [16].
- T4: Electricity demand: It is patently clear that as the market share of EVs grows, so too will the demand for energy. In keeping with our dedication to sustainability, it is imperative that we allocate additional resources to renewable energy sources in order to maintain a green process from inception to conclusion.
4. Analytical Hierarchy Process
4.1. General Insight
The analytical hierarchy process (AHP) is a decision-making technique that helps select the best option when faced with a complex decision problem. It was developed by Thomas L. Saaty in the 1970s and is widely used in various fields such as business, engineering, environmental studies, and so on [25].
AHP involves breaking down a decision problem into a hierarchical structure of criteria and alternatives, which helps decision-makers evaluate and prioritize various factors systematically. This methodical approach to decision making ensures that all factors are considered and weighted appropriately, leading to a more informed and effective decision. This combination of the SWOT-AHP method has been approved in different research areas, such as green technology planning [26], renewable energy development [27], industrial location [28], electronics firms [29], and the apparel industry [30].
AHP can be described in three mandatory steps to ensure that the factors are best prioritized and validated, as shown in Figure 6. In the first step, 8 internal factors and 14 external factors were identified. Next, the SWOT factors were prioritized using a pairwise comparison based on the AHP method. This method involved balancing two factors using a scale value from one to nine (see Table 2) and taking into account the weights of each factor. Lastly, it is necessary to validate the consistency of the matrix. The consistency ratio (CR) is used to measure whether the decision-maker is consistent when comparing factors. If the CR is lower than 10% (see Equation (1)), then the values are relatively consistent. However, if the CR is higher than 10%, the values are inconsistent, and we need to repeat the evaluations [31].
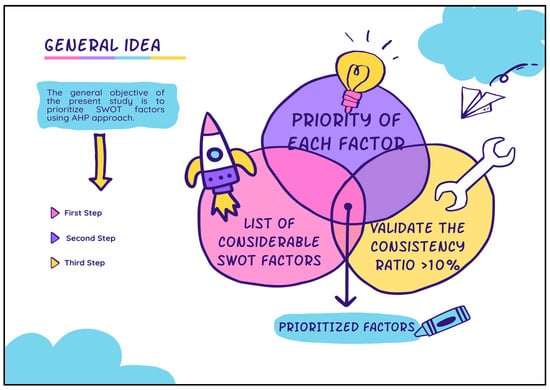
Figure 6.
AHP general process (authors’ elaboration).
The process of consistency checking involved transforming each pairwise comparison result into a matrix (see Equation (1)), in order to verify consistency [32].
This matrix is formed based on the assumption that if factor 1 is considered to be significantly more important than factor 2, then factor 2 should be prioritized over factor 1 at a ratio of 1/X times based on the scale in Table 2.
In matrix A, rows represent the relative weight of each factor to the others, when , . When the transpose of the vector of weights () is multiplied by matrix , a vector represented by is obtained, where is the largest eigenvalue of matrix and is the transpose of the vector of weights. Equation (2) can be expressed as follows [32]:
where I is the identity matrix. The largest eigenvalue, , is equal to or greater than or the number of rows or columns in matrix A. If there is greater consistency among responses, is closer to n. If all responses are perfectly consistent then equals n [32]. A consistency index (CI) for each matrix is then estimated using Equation (3):
Finaly, the CR is to determine the degree of consistency (see Equation (4)) and depends on the calculation of the CI and the random index (RI) (see Table 3).
Table 2.
Common comparison scales for the AHP method [33].
Table 2.
Common comparison scales for the AHP method [33].
| Number | Meaning |
|---|---|
| 1 | Equally important |
| 3 | Moderately more important |
| 5 | Much more important |
| 7 | Immensely more important |
| 9 | Entirely more important |
| 2, 4, 6, 3 | Interior values |
Table 3.
Random index [33].
Table 3.
Random index [33].
| n | 1 | 2 | 3 | 4 | 5 | 6 | 7 | 8 | 9 | 10 |
|---|---|---|---|---|---|---|---|---|---|---|
| RI | 0.00 | 0.00 | 0.58 | 0.90 | 1.12 | 1.24 | 1.32 | 1.41 | 1.45 | 1.49 |
4.2. Application and Results
After dividing a problem into smaller parts and establishing a hierarchy, the process of prioritization starts to decide the significance of the criteria. At each level, the criteria are compared based on their impact and the criteria specified at a higher level. The AHP method employs a standardized comparison scale of nine levels to carry out multiple pairwise comparisons as presented in the previous subsection. This helps to clearly comprehend the relative importance of the factors and make effective decisions. The priority value signifies the authors’ perspective on the relative significance of the criteria based on their expertise in this field. It is essentially a response to the question of which factor is more important in having a positive or negative impact on the project.
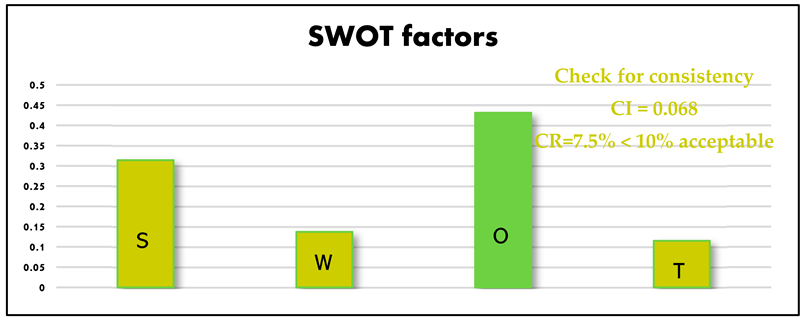
Based on the findings of the integration of the SWOT and AHP methods, the SWOT factors were prioritized. The ranking of the SWOT factors is presented in Table 4, with the strength subfactor priorities listed in Table 5, the weakness subfactor priorities in Table 6, the opportunity subfactor priorities in Table 7, and the threat subfactor priorities in Table 8. The research indicated that opportunities and strengths were the top factors, accounting for 43.1% and 31.4%, respectively. Weaknesses and threats were found to be the next most significant, with 14% and 11.5%, respectively.
Table 4.
Comparison matrix of SWOT factors (source: prepared by the authors).
Table 5.
(a) Comparison matrix of strength group (source: prepared by the authors). (b) Comparison matrix of weakness group (source: prepared by the authors).
Table 6.
Comparison matrix of opportunity group (source: prepared by the authors).
Table 7.
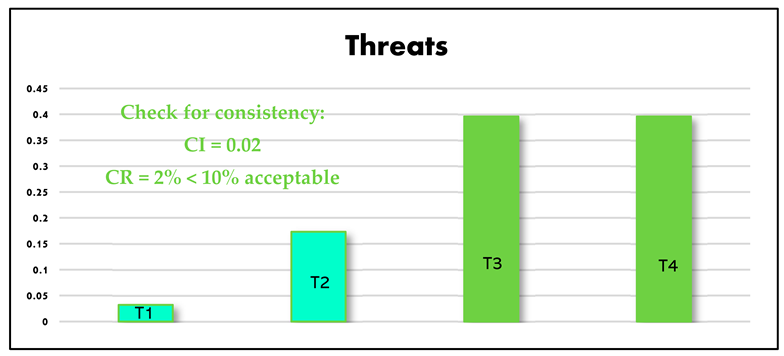
Comparison matrix of threat group (source: prepared by the authors).
Table 8.
Overall priority scores of SWOT factors and subfactors (source: prepared by the authors).
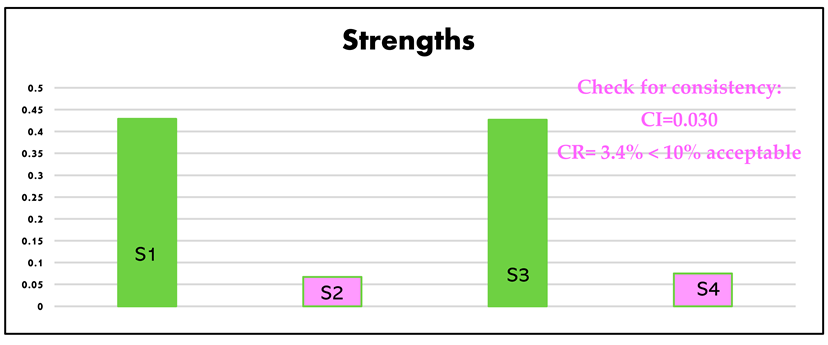
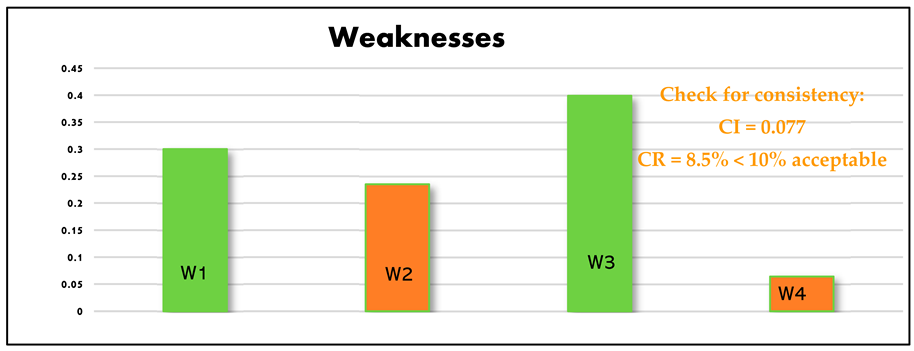
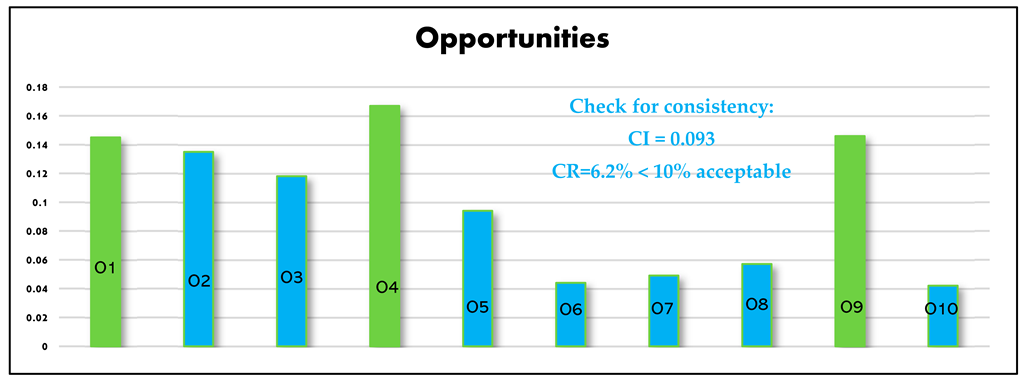
Among these factors, the most critical areas for stakeholders and policymakers to focus on are the economic benefits for consumers, particularly the total cost of ownership (42.9%), which falls under the strength group, and sustainable and environmentally friendly alternatives (13.4%). Other critical factors include environmental concerns (7.2%), renewable energy (6.3%), incentives such as government initiatives, charging infrastructure incentives, local initiatives (6.2%), battery lifetime (5.4%), charging infrastructure and electricity demand (4.5%), and first purchase cost (4.1%).
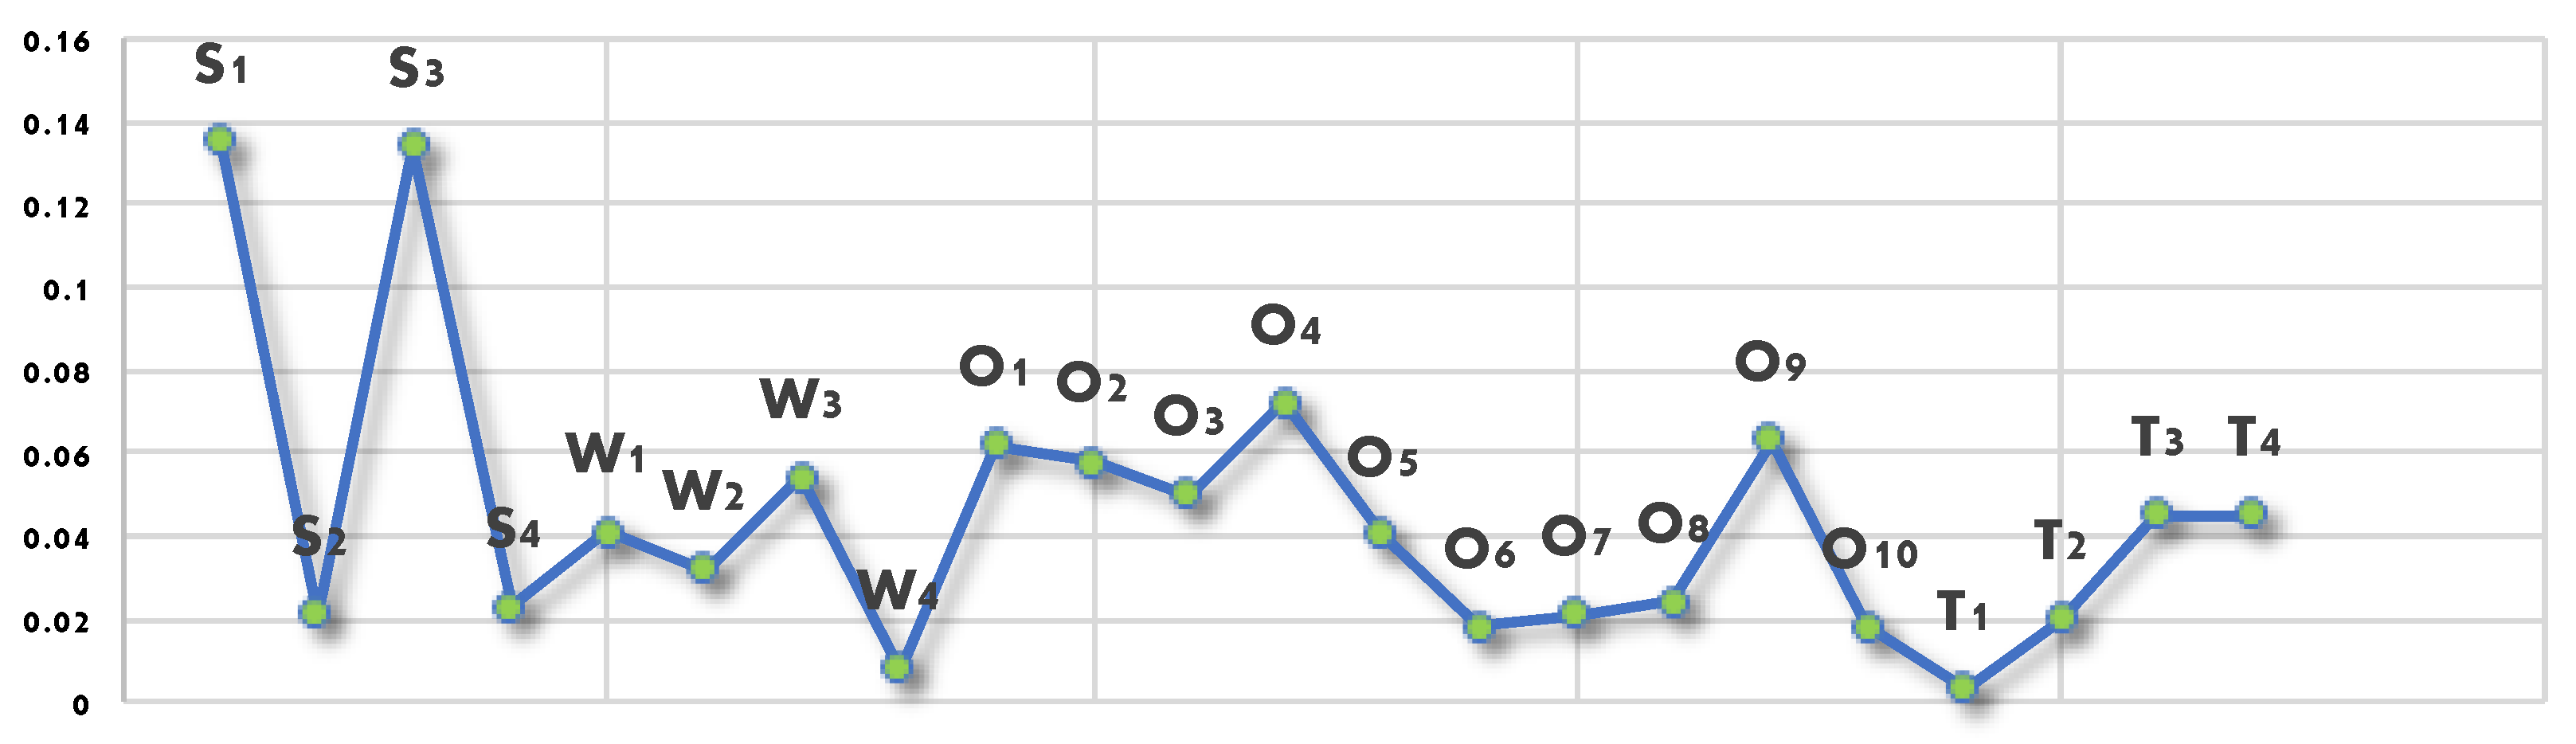
The overall priority scores for the SWOT factors and subfactors have been determined and are presented in Table 8. The internal and external factors, both opportunities and strengths, should be leveraged, while threats and technology weaknesses should be addressed and dealt with effectively. Of the subfactors, strengths S1 and S3 received the highest priority scores and are considered the most important, suggesting that they should be leveraged (see Figure 7). Mainly, the TCO (S1) is a crucial factor in consumer choices, the adoption of eco-friendly technology, and the expansion of the market segment in the region. However, in order to improve consumer knowledge and understanding of electric technologies, public education and awareness campaigns (such as those through the Internet and TV advertising) about the optimal use and benefits of these technologies are necessary.

Figure 7.
Overall priority of the 22 SWOT subfactors.
5. Conclusions
The present research focuses on the sustainable mobility transition project in Italy, specifically the region of South Tyrol, which is a significant part of the transportation sector, particularly in the realm of electric vehicles. The aim of this study is to uncover opportunities for project development and challenges that may impede progress. To achieve this, SWOT and AHP approaches were utilized to determine the prioritization of various factors. This research provides valuable insights into the current situation and future projections, which can aid in the creation of effective strategies and policies to promote sustainable transportation in Italy and South Tyrol in particular. The goal of this study was to support the success of the project and facilitate its expansion.
Although there have been positive advancements in this area, there are still challenges that should be addressed to ensure continued growth of market share. These challenges include the need for additional expansion of charging infrastructure, addressing range anxiety, and ensuring that consumers are willing to adopt technology and advocate for it. Despite these challenges, Italy is committed to reducing emissions and transitioning to a sustainable mobility future, aligning with global efforts to achieve sustainable development goals (SDGs) and meet European standards.
According to the study’s results, it is crucial to capitalize on the opportunities and strengths related to the technology ecosystem while effectively mitigating the threats and technological limitations in order to scale up the technology adoption. In addition, strengths S1 (sustainable and environmentally friendly alternative: less fuel consumption and CO2 emissions) and S3 (economic benefits: total cost of ownership (TCO)) as subfactors received the highest overall priority scores and importance. These areas require more attention and intervention in communication, education, and promotion as crucial factors influencing consumer choices and intentions as well as market segment expansion in the region. Thus, the importance of collaboration between policymakers and automakers cannot be overstated when it comes to addressing and mitigating the internal weaknesses and threats of the technology in order to achieve the objectives by 2035.
The focus of future research will be on determining the genuine opinions of the public, particularly the youth, who will be the primary users of new energy technology. This will aid policymakers in creating effective policies and regulations that drive the region’s transition to sustainability. To accomplish this goal, a variety of workshops and surveys will be conducted, which will not only aid in the analysis but also provide participants with a more comprehensive and in-depth understanding of the technology.
Author Contributions
M.B.A. developed, organized, and conducted the research work. E.R. supervised the research project. All authors have read and agreed to the published version of the manuscript.
Funding
This work was supported by the Open Access Publishing Fund of the Free University of Bozen-Bolzano.
Institutional Review Board Statement
Not applicable.
Informed Consent Statement
Not applicable.
Data Availability Statement
Data are contained within the article.
Conflicts of Interest
The authors declare no conflicts of interest.
References
- Rietmann, N.; Hügler, B.; Lieven, T. Forecasting the trajectory of electric vehicle sales and the consequences for worldwide CO2 emissions. J. Clean. Prod. 2020, 261, 121038. [Google Scholar] [CrossRef]
- Ben Ali, M.; Boukettaya, G. Analysis of barriers and opportunities in the transition towards sustainable electric mobility in Tunisia: An experimental survey. Res. Transp. Bus. Manag. 2023, 50, 101022. [Google Scholar] [CrossRef]
- Zhao, Y.; Jian, Z.; Du, Y. How can China’s subsidy promote the transition to electric vehicles? Renew. Sustain. Energy Rev. 2024, 189, 114010. [Google Scholar] [CrossRef]
- Munsi, M.S.; Chaoui, H. Energy Management Systems for Electric Vehicles: A Comprehensive Review of Technologies and Trends. IEEE Access 2024, 12, 60385–60403. [Google Scholar] [CrossRef]
- Fang, T.; Vairin, C.; von Jouanne, A.; Agamloh, E.; Yokochi, A. Review of Fuel-Cell Electric Vehicles. Energies 2024, 17, 2160. [Google Scholar] [CrossRef]
- New Car Registrations in 2024. Available online: https://www.acea.auto/files/Press_release_car_registrations_February_2024.pdf (accessed on 28 October 2023).
- Market share of all-electric cars in Italy from 2010 to 2021. Available online: https://www.statista.com/statistics/736887/market-share-of-electric-cars-registered-in-italy/#:~:text=Market%20share%20of%20all-electric%20cars%20in%20Italy%202010-2021,percent%20in%202018%2C%20to%204.6%20percent%20in%202021 (accessed on 28 October 2023).
- Fuel Types of New Cars. Available online: https://www.acea.auto/pc-registrations/passenger-car-registrations-11-3-in-january-2023-battery-electric-9-5-market-share/ (accessed on 28 October 2023).
- Miconi, F.; Dimitri, G.M. A machine learning approach to analyse and predict the electric cars scenario: The Italian case. PLoS ONE 2023, 18, e0279040. [Google Scholar] [CrossRef]
- Giansoldati, M.; Monte, A.; Scorrano, M. Barriers to the adoption of electric cars: Evidence from an Italian survey. Energy Policy 2020, 146, 111812. [Google Scholar] [CrossRef]
- Dotti, A. Drivers and barriers affecting the diffusion of electric vehicles in Italy: An empirical investigation on private users and corporate fleets. Biblioteche Archivi 2021. Available online: https://www.politesi.polimi.it/handle/10589/183202 (accessed on 29 October 2023).
- Danielis, R.; Rotaris, L.; Giansoldati, M.; Scorrano, M. Drivers’ preferences for electric cars in Italy. Evidence from a country with limited but growing electric car uptake. Transp. Res. Part A Policy Pract. 2020, 137, 79–94. [Google Scholar] [CrossRef]
- Falfari, S.; Bianchi, G.M. Concerns on Full Electric Mobility and Future Electricity Demand in Italy. Energies 2023, 16, 1704. [Google Scholar] [CrossRef]
- Ala, G.; Di Filippo, G.; Viola, F.; Giglia, G.; Imburgia, A.; Romano, P.; Miceli, R. Different scenarios of electric mobility: Current situation and possible future developments of fuel cell vehicles in Italy. Sustainability 2020, 12, 564. [Google Scholar] [CrossRef]
- Acri, R.A.; Barone, S.; Cambula, P.; Cecchini, V.; Falvo, M.C.; Lepore, J.; Santi, F. Forecast of the Demand for Electric Mobility for Rome–Fiumicino International Airport. Energies 2021, 14, 5251. [Google Scholar] [CrossRef]
- Green Mobility. Available online: https://www.greenmobility.bz.it/en/ (accessed on 20 November 2023).
- Scuttari, A.; Isetti, G. E-mobility and Sustainable Tourism Transport in Remote Areas: –Insights from the Alpine case study of South Tyrol (IT). Z. Tour. 2019, 11, 237–256. [Google Scholar] [CrossRef]
- Isetti, G.; Ferraretto, V.; Stawinoga, A.E.; Gruber, M.; DellaValle, N. Is caring about the environment enough for sustainable mobility? An exploratory case study from South Tyrol (Italy). Transp. Res. Interdiscip. Perspect. 2020, 6, 100148. [Google Scholar] [CrossRef]
- Signorile, P.; Larosa, V.; Spiru, A. Mobility as a service: A new model for sustainable mobility in tourism. Worldw. Hosp. Tour. Themes 2018, 10, 185–200. [Google Scholar] [CrossRef]
- Grazieschi, G.; Zubaryeva, A.; Sparber, W. Energy and greenhouse gases life cycle assessment of electric and hydrogen buses: A real-world case study in Bolzano Italy. Energy Rep. 2023, 9, 6295–6310. [Google Scholar] [CrossRef]
- Shinde, P.A.; Abbas, Q.; Chodankar, N.R.; Ariga, K.; Abdelkareem, M.A.; Olabi, A.G. Strengths, weaknesses, opportunities, and threats (SWOT) analysis of supercapacitors: A review. J. Energy Chem. 2023, 79, 611–638. [Google Scholar] [CrossRef]
- Olabi, A.G.; Abdelkareem, M.A.; Wilberforce, T.; Alami, A.H.; Alkhalidi, A.; Hassan, M.M.; Sayed, E.T. Strength, weakness, opportunities, and threats (SWOT) analysis of fuel cells in electric vehicles. Int. J. Hydrogen Energy 2023, 48, 23185–23211. [Google Scholar] [CrossRef]
- Mukherjee, K.; Bhattacharjee, P.; Roychowdhury, J.; Das, B.; Roy, S.; Das, M.C. Numerical investigation for performance and emission characteristics of a diesel engine fueled with soybean methyl ester biodiesel Diesel blend. J. Decis. Anal. Intell. Comput. 2023, 3, 257–269. [Google Scholar] [CrossRef]
- Buhmann, K.M.; Criado, J.R. Consumers’ preferences for electric vehicles: The role of status and reputation. Transp. Res. Part D Transp. Environ. 2023, 114, 103530. [Google Scholar] [CrossRef]
- Costa, D.S.; Mamede, H.S.; da Silva, M.M. A method for selecting processes for automation with AHP and TOPSIS. Heliyon 2023, 9, e13683. [Google Scholar] [CrossRef] [PubMed]
- Ikram, M.; Sroufe, R.; Awan, U.; Abid, N. Enabling progress in developing economies: A novel hybrid decision-making model for green technology planning. Sustainability 2021, 14, 258. [Google Scholar] [CrossRef]
- Ordoo, S.; Arjmandi, R.; Karbassi, A.R.; Mohammadi, A.; Ghodosi, J. A SWOT-AHP Analysis of Renewable Energy Development Strategies in Iran. J. Energy Manag. Technol. 2023, 7, 80–85. [Google Scholar] [CrossRef]
- Mohammed, H.J.; Naiyf, A.T.; Thaer, A.J.; Khbalah, S.K. Assessment of sustainable renewable energy technologies using analytic hierarchy process. IOP Conf. Ser. Earth Environ. Sci. 2021, 779, 012038. [Google Scholar] [CrossRef]
- Şeker, Ş.; Özgürler, M. Analysis of the Turkish consumer electronics firm using SWOT-AHP method. Procedia-Soc. Behav. Sci. 2012, 58, 1544–1554. [Google Scholar] [CrossRef]
- Oliveira, R.C.; Nääs, I.D.A.; Garcia, S. Combining SWOT with AHP for Analyzing the Adoption of a Circular Economy in the Apparel Industry in Brazil. Recycling 2023, 8, 73. [Google Scholar] [CrossRef]
- Manik, M.H. Addressing the supplier selection problem by using the analytical hierarchy process. Heliyon 2023, 9, e17997. [Google Scholar] [CrossRef] [PubMed]
- Gago, D.; Mendes, P.; Murta, P.; Cabrita, N.; Teixeira, M.R. Stakeholders’ perceptions of new digital energy management platform in municipality of Loulé, Southern Portugal: A SWOT-AHP analysis. Sustainability 2022, 14, 1445. [Google Scholar] [CrossRef]
- Pramanik, A.D.; Haldar, S.C.; Mondal, S.K.; Naskar, A. Ray, Resilient supplier selection using AHP-TOPSIS-QFD under a fuzzy environment. Int. J. Manag. Sci. Eng. Manag 2017, 12, 45–54. [Google Scholar] [CrossRef]


Disclaimer/Publisher’s Note: The statements, opinions and data contained in all publications are solely those of the individual author(s) and contributor(s) and not of MDPI and/or the editor(s). MDPI and/or the editor(s) disclaim responsibility for any injury to people or property resulting from any ideas, methods, instructions or products referred to in the content. |
© 2024 by the authors. Licensee MDPI, Basel, Switzerland. This article is an open access article distributed under the terms and conditions of the Creative Commons Attribution (CC BY) license (https://creativecommons.org/licenses/by/4.0/).