Abstract
This study investigates the dynamics of passenger satisfaction and sustainable urban mobility within the context of multimodal railway hubs, focusing on travel behaviors at major stations in China. Against the backdrop of rapid urbanization and the nation’s initiatives to improve transportation efficiency, this research employs social media data analysis to assess passenger sentiment across six key transportation hubs in Eastern China. Utilizing methodological approaches such as keyword frequency analysis and semantic categorization of 39,061 Dianping reviews, supplemented by network visualizations with Gephi, this study reveals insights into factors influencing passenger satisfaction beyond travel efficiency. Signage quality, facility availability, queueing, and crowding emerge as significant determinants of passenger behavior. The study underscores the importance of strategic improvements in station design, navigational aids, and facility management, grounded in real-time data analytics and passenger feedback, to enhance overall passenger satisfaction and promote sustainable urban mobility. This research contributes to advancing understanding of passenger behavior and informs efforts aimed at improving urban transportation systems to meet the evolving needs of passengers and cities.
1. Introduction
1.1. Railway Transportation Hubs in China
As cities evolve with the rapid pace of urbanization, railway transportation hubs have emerged as critical junctures in the urban transportation fabric, seamlessly interweaving the strands of people’s work, life, and recreational pursuits. However, the intrinsic complexities of urban landscapes—shaped by varying terrain, intricate architectural designs, and diverse transportation plans—often preclude the railway system from delivering passengers directly to their final destinations. This gap necessitates a seamless transfer across diverse transport modes, including subways, buses, and taxis [1].
Over the past decades, China’s rapid economic growth and urban expansion have catalyzed the evolution of railway hubs from mere points of travel to complex centers that integrate multiple modes of transportation, significantly shaping urban mobility and regional connectivity. From 1997 to 2007, China dramatically enhanced its railway transportation infrastructure through extensive upgrades and substantial investments, aiming to improve urban mobility and the integration of efficient multimodal transport networks amid increasing demands. Over the next five years, an additional USD 300 billion is projected to be invested to further expand capacity, integrate new technologies, and boost the overall productivity of the railway system [2]. Currently, seamless multimodal transportation is a focus all over the world, and China has made a strong response to it. The State Council of the People’s Republic of China introduced the visionary concepts of “Zero-Distance Transfer” and “Seamless Connection” in 2012. Subsequently, 18 policies enacted since 2013 have championed the development of “Zero-Transit”. Subsequently, 18 policies enacted since 2013 have championed the development of “Zero-Transfer”, fostering vertical integration of transportation layers, simplification of multimodal transit options, unification of the design of the “Zero-Transfer” system options, and unification of the design–construction–management continuum to profile a “Zero-Transfer” blueprint from the perspective of time, space, and distance to minimize transfer distances and eliminate superfluous routing [3]. These policies were initiated as direct responses to urban congestion and the inefficiency of multimodal transfers, aiming to streamline the movement within urban centers and reduce transit times dramatically.
1.2. Seamless Interchange Studies
In European cities, successful examples of seamless multimodal transportation have been effective in promoting more environmentally friendly travel choices for commuters and reducing the use of private cars [4], which is an important contribution to sustainable transportation [5]. With such benefits, existing research on seamless multimodal transportation emphasizes improving the transfer experience in terms of accessibility, transfer environment, transfer efficiency, safety, and multiple policy and regulatory factors. Current studies present research models for optimizing passenger mobility that focus on transfer efficiency, such as minimizing travel time and the number of trips taken by last-mile vehicles [6]; building, restructuring, or maintaining transportation hub infrastructure [3]; encoding spatial and temporal optimization [7]; and encouraging the downsizing of the interconnectivity ratio, which refers to access and egress time as a proportion of total trip time [8]. Similarly, the interchange studies in China especially highlight the importance of transfer or walking distance as the standard of transfer behavior [9,10]. For railway hubs, models and standards are developed for transfer time and transfer distance to evaluate the interchange quality [11]. A few studies that have focused on passengers rather than transportation systems alone have also focused only on the natural characteristics and accessibility needs of passengers [12].
In this case, passenger’s behavior and perceptions have been overseen in studies of transferring with different modes of transportation. And in the context of China’s vast population, the sprawling expanse of hub stations, and the sheer volume of passenger traffic, the transfer quandary presents a formidable challenge—the mega-regional railway hub stations struggle to meet the standardized seamless interchange. This brings up the following questions: Is transfer efficiency the most crucial standard for evaluating the seamless interchange? And how do passengers feel about long transfer distances?
1.3. Social Media and Travel Behavior Research
Traditional approaches to researching travel behavior have predominantly utilized large-scale transportation surveys and questionnaires. These methods aim to map out the spatiotemporal patterns of transit use and collect comprehensive data on passenger behavior. However, these methods are often resource-intensive, demanding significant investments of time, manpower, and finances. Furthermore, their limited scope and the transient nature of survey periods frequently pose challenges in maintaining data quality and integrity.
With the advent of big data technologies, advanced computer programming, and network text analysis, a paradigm shift has occurred in transportation research [13]. The integration of these modern tools enables a more nuanced exploration of passenger travel behaviors and preferences. Big data applications, such as analyzing transactional details from transportation cards, empower researchers to forecast passenger flow dynamics with enhanced precision [14,15]. Real-time monitoring of traffic networks and passenger movements enables transit systems to promptly adapt vehicle schedules and refine transfer logistics [16,17].
The advent of big data has also opened doors to the development of sophisticated navigational aids and personalized recommendation systems, providing passengers with tailor-made transit options and journey planning [18,19,20]. In tandem, the analysis of feedback on station facilities and service usage facilitates the ongoing evaluation and improvement of service quality, allowing for swift identification and resolution of issues. Furthermore, by scrutinizing patterns in travel habits and consumer behaviors, transit authorities can craft more effective fare strategies and promotional offerings. Such initiatives incentivize passengers to select optimal transfer options, minimizing costs and bolstering the overall efficiency of the transfer process [21,22,23].
Notwithstanding the extensive research utilizing big data to enhance transfer behavior and optimize travel modalities [24,25], the potential of integrating social media insights with the physical spatial aspects of transit has not been fully explored. Prior studies have harnessed social media data for traffic analyses and predictive modeling, often sidelining the significance of diverse transportation environments. Yet, it is undeniable that factors such as transfer distances, modes of transit, station amenities, and navigational signage profoundly influence transfer behavior.
Recognizing this gap, there is a compelling need to amalgamate the tangible dimensions of the transportation infrastructure with passengers’ experiential feedback, harnessing the breadth of big data and the depth of social media text analysis. Such comprehensive research into transfer modalities at railway transportation hubs is vital for elucidating the intricacies of travel behavior from the passenger’s vantage point.
1.4. Case-Based Evaluation System
The present study aligns with the Sustainable Urban Mobility Plans (SUMP), which advocate for integrating urban rail transit with other transport modes to facilitate multimodal journeys. Reflecting this advancement, our analysis includes six provincial capital hub stations in China—Beijing South, Guangzhou South, Hangzhou East, Nanjing South, Shanghai Hongqiao, and Zhengzhou East. These stations were chosen for their pivotal roles in the transportation network and their high passenger volumes, employing a big data approach to comprehensively analyze urban mobility and passenger satisfaction. It employs an innovative approach that uses big data obtained from social media scrapping as the data basis for evaluation. The study constructs a robust evaluation framework leveraging social media data and advanced programming techniques. At the core of the analysis are semantic categorization and word frequency analysis, which together facilitate a deep dive into the relational dynamics of passengers’ behaviors, the objects they interact with, and the emotions they exhibit during transit, both temporally and spatially.
Leveraging the extensive data capabilities of modern analytics, this study aims to delve into important factors influencing travel behaviors at major railway hubs. It aims to establish a social media-based evaluation system that can direct operational enhancements within railway hub environments and inform future strategies aimed at realizing the ideal of ‘zero transfers’. This paper is poised to address the following research questions:
- What general behaviors are reported by passengers regarding their transfer behaviors at railway stations?
- 1.1.
- What general factors in railway stations are frequently mentioned when passengers transfer between different modes?
- 1.2.
- Which negative behaviors are most frequently identified for various transfer modes?
- 1.3.
- What facilities do people pay attention to during their different transfer processes?
- What are the associations between passengers’ transfer mode choices and their behaviors?
- 2.1.
- How do railway stations’ general features relate to passengers’ choice of transfer modes?
- 2.2.
- How do specific negative behaviors relate to passengers’ choice of transfer modes?
- 2.3.
- How do facility features at transport hubs correlate with passengers’ behavior when using different transfer modes?
- Is there a relationship between transfer distance and passengers’ transfer behavior?
2. Materials and Methods
2.1. Study Site
This study selected six representative major transportation hub stations in Eastern China—Shanghai Hongqiao, Nanjing South, Guangzhou South, Zhengzhou East, Beijing South, and Hangzhou East stations—as the research locations (Table 1). These stations not only serve as critical transportation hubs for provincial capitals within the railway network, but they are also key nodes connecting multiple main railway trunk lines. They play a vital role in managing substantial passenger transfers and transportation tasks, characterized by large passenger flows and dense traffic. Their locations are typically 10–30 km away from the city center, with multiple subway and bus routes, demonstrating typicality and representativeness. Lastly, due to their significant role within the transportation network and high passenger volumes, these stations facilitate the accumulation of a substantial amount of social media data over time. Although the data are contributed arbitrarily by social media users, the extensive reach and prolonged data collection period ensure a sufficient dataset for analyzing trends in passenger travel behaviors and station performance.

Table 1.
Basic information on six stations.
2.2. Research Mode of Transfer
Within high-speed rail passenger hubs, passenger transfer modes are categorized into six types based on the operational demands of different modes of transportation: direct transfer, transfer by bus, transfer by subway, transfer by taxi, transfer by private vehicle, and other transfers (such as plazas, airports, etc.). Among these, direct transfer refers to transfers within the station with the shortest walking distance; subway, bus, taxi, and private vehicle are the most common and important transfer methods.
Furthermore, passengers tend to choose routes with the shortest distance and fewest transfers when selecting transfer routes. Therefore, in the evaluation system, factors such as the number of transfers and whether layer changes are required are introduced to comprehensively consider the actual behavior and convenience during the transfer process. This integrated classification and evaluation method helps systematically optimize the design and operation of high-speed rail passenger hubs, enhancing the overall travel behavior of passengers.
Comparing the transfer distances among the six stations (Figure 1), in terms of average transfer distances, both Nanjing South Station and Beijing South Station have transfer distances lower than the average value for all types of transfers. Zhengzhou East Station also has relatively short transfer distances for all types except transferring by subway. However, Shanghai Hongqiao Station has longer transfer distances for all transfer methods except taking a taxi. Except for Hangzhou East Station, the exit gates are generally on the same level as the entrance gates of the transportation vehicles to be transferred to. In terms of routes, the exit routes at Guangzhou South Station and Beijing South Station intersect with the entrance routes, while the other stations do not have intersections. Nanjing South Station has the fewest number of turns, while Shanghai Hongqiao Station has the most. Overall, Nanjing South Station is considered a better transfer station, while Shanghai Hongqiao Station is considered a relatively poor transfer station.
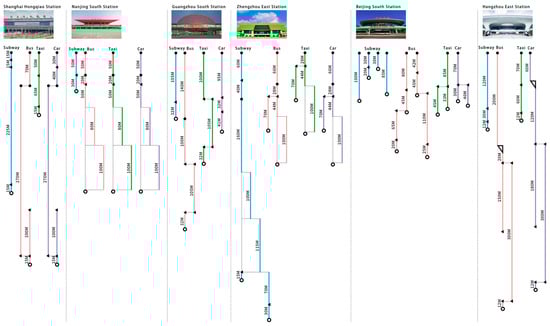
Figure 1.
Visualization of Transfer Paths. “⯇” represents a turn. “●” represents an exit. “○” represents a transfer point. “◹” represents a change in level.
2.3. Keywords Collection and Downloading
User reviews from Dianping were chosen as the primary data source. Dianping is a well-known consumer review platform in China, gathering a large number of genuine reviews and feedback from users. It covers various businesses and venues, including dining, shopping, tourism, and more [26]. Users can mark the locations of businesses and venues to express their feelings and evaluations, as well as share photos and rate them. According to statistics, Dianping has over 160 million monthly active users (bjx.iimedia.cn). In previous studies, Dianping data have often been used to research leisure consumption spaces and user behaviors [27,28]. Therefore, extracting evaluation data from this platform not only provides evaluations of high-speed rail services but also descriptions of specific service details, environmental ambiance, transportation convenience, and more, offering additional data sources for comprehensive analysis. Additionally, evaluations on Dianping are posted by users in real time, allowing for timely access to the latest feedback and evaluations on high-speed rail services [29].
As of 10 April 2023, based on the construction time of different stations, we collected user review data from Dianping after the completion of the six stations (Table 2), totaling 39,061 reviews. Despite the temporal differences, the selected time spans ensure that a sufficient and representative sample of reviews is collected for each station, considering their respective operational histories and the volume of traffic they handle. All reviews were categorized into four main categories, including transfer modes, positive behaviors, negative behaviors, and objects. Transfer modes include subway, bus, taxi, private vehicle, transfer, airplane, and plaza, totaling six subcategories.
Table 2.
Data statistics of six stations.
To gain a more precise understanding of the functions and impacts of various facilities during transfer processes, the facilities can be categorized into four types based on their roles in passenger transfers: service facilities (such as dining and entertainment facilities), information facilities (such as signage and guidance facilities), waiting facilities (such as seating and restrooms), and transportation facilities (such as escalators and shuttle buses). To delve deeper into passenger behavior patterns and dynamics during transfers, passenger behaviors can be classified into five categories based on different transfer actions: walking behavior, facility usage behavior, queueing behavior, and wayfinding behavior.
2.4. Data Analysis
Our analysis focuses on examining the frequency of the occurrence of keywords in individual user reviews from Dianping and their co-occurrence relationships. Firstly, we comprehensively examined the occurrence of keywords for all four categories and their respective subcategories. To achieve this, we calculated the frequency of keywords in each category and subcategory, enabling us to gain insights into their levels of mention. Then, we utilized Gephi (version 0.9.1) to create compelling visualizations, revealing the intricate relationships between the usage of transfer targets and various aspects of user behaviors. Gephi 0.9.1 is an open-source network analysis and visualization software, utilizing graph theory syntax, where we integrated various elements such as node size, edge count, and edge width into our visualizations [30]. Bigger nodes have higher popularity than smaller nodes. Thicker edges suggest stronger connections between the two entities. These visual representations, known as “social network visualizations”, enable us to clearly depict the connectivity between various keywords mentioned in reviews. By studying the relationships between the keywords, we gain valuable insights into how different keywords co-occur, providing valuable insights into user behaviors and perceptions. These visualizations uncover the physical, procedural, and experiential connections between different transfer methods and transfer routes. By deciphering these relationships, we obtain valuable insights into the interactions of users with different aspects during travel behavior and their overall behaviors. Additionally, we utilized the Python programming language. Python has proven to be a powerful tool for various tasks, including data wrangling, preprocessing, table transformations, and automation. Its versatility and extensive library support enable us to effectively handle and manipulate data, ensuring accurate and reliable results.
Furthermore, our analysis involves conducting correlation analysis between transfer target categories and other categories, including positive evaluation categories, negative evaluation categories, and object categories. Using Excel spreadsheets, we quantitatively analyzed the frequency of keywords obtained in the previous step using percentages, determining the proportion of the association between different transfer targets and other categories in the six stations. We then utilized line graphs to express the percentage lines of mentions of other categories in different transfer targets, highlighting the data where each emotional and object category has the highest or lowest proportion of mentions.
Despite the robust methodologies employed, it is crucial to acknowledge the inherent limitations associated with using data sourced from social media. As the data are contributed arbitrarily by users, they are non-random and may not comprehensively represent all demographics or opinions. This limitation could influence the generalizability of the findings. However, the large volume of data collected over extended periods and from high-traffic stations helps mitigate some of these issues by providing diverse viewpoints and substantial data points. This approach allows for a more nuanced analysis of travel behavior trends, though it remains susceptible to biases inherent in voluntary social media contributions.
Overall, the integration of Python programming, data wrangling, preprocessing, and analysis techniques, along with the use of Gephi and Excel for network or data visualization, enables us to conduct comprehensive and in-depth analysis of travel behavior-related data. The combination of these tools and methods provides a powerful framework for extracting insights and discovering valuable information about the physical, planned, and experiential relationships in travel behavior.
3. Analysis of Station Social Media Text Evaluations Based on Gephi
3.1. General Factors
The general factor analysis was conducted on the interchange target categories, including #1 transfer mode categories, #2 positive behavior categories, #3 negative behavior categories, and #4 object categories.
3.1.1. Passengers’ Attention on the General Factors When Using Different Transfer Modes at Different Railway Stations
In response to research question 1.1 “What general factors in railway stations are frequently mentioned when passengers transfer between different modes?”, the following line graphics are made for comparison analysis. As Figure 2a shows, for Beijing South Station, there are more negative behaviors for taxi transfers; mentions of position transitions when transferring to private vehicles and to the plaza are higher, but mentions of service facilities at the plaza are nearly nonexistent. Regarding Guangzhou South Station, which can be observed in Figure 2b, there are fewer negative behaviors for bus transfers, but more for taxi transfers; there are more floor transitions when transferring to private vehicles; the service for plaza transfers is better. For Hangzhou East Station, as Figure 2c presented, there are higher negative behaviors for taxi transfers, higher behaviors for the positions of internal interchanges, and more commercial activities on the way to the plaza. For Nanjing South Station, presented in Figure 2d, the environment evaluation of its plaza is relatively good; there is a higher frequency of position transitions required when transferring to taxis and private vehicles; bus transfer services are relatively convenient, with a higher rating for signage evaluations, although mentions of signage for the plaza are low. As it showed in Figure 2e, Shanghai Hongqiao Station receives higher positive service evaluations for internal interchanges, indicating a higher level of convenience. When transferring to private vehicles, more attention is paid to the “location”, specifically the transition between floors and ascending/descending stairs. Negative behaviors are more prevalent when transferring to taxis, with the factor of “signage” having a more significant impact when transferring to the plaza. For Zhengzhou East Station, in Figure 2f, the service evaluation for transferring to private vehicles is relatively low; the environmental facilities of the plaza are good, but mentions of other facilities are low; there are more negative behaviors when transferring to taxis.
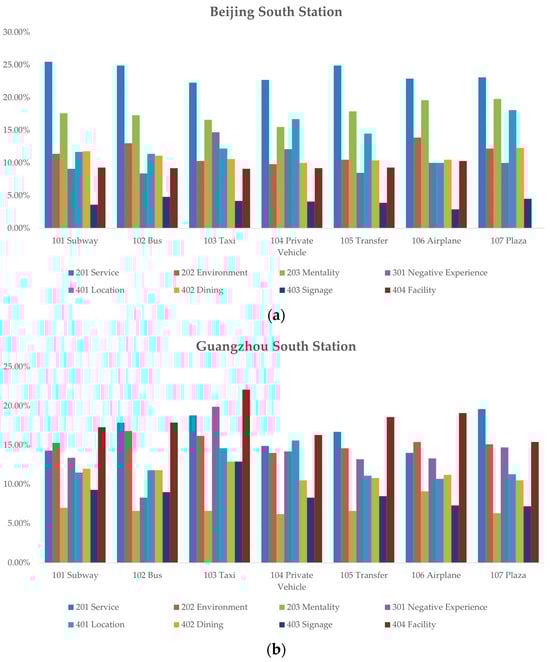
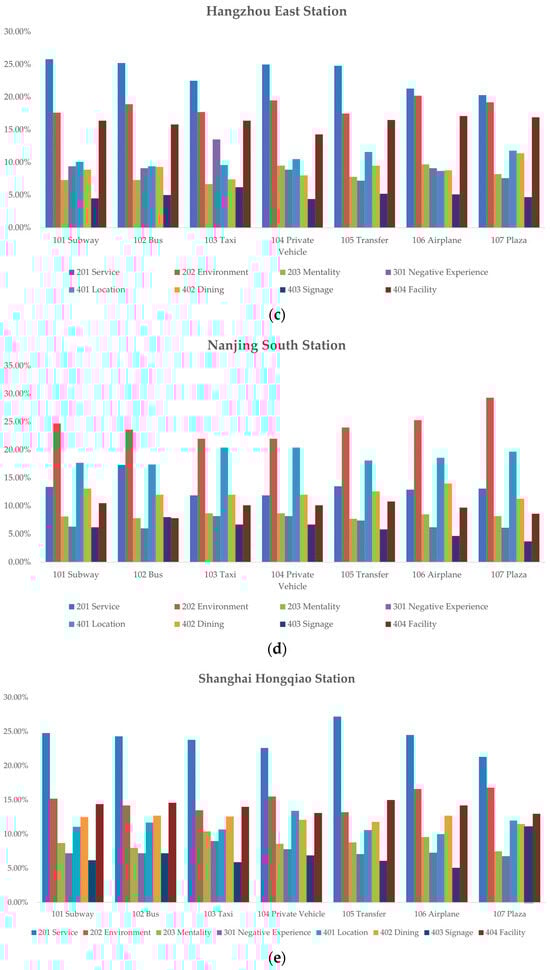
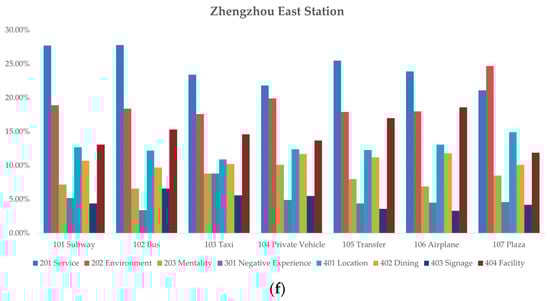
Figure 2.
Comparison of overall behavior correlation for six stations. (a) Beijing South Station; (b) Guangzhou South Station; (c) Hangzhou East Station; (d) Nanjing South Station; (e) Shanghai Hongqiao Station; (f) Zhengzhou East Station.
3.1.2. Correlation between General Factors in Stations and Transfer Behavior with Different Modes
In response to research question 2.1 “How do railway stations’ general features relate to passengers’ choice of transfer modes?”, we used Gephi to figure out the correlation between the factors. The colors in the all the following Gephi graphs differentiate the types of transfer modes, with each mode represented by a unique color, while associations between other factors are uniformly colored in grey. While the Gephi graphs do feature overlapped elements, this overlap does not significantly hinder the ability to interpret the data. The size of the nodes in the Gephi network diagram, which corresponds to the significance and frequency of each factor within the station’s operations, can deliver important insights into the relative importance or volume of each factor. The overall Gephi graph in Figure 3 reveals that within the transfer mode category, all six stations are primarily evaluated based on the subway, with relatively consistent evaluation volumes for other transfer modes except for Shanghai Hongqiao Station, which has a higher volume of reviews for transferring to airplanes. Regarding positive behavior categories, apart from Nanjing South Station and Guangzhou South Station, which focus on the environment, other stations primarily receive positive behaviors for their services. Negative behaviors are generally low across all stations except for Guangzhou South Station. In the object category, except for Nanjing South Station and Beijing North Station, which are primarily evaluated based on location and dining, respectively, other stations are mainly evaluated based on facilities, with signage receiving the lowest volume of evaluations across all stations.
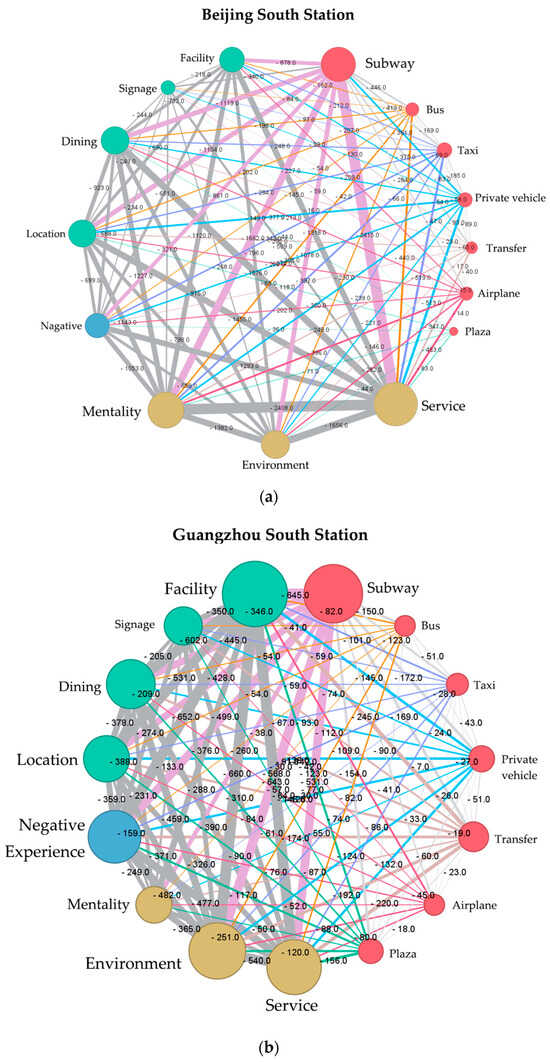
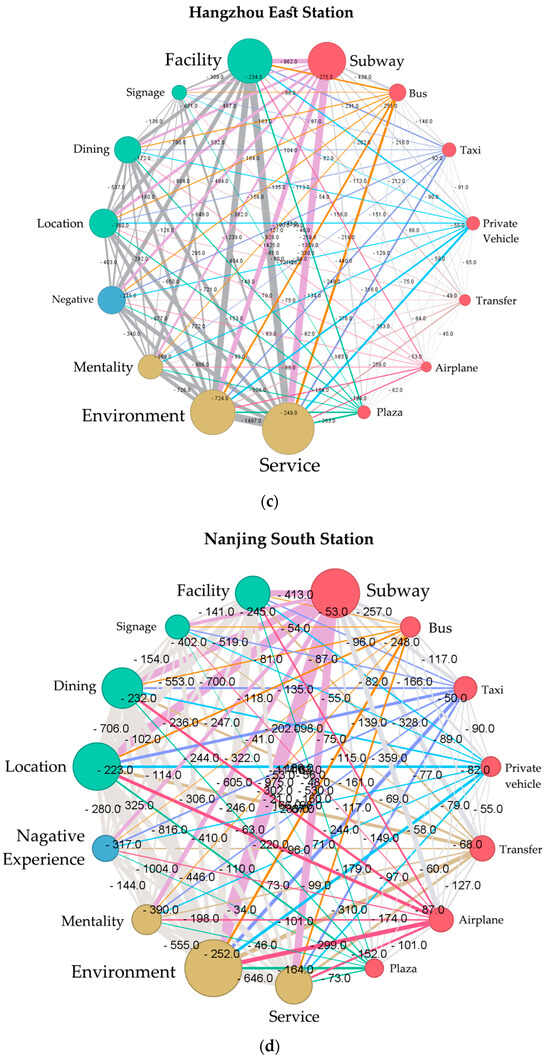
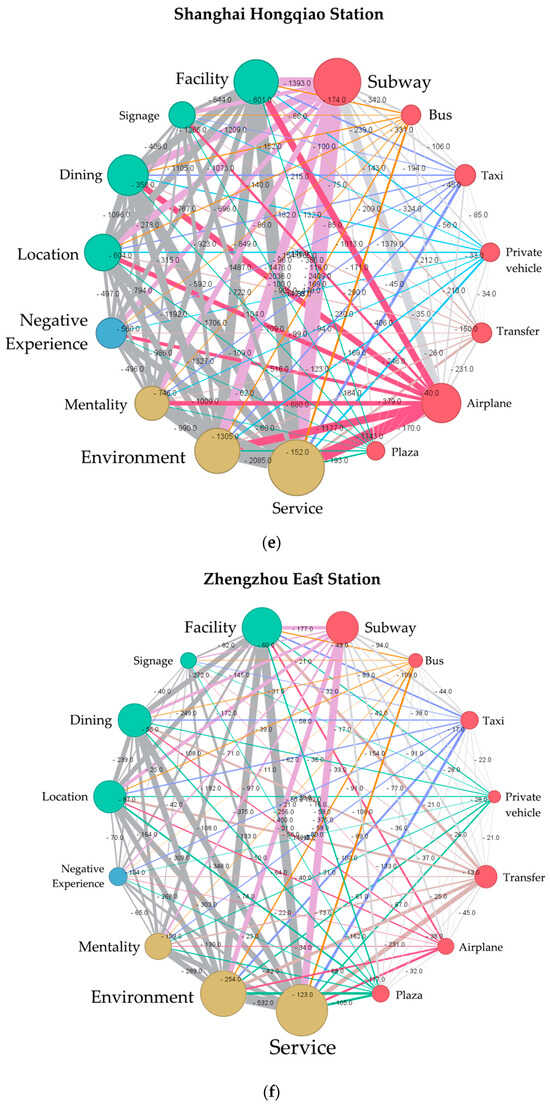
Figure 3.
Overall analysis of network reviews for six stations. (a) Beijing South Station; (b) Guangzhou South Station; (c) Hangzhou East Station; (d) Nanjing South Station; (e) Shanghai Hongqiao Station; (f) Zhengzhou East Station.
3.2. Negative Behavior
Through the correlation analysis of the #1 Transfer Mode Category and the #3 Negative Behavior Category, the specific types of negative behaviors associated with each transfer mode were examined. Thus, the #3 Negative Behavior Category was further subdivided into the following subcategories: #3011 Queued, #3012 Crowded, #3013 General Negative, #3014 Lost, #3015 Noisy, and #3016 Strenuous.
3.2.1. Passengers’ Highlighted Negative Behavior When Using Different Transfer Modes at Different Railway Stations
In response to research question 1.2 “Which negative behaviors are most frequently identified for various transfer modes?”, the following line graphics are made for comparison analysis. At Beijing South Station, as showen in Figure 4a, severe queuing is observed for taxis, but crowding is not significant. In-station transfers are characterized by both severe crowding and noise. Guangzhou South Station, which is presented by Figure 4b, the highest negative emotions are associated with transferring to airplanes, while both bus transfer and in-station transfer exhibit high levels of crowding. The surroundings of the plaza are perceived as particularly noisy. Drawing from Figure 4c, at Hangzhou East Station, severe queuing is observed for taxis, but instances of becoming lost are rare. In-station transfers are perceived as noisy and crowded while transferring to private vehicles is considered particularly challenging. According to Figure 4d, at Nanjing South Station, negative emotions are particularly severe during bus transfers, and queuing for taxis is prominent. Both bus transfers and in-station transfers are characterized by crowding, while in-station transfers are perceived as convenient but noisy. At Shanghai Hongqiao Station, as showen in Figure 4e, severe queuing is observed for taxis, while negative emotions are most pronounced during bus transfers, with expressions such as “bad”, “not good”, and “unreasonable” being common. Crowding is a significant concern during in-station transfers, and transferring to the plaza is perceived as particularly challenging. At For Zhengzhou East Station, as presented in Figure 4f, negative emotions are pronounced during transfers involving buses, private vehicles, and the plaza. While queuing for buses is relatively short, queuing for taxis is severe.
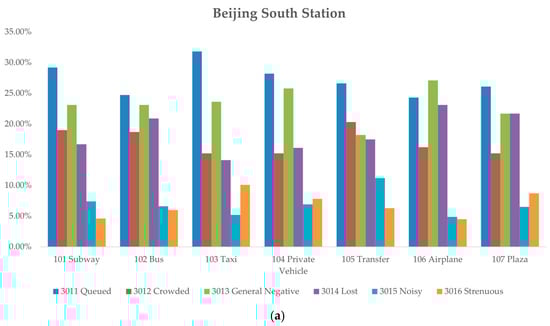
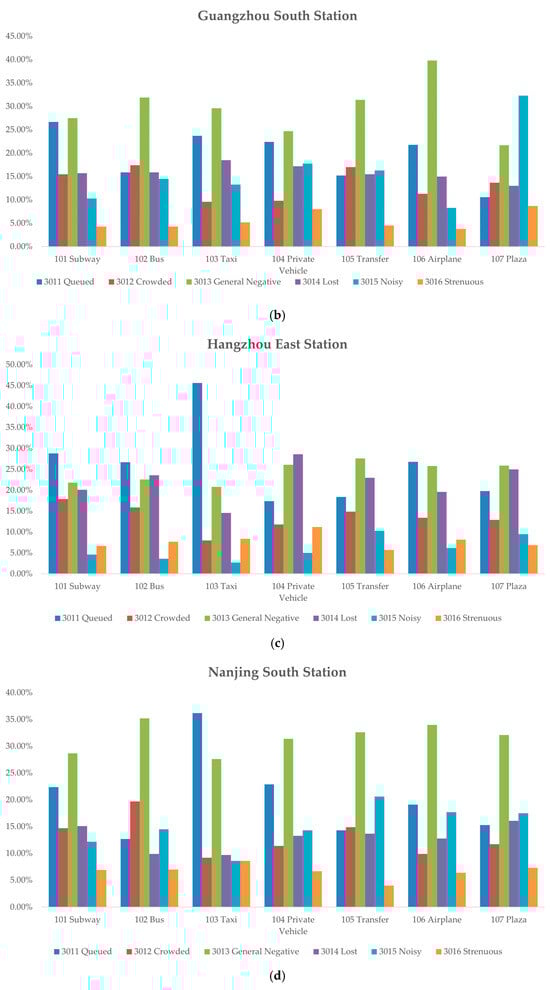
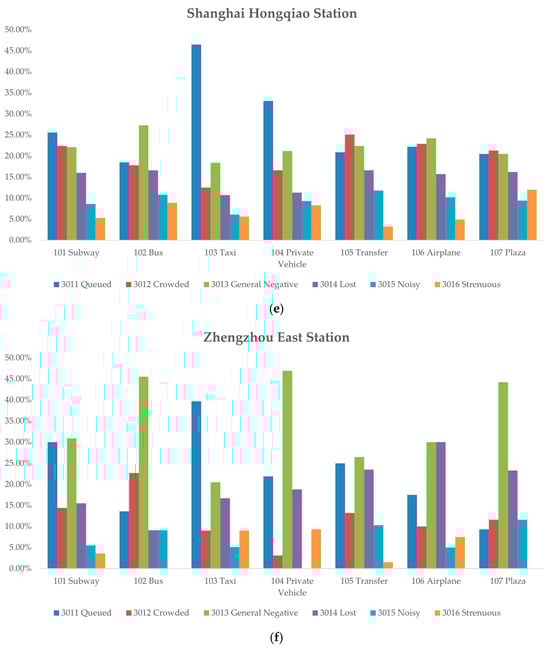
Figure 4.
Comparison of negative behavior correlation for six stations. (a) Beijing South Station; (b) Guangzhou South Station; (c) Hangzhou East Station; (d) Nanjing South Station; (e) Shanghai Hongqiao Station; (f) Zhengzhou East Station.
Compared across Figure 5, a comprehensive comparison of negative behaviors across the six stations reveals the following conclusions: According to Figure 5a, Shanghai Hongqiao Station experiences significant queuing and crowding during subway transfers, while Nanjing South Station shows high levels of queuing and general negative emotions. Zhengzhou East Station exhibits prominent negative emotions during bus transfers (Figure 5b). Guangzhou South Station has minimal queuing for taxis as presented in Figure 5c. Zhengzhou East Station shows pronounced negative emotions during private vehicle transfers(Figure 5d). As seen in Figure 5e, Nanjing South Station and Guangzhou South Station exhibit prominent negative emotions during in-station transfers. In-station transfers at Nanjing South Station are perceived as particularly noisy. At Guangzhou South Station, negative emotions are most pronounced during airplane transfers (Figure 5f). According to Figure 5f, negative emotions are particularly pronounced during plaza transfers at Zhengzhou East Station. Plaza transfers at Guangzhou South Station are perceived as particularly noisy.
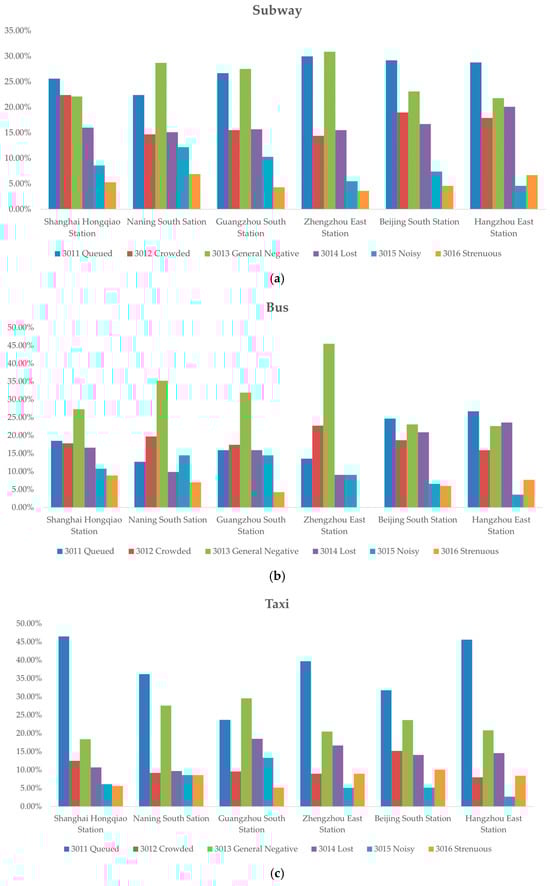
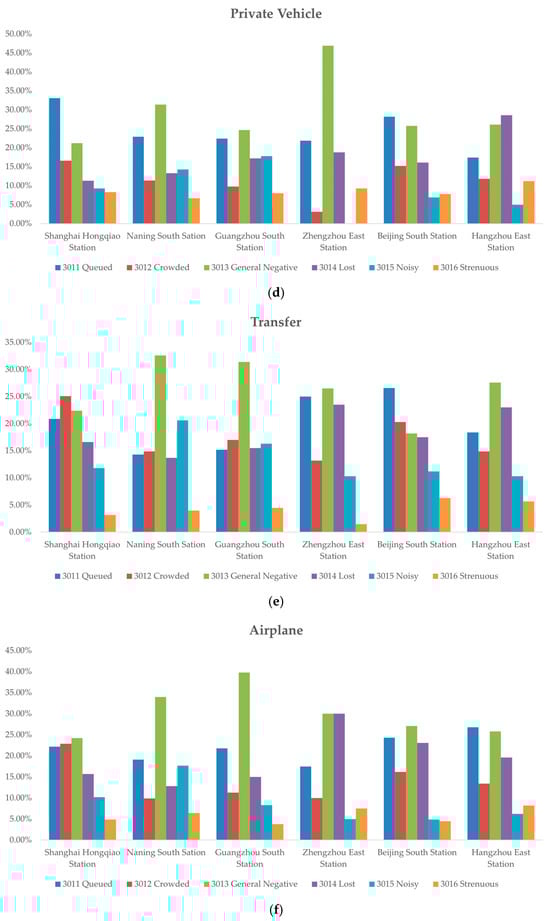
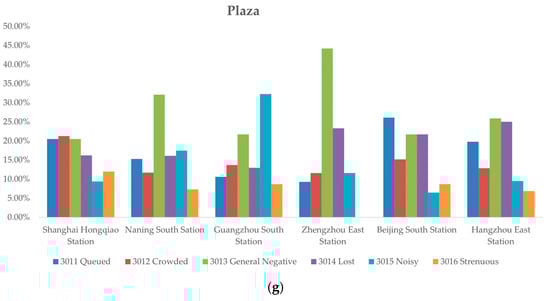
Figure 5.
Comparison of negative behavior correlation for different transfer targets at six stations. (a) Subway; (b) bus; (c) taxi; (d) private vehicle; (e) transfer; (f) airplane; (g) plaza.
3.2.2. Correlation between Negative Behavior in Stations and Transfer Behavior with Different Modes
In response to research question 2.2 “How do specific negative behaviors relate to passengers’ choice of transfer modes?”, we used Gephi to figure out the correlation between the transfer behavior by modes and detailed negative behavior at the station. Through the Gephi graph constructed based on the Transfer Mode Category and Negative Behavior Category, it can be observed across Figure 6 that the main negative emotions at the six stations mainly stem from queuing. In addition to this, there are instances of becoming lost at Shanghai Hongqiao, Nanjing South, and Beijing South stations, while Zhengzhou East Station exhibits relatively severe crowding.
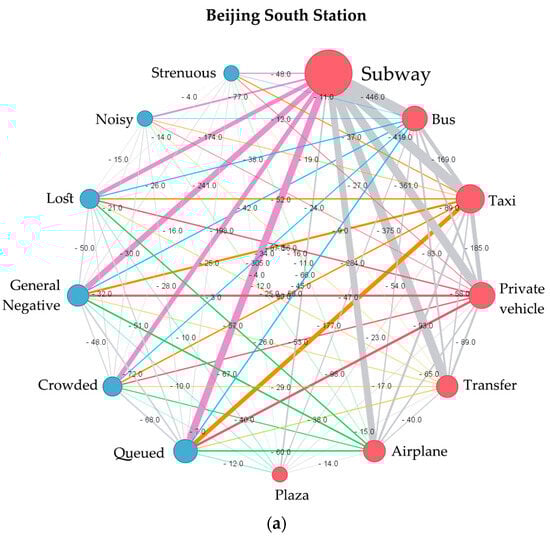
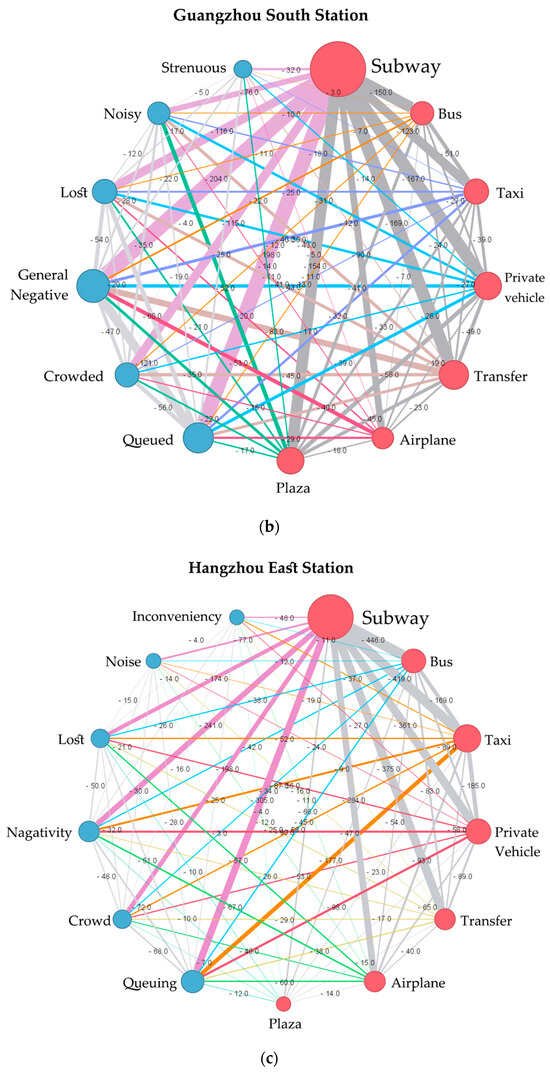
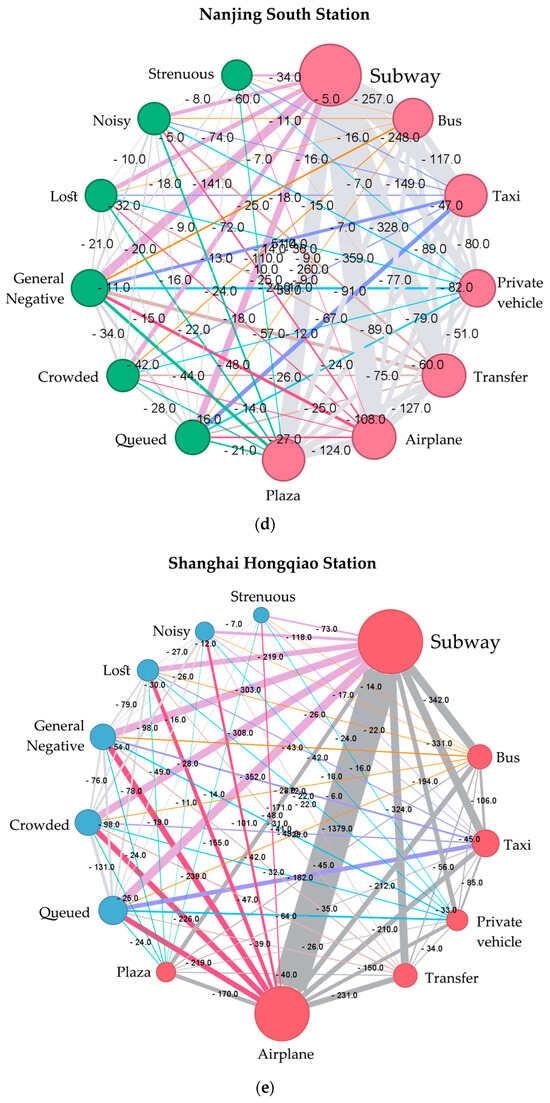
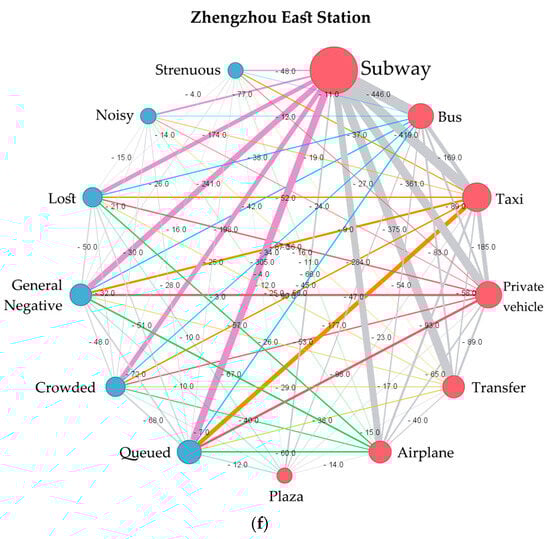
Figure 6.
Negative behavior analysis for six stations. (a) Beijing South Station; (b) Guangzhou South Station; (c) Hangzhou East Station; (d) Nanjing South Station; (e) Shanghai Hongqiao Station; (f) Zhengzhou East Station.
3.3. Behavior with Facilities
Through the association analysis of the #1 Transfer Objective Category and the #404 Facilities Category’s subcategories, the correlation between various factors and specific transfer types is examined. Then, the #404 Facilities Category is further divided into the following subcategories: #4041 Signage, #4042 Restrooms, #4043 Vertical Transportation, #4044 Luggage, and #4045 Rest Areas.
3.3.1. Passengers’ Attention on Station Facilities When Using Different Transfer Modes at Different Railway Stations
In response to research question 1.3 “What facilities do people pay attention to during their different transfer processes?”, the following line graphics are made for comparison analysis. For Beijing South Station, according to Fugire 7a, there is a high mention rate of vertical transportation when heading to the plaza, and there are virtually no rest areas when transferring to private vehiclesAt Guangzhou South Station, as shown in Figure 7b, passengers heading to buses and the plaza show a low mention rate for luggage; station transfers have a high mention rate for vertical transportation tools and a low mention rate for service equipment. At Hangzhou East Station, presented in Figure 7c, there is a high mention rate of signage for passengers transferring to taxis. As observed in Figure 7d, for Nanjing South Station, there is a high demand for signage for passengers transferring to buses and taxis. For Shanghai Hongqiao Station, as revealed by Figure 7e, there is a high degree of signage visibility in the plaza; passengers transferring to buses show low attention to luggage; and the mention rate of vertical transportation is lowest when transferring to taxis and highest when transferring within the same station. Refer to Figure 7f, for Zhengzhou East Station, the mention rate of rest areas for passengers transferring to buses is high, while the mention rate for facilities is low. Unlike other stations, the mention rate for luggage is very high for passengers transferring to buses.
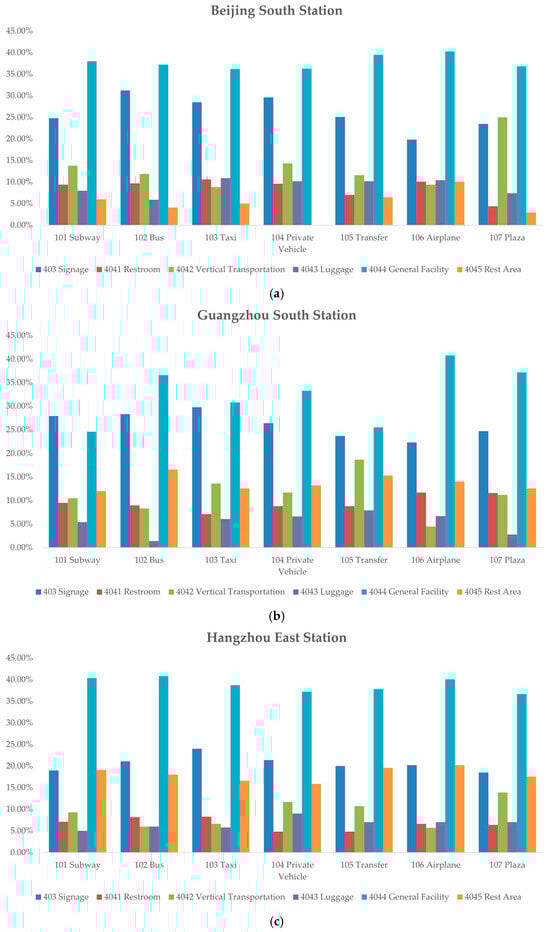
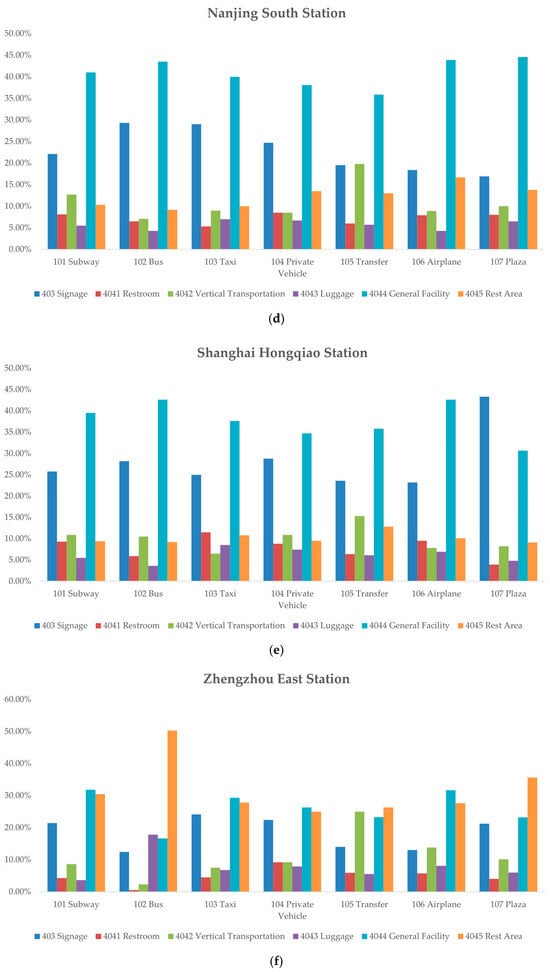
Figure 7.
Comparison of facility evaluation correlation at six stations. (a) Beijing South Station; (b) Guangzhou South Station; (c) Hangzhou East Station; (d) Nanjing South Station; (e) Shanghai Hongqiao Station; (f) Zhengzhou East Station.
Compared across Figure 8, a comprehensive comparison of facility evaluations across the six stations reveals the following conclusions: rest area mention rates for all transfer modes are higher at Zhengzhou East Station. According to Figure 8a, Guangzhou South Station exhibits lower mention rates for self-service equipment when transferring to the subway. As seen in Figure 8b, Beijing South Station shows lower mention rates for rest areas when transferring to private vehicles. According to Figure 8c, rest area mention rates are higher during taxi transfers at Hangzhou East Station. In Figure 8d, signage is highly mentioned at Shanghai Hongqiao Station when transferring to the plaza. In Figure 8e, higher mention rates for rest areas are observed at Hangzhou East Station during airplane transfers. Finally, according to Figure 8f, Shanghai Hongqiao Station demonstrates higher mention rates for signage when transferring to the plaza.
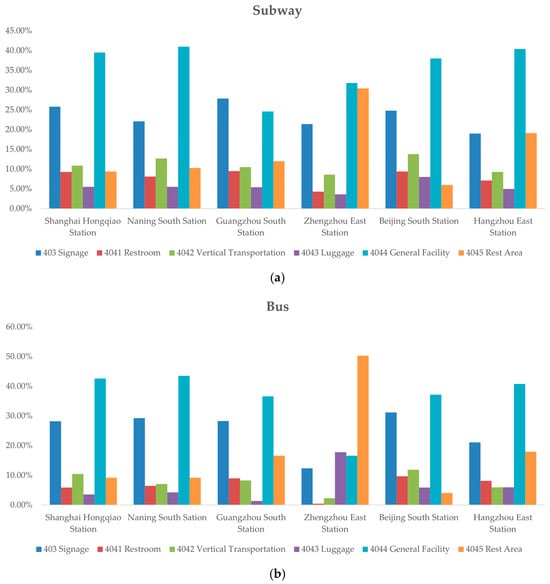
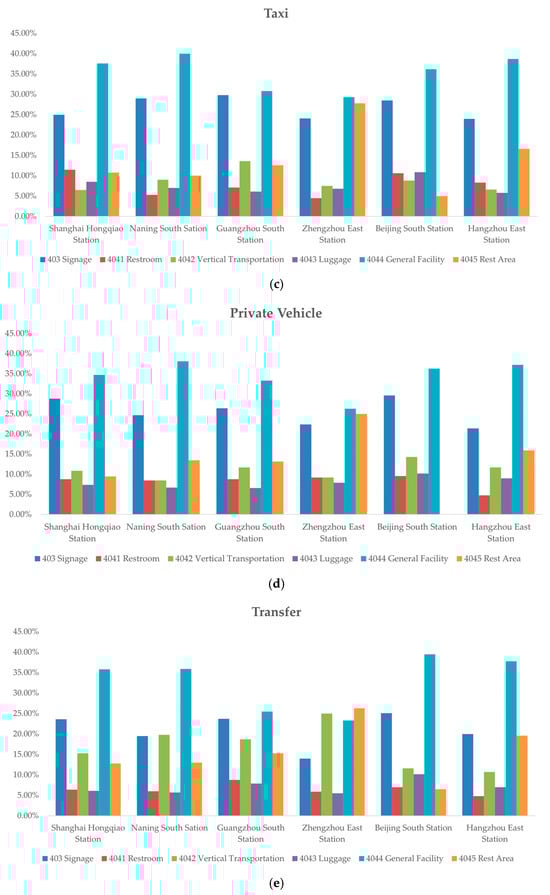
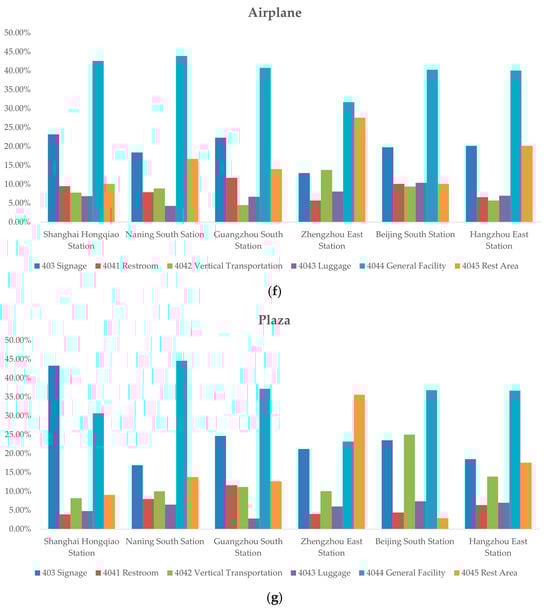
Figure 8.
Comparison of facility evaluation correlation for different transfer targets at six stations. (a) Subway; (b) bus; (c) taxi; (d) private vehicle; (e) transfer; (f) airplane; (g) plaza.
3.3.2. Correlation between Station Facility and Transfer Behavior with Different Modes
In response to research question 2.3 “How do facility features at transport hubs correlate with passengers’ behavior when using different transfer modes?”, we used Gephi to figure out the correlation between the behavior with modes and station facilities. As presented in Figure 9, analysis using the Gephi graph constructed based on transfer purpose and detailed object categories reveals that, except for Guangzhou South Station, there is a high correlation between transfer modes and luggage carried by passengers. Additionally, passengers at Guangzhou South Station show a higher level of interest in rest areas during transfers, while passengers at Hangzhou East Station exhibit a higher correlation with signage.
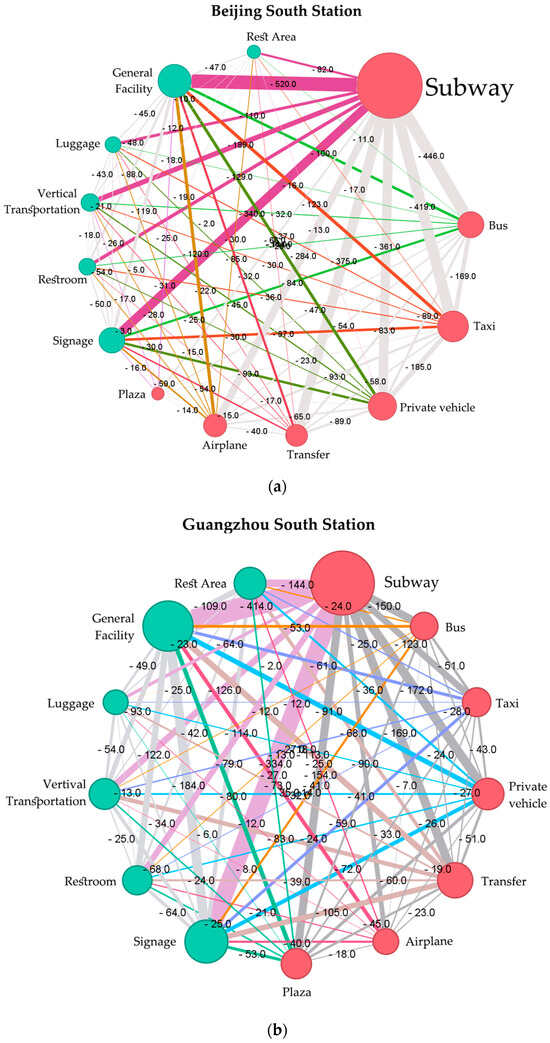
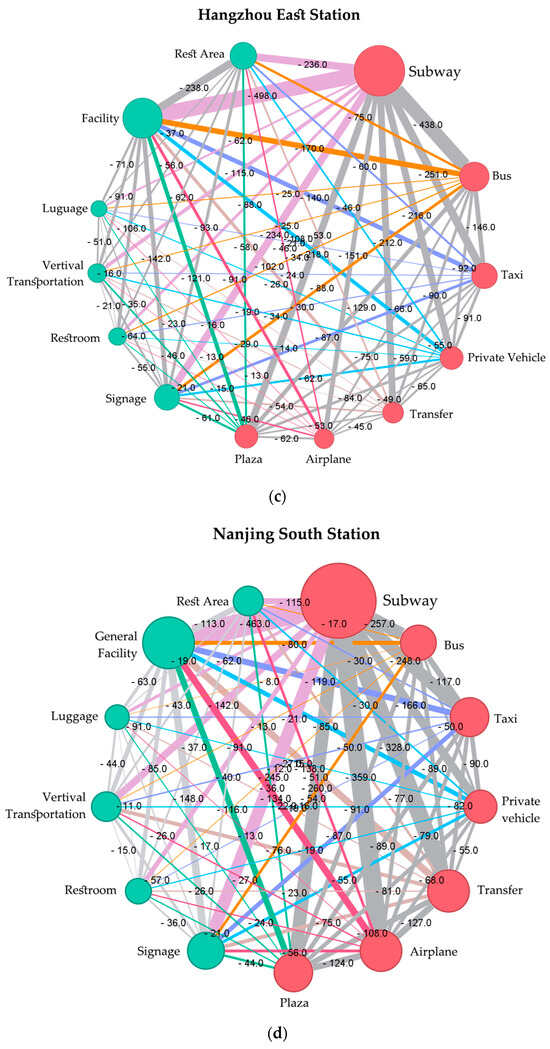
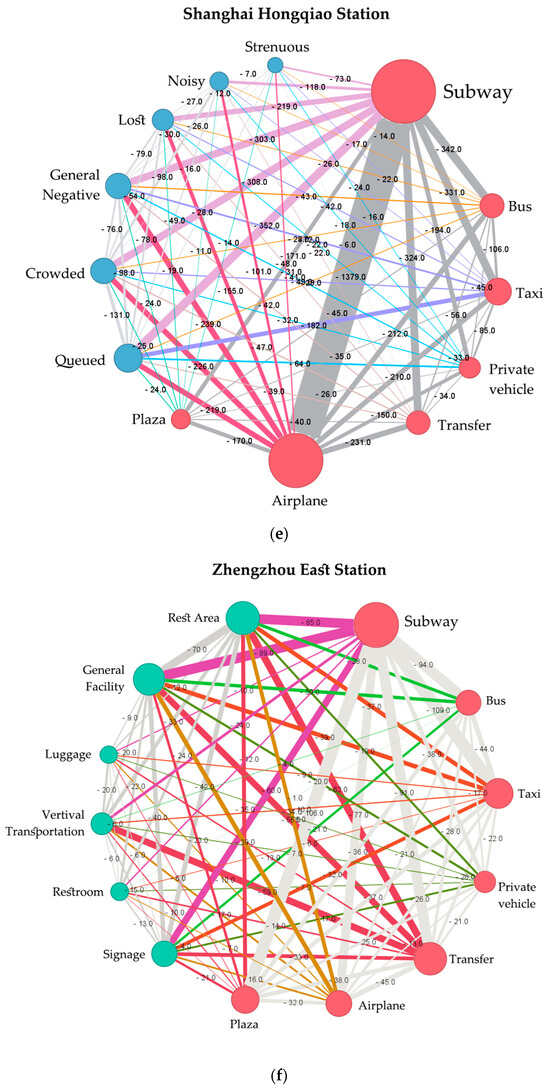
Figure 9.
Facility evaluation analysis of six stations. (a) Beijing South Station; (b) Guangzhou South Station; (c) Hangzhou East Station; (d) Nanjing South Station; (e) Shanghai Hongqiao Station; (f) Zhengzhou East Station.
4. Discussion
Despite China’s railway system actively pursuing the “Zero-Transfer” initiative with numerous measures aimed at enhancing passengers’ travel and transfer behaviors, there remain several factors that warrant attention in large-scale railway stations and are summarized in Figure 10, with green labeling positive factors and red labeling negative factors. Overall, Nanjing South Station and Guangzhou South Station are rated more positively, while Zhengzhou East Station is rated relatively poorly. Among them, Nanjing South Station has an excellent signage system. According to the analysis, the negative emotions generated by passengers during transfers have a weak correlation with transfer distances. The main source of negative emotions is queueing behavior, which is strongly correlated with the facilities provided by the station. Nanjing South Station, Guangzhou South Station, and Shanghai Hongqiao Station, which have relatively rich service facilities, show better overall ratings, especially Nanjing South Station, where positive evaluations are concentrated on information facilities such as “signage”.
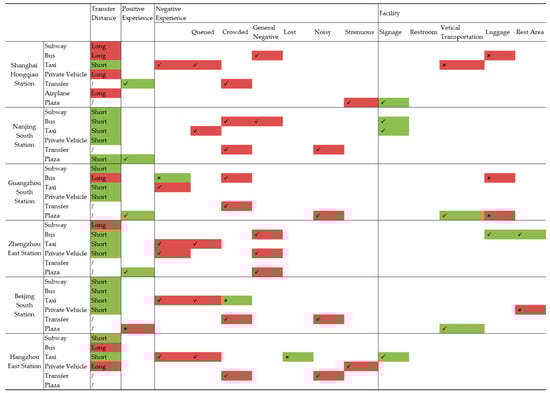
Figure 10.
Summary of transfer behaviors by transfer mode and station.
It can be observed that the transfer distances for all six stations are within acceptable ranges for passengers. For instance, the longest transfer distance at Zhengzhou East Station is 515 m, yet there are hardly any negative evaluations associated with subway transfers. Passenger satisfaction is related to various factors including transportation distance, environmental conditions, individual differences, and psychological perceptions. Transfer distance is generally considered an important factor influencing emotional evaluations, as demonstrated by Cheng (2018) who modeled passenger satisfaction with bus transfer service quality and identified fare discounts and transfer distance as crucial factors [8]. However, Li (2023) highlighted that assessing the accessibility of public bus station areas based on walking perception involves considering not only objective distances but also pedestrians’ environmental and psychological perceptions. Pedestrians may be willing to spend more time avoiding obstacles [9] and take rest at rest areas. This suggests that pedestrians may not only consider the shortest transfer routes but also need to pay attention to the quality of service and facility convenience during transfers.
Taking Shanghai Hongqiao Station as an example, the shortest transfer to taxis is associated with more negative evaluations. A commonality among the six stations is that there tends to be significant queueing behavior when transferring to taxis, which affects overall emotional evaluations. This is consistent with previous research, as prolonged queueing can lead to impatience and frustration, thereby reducing satisfaction [31,32]. Additionally, noise and crowding behaviors tend to occur during station transfers, possibly because each platform for station transfers typically has only one accessible elevator, resulting in excessive congregation of pedestrian traffic. These subjective environmental elements are overseen by previous studies. There is also a notable emphasis on luggage when transferring to buses, as opposed to subway transfers, as all bus transfers typically require disembarking and waiting, necessitating careful consideration of equipment and guidance services. Finally, the richness of facilities and guidance signage contributes to higher station ratings, possibly because ample facilities and clear guidance signage can enhance passengers’ overall behavior at the station [33]. Clear guidance signage helps them find the right direction, reducing anxiety and discomfort while increasing efficiency and convenience [34]. Moreover, aligning with the conclusion from Döge et al. (2020), adequate facilities and clear guidance signage reflect the station managers’ emphasis on service quality [3].
Therefore, when optimizing the transfer process at stations, particular attention should be paid to diversion measures during the station transfer phase. Since queueing behavior easily triggers negative passenger emotions, it may be worth considering more effective queue management measures, such as increasing signage and guidance in queue areas, providing more queueing seats to alleviate passenger discomfort while waiting, or utilizing technology to implement queue reservations and diversion to mitigate the negative impact of queueing. Based on passenger needs and evaluations, existing facilities can be optimized and improved, such as adding more rest areas, providing more comfortable and convenient restroom facilities, improving station navigation systems, etc., to enhance passengers’ overall behavior and satisfaction. To reduce instances of passengers becoming lost or feeling lost at the station, further optimization of guidance signage to make it clearer and more comprehensive, as well as considering increasing manual guides at key locations to provide personalized assistance and guidance, can be explored. Utilizing big data technology and real-time monitoring systems to analyze and optimize traffic flow within stations, adjusting vehicle operation plans, and optimizing transfer routes and station layouts in a timely manner can improve the operational efficiency of the transportation system and the travel behavior of passengers. Establishing a comprehensive service quality monitoring system to regularly assess and monitor the service quality of stations, promptly identify problems, and take measures for improvement is essential to ensure the overall satisfaction and behavior quality of passengers at stations.
5. Conclusions
This study critically examined the transfer modes at railway transportation hubs, revealing that while transfer distance has been traditionally viewed as a primary factor affecting passenger satisfaction, it is actually the quality of the transfer experience that holds greater significance. This insight shifts our perspective from merely optimizing distances to enhancing the quality of interaction within these spaces.
Firstly, contrary to the common belief that transfer distance primarily dictates passenger satisfaction, our findings reveal that queuing, facility richness, and guidance signage have a more profound impact on the emotional evaluations of passengers. These factors significantly influence the physiological and safety in Maslow’s hierarchy of needs, where passengers seek comfort and security in their transit environments. For instance, effective signage meets safety needs by reducing confusion and stress, while adequate facility richness addresses physiological needs by ensuring comfort and convenience during travel. This shift in understanding emphasizes the necessity of designing transportation hubs that cater comprehensively to these fundamental human needs, thereby improving the overall transfer experience and passenger satisfaction.
Secondly, the Gephi visualizations reveal distinct patterns in how various station features correlate with passenger perceptions of their transfer experiences. Positively, features like subway accessibility and rest areas tend to enhance passenger satisfaction by providing convenience and comfort, aligning with physiological and safety needs in Maslow’s hierarchy. These elements create a more pleasant and less stressful environment, significantly contributing to positive experiences. Conversely, factors such as queuing and crowd conditions are predominantly linked with negative transfer experiences. These conditions directly impact passengers’ physiological stress and perception of safety, detracting significantly from the overall satisfaction. Furthermore, poor signage and insufficient general facilities exacerbate the negative experiences by increasing confusion and discomfort, making navigation and waiting times more challenging and stressful.
Finally, this study elucidates that the transfer process is inherently complex, involving spatial dynamics, behaviors, and perceptions. While minimizing physical distances can save physical energy, it can also inadvertently limit the potential for actions and experiences during the transfer. Consequently, future improvements should focus on optimizing these aspects—space, behavior, and perception—to enhance the transfer experience effectively. Although the physical distance of the transfer is fixed, the integration of rest areas within these spaces offers the potential for enhancing passenger comfort. This also presents an opportunity for future studies to further explore and observe how these enhancements can elevate the overall quality of transfer experiences.
These insights not only challenge traditional assumptions about passengers’ transfer behavior at transportation hubs but also provide crucial guidance for future improvements aimed at creating more responsive and satisfying multimodal transportation environments.
Author Contributions
Z.Z., M.W. and N.W.: Conceptualization, Formal Analysis, Resources, Data curation, Writing—original draft preparation; X.G.: Methodology, Validation, Formal analysis, Investigation, writing—review and editing. All authors have read and agreed to the published version of the manuscript.
Funding
This research received no external funding.
Institutional Review Board Statement
In consultation with the University of Pennsylvania, it was determined that our study, involving only anonymized and publicly available social media data, does not require Institutional Review Board oversight. According to University of Pennsylvania IRB Guidance: "Use of social media data may or may not be human subjects research that requires IRB review. If the data that you will access is publicly available (e.g., from publicly available accounts or platforms that are publicly available), it is not human subjects research because you are not accessing private information". We confirmed that (1) the text data we collected online is anonymous and does not include personal identifiers such as age, gender, or race; (2) we exclusively analyzed publicly available text data that was voluntarily provided by the social media users, and this data does not include images or any other information that might reveal the users’ identities; (3) our analysis was conducted on an aggregate basis and did not target any specific group of social media user. This decision adheres to the guidelines that do not classify the use of such data as human subjects research, thus exempting it from review. Ethical review and approval were specifically waived for this study. The study was conducted in accordance with the Declaration of Helsinki.
Informed Consent Statement
Not Applicable.
Data Availability Statement
The data used to support the findings of this study can be made available by the corresponding author upon request.
Conflicts of Interest
Author Na Wang was employed by the company SWA Group. The remaining authors declare that the research was conducted in the absence of any commercial or financial relationships that could be construed as a potential conflict of interest.
References
- Liu, T.-L.; Huang, H.-J.; Yang, H.; Zhang, X. Continuum Modeling of Park-and-Ride Services in a Linear Monocentric City with Deterministic Mode Choice. Transp. Res. Part B Methodol. 2009, 43, 692–707. [Google Scholar] [CrossRef]
- Wan, Z.; Liu, X. Chinese railway transportation: Opportunity and challenge. In Proceedings of the Transportation Research Board Annual Meeting, Washington, DC, USA, 11–15 January 2009; Volume 1. [Google Scholar]
- Xinhua. China Unveils Guidelines on Developing Comprehensive Transport Network. Available online: https://english.www.gov.cn/policies/latestreleases/202102/24/content_WS6036593dc6d0719374af9866.html (accessed on 17 April 2024).
- Döge, N.; Abraham, M. Towards Seamless Travelling in Europe—Demand and Approaches to Promote Multimodal Traveling Within Europe. In Towards User-Centric Transport in Europe 2: Enablers of Inclusive, Seamless and Sustainable Mobility; Müller, B., Meyer, G., Eds.; Springer International Publishing: Cham, Switzerland, 2020; pp. 240–253. ISBN 978-3-030-38028-1. [Google Scholar]
- Conticelli, E.; Gobbi, G.; Saavedra Rosas, P.I.; Tondelli, S. Assessing the Performance of Modal Interchange for Ensuring Seamless and Sustainable Mobility in European Cities. Sustainability 2021, 13, 1001. [Google Scholar] [CrossRef]
- Raghunathan, A.U.; Bergman, D.; Hooker, J.N.; Serra, T.; Kobori, S. Seamless Multimodal Transportation Scheduling. INFORMS J. Comput. 2024, 36, 336–358. [Google Scholar] [CrossRef]
- Vennelakanti, R.; Sankaranarayanasamy, M.; Saeedi, R.; Vishwakarma, R.; Singh, P.; Sun, J.; Akiyama, Y.; Adachi, H. Multimodal Mobility Framework: Towards Seamless Mobility Behavior. In Proceedings of the 2021 Joint Rail Conference, 2021 Joint Rail Conference, Virtual, 20–21 April 2021; American Society of Mechanical Engineers Digital Collection: New York, NY, USA, 2021. [Google Scholar]
- Krygsman, S.; Dijst, M.; Arentze, T. Multimodal Public Transport: An Analysis of Travel Time Elements and the Interconnectivity Ratio. Transp. Policy 2004, 11, 265–275. [Google Scholar] [CrossRef]
- Cheng, X.; Cao, Y.; Huang, K.; Wang, Y. Modeling the Satisfaction of Bus Traffic Transfer Service Quality at a High-Speed Railway Station. J. Adv. Transp. 2018, 2018, e7051789. [Google Scholar] [CrossRef]
- Li, L.; Gao, T.; Wang, Y.; Jin, Y. Evaluation of Public Transportation Station Area Accessibility Based on Walking Perception. Int. J. Transp. Sci. Technol. 2023, 12, 640–651. [Google Scholar] [CrossRef]
- Liu, L.F.; Wang, W. Analysis of Urban Rail Transit Seamless Transfer Standard. MATEC Web of Conferences. EDP Sci. 2016, 81, 03002. [Google Scholar]
- Duca, G.; Trincone, B.; Bagamanova, M.; Meincke, P.; Russo, R.; Sangermano, V. Passenger Dimensions in Sustainable Multimodal Mobility Services. Sustainability 2022, 14, 12254. [Google Scholar] [CrossRef]
- Chen, M.; Cai, Y.; Guo, S.; Sun, R.; Song, Y.; Shen, X. Evaluating Implied Urban Nature Vitality in San Francisco: An Interdisciplinary Approach Combining Census Data, Street View Images, and Social Media Analysis. Urban For. Urban Green. 2024, 95, 128289. [Google Scholar] [CrossRef]
- Lee, M.Y.; Sohn, J. Transfer Impedence of Trip Chain with a Railway Mode Embedded—Using Seoul Metroplitan Transportation Card Data. KSCE J. Civ. Environ. Eng. Res. 2016, 36, 1083–1091. [Google Scholar] [CrossRef]
- Liu, L.; Miller, H.J. Measuring Risk of Missing Transfers in Public Transit Systems Using High-Resolution Schedule and Real-Time Bus Location Data. Urban Stud. 2021, 58, 3140–3156. [Google Scholar] [CrossRef]
- Pu, Z.; Zhu, M.; Li, W.; Cui, Z.; Guo, X.; Wang, Y. Monitoring Public Transit Ridership Flow by Passively Sensing Wi-Fi and Bluetooth Mobile Devices. IEEE Internet Things J. 2021, 8, 474–486. [Google Scholar] [CrossRef]
- Li, S.; Lyu, D.; Liu, X.; Tan, Z.; Gao, F.; Huang, G.; Wu, Z. The Varying Patterns of Rail Transit Ridership and Their Relationships with Fine-Scale Built Environment Factors: Big Data Analytics from Guangzhou. Cities 2020, 99, 102580. [Google Scholar] [CrossRef]
- Zhu, L.; Yu, F.R.; Wang, Y.; Ning, B.; Tang, T. Big Data Analytics in Intelligent Transportation Systems: A Survey. IEEE Trans. Intell. Transp. Syst. 2019, 20, 383–398. [Google Scholar] [CrossRef]
- Li, X.; Zhou, J.; Pedrycz, W. Linking Granular Computing, Big Data and Decision Making: A Case Study in Urban Path Planning. Soft Comput. 2020, 24, 7435–7450. [Google Scholar] [CrossRef]
- Wu, X.; Lu, Y.; Lin, Y.; Yang, Y. Measuring the Destination Accessibility of Cycling Transfer Trips in Metro Station Areas: A Big Data Approach. Int. J. Environ. Res. Public Health 2019, 16, 2641. [Google Scholar] [CrossRef] [PubMed]
- Liu, W.-K.; Yen, C.-C. Optimizing Bus Passenger Complaint Service through Big Data Analysis: Systematized Analysis for Improved Public Sector Management. Sustainability 2016, 8, 1319. [Google Scholar] [CrossRef]
- Jing, Z.; Bai, W. Sign Optimization Model for Rail Transit: A Big Data Approach. IEEE Access 2020, 8, 81660–81673. [Google Scholar] [CrossRef]
- Gao, H.; Liu, S.; Cao, G.; Zhao, P.; Zhang, J.; Zhang, P. Big Data Analysis of Beijing Urban Rail Transit Fares Based on Passenger Flow. IEEE Access 2020, 8, 80049–80062. [Google Scholar] [CrossRef]
- Abdul-Rahman, M.; Chan, E.H.W.; Wong, M.S.; Irekponor, V.E.; Abdul-Rahman, M.O. A Framework to Simplify Pre-Processing Location-Based Social Media Big Data for Sustainable Urban Planning and Management. Cities 2021, 109, 102986. [Google Scholar] [CrossRef]
- Mounica, B.; Lavanya, K. Feature Selection Method on Twitter Dataset with Part-of-Speech (PoS) Pattern Applied to Traffic Analysis. Int. J. Syst. Assur. Eng. Manag. 2024, 15, 110–123. [Google Scholar] [CrossRef]
- Zhu, D.; Du, H.; Sun, Y.; Cao, N. Research on Path Planning Model Based on Short-Term Traffic Flow Prediction in Intelligent Transportation System. Sensors 2018, 18, 4275. [Google Scholar] [CrossRef]
- Liu, R.; Xiao, J. Factors Affecting Users’ Satisfaction with Urban Parks through Online Comments Data: Evidence from Shenzhen, China. Int. J. Environ. Res. Public Health 2021, 18, 253. [Google Scholar] [CrossRef] [PubMed]
- Shengyin, W.; Yu, L.I.U.; Zedong, C.; Li, S.H.I.; Jing, Z. Representing Multiple Urban Places’ Footprints from Dianping.Com Data. Acta Geod. Cartogr. Sin. 2018, 47, 1105. [Google Scholar] [CrossRef]
- Xiang, L.; Zheng, X.; Zhang, K.Z.K.; Lee, M.K.O. Understanding Consumers’ Continuance Intention to Contribute Online Reviews. Ind. Manag. Data Syst. 2018, 118, 22–40. [Google Scholar] [CrossRef]
- Zhang, B.; Song, Y.; Liu, D.; Zeng, Z.; Guo, S.; Yang, Q.; Wen, Y.; Wang, W.; Shen, X. Descriptive and Network Post-Occupancy Evaluation of the Urban Public Space through Social Media: A Case Study of Bryant Park, NY. Land 2023, 12, 1403. [Google Scholar] [CrossRef]
- Zhai, S.; Xu, X.; Yang, L.; Zhou, M.; Zhang, L.; Qiu, B. Mapping the Popularity of Urban Restaurants Using Social Media Data. Appl. Geogr. 2015, 63, 113–120. [Google Scholar] [CrossRef]
- Wan, T.; Lu, W.; Sun, P. Equity Impacts of the Built Environment in Urban Rail Transit Station Areas from a Transit-Oriented Development Perspective: A Systematic Review. Environ. Res. Commun. 2023, 5, 092001. [Google Scholar] [CrossRef]
- Lin, D.; De Vos, J.; Maruyama, T.; Bobylev, N.; Cui, J. Metro-Related Transfers: A Review of Recent Literature. J. Urban Plan. Dev. 2022, 148, 03122002. [Google Scholar] [CrossRef]
- Yang, M.; Zhao, J.; Wang, W.; Liu, Z.; Li, Z. Metro Commuters’ Satisfaction in Multi-Type Access and Egress Transferring Groups. Transp. Res. Part D Transp. Environ. 2015, 34, 179–194. [Google Scholar] [CrossRef]


Disclaimer/Publisher’s Note: The statements, opinions and data contained in all publications are solely those of the individual author(s) and contributor(s) and not of MDPI and/or the editor(s). MDPI and/or the editor(s) disclaim responsibility for any injury to people or property resulting from any ideas, methods, instructions or products referred to in the content. |
© 2024 by the authors. Licensee MDPI, Basel, Switzerland. This article is an open access article distributed under the terms and conditions of the Creative Commons Attribution (CC BY) license (https://creativecommons.org/licenses/by/4.0/).