
Comprehensive Comparative Analysis of Morphology Indexes for Solar Radiation Acquisition Potential in Lhasa Urban Residential Area


Abstract
1. Introduction
2. Existing Research
3. Research Method
- Residential area archetypes characterization and parameterization. The morphological characteristics and parameters of typical residential areas were extracted and summarized in Lhasa. They were then used as the benchmark for establishing the experimental parametric models. Then residential area morphology indexes and SRA indexes of high correlation were identified. We then utilized Rhinoceros 7.0 modeling software and its parametric modeling platform Grasshopper with Ladybug 1.4.0 to model the residential area and simulate solar radiation.
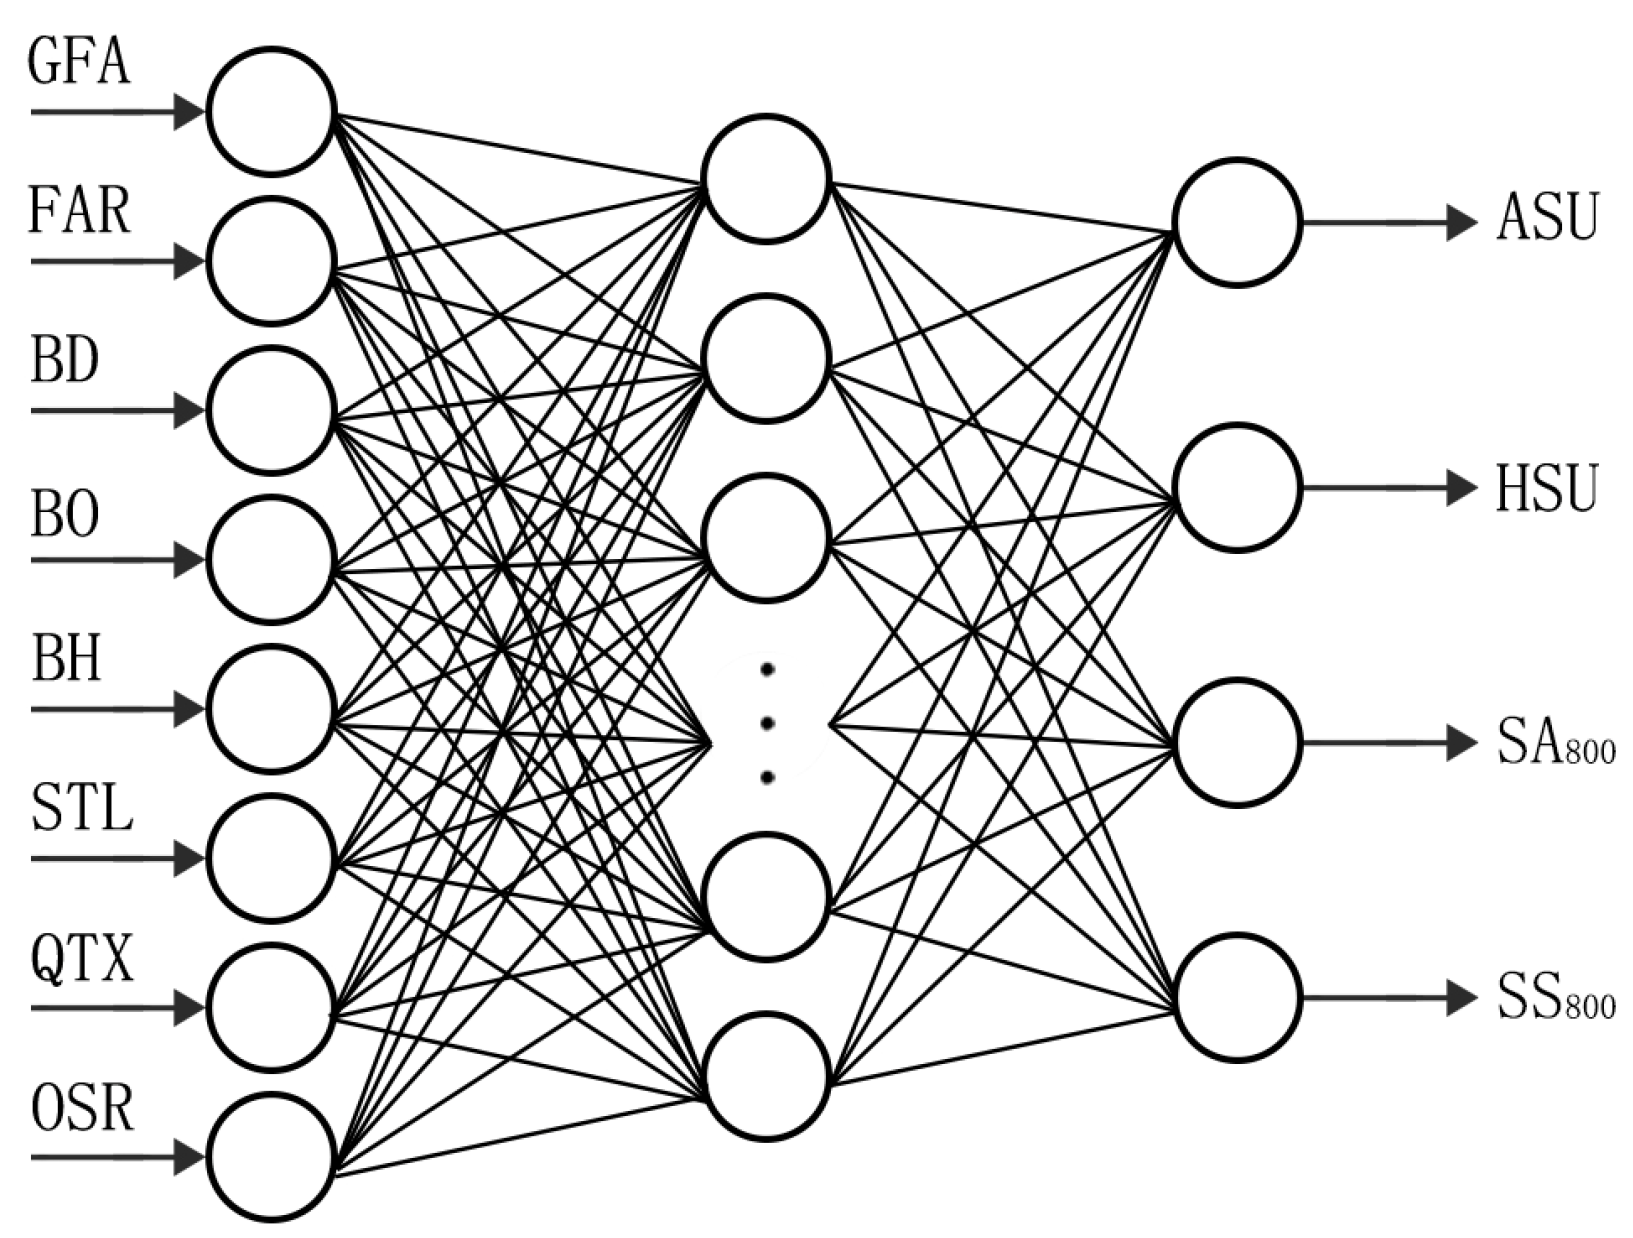
- BP neural network constructing. A BP neural network model with morphology indexes as the input layer and SRA indexes as the output layer was constructed. To train and test the BP neural network, the morphology indexes dataset of actual case residential areas and ideal homogeneous residential areas and the corresponding SRA index dataset were used. During training, the neural network iteratively adjusts its parameters (weights and biases) based on the training set to minimize the difference between predicted and actual SRA indexes.
- Comprehensive comparative analysis. Once the BP neural network is trained and validated, it serves as a prediction model for estimating SRA based on morphology indexes for Lhasa residential areas. A large amount of data was obtained from several calculations using the predictive model. Statistical methods were then used to compare the sensitivity of multiple core morphology indexes such as the floor area ratio, building density, building height, building layout, and building orientation to the effects of SRA.
4. Indexes Determination
5. Sample Set of Morphology Models
5.1. Actual Case Residential Areas Dataset
5.2. Ideal Homogeneous Residential Areas Dataset
6. Prediction Model
6.1. Basis and Principle
6.2. Structure and Training
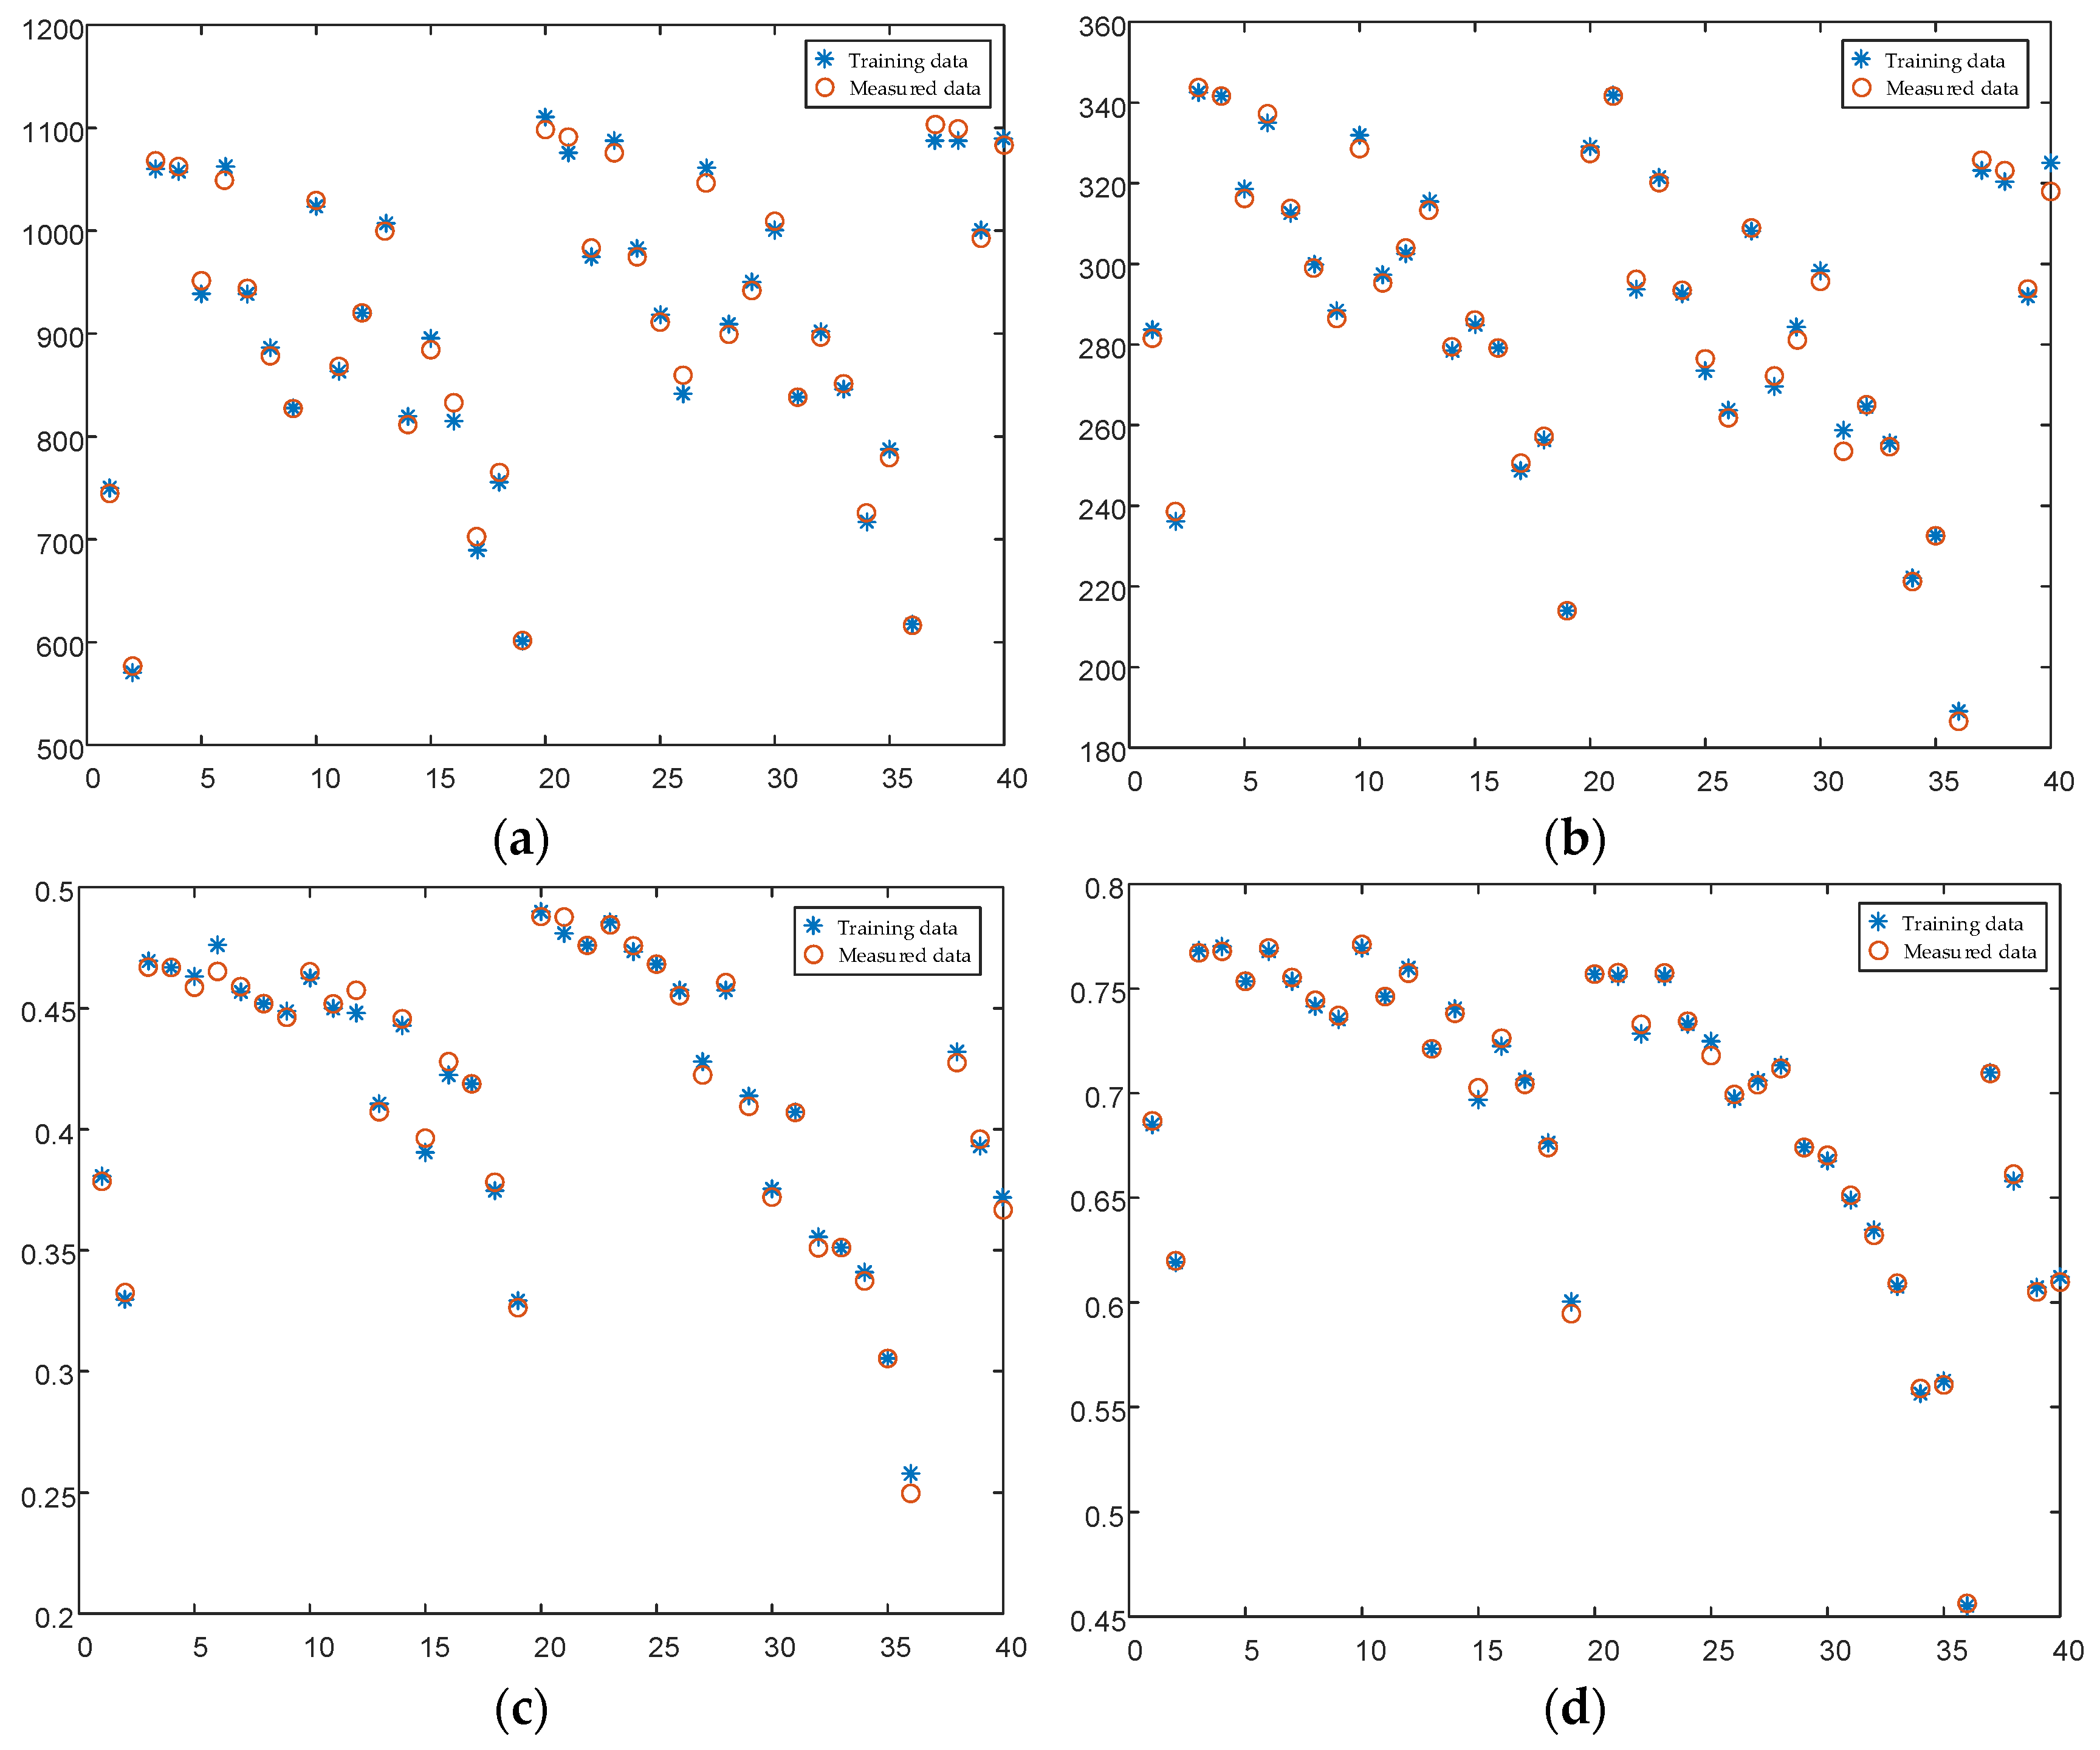
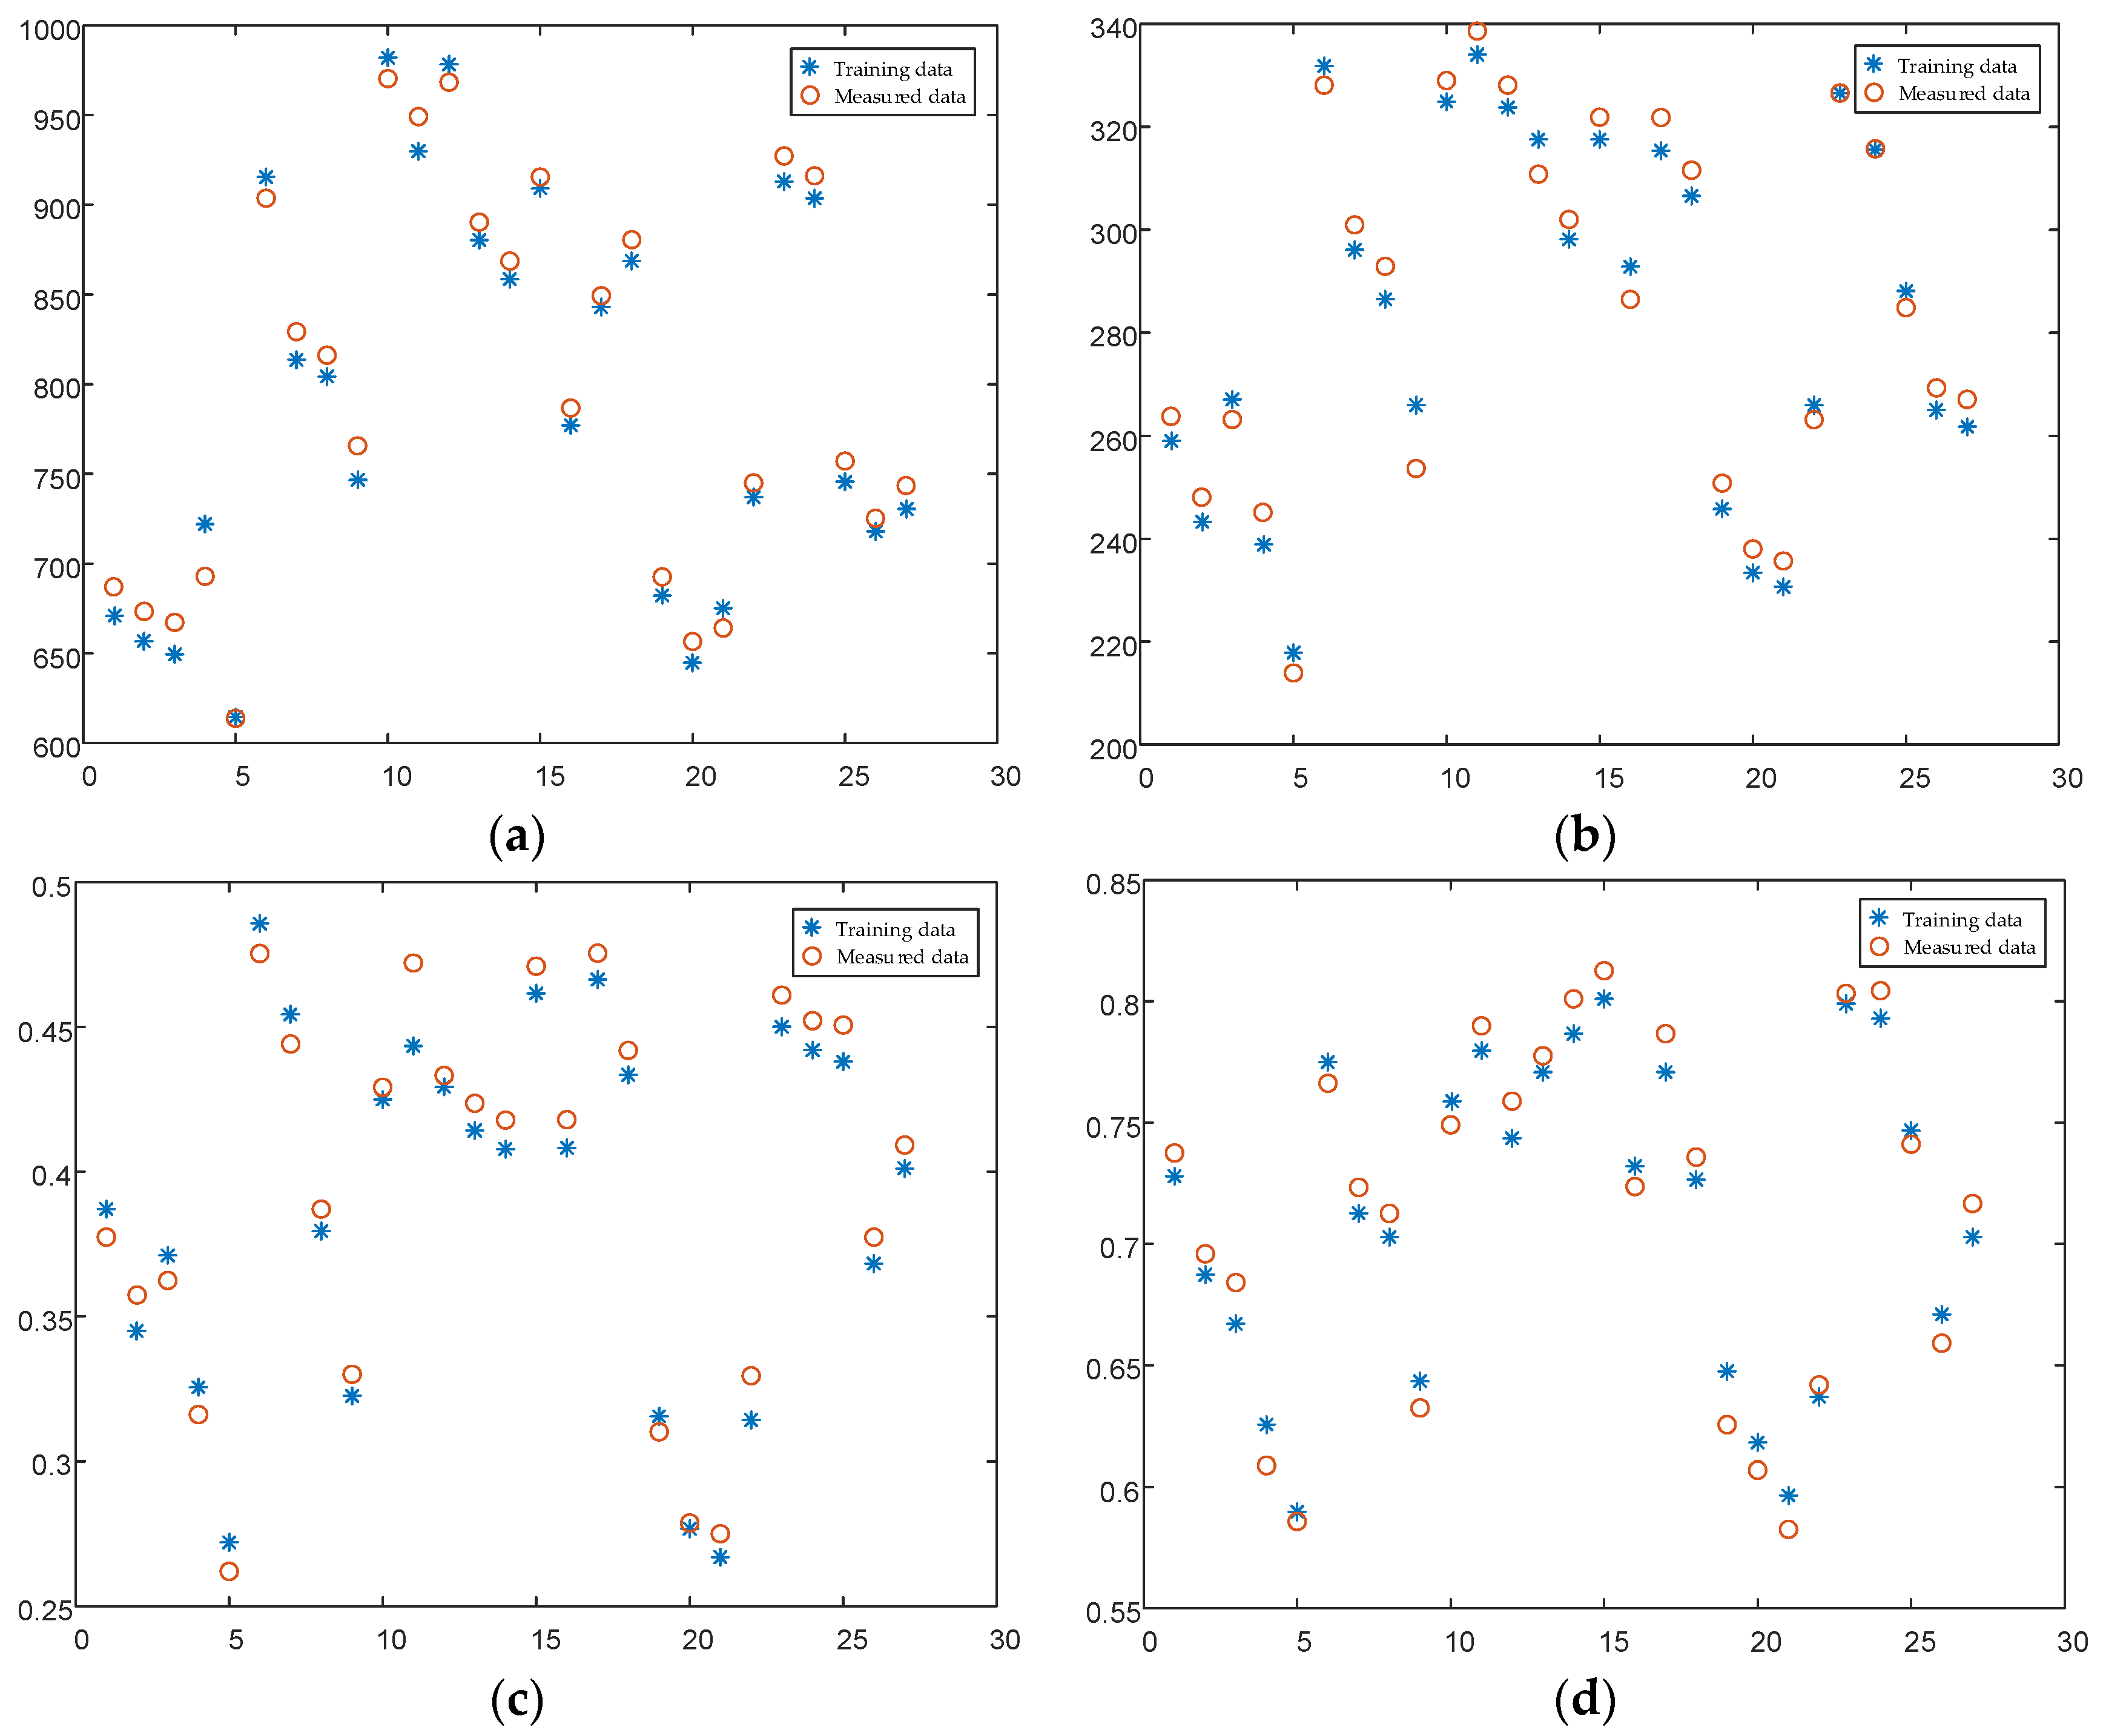
6.3. Verification of the Model
7. Comparative Analysis of the Indexes
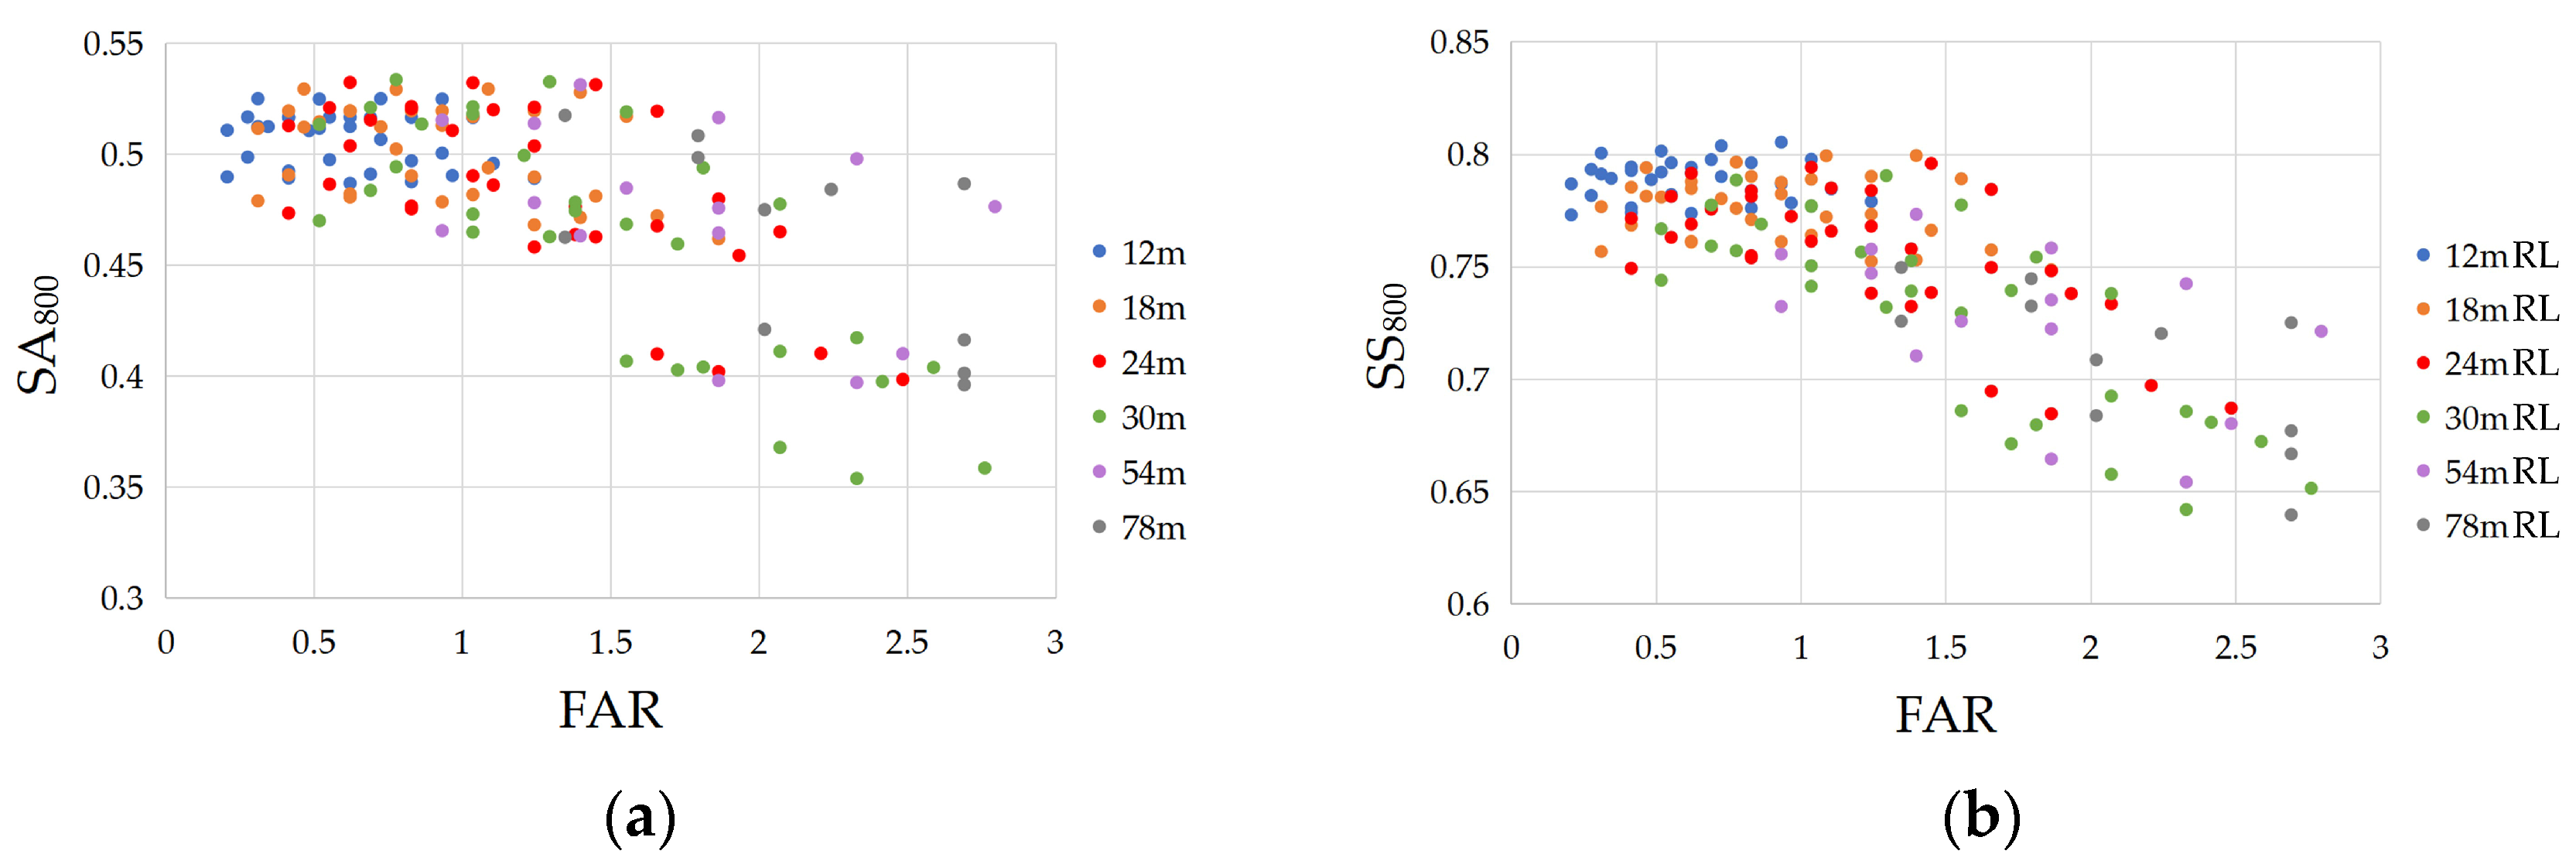
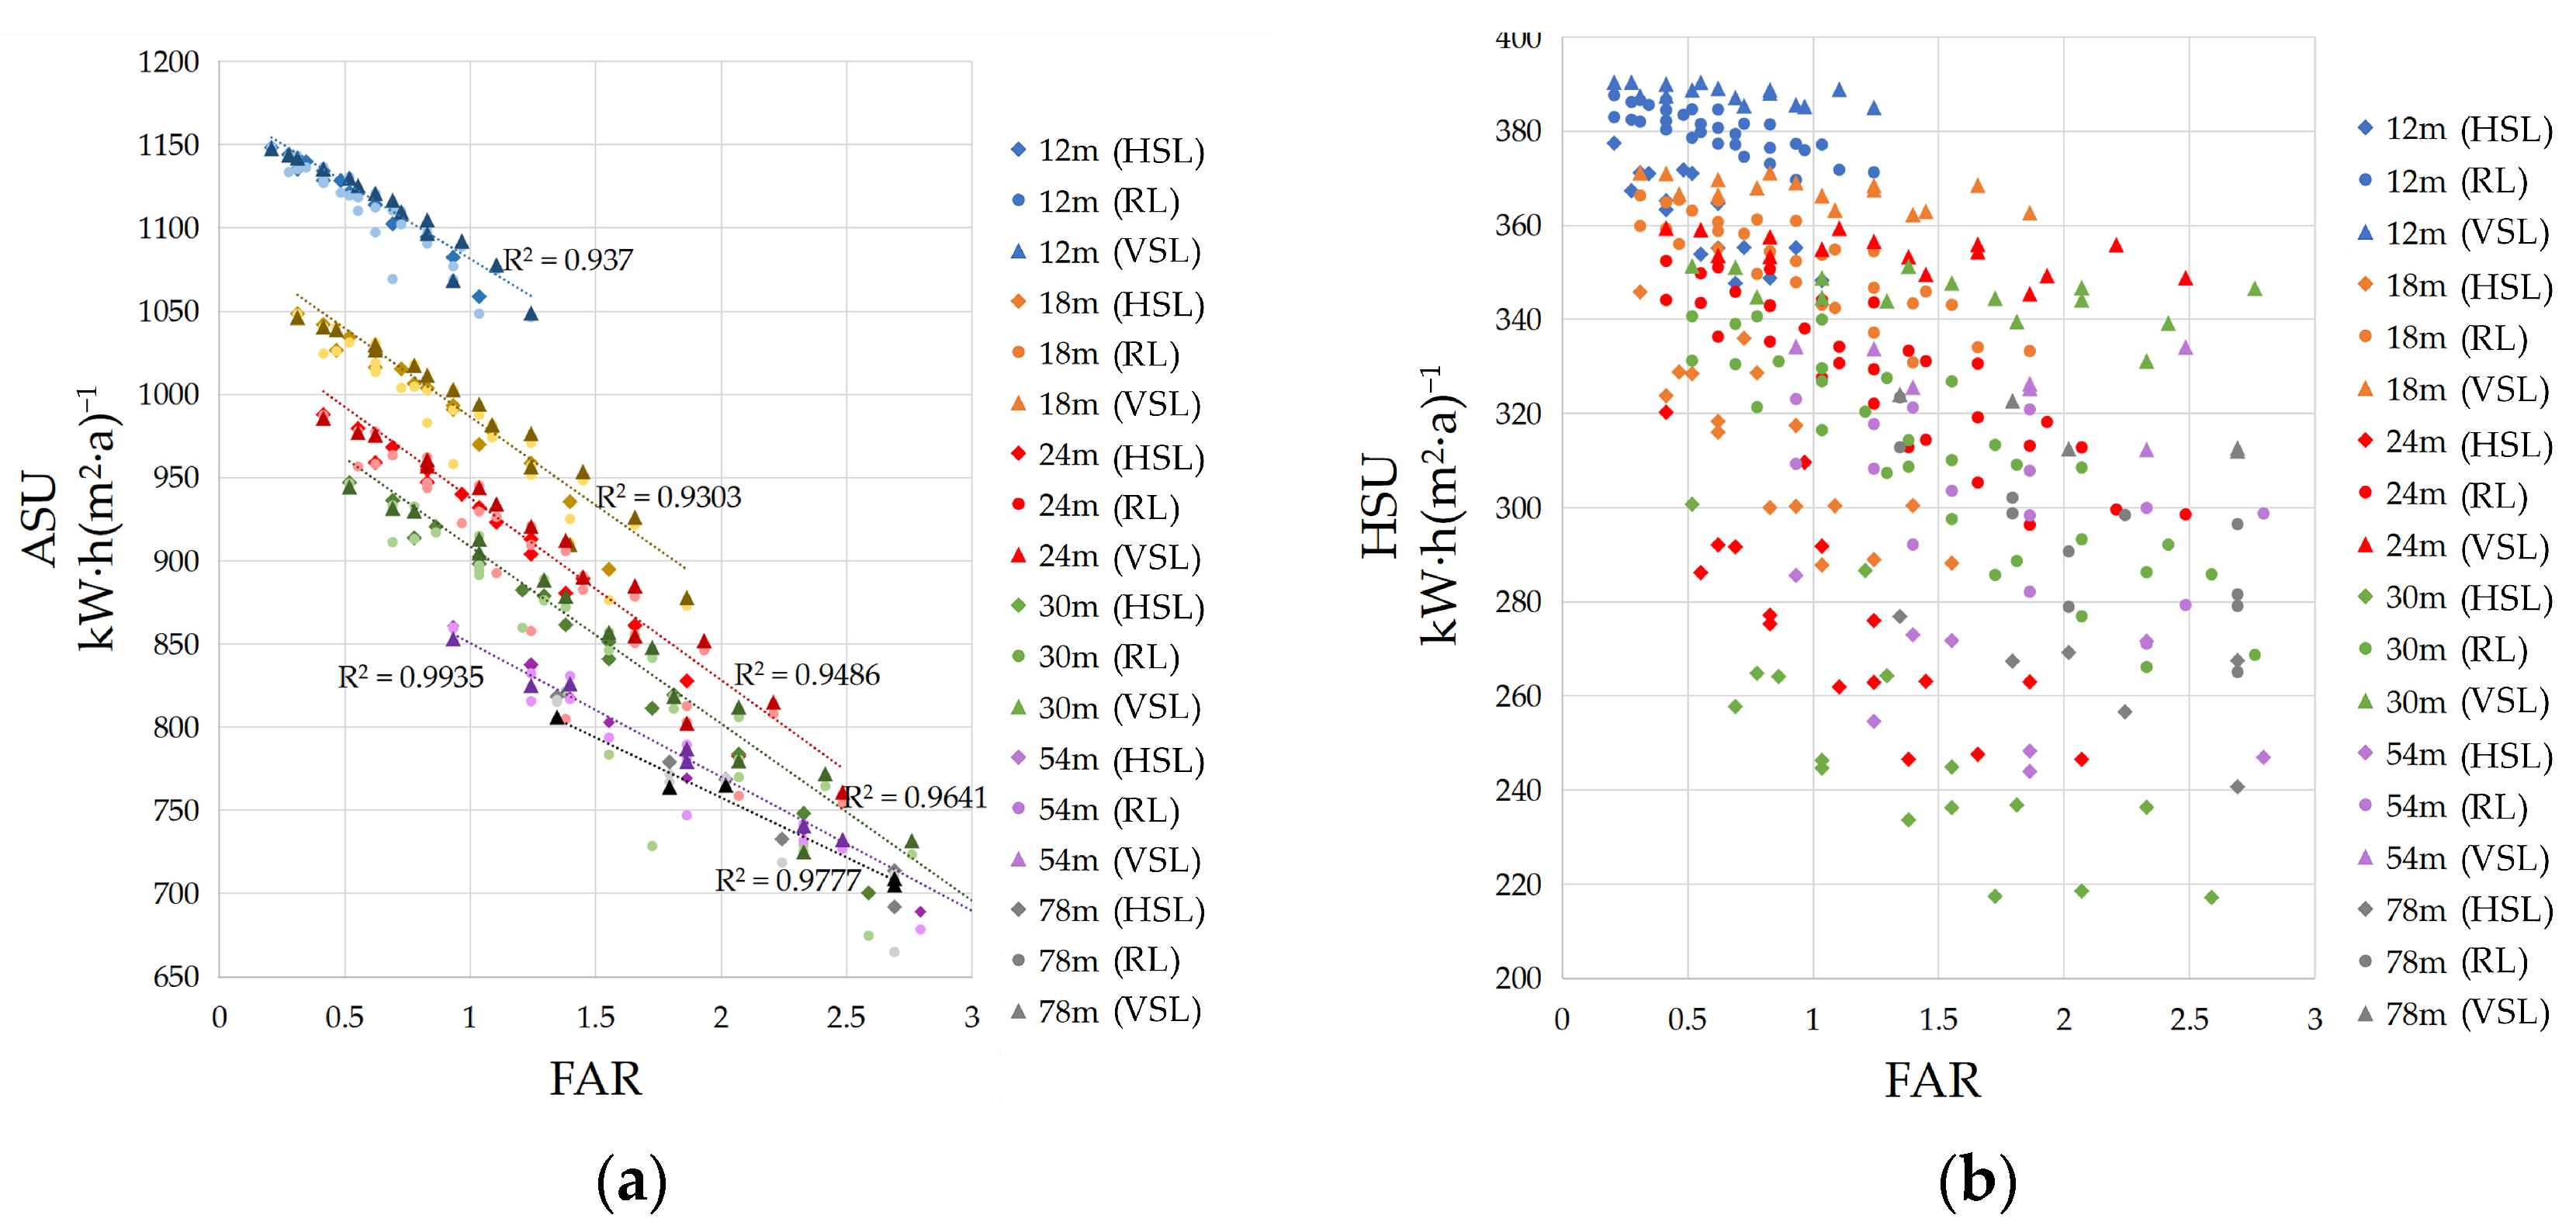
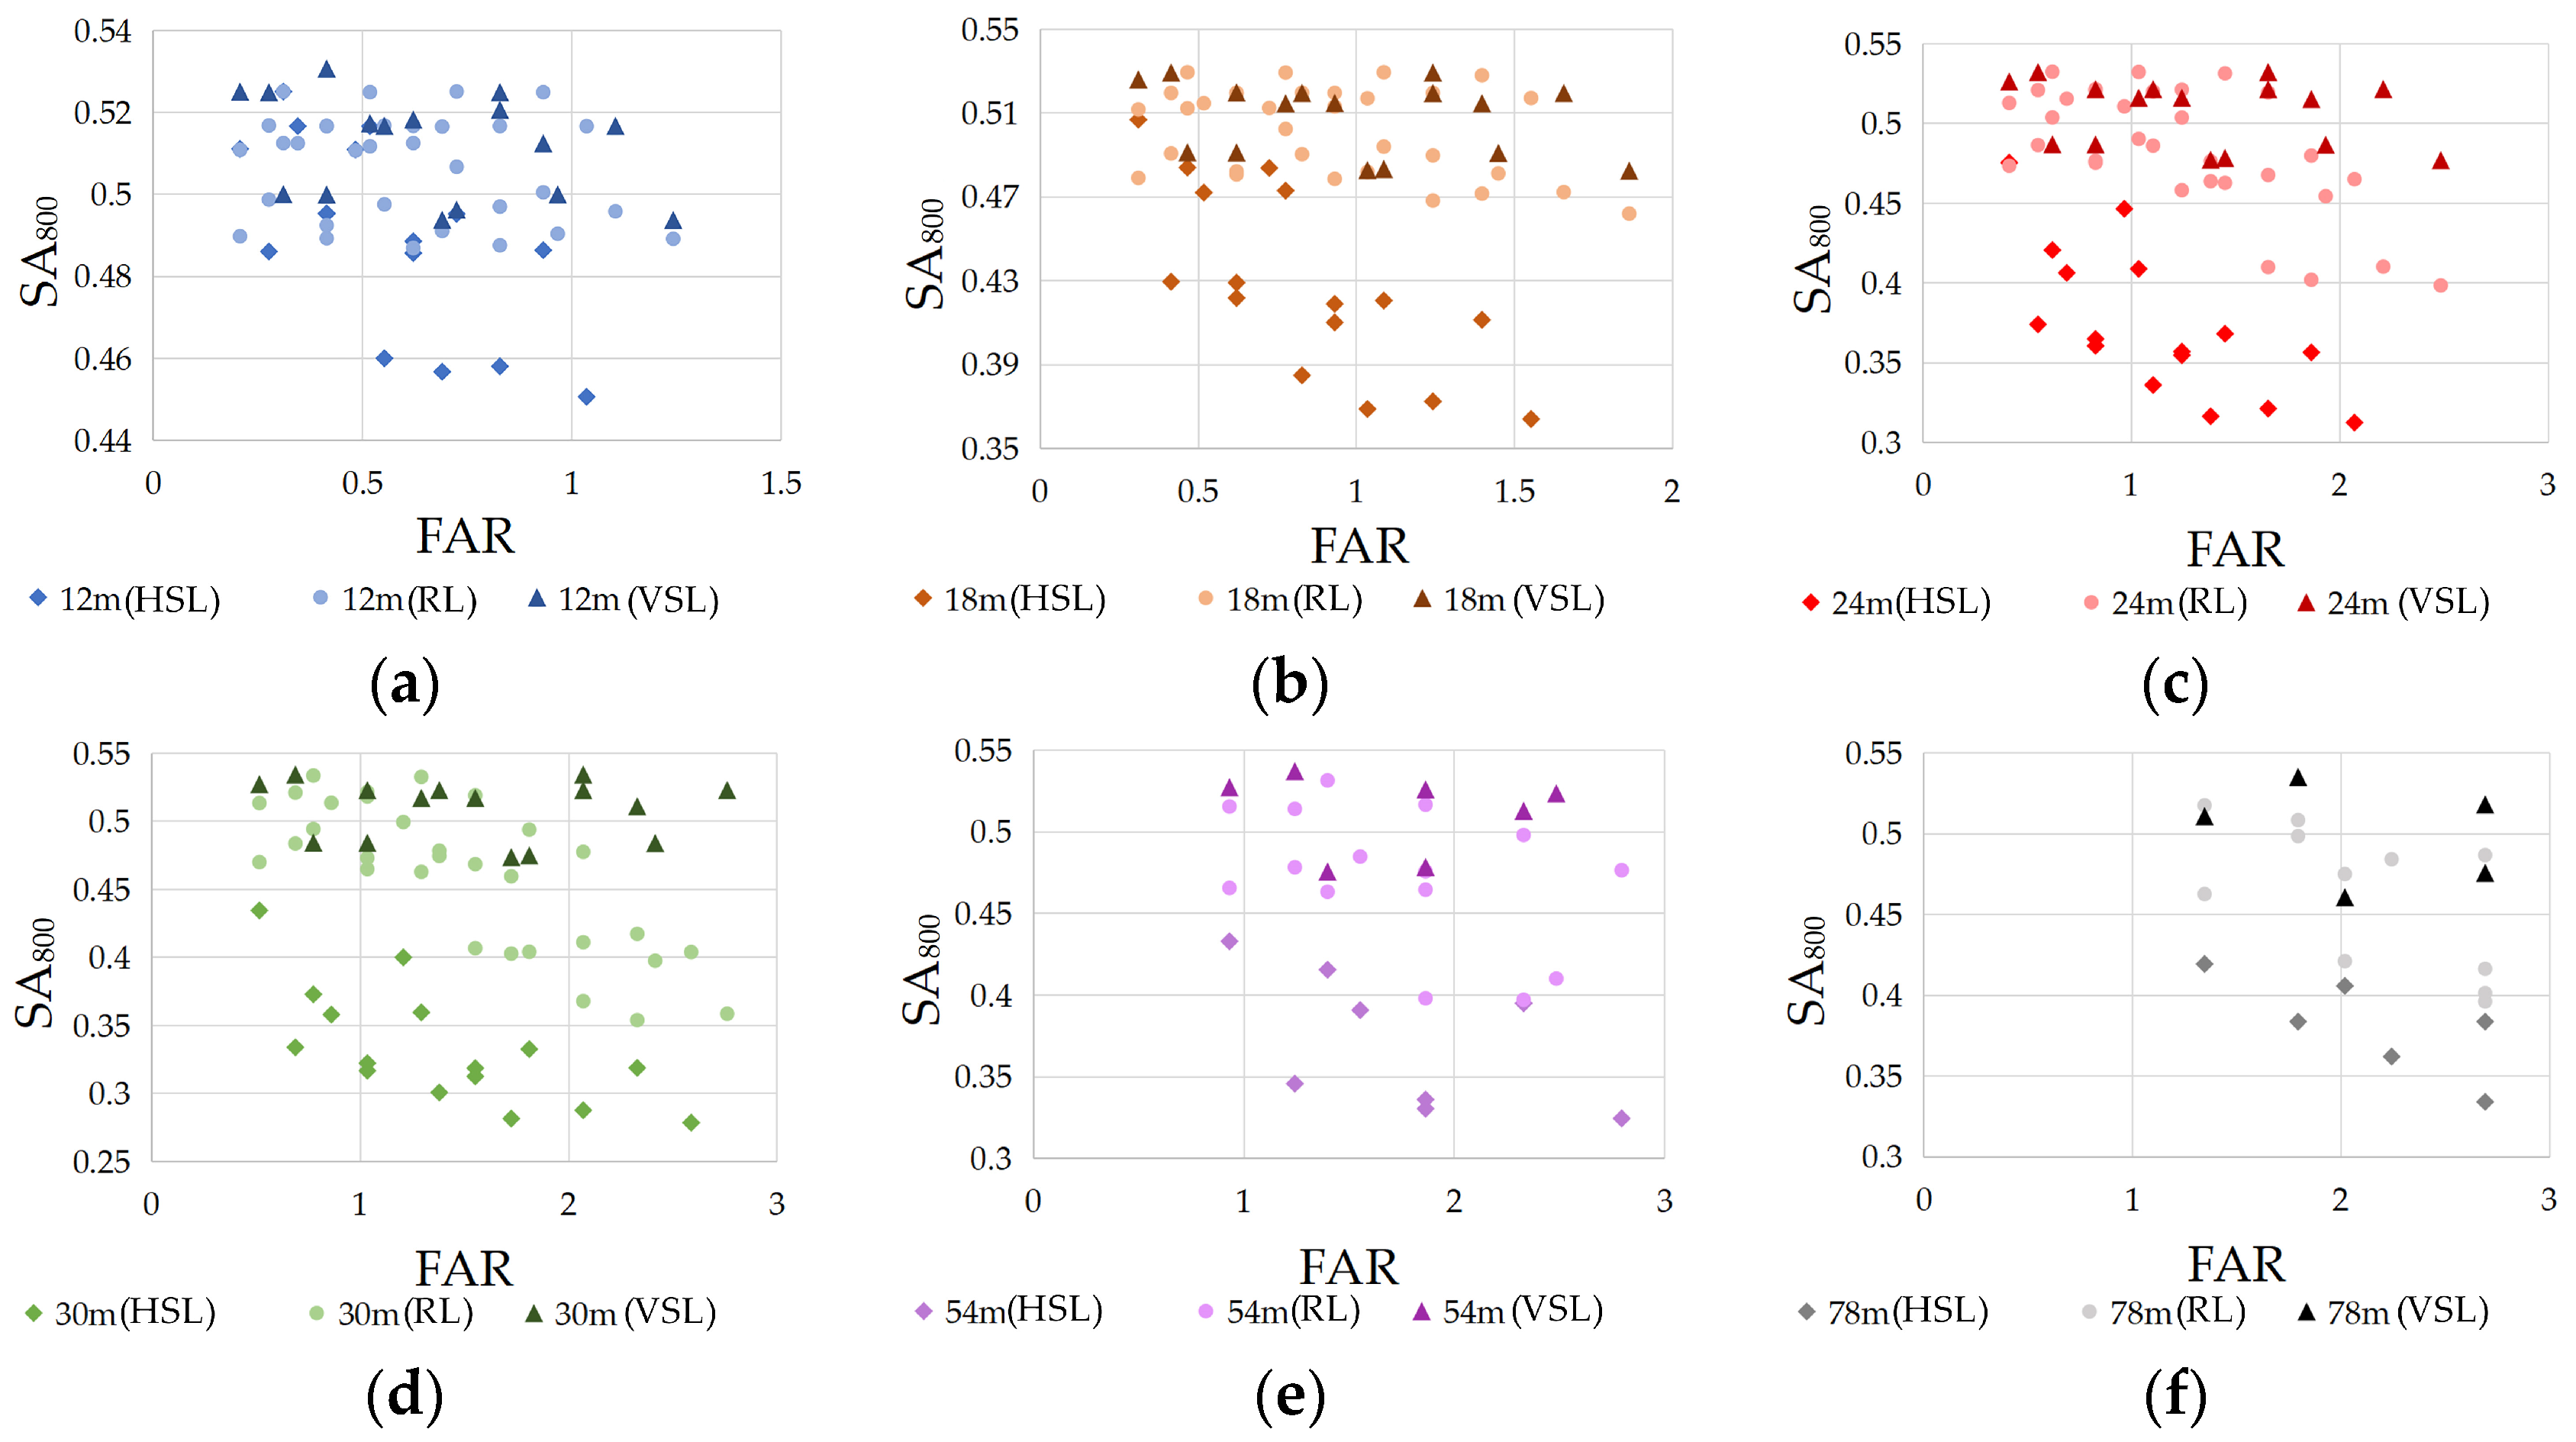
7.1. Effect of Building Density (BD) and Building Height (BH) on SRA
7.2. Effect of Layout and Building Height (BH) on SRA
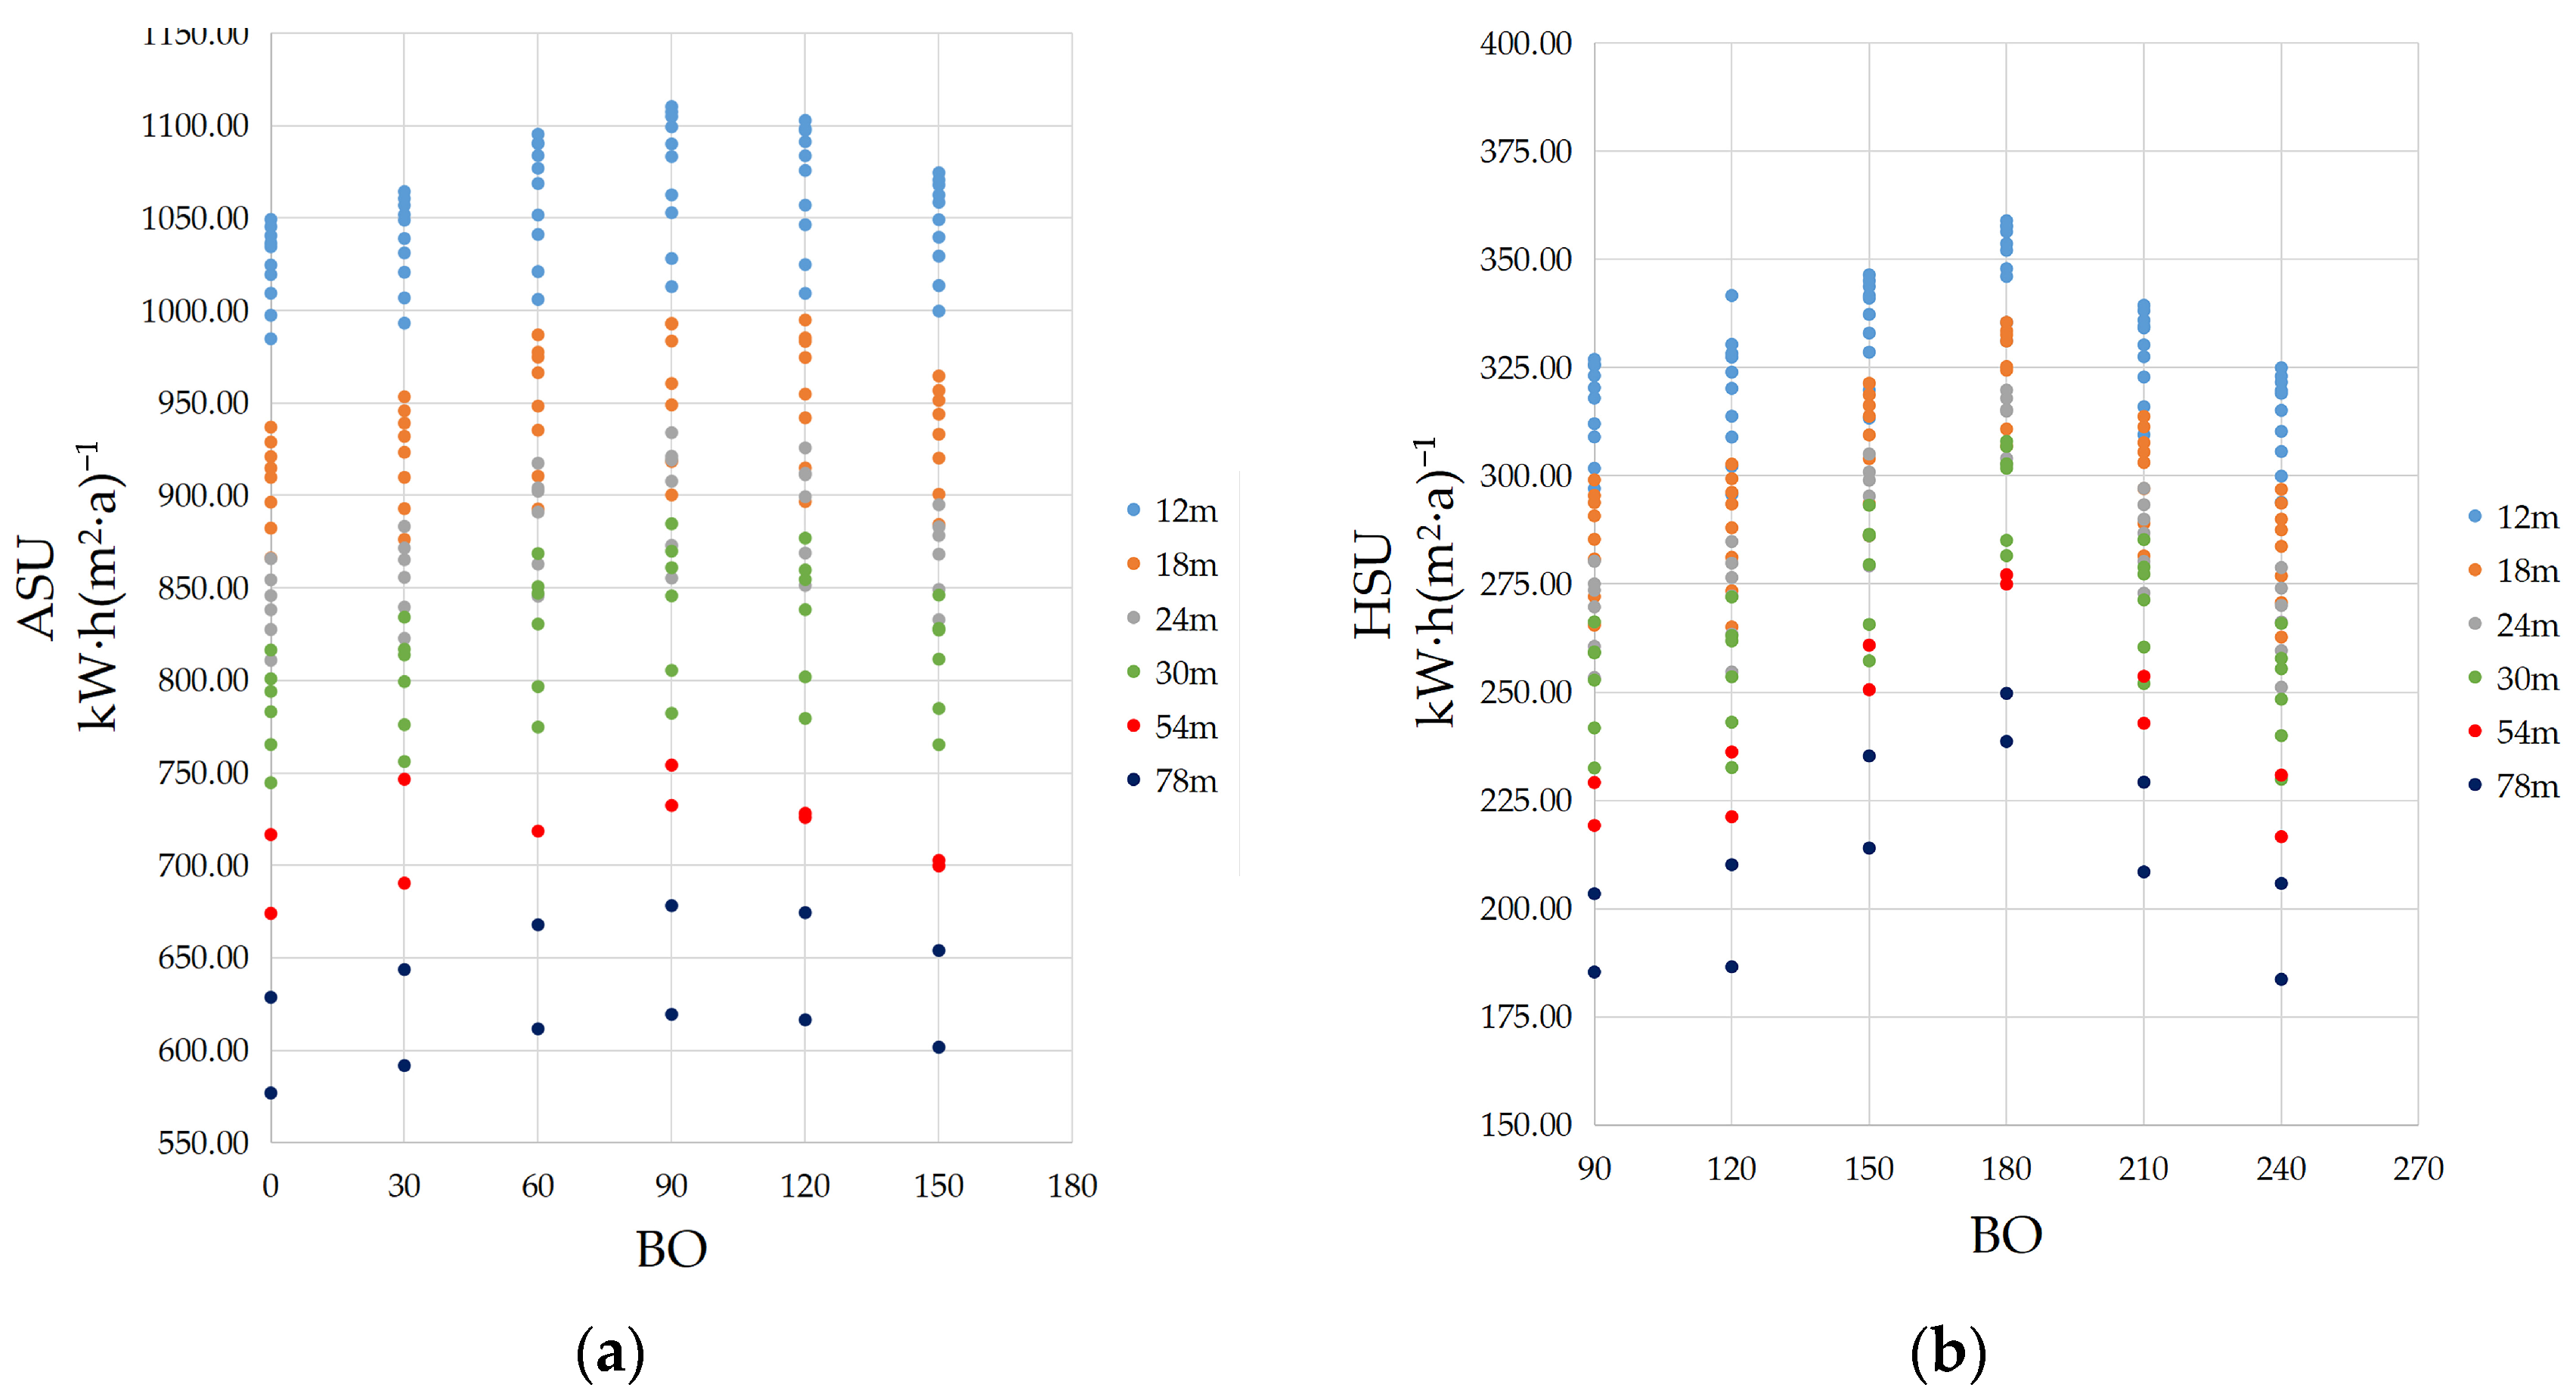
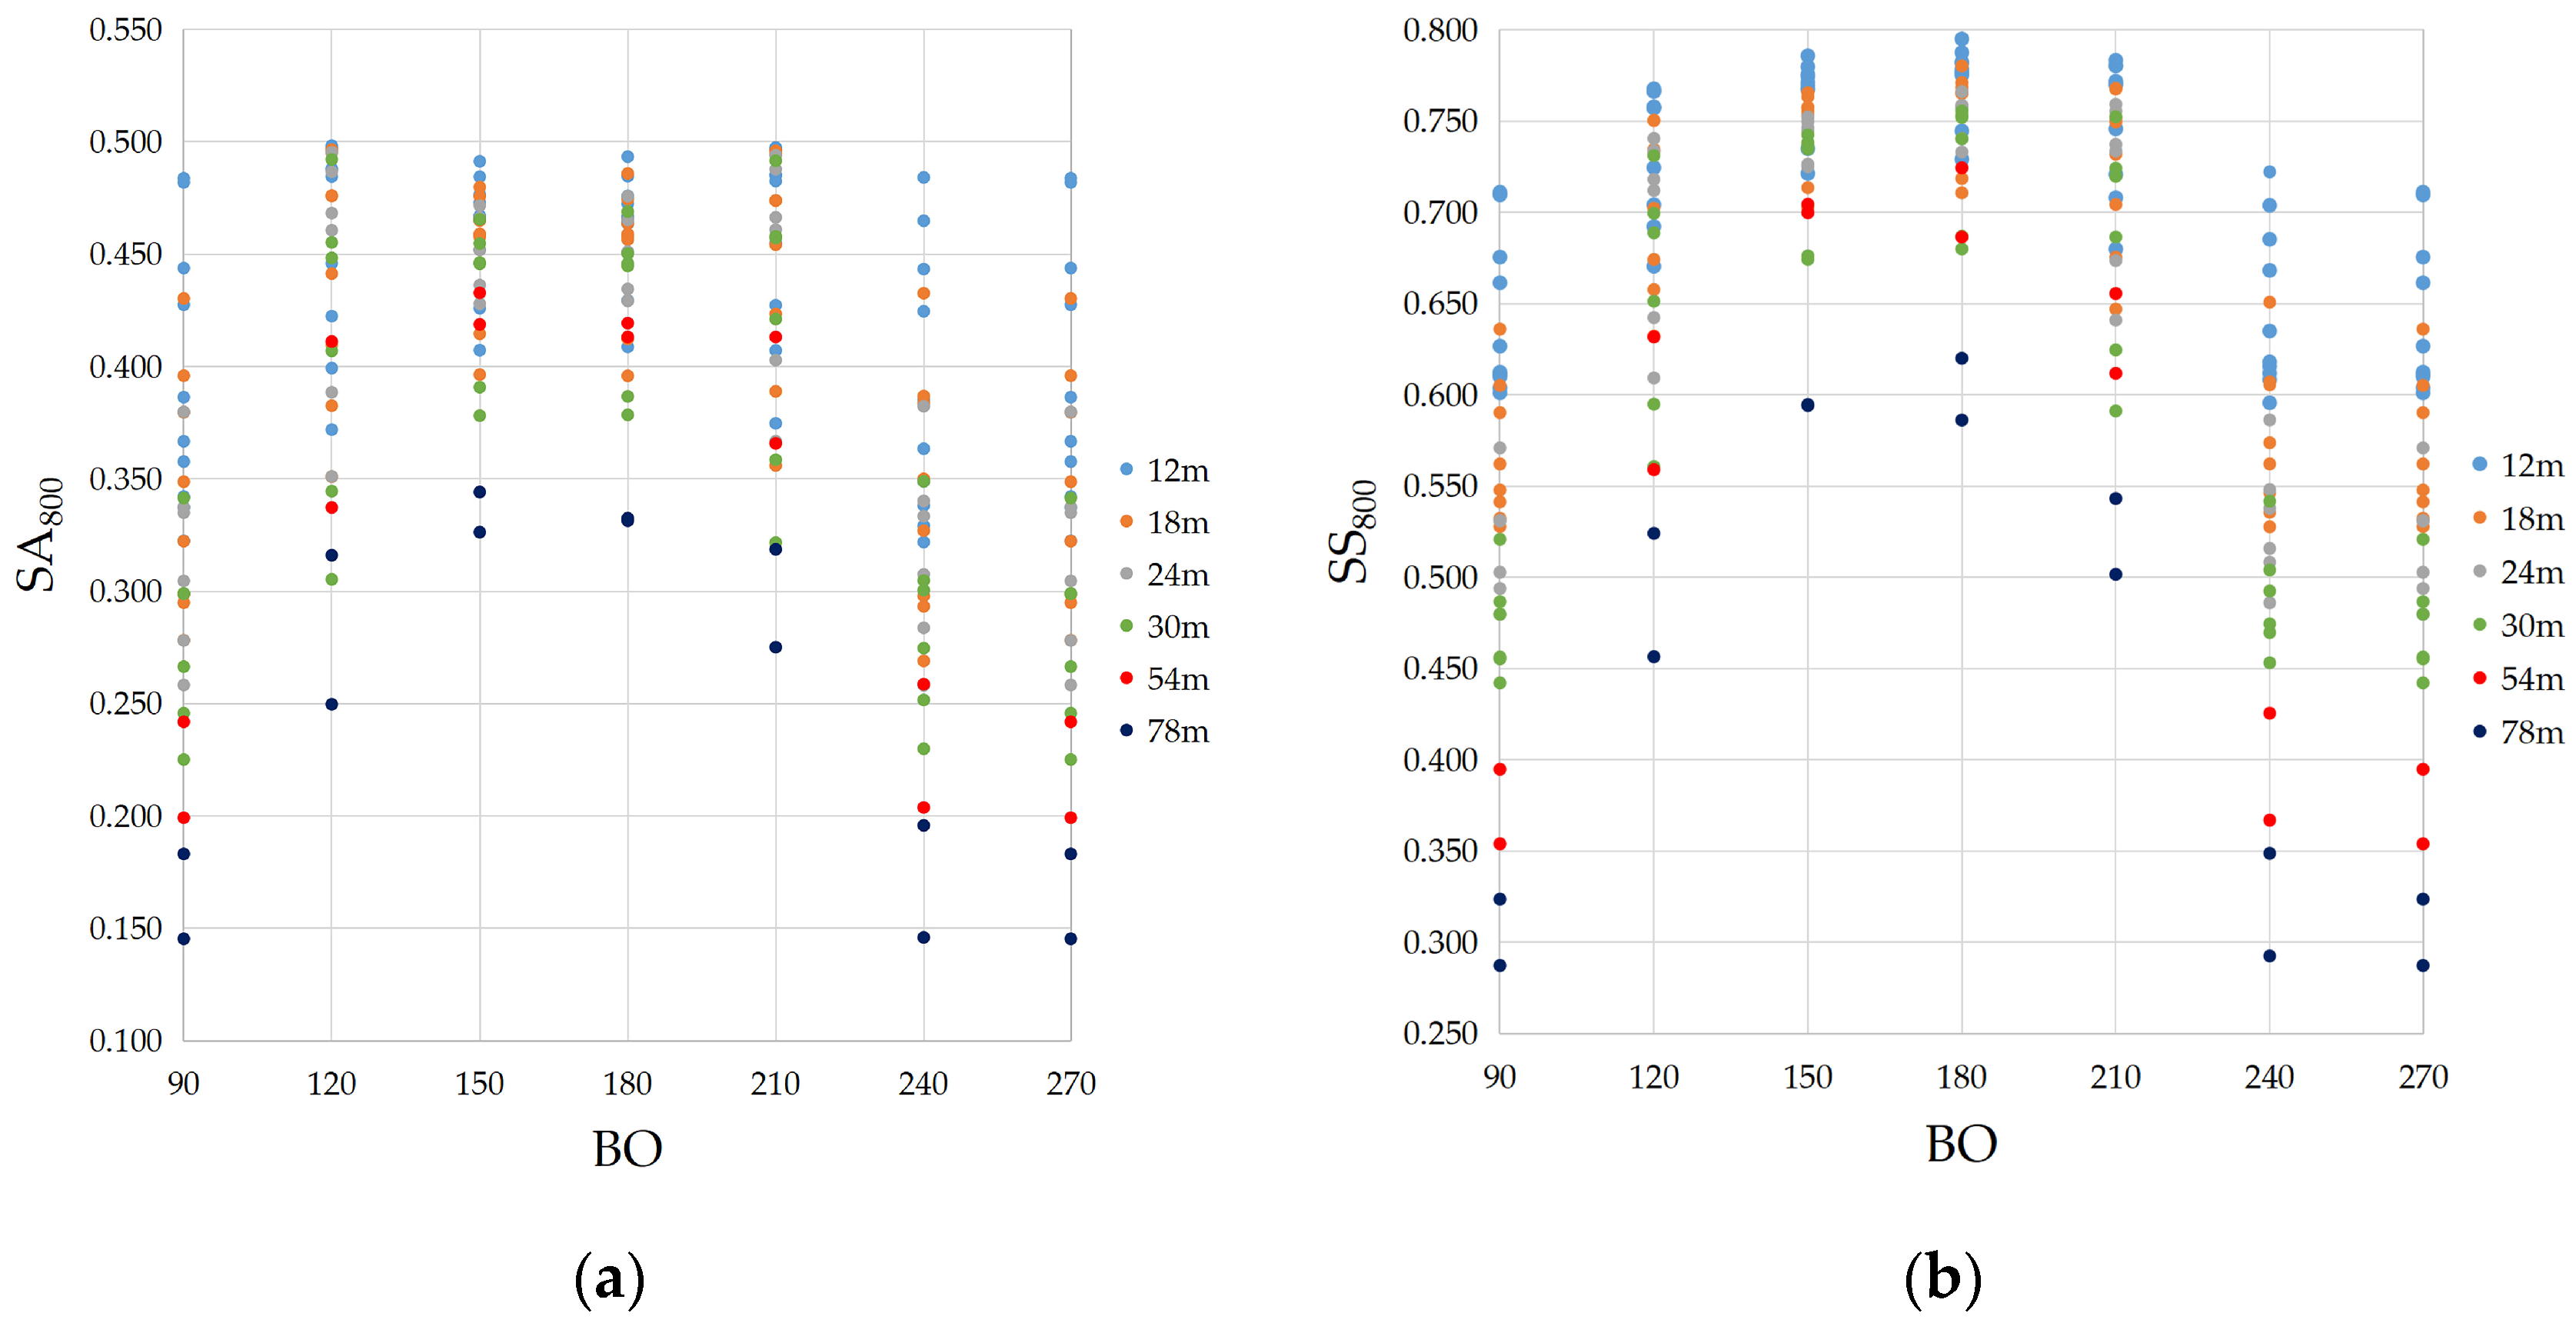
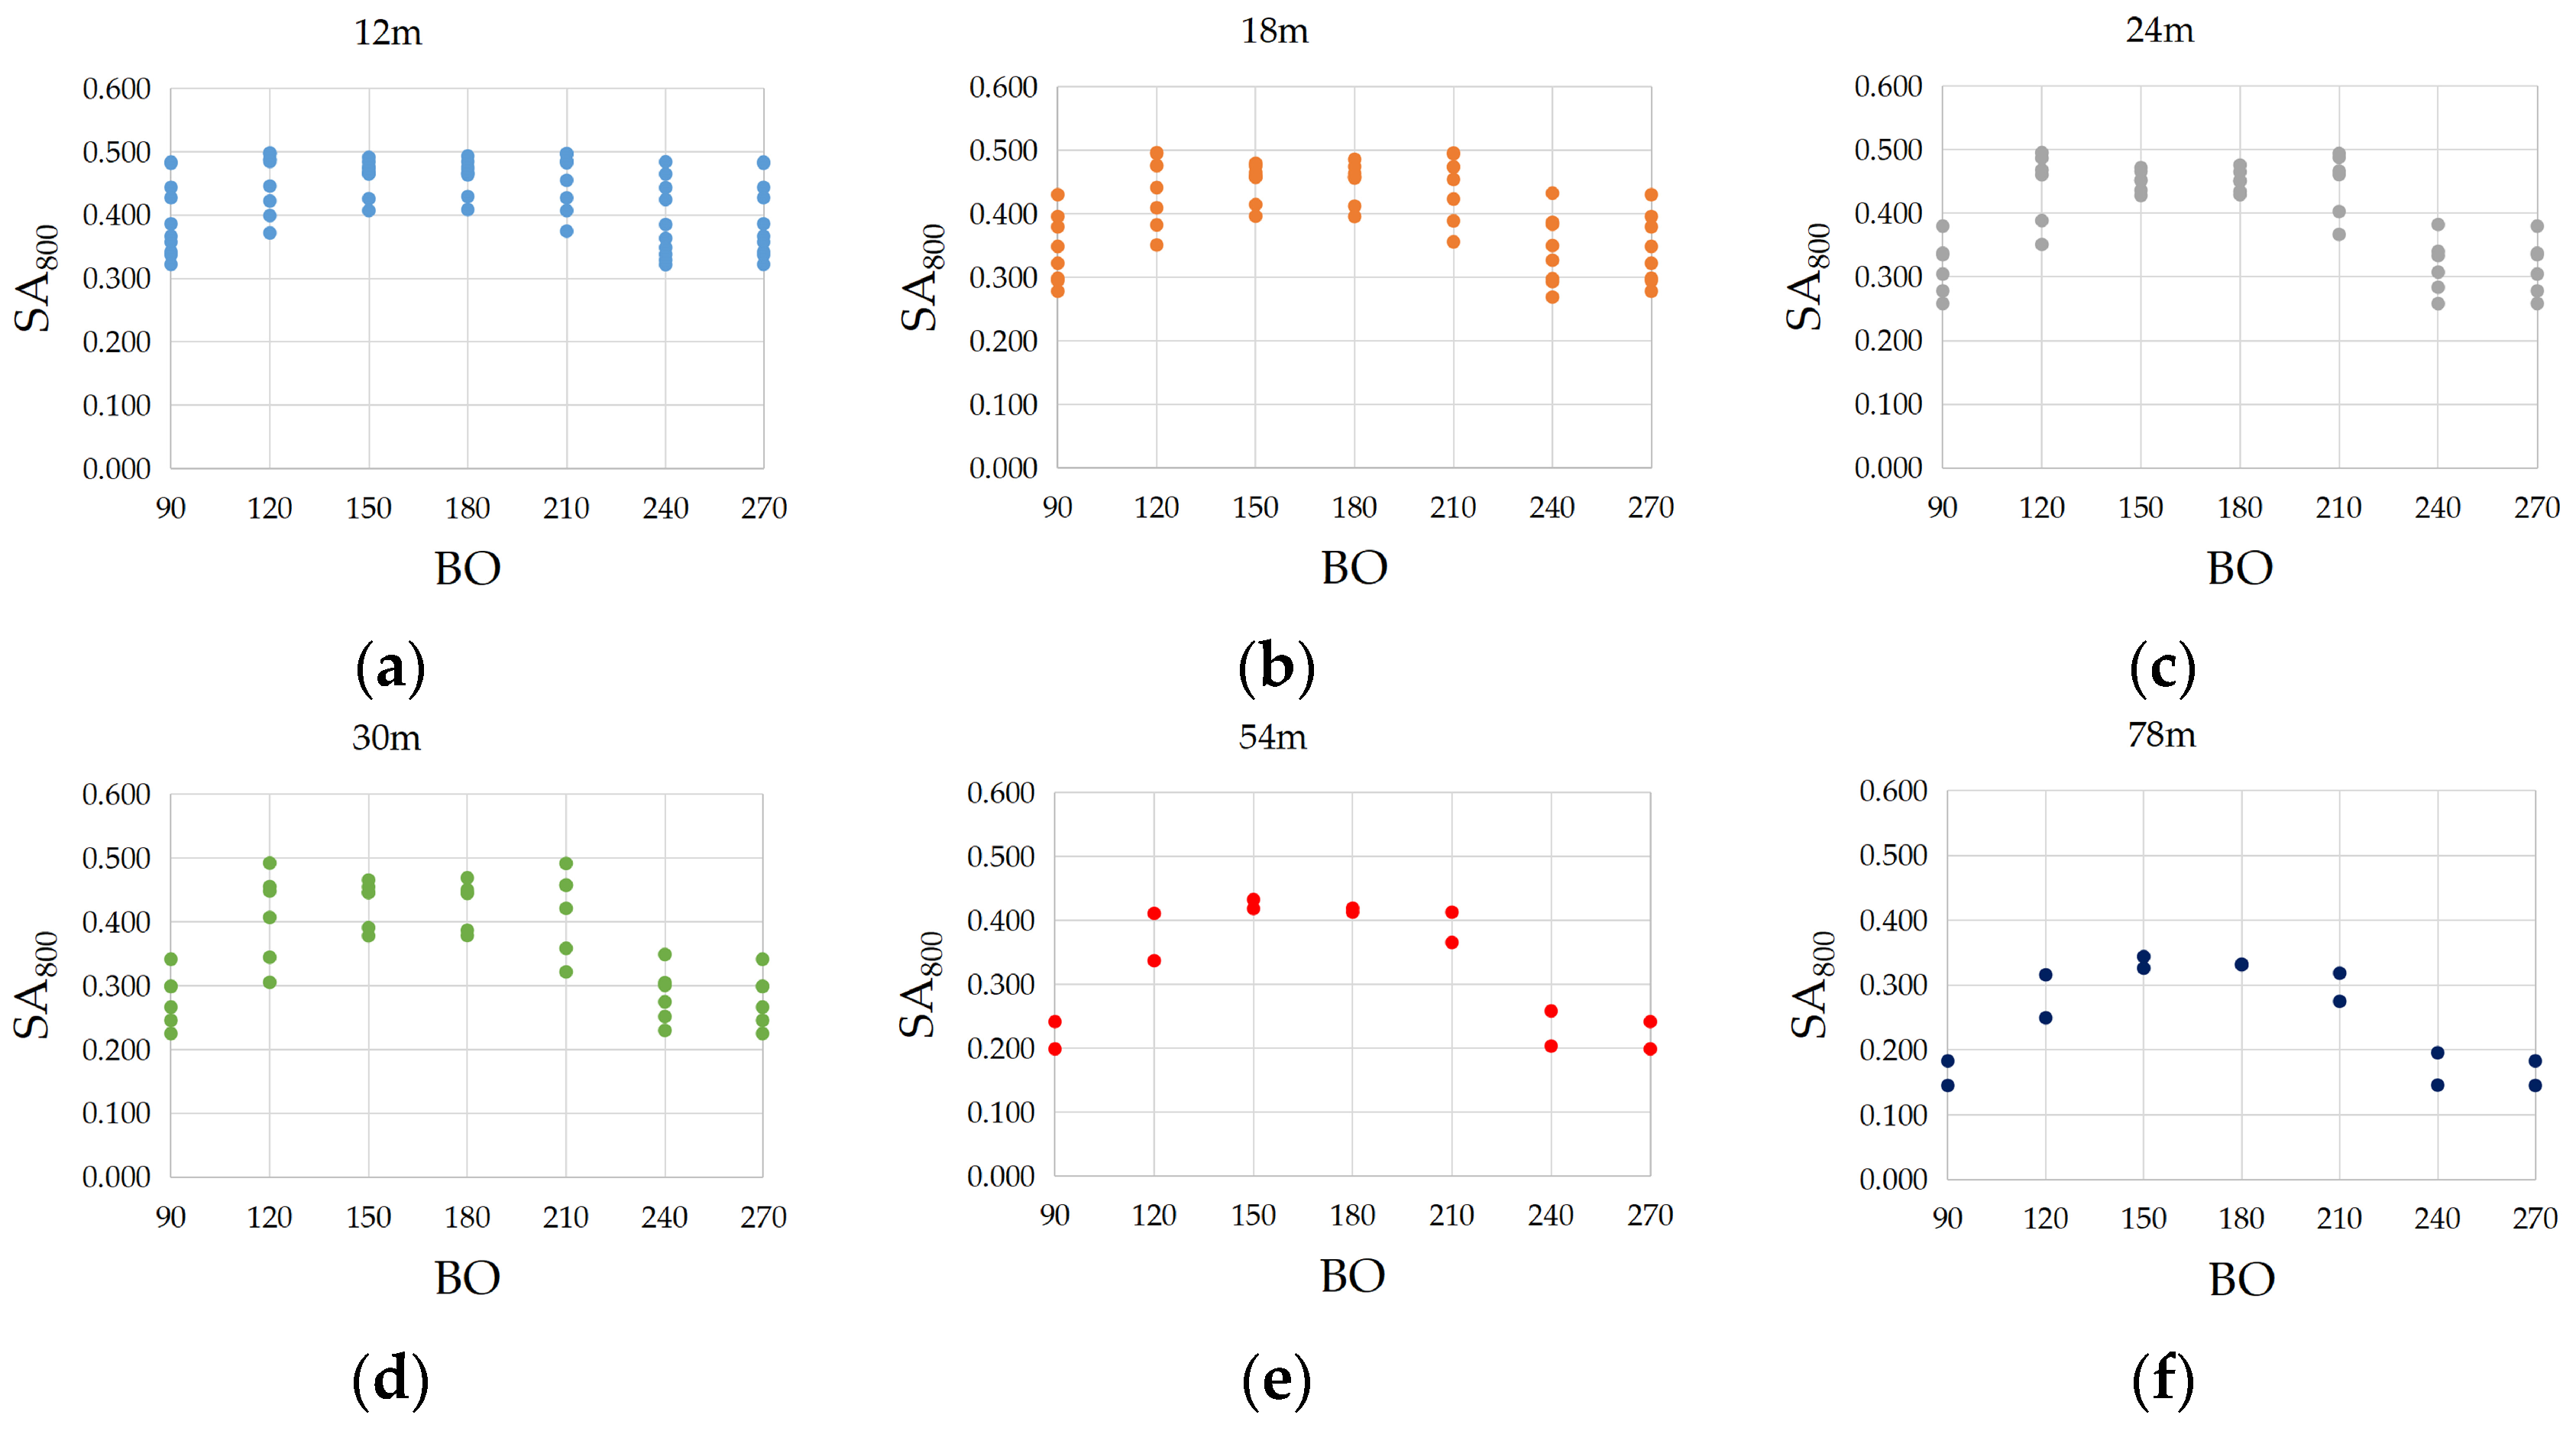
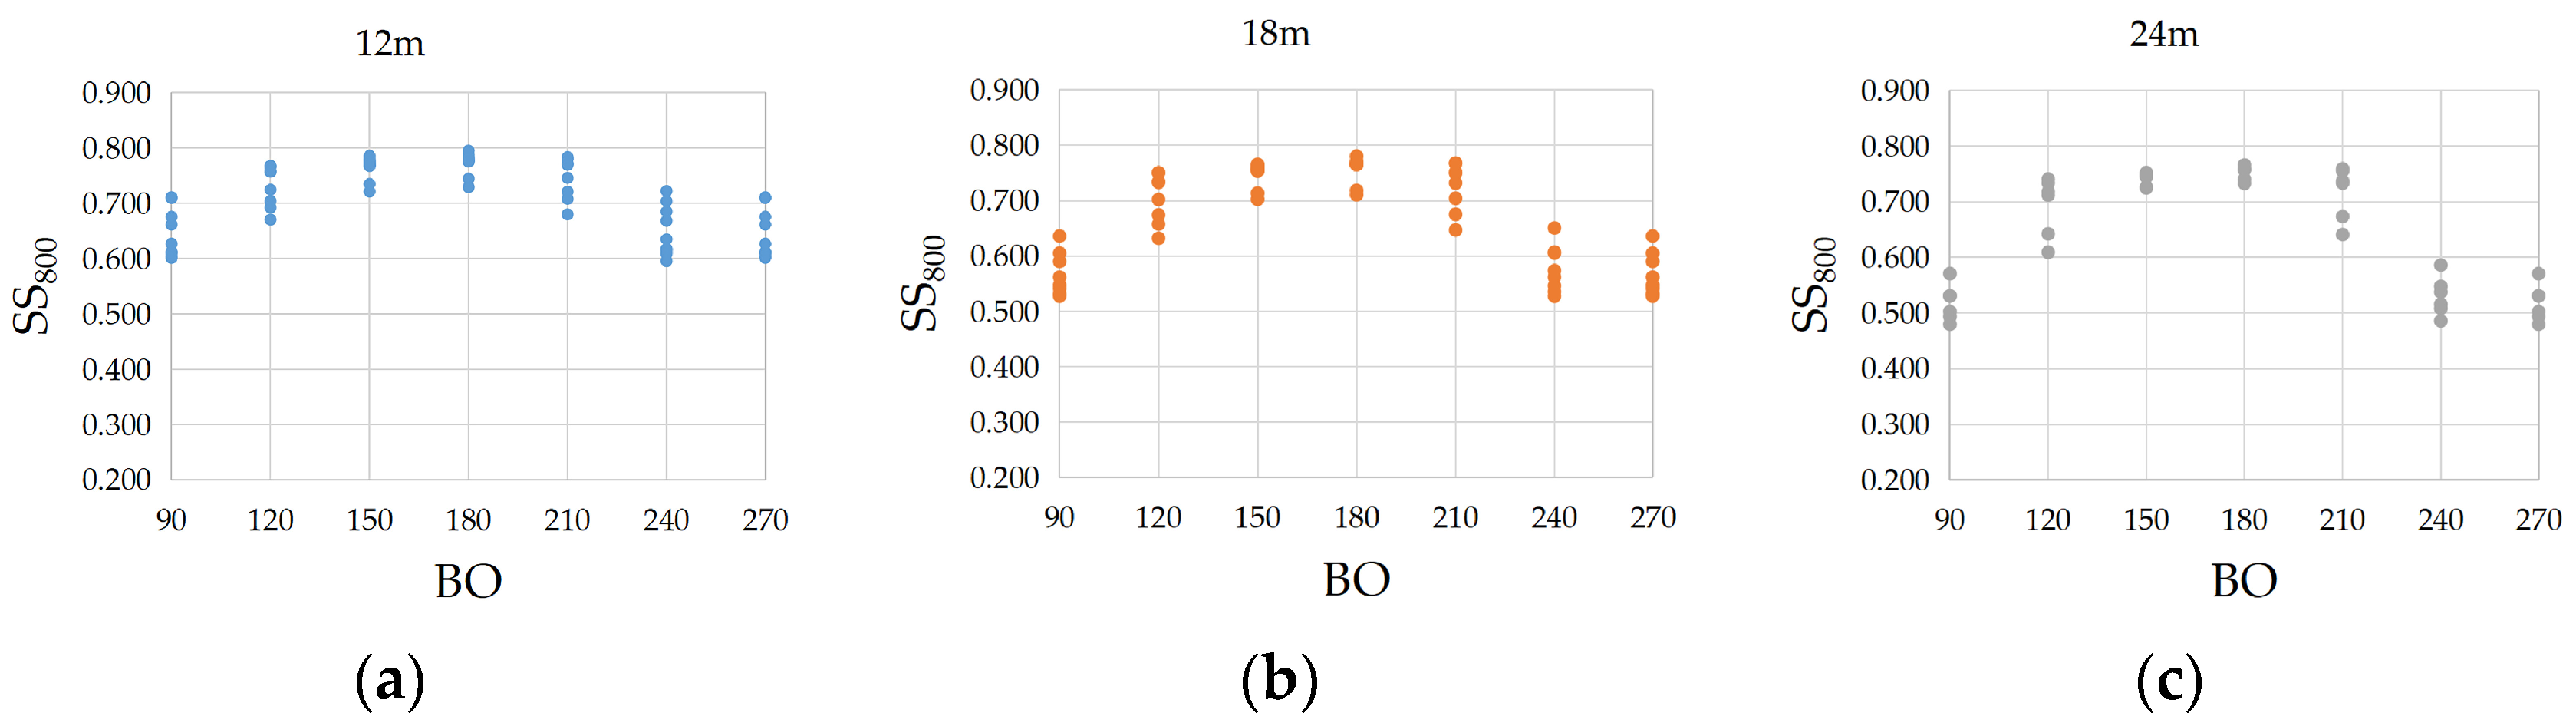
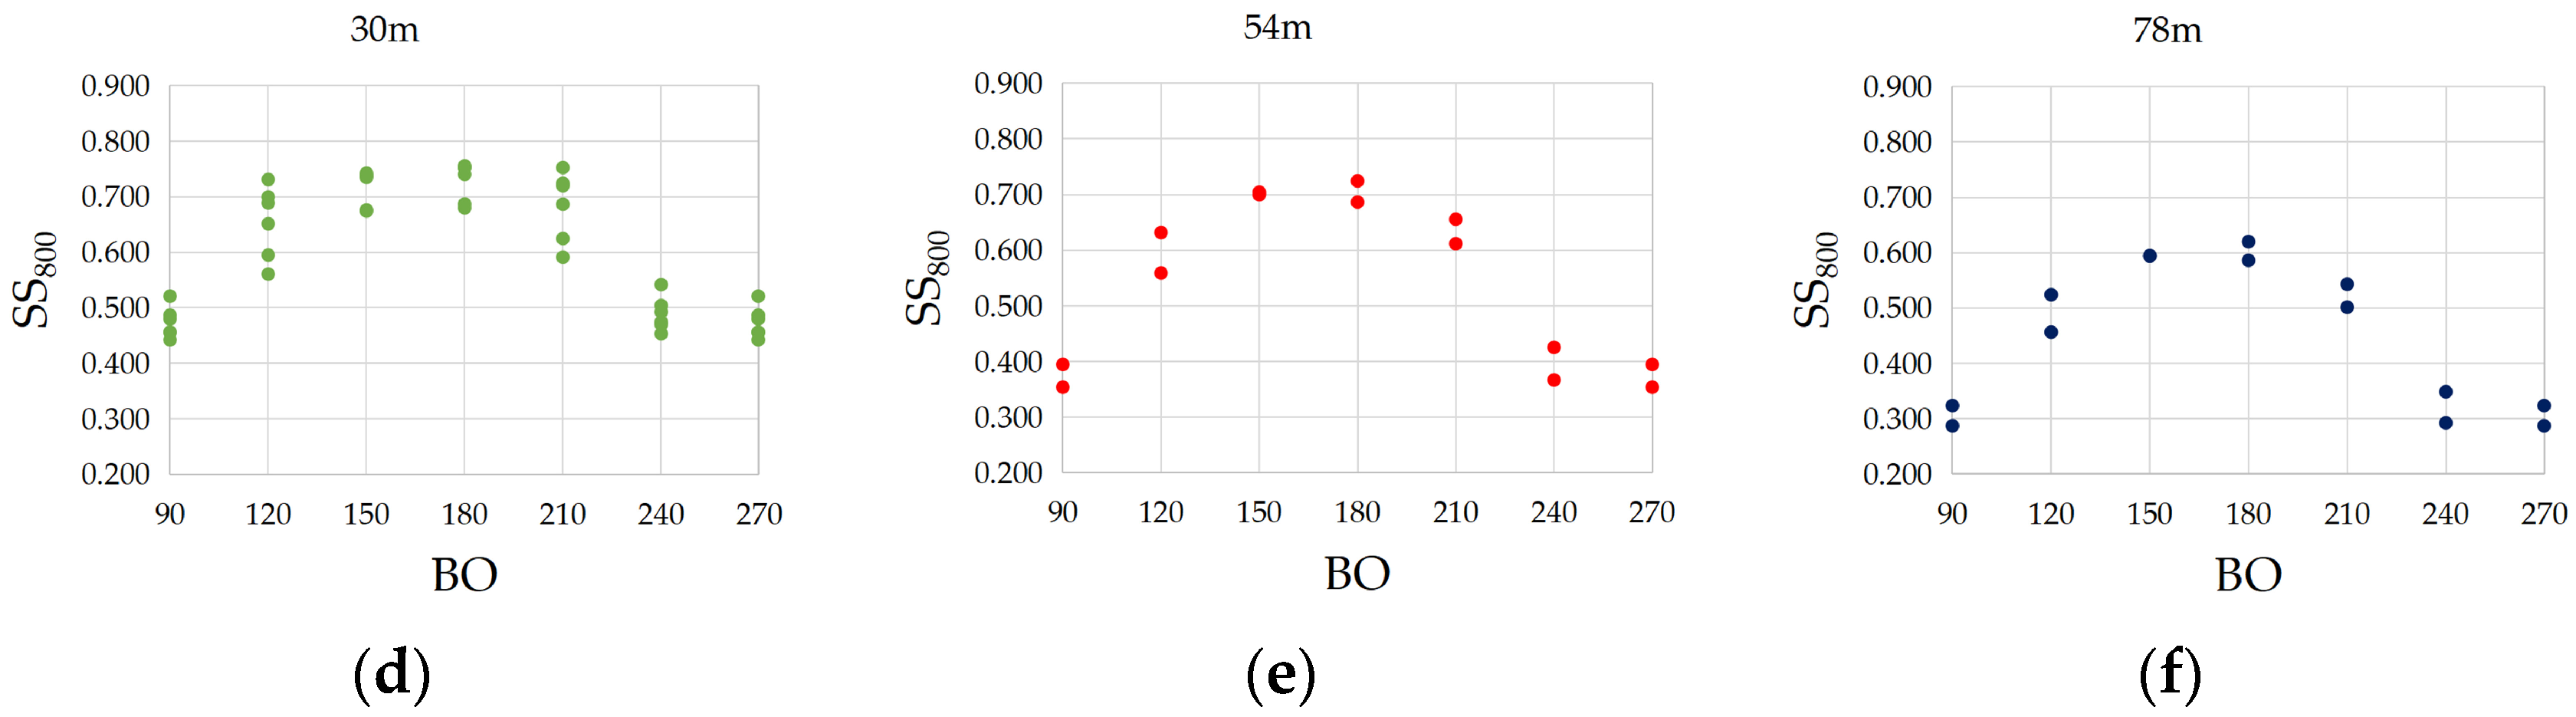
7.3. Effect of Building Orientation (BO) and Building Height (BH) on SRA
8. Conclusions
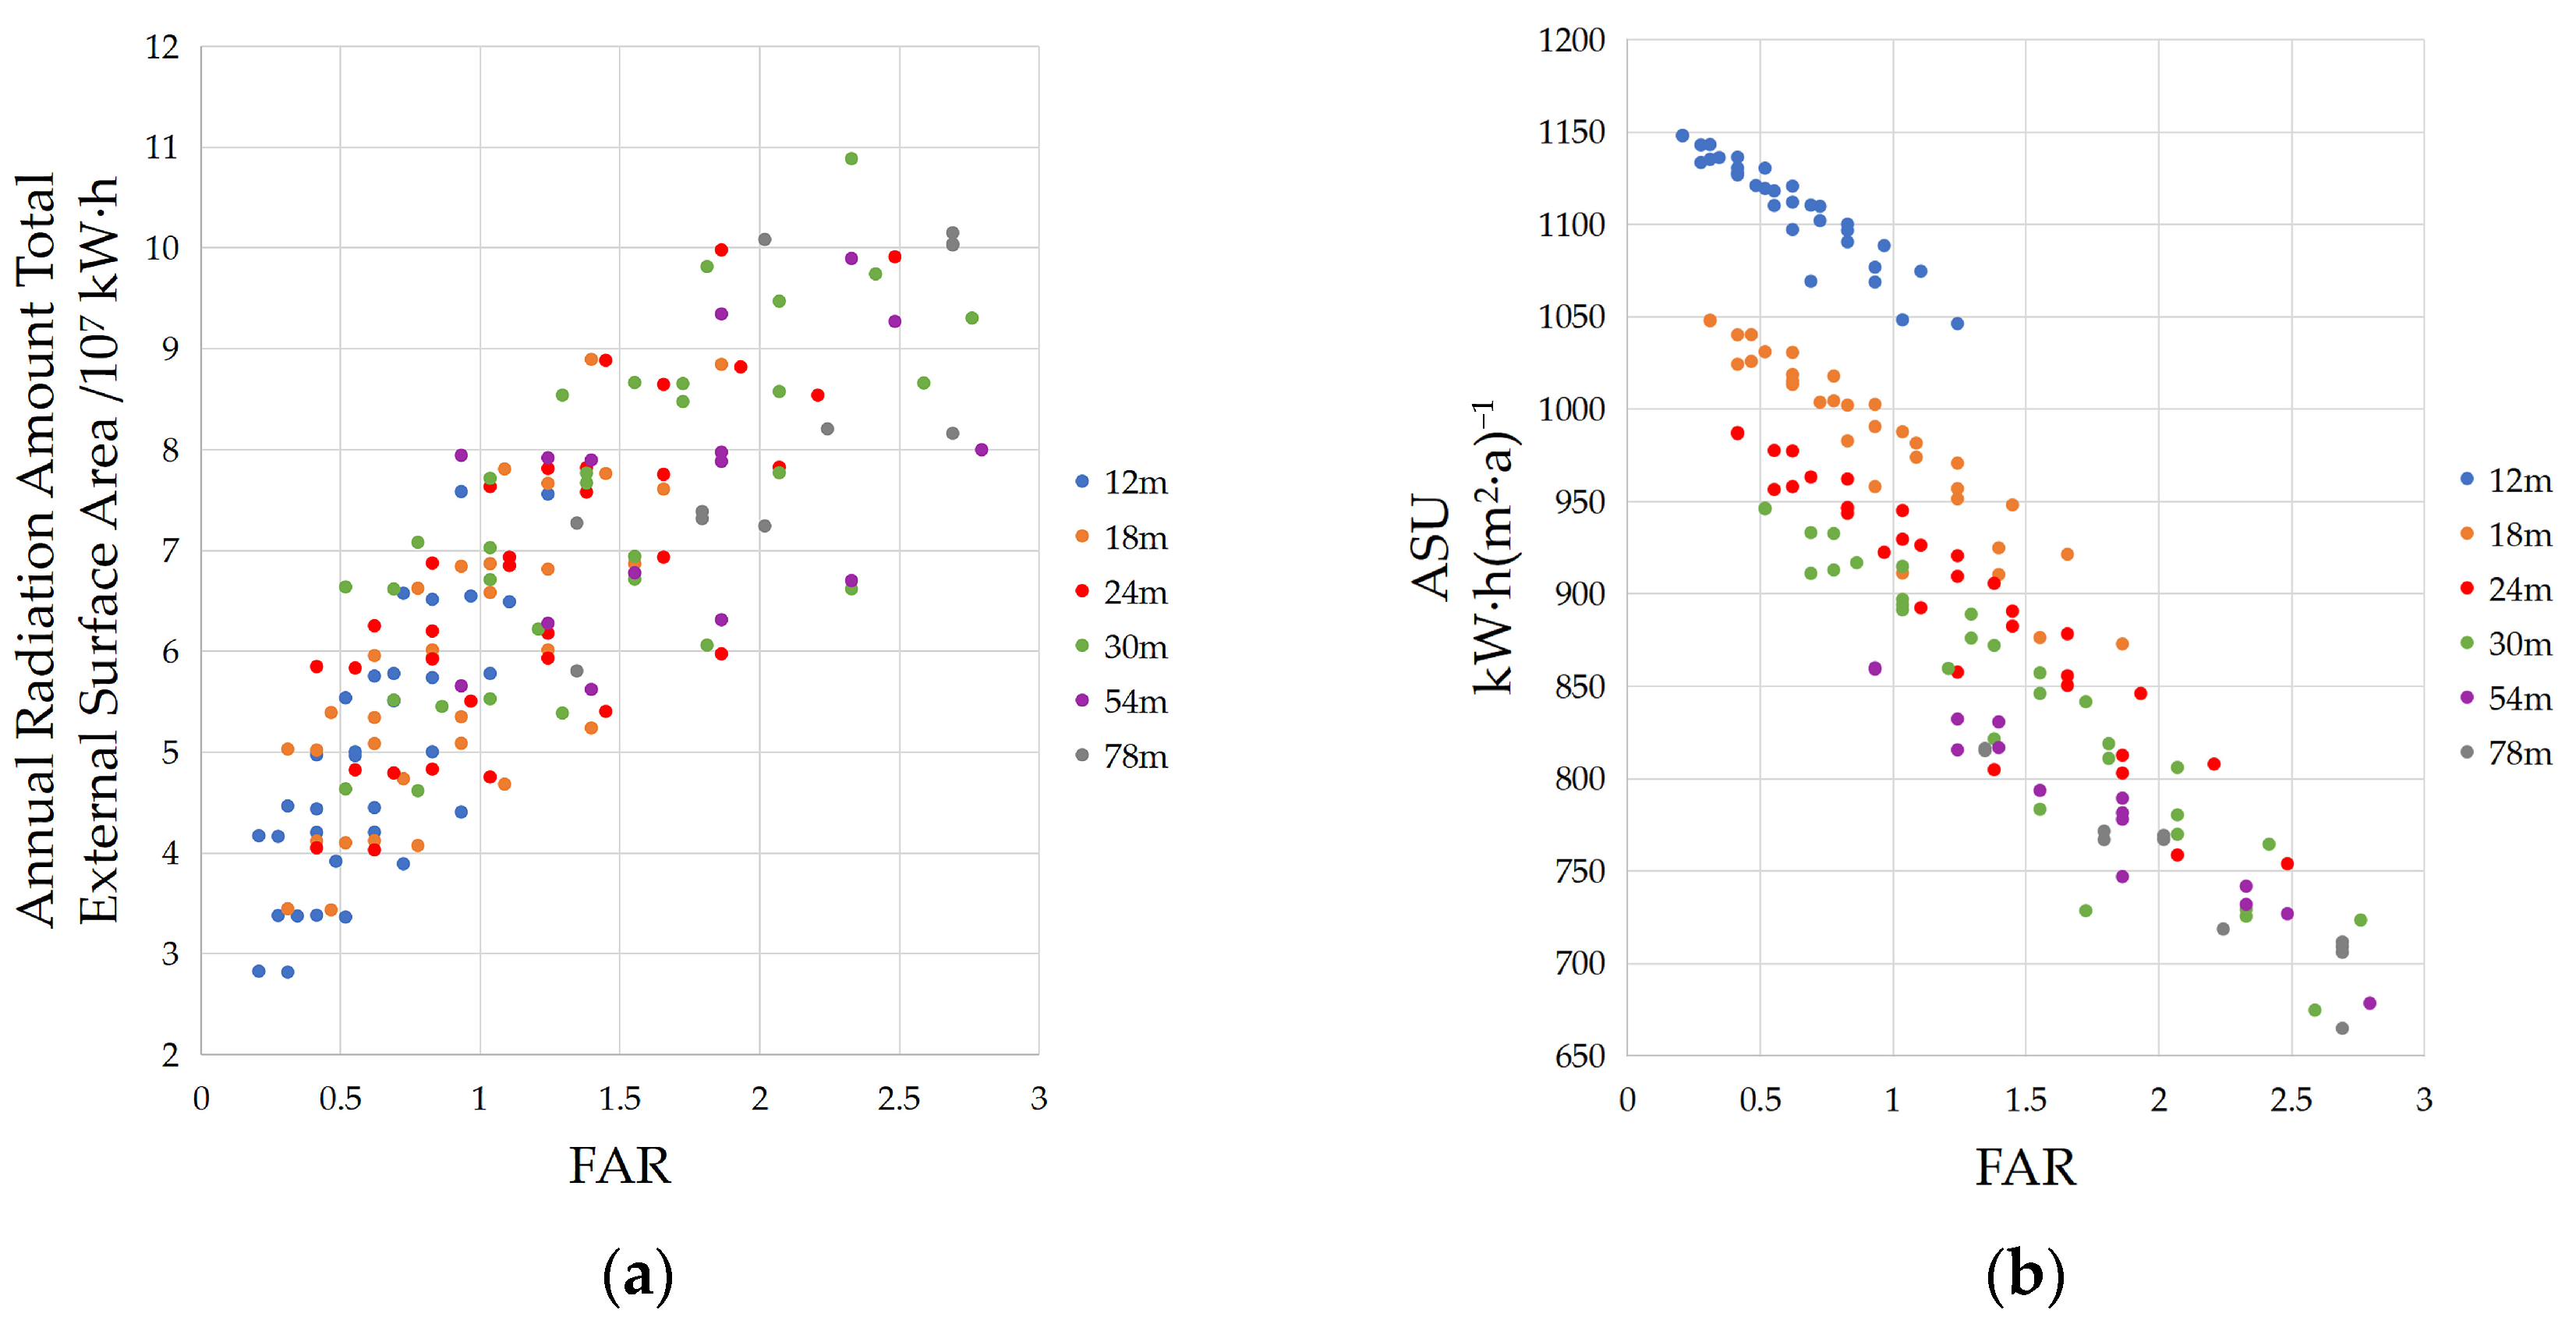
- When considering the floor area ratio index under the condition that the land area and gross floor area are determined, an increase in building density proves more advantageous for enhancing SRA compared to an increase in building height. In cases where the building height is less than 24 m and the floor area ratio is below 1.5, elevating the building density yields greater photovoltaic (PV) potential for the residential area.
- With a limited site area, the impact of building height on SRA far outweighs that of the layout. The layout does not significantly affect the annual solar radiation amount per unit of external surface area (ASU). With increasing building height, the impact of layout on heating season solar radiation amount per unit external surface area (HSU) becomes more pronounced. The vertical staggered layout and the row layout exhibit significantly superior performance compared to the horizontal staggered layout in this regard. However, when the building height exceeds 24 m and the floor area ratio surpasses 1.5, the PV potential of the vertical staggered layout surpasses that of the row layout and the horizontal staggered layout for the same building height.
- For building orientation and building height, building height has a slightly greater effect on SRA than orientation. The change pattern of the same SRA index with orientation is basically the same under different heights. Among them, the best orientation range of annual SRA is from 75° S.W. to due west with a span of 15°, the best orientation range of heating season SRA is from due south to 10° S.W. with a span of 10°, and the best orientation range of PV potential is from 15° S.W. to 15° S.E. with a span of 30°. The optimal orientation of annual SRA is the opposite of the optimal orientation of heating season SRA.
- The study has a limited geographical scope, focusing solely on the residential areas of Lhasa. The applicability of the conclusions under multiple climate zones will be investigated based on a larger sample in follow-up studies.
- The study solely concentrates on the residential buildings within the residential area, taking little consideration of the presence and impact of nearby public buildings. The interrelationship between these residential buildings and public buildings is not taken into consideration. In future research, it would be valuable to expand the scope of the investigation to include public buildings within residential areas. Examining how public buildings shade neighboring residential buildings from solar radiation can provide a more precise analysis of the correlation between residential area morphology and SRA potential.
- In this study, the utility of the BP neural network for predicting residential area SRA potential has been affirmed, which is a widely applicable research pathway for investigating the relationship between residential area morphology design and SRA potential in any climate zone. The subsequent research will focus on expanding the training sample set and condensing the summary of research findings even further, which will further improve the accuracy to reach the ideal state and thus provide more convenient, intuitive, and accurate guidance for the design phase.
Author Contributions
Funding
Institutional Review Board Statement
Informed Consent Statement
Data Availability Statement
Acknowledgments
Conflicts of Interest
References
- Zou, Y.; Deng, Y.; Xia, D.; Lou, S.; Yang, X.; Huang, Y.; Guo, J.; Zhong, Z. Comprehensive analysis on the energy resilience performance of urban residential sector in hot-humid area of China under climate change. Sustain. Cities Soc. 2023, 88, 104233. [Google Scholar] [CrossRef]
- Nie, H.; Kemp, R.; Fan, Y. Investigating the adoption of energy-saving measures in residential sector: The contribution to carbon neutrality of China and Europe. Resour. Conserv. Recycl. 2023, 190, 106791. [Google Scholar] [CrossRef]
- Mostafa, N.A.; Grida, M.; Park, J.; Ramadan, H.S. A sustainable user-centered application for residential energy consumption saving. Sustain. Energy Technol. Assess. 2022, 53, 102754. [Google Scholar] [CrossRef]
- Song, S. Climate in Tibet; China Meteorological Press: Beijing, China, 2013; p. 512. [Google Scholar]
- Yan, J. Study on roof inclination of buildings at high altitude based on solar radiation-taking Lhasa as an example. Intell. Build. Smart City 2023, 104–106. [Google Scholar] [CrossRef]
- Lu, M.; Du, J. Assessing the daylight and sunlight availability in high-density residential areas: A case in North-east China. Archit. Sci. Rev. 2013, 56, 168–182. [Google Scholar] [CrossRef]
- Košir, M.; Capeluto, I.G.; Krainer, A.; Kristl, Ž. Solar potential in existing urban layouts—Critical overview of the existing building stock in Slovenian context. Energy Policy 2014, 69, 443–456. [Google Scholar] [CrossRef]
- Martins, T.A.; Adolphe, L.; Bastos, L.E. From solar constraints to urban design opportunities: Optimization of built form typologies in a Brazilian tropical city. Energy Build. 2014, 76, 43–56. [Google Scholar] [CrossRef]
- Sarralde, J.J.; Quinn, D.J.; Wiesmann, D.; Steemers, K. Solar energy and urban morphology: Scenarios for increasing the renewable energy potential of neighbourhoods in London. Renew. Energy 2015, 73, 10–17. [Google Scholar] [CrossRef]
- Zhu, R.; Wong, M.S.; You, L.; Santi, P.; Nichol, J.; Ho, H.C.; Lu, L.; Ratti, C. The effect of urban morphology on the solar capacity of three-dimensional cities. Renew. Energy 2020, 153, 1111–1126. [Google Scholar] [CrossRef]
- Liu, Y. Research on Design Guidance and Control of Solar Energy Utilization in Urban Residential Buildings in Lanzhou. Master’s Thesis, Northwestern Polytechnical University, Xi’an, China, 2020. [Google Scholar]
- Chen, R. Study on the Influence of Residential Morphology on Solar Radiation. Master’s Thesis, Xi’an University of Architecture and Technology, Xi’an, China, 2021. [Google Scholar]
- Wu, Z.; Ren, Y.; Chen, L. Evaluating Urban Geometry Impacts on Incident Solar Radiation on Building Envelopes. Environ. Model. Assess. 2021, 26, 113–123. [Google Scholar] [CrossRef]
- Tian, J.; Xu, S. A morphology-based evaluation on block-scale solar potential for residential area in central China. Sol. Energy 2021, 221, 332–347. [Google Scholar] [CrossRef]
- Wen, T. Study on the Influence of Urban Residential Pattern Layout on Solar Energy Utilization Potential in Xining. Master’s Thesis, Northwestern Polytechnical University, Xi’an, China, 2021. [Google Scholar]
- Boccalatte, A.; Thebault, M.; Ménézo, C.; Ramousse, J.; Fossa, M. Evaluating the impact of urban morphology on rooftop solar radiation: A new city-scale approach based on Geneva GIS data. Energy Build. 2022, 260, 111919. [Google Scholar] [CrossRef]
- Yi, Z.Z. Research on Energy Saving Optimization Design of Space form of Near Zero Energy Residential Area under the Influence of Solar Radiation. Master’s Thesis, Shandong Jianzhu University, Jinan, China, 2023. [Google Scholar]
- Vermeulen, T.; Knopf-Lenoir, C.; Villon, P.; Beckers, B. Urban layout optimization framework to maximize direct solar irradiation. Comput. Environ. Urban Syst. 2015, 51, 1–12. [Google Scholar] [CrossRef]
- Li, D.; Liu, G.; Liao, S. Solar potential in urban residential buildings. Sol. Energy 2015, 111, 225–235. [Google Scholar] [CrossRef]
- Morganti, M.; Salvati, A.; Coch, H.; Cecere, C. Urban morphology indicators for solar energy analysis. Energy Procedia 2017, 134, 807–814. [Google Scholar] [CrossRef]
- Bai, Y. Study on Optimization of Residential form in Cold Regions Based on Solar Energy Utilization Potential. Master’s Thesis, Harbin Institute of Technology, Harbin, China, 2017. [Google Scholar]
- Jiang, N. Solar Potential Assessment of Residential Areas—A Case Study of Wuhan. Master’s Thesis, Huazhong University of Science and Technology, Wuhan, China, 2018. [Google Scholar]
- Aghamolaei, R.; Ghaani, M.R.; Tahsildoost, M.; Zandi, M. A comprehensive energy-oriented approach for optimization of solar potential in urban contexts: An application study for residential districts. Adv. Build. Energy Res. 2019, 13, 205–219. [Google Scholar] [CrossRef]
- Zhang, J.; Xu, L.; Shabunko, V.; Tay, S.E.R.; Sun, H.; Lau, S.S.Y.; Reindl, T. Impact of urban block typology on building solar potential and energy use efficiency in tropical high-density city. Appl. Energy 2019, 240, 513–533. [Google Scholar] [CrossRef]
- Zhang, H. Study on the Relationship between Solar Radiation Utilization and Residential Layout in Lhasa City Collective Housing. Master’s Thesis, Xi’an University of Architecture and Technology, Xi’an, China, 2021. [Google Scholar]
- Shi, J.; Zhou, Y.; Ma, Y.; Zhu, D. Research on Construction and Application of Solar Energy Potential Forecast Model in Residential Areas. Hous. Sci. 2019, 39, 53–58. [Google Scholar]
- Bai, Y.; Ma, T. Experimental study on solar energy utilization potential of building surface in Matao City of Harbin. Shanxi Archit. 2017, 43, 177–179. [Google Scholar]
- Chen, Y. Analysis of Current Situation and Optimization Strategy of Solar Energy Access in Residential Areas of Harbin. Master’s Thesis, Harbin Institute of Technology, Harbin, China, 2016. [Google Scholar]
- Zhang, Y. Study on the Influence of Planning and Layout of High-Rise Residential Areas on Solar Radiation Acquisition in Harbin. Master’s Thesis, Harbin Institute of Technology, Harbin, China, 2019. [Google Scholar]
- Li, C. Spatial Analysis of Photovoltaic Utilization and Its Development Potential in Harbin High-Rise Residential Areas. Master’s Thesis, Harbin Institute of Technology, Harbin, China, 2018. [Google Scholar]
- Zhu, D.; Song, D.; Shi, J.; Fang, J.; Zhou, Y. The Effect of Morphology on Solar Potential of High-Density Residential Area: A Case Study of Shanghai. Energies 2020, 13, 2215. [Google Scholar] [CrossRef]
- Zhu, D.; Song, D.; Shi, J. Effects of Residential District Density Parameters on Solar Potential—A Comparative Study between Beijing and Shanghai. In Proceedings of the 14th International Green Building and Building Energy Efficiency Conference and New Technology and Product Expo, Shenzhen, China, 2 April 2018. [Google Scholar]
- Zhu, D.; Song, D.; Shi, J. Characteristics of Solar Radiation Received from the Outer Surface of High-Density Residential Buildings. In Proceedings of the Fifteenth International Conference on Green and Energy-Efficient Building & New Technologies and Products Expo, Shenzhen, China, 3 April 2019. [Google Scholar]
- Wu, J.; Liang, X.; Yu, B.; Jin, J.; Wang, D. Research on the Application of BP Artificial Neural Network in DSM Comprehensive Evaluation. Green Constr. Intell. Build. 2016, 51–55. [Google Scholar]
- Hao, S. Study on the Influence of Flat Facade Morphology on Solar Radiation Receiving Potential of Building Facade. Master’s Thesis, Northwestern Polytechnical University, Xi’an, China, 2022. [Google Scholar]
- Li, W. Research on the Guidance and Control Indexes for the Morphology Design of Residential Area Based on Solar Energy Acquisition Potential- Take Lhasa City as an Example. Master’s Thesis, Northwestern Polytechnical University, Xi’an, China, 2023. [Google Scholar]
- Compagnon, R. Solar and daylight availability in the urban fabric. Energy Build. 2004, 36, 321–328. [Google Scholar] [CrossRef]


| Morphology Index | Calculation Method | Schematic | Note |
|---|---|---|---|
| Gross Floor Area (GFA) | The sum of the horizontal projections of the buildings on each floor of the site | 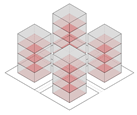 | |
| Floor Area Ratio (FAR) | 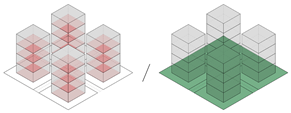 | An important index of construction land use intensity. | |
| Building Density (BD) | 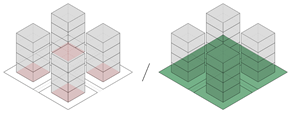 | ||
| Building Orientations (BO) | The front façade of a building, or the direction faced by the main façade of a building. |  | The main façade refers to the south façade where the main rooms are located. |
| Building Height (BH) |  | ||
| Building Surface Complexity (STL) | 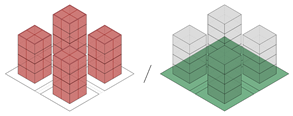 | Indicates the amount of external building surface occupied per unit of site area. | |
| Building Complex Morphology Factor (QTX) | 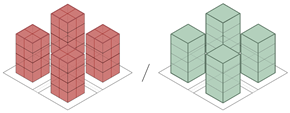 | Similar expressions of the shape coefficient of monolithic buildings at the group level. | |
| Open Space Ratio (OSR) |  | Its value can indirectly reflect the degree of mutual shading of buildings. |
| Potential Index | Calculation Method | Note |
|---|---|---|
| Annual Solar Radiation Amount per Unit External Surface Area (ASU) | (unit: kW·h(m2·a)−1) | ASU refers to the ratio of the solar radiation acquired by the external surface of a single unit or group of buildings to the total external surface area of the building in a year. The larger the value of this performance index, the more efficient the corresponding building complex or building unit is in terms of SRA. The combination of this index and the total amount of solar radiation a building receives in a year provides a more comprehensive picture of a building’s potential to obtain solar radiation throughout the year. |
| Heating Season Solar Radiation Amount per Unit External Surface Area (HSU) | (unit: kW·h(m2·a)−1) | HSU refers to the ratio of the total solar radiation acquired by the external surfaces of a building to the total external area of the building during the duration of the local heating season. Characterize the ability of residential area and building units to obtain solar radiation during the heating season. It is necessary to analyze this index in Lhasa, which is a cold region (climate zone VI) of the building thermal/climatic zoning, with cold winters and large heating demand, and cooler summers without air conditioning and cooling demand. The larger the value of this performance index, the higher the efficiency of SRA for the heating season of the corresponding building complex or building unit. This index combined with the total amount of solar radiation obtained by a building during the heating season provides a more comprehensive picture of a building’s potential for SRA during the heating season. |
| Ratio of Area with Radiation Exceeding 800 to Total External Surface Area (SA800) | The thresholds are based on the PV and solar thermal thresholds proposed by R. Compagnon, which focus on the PV potential of buildings [37]. SA800 refers to the area of the external surface of a building complex or building unit that acquires solar radiation in excess of the 800 threshold in a year as a percentage of the total external area. SS800 refers to the solar radiation acquired by the external surface of a building complex or building element in excess of the 800 threshold in a year as a percentage of the solar radiation acquired by the total annual external surface area. | |
| Percentage of Radiation Exceeding 800 (SS800) |
| (1) | ||||||||
| Number | GFA (m2) | FAR | BD (%) | BO (°) | BH (m) | STL | QTX | OSR |
| 1 | 119,610.50 | 0.87 | 10.60 | −4.3 | 24.41 | 0.84 | 0.320 | 1.023 |
| 2 | 168,630.95 | 1.77 | 14.47 | −4.2 | 40.09 | 1.13 | 0.212 | 0.482 |
| 3 | 297,822.80 | 1.95 | 12.30 | −4.5 | 45.88 | 1.22 | 0.208 | 0.449 |
| 4 | 98,436.38 | 2.95 | 22.33 | −23.3 | 39.67 | 2.22 | 0.251 | 0.263 |
| 5 | 33,268.30 | 1.04 | 17.45 | 0.5 | 15.00 | 0.79 | 0.255 | 0.795 |
| 6 | 16,329.49 | 2.08 | 23.14 | 0.5 | 27.00 | 1.53 | 0.244 | 0.369 |
| 7 | 47,558.15 | 1.02 | 25.44 | 0.0 | 12.00 | 0.93 | 0.306 | 0.733 |
| 8 | 28,652.81 | 1.25 | 32.68 | 0.0 | 11.50 | 1.07 | 0.285 | 0.537 |
| 9 | 37,045.13 | 0.88 | 21.98 | 0.0 | 12.00 | 0.90 | 0.340 | 0.888 |
| 10 | 21,149.48 | 1.04 | 26.07 | 0.0 | 12.00 | 1.08 | 0.345 | 0.709 |
| (2) | ||||||||
| Number | ASU (kW·h(m2·a)−1) | HSU (kW·h(m2·a)−1) | SA800 | SS800 | ||||
| 1 | 687.13 | 263.78 | 0.377 | 0.738 | ||||
| 2 | 673.43 | 248.09 | 0.357 | 0.696 | ||||
| 3 | 667.31 | 263.17 | 0.362 | 0.684 | ||||
| 4 | 613.83 | 213.96 | 0.262 | 0.586 | ||||
| 5 | 903.74 | 328.12 | 0.475 | 0.766 | ||||
| 6 | 829.33 | 300.98 | 0.444 | 0.723 | ||||
| 7 | 949.23 | 338.64 | 0.472 | 0.790 | ||||
| 8 | 968.44 | 328.14 | 0.433 | 0.759 | ||||
| 9 | 890.41 | 310.83 | 0.424 | 0.778 | ||||
| 10 | 868.73 | 302.04 | 0.418 | 0.801 | ||||
| Morphology | Experimental Parametric Scenarios |
|---|---|
| Residential Area Matrix | 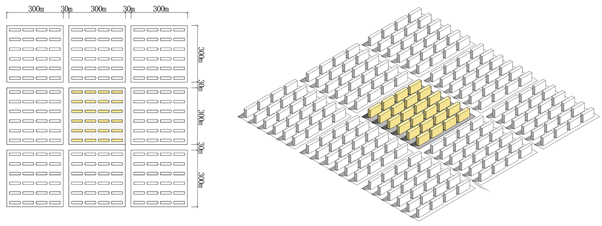 |
| Building Layout | 1 Row layouts |
2 Vertical Staggered Layouts | |
3 Horizontal Staggered Layouts | |
| Building Height |  |
| Building Orientation | 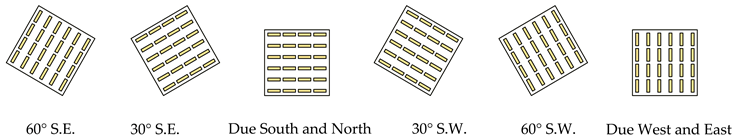 |
Disclaimer/Publisher’s Note: The statements, opinions and data contained in all publications are solely those of the individual author(s) and contributor(s) and not of MDPI and/or the editor(s). MDPI and/or the editor(s) disclaim responsibility for any injury to people or property resulting from any ideas, methods, instructions or products referred to in the content. |
© 2024 by the authors. Licensee MDPI, Basel, Switzerland. This article is an open access article distributed under the terms and conditions of the Creative Commons Attribution (CC BY) license (https://creativecommons.org/licenses/by/4.0/).
Share and Cite
Song, G.; Liu, Y.; Li, W.; Tan, J.; Cho, S. Comprehensive Comparative Analysis of Morphology Indexes for Solar Radiation Acquisition Potential in Lhasa Urban Residential Area. Sustainability 2024, 16, 4893. https://doi.org/10.3390/su16124893
Song G, Liu Y, Li W, Tan J, Cho S. Comprehensive Comparative Analysis of Morphology Indexes for Solar Radiation Acquisition Potential in Lhasa Urban Residential Area. Sustainability. 2024; 16(12):4893. https://doi.org/10.3390/su16124893
Chicago/Turabian StyleSong, Guorui, Yu Liu, Wenqiang Li, Jingbo Tan, and Seigen Cho. 2024. "Comprehensive Comparative Analysis of Morphology Indexes for Solar Radiation Acquisition Potential in Lhasa Urban Residential Area" Sustainability 16, no. 12: 4893. https://doi.org/10.3390/su16124893
APA StyleSong, G., Liu, Y., Li, W., Tan, J., & Cho, S. (2024). Comprehensive Comparative Analysis of Morphology Indexes for Solar Radiation Acquisition Potential in Lhasa Urban Residential Area. Sustainability, 16(12), 4893. https://doi.org/10.3390/su16124893